63

J. JAMES EXONGOVERNOR
DEPARTMENT OF LABORBox 94600, Slate House Station
Lincoln, Nebraska 68509
December 31, 1975
The Honorable J. James ExanGovernor of Nebraskal i nco 1n. Nebraska
GERALD E. CHIZEKCO_lSSlo..ER O~ ~"'IOR
J. James ExonGovernor
Gerald E. ChizekCommissioner
Dear Governor Exan:
In accordance with the Nebraska Employment Security Law, I submit toyou this 38th Annual Report of the Nebraska Deparbnent of Labor, Oivisionof Employment for activities during the period from July 1, 1974.through June 30. 1975.
This Annual Report sunrnar;zes the nature. scope and COst of administeringthe Employment Security Law and of implementing Job Service programsdirected toward the placement of applicants ;n productive employment.
We, in the Oivision of Employment. recognize stable and gainful employment 1S essential to a vital and growing economy for Nebraska. Wepledge full support and cooperation in achieving effective administration to this end.
;c:~~~s;;:~'/~~C~~c-
C0ll1111 ss1oner of r:{bor
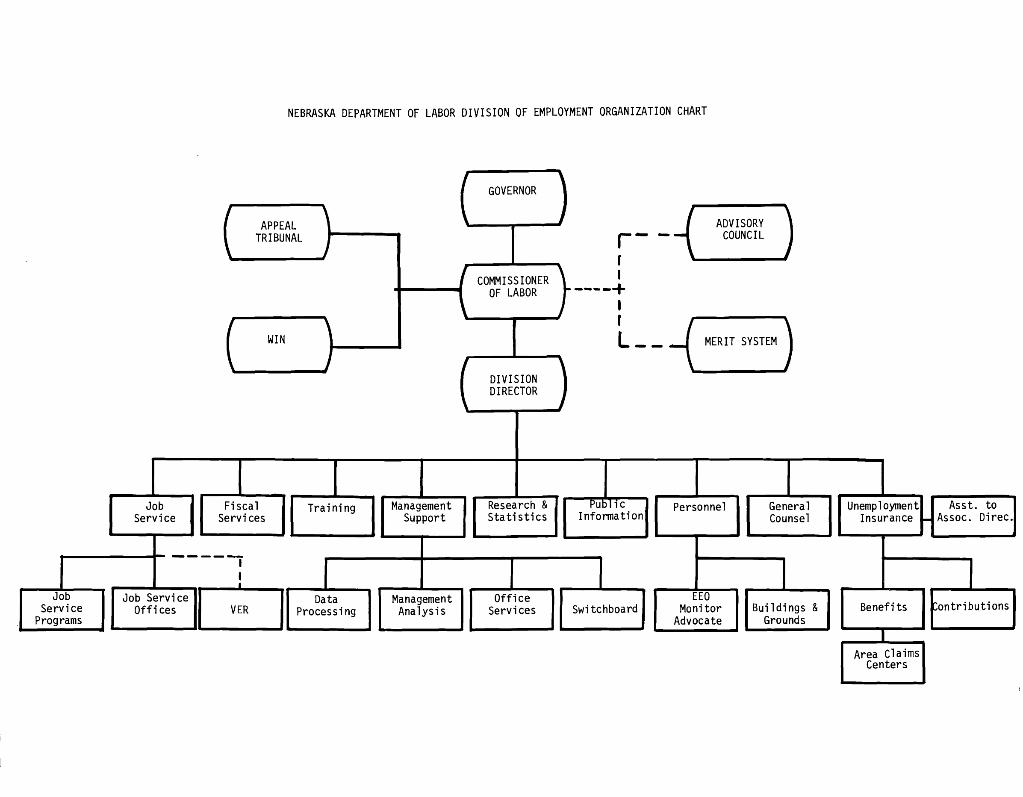
NEBRASKA DEPARTMENT OF LABOR DIVISION OF EMPLOYMENT ORGANIZATION CHART
GOVERNOR
APPEAL ADVISORYTRIBUNAL r- - COUNCIL
fCOMMISSIONER I
OF LABOR .......'--+I
~ }----JIL__ MERIT SYSTEM
DIVISIONDIRECTOR
JobService
IFiscal
Services
1Training Management
SupportResearch &Sta ti sti cs
Pub11CInformation
Personnel GeneralCounsel
unemP10ymentU Asst. toInsurance Assoc. Direc.
DataProcessing
IJob
ServicePrograms
----,I
Job Servi ceI~Offices VER
I ,
ManagementAnalysis
OfficeServices
1Swi tc hboa rd
EEOMonitor
Advocate
1Buil di ngs &
GroundsBenefits
IArea Claims
Centers
1~ontributions

OFFICE OF THE COMMISSIONER
A Governor's appointee, Commissioner Gerald Chizek continued to carry outhis administrative responsibilities as out1"ined in the Nebraska EmploymentSecurity Staff.
Two functions within the Division carried out policies and procedures underhis direction. Those included the Work Incentive Program (WIN) and theNebraska Appeal Tribunal.
NEBRASKA APPEAL TRIBUNAL
The function of the Nebraska Appeal Tribunal is to provide an impartialhearing for the adjudication of disputed unemployment insurance claims.Written decisions are rendered, either affirming or reversing the initialdeterminations of claims deputies.
During fiscal year 1975, 1,372 appeals were filed with the Nebraska AppealTribunal. These included 1,022 Nebraska-liable appeals and 350 interstateappeals. The 1,022 Nebraska appeals represented a 52 percent increase overthe 673 appeals filed in the previous fiscal year. A total of 1,306 caseswere.dis~osed of.
The Tribunal rendered 955 decisions on Nebraska appeals, compared to 470decisions for the previous fiscal period---a 103 percent increase in casedispositions. The determination of the deputy was affirmed in 682 or 71percent of those cases (compared to a 67 percent affirmance rate for fiscalyear 1974). Four decisions were rendered under the Unemployment Compensationfor Federal Employees (UCFE) program, along with eight decisions on Unemployment for Ex-Servicemen (UCS) claims. The Tribunal also ruled on three Disaster Unemployment Assistance (DUA) appeals, nineteen Special UnemploymentAssistance (SUA) appeals, and one Work Incentive Program (WIN) appeal.
NEBRASKA APPEAL TRIBUNAL
Pa tri ck W. Ash, Cha i nnan
APPEALSREFEREES
Lynn Marie Corbeil
Edward W. Hasenjager
EMPLOYERS'REPRESENTATIVES
Frank J. WearOmaha
R. A. FreemanYork
-1-
EMPLOYEES'REPRESENTATIVES
Charles M. McNeilOmaha
Lloyd T. WorleyLincoln

THE WORK INCENTIVE PROGRAM (WIN)
The Work Incentive Program was created by the 1967 Amendments to the SocialSecurity Act. The progra.m was further amended in December 1971 - TalmadgeAmendments. The program operated to assist individuals receiving publicassistance in securing employment through the use of On-the-Job-Training,direct placement, employer tax credits and Public Service Employment. Byobtaining employment, participants' welfare grants should be reduced oreliminated.
The WIN Program in Nebraska functioned in twelve counties. In Fiscal Year1975, 692 welfare recipients obtained employment through the WIN Program.
-2-

ADMINISTRATIVE STAFF
Division Director Vern D. Ma101epszy carried out his responsibilities withthe assistance of his Administrative Staff. Administrative Staff officersprovided support services to the Job Service and the Unemployment InsuranceService. Each of those services represented a specialized function asreported in the pages to follow.
FISCAL SERVICES
The cost of administering the Nebraska Employment Security Law for the FiscalYear ending June 30, 1975, amounted to $6,856,025. These funds were madeavailable to the Nebraska Division of Employment through provisions of TitleIII of the Social Security Act. To administer other Federal programs assignedto the Nebraska Division of Employment an additional amount of $708,537 wasobligated; for programs such as Food Stamps, Work Incentive Program (WIN),Manpower Operational Data System (MODS), Manpower Training Services (MTS),Job Corps, Disaster Relief, and Migrant Farm Services. Other administrativeobligations in the amount of $681,187 were for state reimbursable contracts,such as Comprehensive Employment Training Act (CETA), Comprehensive ManpowerProgram (CMP), Public Service Employment (PSE), and Emergency Employment Act(EEA). The table, "Administrative Obligations Allocated by Category of Expense,'1 shows the cost of administration by program.
FISCAL MANAGEMENT:
The Fiscal Services Section of the Nebraska Division of Employment preparedand maintained the annual budgets required to finance agency administrationfrom Federal Fund Sources. The budgets were reviewed by the Manpower Administration, U. S. Department of Labor, for the purpose of determining theamounts of grants to the Division.
The Fiscal Services Section managed and controlled the expenditure of grantedfunds to insure proper and efficient usage of administrative financing. Thereceipt and expenditure of granted funds were examined by Federal auditorson a regular basis.
-3-
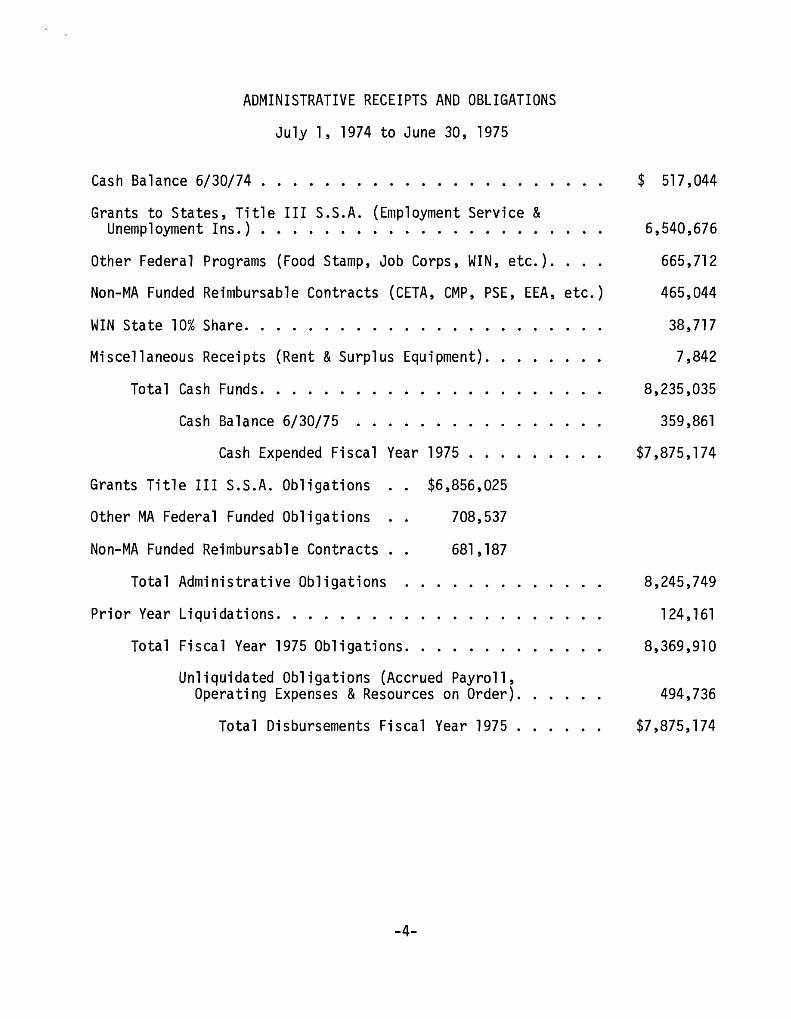
ADMINISTRATIVE RECEIPTS AND OBLIGATIONS
July 1, 1974 to June 30, 1975
Cash Balance 6/30/74 .
Grants to States, Title III S.S.A. (Employment Service &Unemp1oymentIns.) . . . . . . . . . . . . . . . . . .
Other Federal Programs (Food Stamp, Job Corps, WIN, etc.) ..
Non-MA Funded Reimbursable Contracts (CETA, CMP, PSE, EEA, etc.)
WIN State 10% Share..
Miscellaneous Receipts (Rent &Surplus Equipment) ..
Total Cash Funds.
Cash Balance 6/30/75
Cash Expended Fiscal Year 1975 .
$ 517,044
6,540,676
665,712
465,044
38,717
7,842
8,235,035
359,861
$7,875,174
Grants Title III S.S.A. Obligations $6,856,025
Other MA Federal Funded Obligations 708,537
Non-MA Funded Reimbursable Contracts.. 681,187
Total Administrative Obligations 8,245,749
Prior Year Liquidations .
Total Fiscal Year 1975 Obligations ..
Unliquidated Obligations (Accrued Payroll,Operating Expenses &Resources on Order) ..
Total Disbursements Fiscal Year 1975 .
-4-
124,161
8,369,910
494,736
$7,875,174
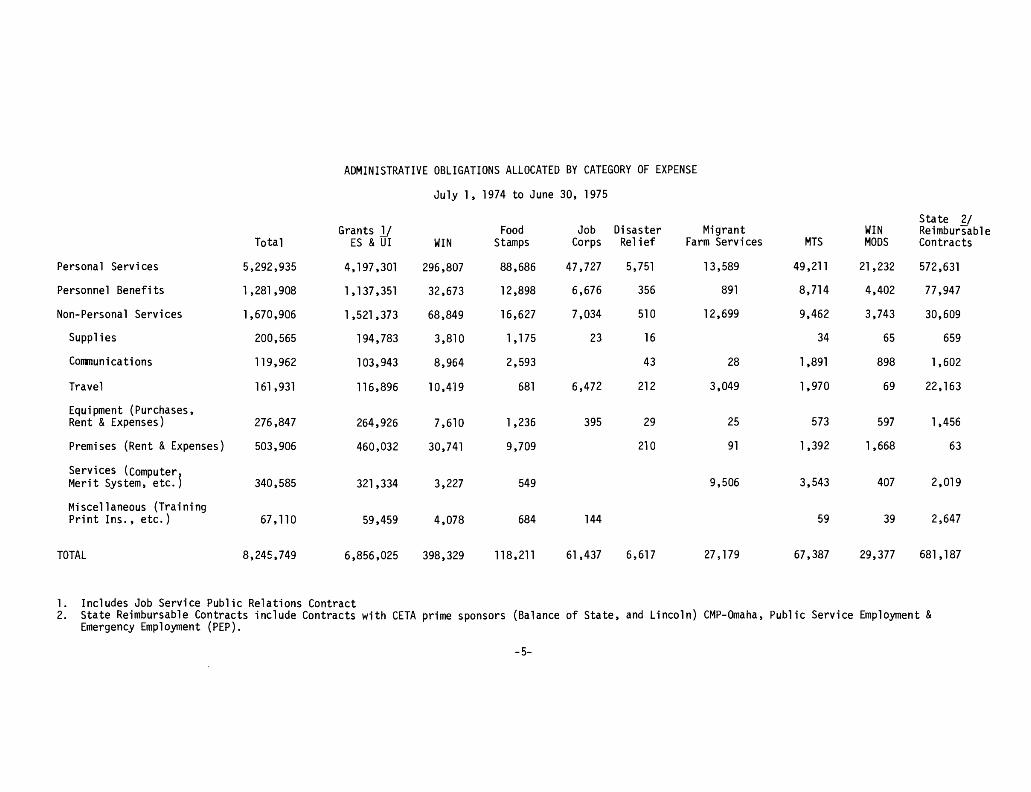
ADMINISTRATIVE OBLIGATIONS ALLOCATED BY CATEGORY OF EXPENSE
July 1, 1974 to June 30, 1975
State 2/Grants 1/ Food Job Disaster Migrant WIN Reimbursable
Total ES &ITI WIN Stamps Corps Relief Farm Services MTS MODS Contracts
Personal Services 5,292,935 4,197,301 296,807 88,686 47,727 5,751 13,589 49,211 21,232 572,631
Personnel Benefits 1,281,908 1,137,351 32,673 12,898 6,676 356 891 8,714 4,402 77,947
Non-Personal Services 1,670,906 1,521 ,373 68,849 16,627 7,034 510 12,699 9,462 3,743 30,609
Supplies 200,565 194,783 3,810 1,175 23 16 34 65 659
COrTJ11unications 119,962 103,943 8,964 2,593 43 28 1,891 898 1,602
Travel 161,931 116,896 10,419 681 6,472 212 3,049 1,970 69 22, 163
Equipment (Purchases,Rent &Expenses) 276,847 264,926 7,610 1,236 395 29 25 573 597 1,456
Premises (Rent &Expenses) 503,906 460,032 30,741 9,709 210 91 1,392 1,668 63
Services (Computer,Merit System, etc.) 340,585 321,334 3,227 549 9,506 3,543 407 2,019
Miscellaneous (TrainingPrint Ins., etc.) 67,110 59,459 4,078 684 144 59 39 2,647
TOTAL 8,245,749 6,856,025 398,329 118,211 61,437 6,617 27,179 67,387 29,377 681,187
1. Includes Job Service Public Relations Contract2. State Reimbursable Contracts include Contracts with CETA prime sponsors (Balance of State, and Lincoln) CMP-Omaha, Public Service Employment &
Emergency Employment (PEP).
-5-
EQUAL EMPLOYMENT OPPORTUNITY REPRESENTATIVE
The position of Equal Employment Opportunity Representative was established inorder to ensure that the Nebraska Department of Labor is in compliance withTitles VI and/or VII of the Civil Rights Act of 1964, the Age Discriminationin Employment Act of 1967, the Equal Pay Act of 1963, and other departmentalpolicies relating to nondiscrimination.
In order to ensure that the Nebraska Department of Labor is in compliance, theEqual Employment Opportunity Representative will:
1. Review all Federal and State civil rights laws and departmentalissuances and ensure that each local office has copies forreference.
2. Ensure that all staff members are thoroughly trained in theapplication of their responsibilities regarding such lawsand regulations.
3.. Ensure that employers are not being serviced contrary tothe law.
4. Ensure that the local offices are in full compliancewith all civil rights laws and policies.
5. Ensure, through the process of the State Plan of Service,that there are specific plans for carrying out a statewide policy of equal opportunity in all operations.
The Equal Employment Opportunity Representative will ensure that all applicantsare provided a full range of available manp~wer services regardless of race,color, sex, religion, age, national origin, creed, or physical impairment.
-6-
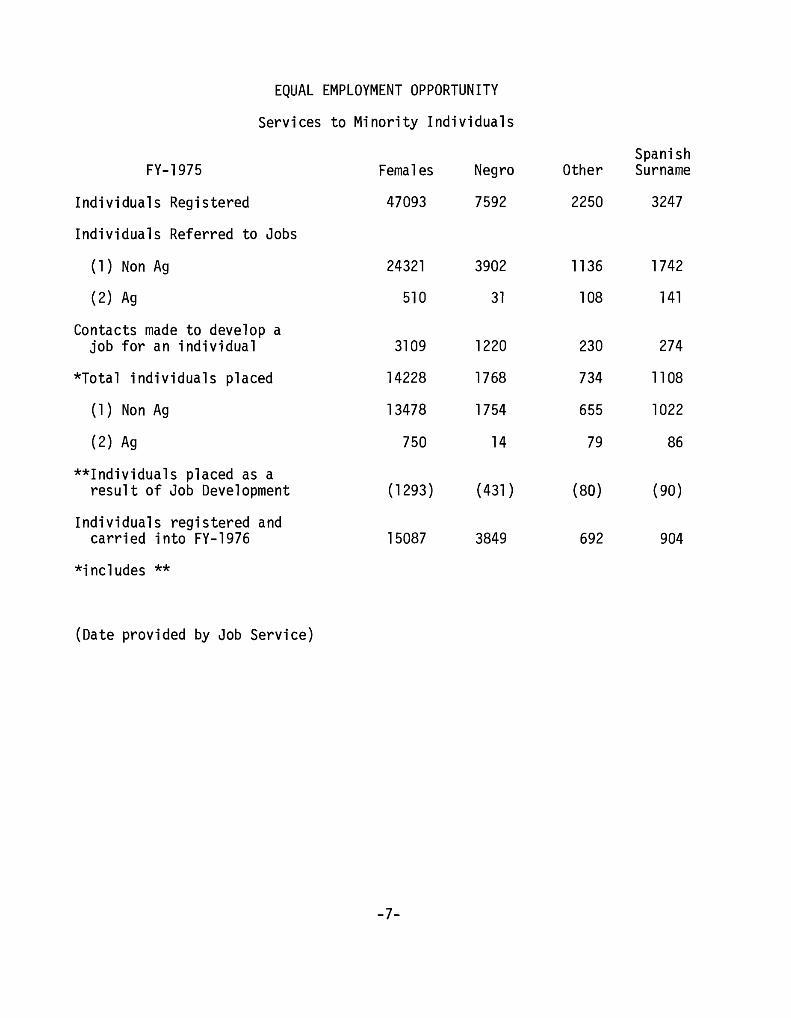
EQUAL EMPLOYMENT OPPORTUNITY
Services to Minority Individuals
SpanishFY-1975 Females Negro Other Surname
Individuals Registered 47093 7592 2250 3247
Individuals Referred to Jobs
(1 ) Non Ag 24321 3902 1136 1742
(2) Ag 510 31 108 141
Contacts made to develop ajob for an individual 3109 1220 230 274
*Total individuals placed 14228 1768 734 1108
(1) Non Ag 13478 1754 655 1022
(2) Ag 750 14 79 86
**Individuals placed as aresult of Job Development (1293) (431) (80) (90)
Individuals registered andcarried into FY-1976 15087 3849 692 904
*includes **
(Date provided by Job Service)
-7-

MONITOR/ADVOCATE
The position of Monitor/Advocate resulted from Civil Action No. 2010-72, NAACP,Western Region, et. a1., vs. Peter J. Brennan. The court ordered that "eachstate agency must establish such a position by July 1, 1974."
The Monitor/Advocate is to provide control points and linkages so as to facilitate directive implementation and better communication within the overallsystem.
The Monitor/Advocate has the authority to negotiate and resolve complaintsreceived in the State Office and to oversee the complaint and monitoringsystems in order to ensure smooth and effective functioning. When the systemappears not to be functioning properly or where more coordination with otherenforcement agencies is necessary, the Monitor/Advocate will arrange to resolvethese problems.
The Monitor/Advocate will ensure that adequate steps are taken to provideall applicants with a full range of available manpower services.
GENERAL COUNSEL
The District courts received appeals on nineteen new benefit decisions duringfiscal year 1975. Two court appeals were disposed of during the year. Onecase was dismissed by the court, and in the other case, the decision of theAppeal Tribunal was reversed.
ADVISORY COUNCIL:
During the fiscal year 1975, one official Advisory Council meeting was held.Legislation was discussed at this meeting. Recommendations were made toraise the maximum weekly benefit amount and to extend coverage to full-timestudents who work full-time.
STATE ADVISORY COUNCIL
PUBLIC
Rev. Austin E. MillerOmaha
Mrs. Belle KeitgesLincoln
MANAGEMENT SUPPORT
INDUSTRY
Cal JohnsonHastings
Simon KorshojBlair
LABOR
Dean Koc"j naOmaha
William E. BrennanOmaha
This section is composed of Data Processing, Management Analysis, Supply,Reproduction and Communication Services, and Records Management.
-8-

PERSONNEL
The Nebraska Department of Labor, Division of Employment maintains a PersonnelUnit consisting of a Personnel Officer and staff with overall functions pertaining to personnel policies, programs and procedures, retirement, life insurance, disability insurance, leave records, personnel performance evaluations,recruitment and other related functions.
The Division is a Merit System agency and must abide by all Merit Systemregulations.
The number of employees as of June 30, 1975, are indicated in the table below:
Employees as of June 30, 1975:
Permanent and Probationary 488
Provisional 5
Exempt 55
Temporary and Intermittent 192
As of the above mentioned date, the Division of Employment, Personnel Unitmaintained records for 740 employees.
PUBLIC INFORMATION OFFICE
Communication with the public through the media was carried out through theAgency·s Public Information Officer. The main function of this unit was toinform the public about services, programs, and policies of the Agency as itaffected jobseekers and the jobless.
The main thrust of Public Information activity during the 1975 Fiscal Yearwas the Job Service Public Communications Project. Nebraska was selected asone of fifteen states to pilot a multimedia approach to increasing both thequality and quantity of placements and job orders. Through close coordinationwith the Job Service administrator, multimedia messages for radio and television were developed to portray Nebraska Job Service as a major source ofjobs and good employees. In addition, newspaper and magazine layouts wereused to carry the same message to employers and applicants around the state.The campaign was conducted in each Nebraska city where a Job Service office islocated. Through this project, more people became aware of Job Service and whatit might do for them.
-9-

In addition to the Job Service Public Communications Project, the Public I.lformation Office also assisted the Unemployment Insurance Service in publicizingspecial unemployment compensation programs created to meet rising joblessness,specifically, SUA, Extended Benefits, and the Federal Supplemental Benefitsprogram. UIS staff were interviewed in radio and television public servicet -j me secured by the Pub1i c Informa t ion Offi cer.
The Unit continued to fill a number of ongoing responsibilities such as preparation of Agency publications including a monthly employee newsletter; theAnnual Report of the Division; and other printed material. Upon request,the Public Information Officer made talks in schools and before communitygroups to explain the role of the Division in Nebraska.
-10-
RESEARCH AND STATISTICS
Manpower research depends on the use of carefully coordinated and compatibleinformation. The Research and Statistics section conducts programs of datacollection, compilation, analysis and dissemination. This data assistsmanagement in the public and private sectors in programs for the developmentof realistic staffing patterns for the future and the maximum of utilizationof manpower resources. Such data also provides guidance and support for budgeting. The prime objective of the section is to act as the hub of manpowerinformation and analysis in support of the Agency's policies and programs.The research output has general applicability to external users--businessestablishments discharging the responsibility for affirmative action programs,industrial development and marketing research organizations, educationalinstitutions, community and industrial planning organizations, and the pUblic.
The Research and Statistics section is the official source of monthly unemployment and employment statistics for the State of Nebraska and areas within thestate. Unemployment estimates are a primary criteria for the designation ofareas within the state for special treatment and consideration under a numberof Federal programs. The section has been involved in the projection of statemanpower needs, both industrial and occupational. It also interacts with thepublic and private sectors on proposed law, regulation, and policy in relationship to quality and availability of manpower.
The unemployment insurance process supplies data crucial to manpower research.Claimants filing for unemployment insurance and employers reporting on thestatus of their work force and wages paid reflect the structure and behaviorof state and local labor markets. The analysis of such data projects changesin population, labor force trends, migration, and urban concentration. Jobseparations are analyzed to sort out those that appear to be temporary, asopposed to permanent. This information assists the Division and localitiesaffected in assessing priorities and services needed to develop human resources.
Nebraska's civilian labor force average for Fiscal Year 1975 was estimated at721,000, up 20,000 workers or 2.9 percent over Fiscal Year 1974. Unemploymentclimbed to 35,100 in fiscal year 1975, up 10,300 or about 41.5 percent higherthan in the prior fiscal year. The unemployed-to-labor-force ratio averaged4.9 percent for fiscal year 1975 compared to 3.5 for fiscal year 1974. Totalemployment rose to 685,900 in 1975, an increase of 9,700 or 1.4 percent abovefiscal 1974. Detailed information on labor force and work force appears ontables in this report.
-11-

EST I MAT E 0 NEBRASKA LAB 0 R FOR C E
For Fiscal Years Ended June 30, 1974 and 1975
Fiscal Year Fiscal Year 1/Industry 1975 1974 - Change
Average Average Amount Percent
Total Civilian Labor Force 721,000 701,000 20,000 2.9Unemployment 35,100 24,800 10,300 41.5
Unemployment Rate 4.9 3.5 xxx xxxTotal Employment 685,900 676,200 9,700 1.4
Agricultural Employment 91,700 90,500 1,200 1.3All Other Nonagricultural Employment ~ 72,000 71,300 700 1.0Nonagricultural Wage &Salary Employment * 522,200 514,400 7,800 1.5
Nonagricultural Wage &Salary Employment ** 555,000 545,900 9,100 1.7Manufacturing 88,900 92,400 - 3,500 - 3.8Mining 1,700 1,700 0Construction 29,500 30,100 - 600 - 2.0Transportation, Communication &Utilities 40,100 40,200 - 100 - 0.2Trade 142,500 139,900 2,600 1.9Finance, Insurance &Real Estate 34,300 32,800 1,500 4.6Services 99,400 96,500 2,900 3.0Government 3/ 118,600 112,300 6,300 5.6
1/ Revised to 1974 benchmark.2/ Includes self-employed, unpaid family workers and domestic workers in private households.3/ Includes all enterprises and utilities operated by governmental agencies including public educational- facilities.* Labor Force** Work Force
-12-
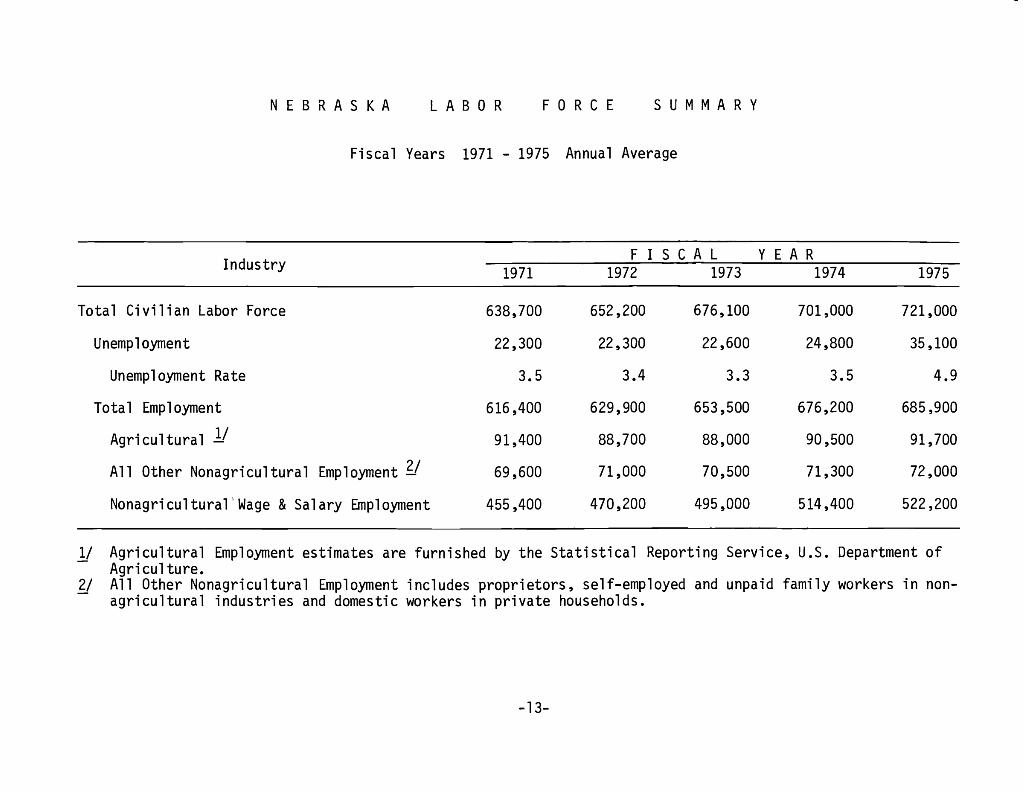
NEB R ASK A LAB 0 R FOR C E SUM MAR Y
Fiscal Years 1971 - 1975 Annual Average
Industry F I S CAL YEA R1971 1972 1973 1974 1975
Total Civilian Labor Force 638,700 652,200 676,100 701,000 721,000
Unemployment 22,300 22,300 22,600 24,800 35,100
Unemployment Rate 3.5 3.4 3.3 3.5 4.9
Total Employment 616,400 629,900 653,500 676,200 685,900
Agricultural 11 91,400 88,700 88,000 90,500 91,700
All Other Nonagricultural Employment 2/ 69,600 71,000 70,500 71,300 72,000
Nonagricu1tura1'Wage &Salary Employment 455,400 470,200 495,000 514,400 522,200
1/ Agricultural Employment estimates are furnished by the Statistical Reporting Service, U.S. Department of- Agriculture.2/ All Other Nonagricultural Employment includes proprietors, self-employed and unpaid family workers in non- agricultural industries and domestic workers in private households.
-13-
STAFF DEVELOPMENT AND TRAINING
Continuing education and training for Agency staff in various job assignmentswas provided through the Training Office. The Division maintained a fu11time Training Officer and Training Assistant for carrying out inservice andoutservice training. Among programs offered were Basic Interviewer Training;Entry Orientation; UI Activity Training; and Basic Supervision.
The Training Office also coordinated outservice staff training for thosetraveling to special sessions related to program activities. The total aim ofall training was to provide increased knowledge and professional advancementfor Agency staff members at all levels of the organization. More specificinformation on exact programs offered and the number of individuals servedcan be obtained from the Training Officer.
-14-
APPRENTICESHIP TRAINING
The Nebraska Job Service cooperates with the Bureau of Apprenticeship andTraining through the local Apprenticeship Committees to maintain current information on available training openings.
Job Service applicants may be given information on available training openingsthrough Apprenticeship Committees. If an applicant is interested in apprenticeship training, Job Service Offices do preliminary screening and testingto determine eligibility for applying to the Apprenticeship Committee fortraining openings.
COMPREHENSIVE EMPLOYMENT &TRAINING ACT - CLASSROOM TRAINING
The Comprehensive Employment &Training Act provided manpower training to theunskilled and semi-skilled at the State level. During Fiscal Year 1975,close to 800 persons were enrolled in CETA Classroom Training.
Four CETA training facilities at Lincoln, North Platte, Grand Island/Hastings,and Norfolk offered individualized vocational training and remedial educationas well as counseling and other supportive services. Most centers had fu11time Job Service staff located on-site to aid in counseling, placement, processing allowance payments for the trainees, and follow-up services.
CETA Classroom Training referrals were in these training areas: Nurse Assistant, Electrician, P1unlber, Business/Clerical, Building Maintenance, AutoMechanics, Machine Technology, Welding, Building Trades, and Sales &InventoryContro1.
CETA - ON-THE-JOB TRAINING
The Nebraska Job Service administered an On-The-Job Training Program throughfunds obtained from the Comprehensive Employment and Training Act during the1975 Fiscal Year. During that time 202 contracts were written with employers.A total of 284 individuals were placed in training under those contracts.
Training sub-contracts were written with employers unable to locate skilledindividuals to fill available job openings.
Under this program, employers were reimbursed to compensate for the additionalexpense of working"with untrained employees. Employers were then encouragedto give untrained individuals a chance to become employable and learn skills.
Various types of training skills may be covered through this program. Contracts can be negotiated with employers according to needs.
COUNSELING
During the Fiscal Year 1975, 6,867 individuals received employment counseling
-15-
from the Job Service. Employment counselors work with applicants in an attemptto help them gain better self-understanding and knowledge of the world of work.Applicants may more realistically choose, change, or adjust to vocations as aresult of such counseling. Referrals to other supportive agencies were accomplished for 1,086 individuals. After counseling, 2,018 were placed on jobs.
JOB CORPS
The Job Corps Program provides an opportunity for disadvantaged youths 16through 21 years of age to obtain job training and further education. NebraskaJob Service recruited, screened, and referred prospective candidates to JobCorps. Post-training services to graduates included job development, placement, counseling, and referrals to other training opportunities. Programsoffered in Job Corps continued to be upgraded and included several unionsponsored courses such as Carpentry, Construction Equipment Operator, Painting, Welding, and Railway-Airline Clerk.
A total of 250 young people were enrolled in training during the 1975 FiscalYear. Of those, 188 were male and 62 were female. One hundred fifty-twoformer Corps members were placed on jobs and 64 were enrolled in further training programs. The placement rate for FY 1975 was 91%.
Service To Veterans
PLACEMENT ACTIVITY FOR VETERANS--FY 175
Total veterans placed
Percent of veterans available
Total Vietnam-era veterans placed
Percent of Vietnam-era veterans available
Total Handicapped veterans placed
Percent of Handicapped veterans available
5101
26.1 %
3157
26.3%
761
28%
The increase in educational assistance to veterans and poor economic conditionshave spurred many jobless veterans to consider education as a viable alternative to immediate employment. This has helped the unemployment picture forveterans and has changed the makeup of veterans seeking employment.
All veterans continue to receive preference in referral to training and jobopenings in all local Job Service offices. Because the number of job orders
-16-
declined this year, Job Service offices increased subtantially special jobdevelopment efforts for veterans.
A special Veterans Employment Representative training session was conductedfor representatives from each local office. Topics discussed at the meetingincluded legislation and its effect on veterans; placement of disabled veterans;reemployment rights information; job development techniques; and an overviewof future goals for the veterans employment program. Each local office VeteransEmployment Representative uses a variety of methods for promoting placement ofveterans. Among these are: close follow-up of recently separated veterans;radio announcements; monthly newsletters; employer visits; and contacts withlocal veterans' organizations.
JOB INFORMATION SERVICE
The Job Information Service is a "self-screen and select" procedure extendedto job ready job seekers. They view current job openings on the microficheand select choices. In a mini-interview additional information and referralto job openings for which a preference is shown result. This method givesthe job seeker faster service and access to the full range of current jobopenings.
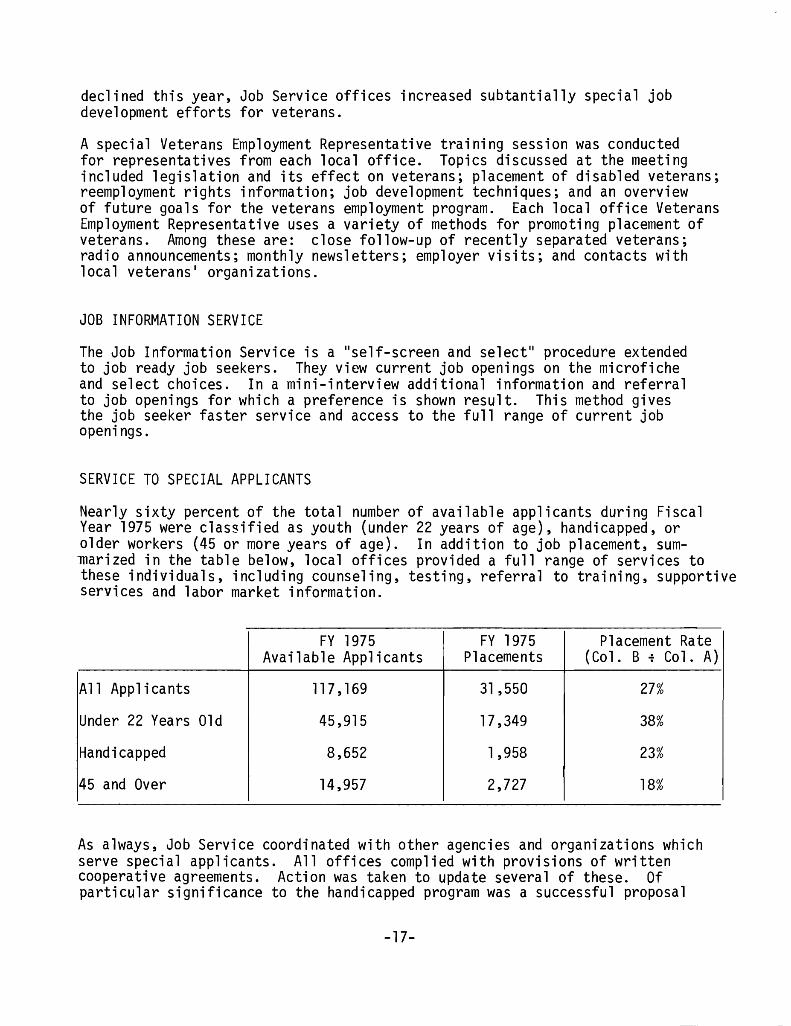
SERVICE TO SPECIAL APPLICANTS
Nearly sixty percent of the total number of available applicants during FiscalYear 1975 were classified as youth (under 22 years of age), handicapped, orolder workers (45 or more years of age). In addition to job placement, sum-~arized in the table below, local offices provided a full range of services totnese individuals, including counseling, testing, referral to training, supportiveservices and labor market information.
FY 1975 FY 1975 Placement RateAvailable Applicants Placements (Co1. B .; Co1. A)
All Applicants 117 , 169 31 ,550 27%
Under 22 Years Old 45,915 17,349 38%
Handicapped 8,652 1,958 23%
45 and Over 14,957 2,727 18%
As always, Job Service coordinated with other agencies and organizations whichserve special applicants. All offices complied with provisions of writtencooperative agreements. Action was taken to update several of these. Ofparticular significance to the handicapped program was a successful proposal
-17-

to CETA for funds to grant independent status to the Nebraska Governor1s COITImittee on Employment of the Handicapped. Job Service also helped recognizeindividual achievements by submitting nominations for numerous awards sponsored by veterans I groups as well as others.
In order to increase public awareness, Job Service participated in the observance of National Employ the Handicapped Week in October and National Employthe Older Worker Week in March. Local offices promoted the employment of youthby emphasizing work experience and training programs, by assisting employersin the recruitment of summer workers, and by sharing vocational informationwith schools, through formal presentations and the distribution of literature.
Most Job Service training sessions conducted during Fiscal Year 1975 includeddiscussion of techniques useful to agency personnel in serving special applicants.
EMPLOYER SERVICES
The Employer Services program was aided by the inception of a project calledthe Job Service Improvement Program (J.S.I.P.). The project was piloted inthe Grand Island Job Service Office area. Plans for expansion to other JobService Office communities were laid out for the next Fiscal Year. UnderJSIP a con~ittee of local employers critique the delivery of services by aJob Service office. A local office task force responds to those comments andmakes procedural changes necessary for better service.
In addition to J.S.I.P., communication between employers and the Job Servicewas continued through Employer Service Representatives. Nebraska EmployerService Representatives made 12,611 on-site employer visits and 9,023 promotional telephone calls in fiscal year 1975. Greater emphasis was placed oncommunicating with and serving employers, while the overall objective was tosecure more and better quality job orders for applicants. There was also anincreased effort to make Job Service a "labor exchange" for meeting employerand applicant needs more effectively.
A special Employer Service Representative1s training session was held to review goals and objectives of the program. New techniques for working withemployers were presented. The "Account Executive Approachl/ was introduced tolocal office staff. Its use was encouraged where feasible. This approachpromotes ongoing and regular contact with employers by assigning a designatedgroup of employers to staff. Each staff member was shown how to work with hisor her I/accounts."
TESTING AND TEST DEVELOPMENT
During Fiscal Year 1975, a total of 9,491 tests were administered to 6,508people. Included in the total number of tests given were 3,674 GeneralAptitude Test Batteries (GATB) and 3,088 Clerical Skills Tests.
-18-
Research was done on three jobs as part of the national Specific Aptitude TestBattery revalidation program. Data collection was completed on a project todevelop new subtests for the Nonreading Aptitude Test Battery.
FOOD STAMP PROGRAM
During the last fiscal year, 10,259 Food Stamp recipients made application tothe Job Service. Of those applicants, 1,319 placement transactions were made;837 individuals were placed in employment; and 1,678 in~ividuals did not cooperate with the Job Service. 1 The Food Stamp Act, passed in 1971, mandated allable-bodied Food Stamp recipients register for work with the Job Service unless exempted by special provisions of the Act. Job Service has worked withthe Nebraska Department of Public Welfare to carry out the Food Stamp policy.
RURAL MANPOWER SERVICE
The Rural Manpower Service, a special function within the Job Service, providedassistance to residents of rural Nebraska as equally as possible in comparison with services offered to urban areas. Various employment-related programswere offered in rural areas by the Concerted Services Program, the RuralEmployability Service, and regular outreach services.
The Concerted Services Program was designed as an interdepartmental programsponsored by the Departments of Labor; Agriculture; Health, Education, andWelfare; Housing and Urban Development; and Commerce. Concerted Servicesprogram was established to improve the general education level of residentsin rural counties thus making those counties more attractive to industry.The original concept was changed to include most areas of community development. Community involvement became an important part of the program. Duringthe 1975 Fiscal Year, the Concerted Services Program was operated in Butler,Seward and Saline Counties.
Rural Employability Service. (R.E.S.)
The Rural Employability Service program was established jointly by theNebraska Job Service and the Farmers Union of Nebraska. It is a programdesigned to offer most of the services of the Job Service to residents ofrural Nebraska, both applicants and employers, by the use of partially paidlocal representatives. Twelve RES offices operated in the state duringFiscal Year 1975.
Japanese Training Program.
The Nebraska Job Service assisted in the selection of host farmers for theon-the-job portion of training for Japanese farming students. The programwas sponsored by Big Bend Community College of Moses Lake, Wash"ington, andthe Japanese Agricultural Training Council.
-19-
Seasonal Expanded Services.
When appropriate, the Rural Manpower Service provided expanded services tomeet the seasonal needs of agriculture. During Fiscal Year 1975, serviceswere provided to migrant workers in the sugar beet production areas, to wheatgrowers during harvest, and detasse1ers for the hybrid seed industry.
From mid-May to mid-July, temporary bilingual workers were employed to contact migrant workers to offer services of the Job Service and explain otherservices provided locally. During the wheat harvest, eight temporary officeswere established to assist the custom cutters and wheat growers. Informationconcerning the harvest was provided by the Nebraska Daily Harvest Bulletin.In the central and eastern part of the state, additional interviewers wereprovided to the Local Offices to help recruit approximately 8,500 youth fordetasse1ing.
-20-
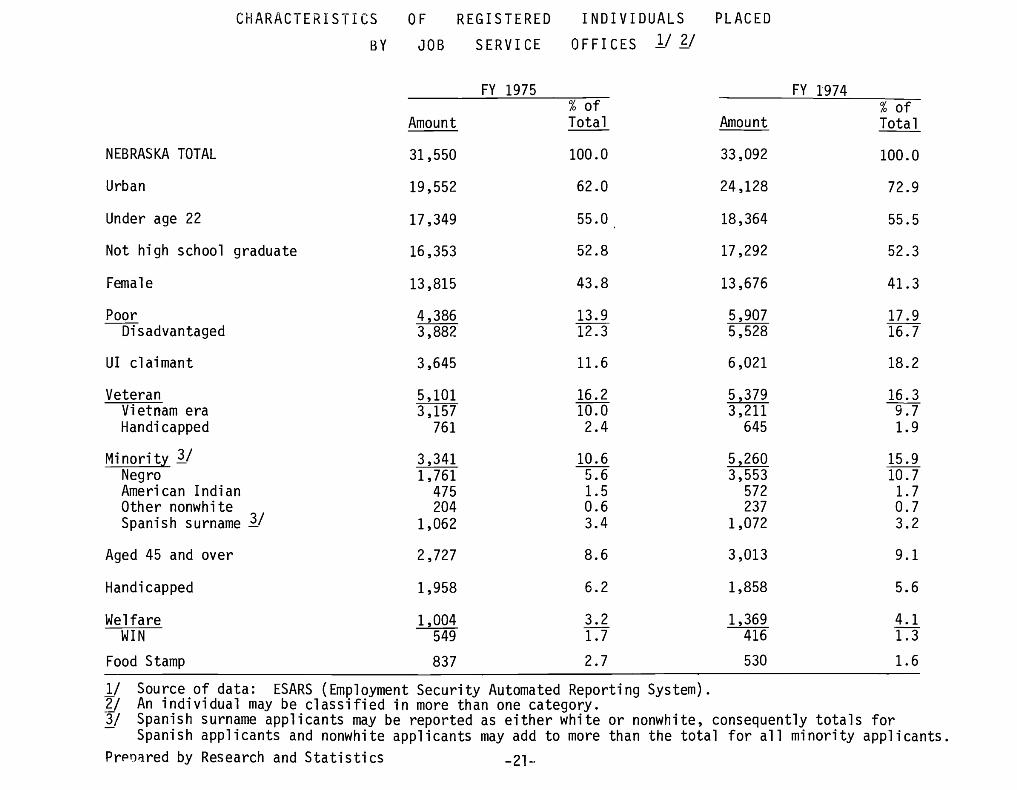
CHARACTERISTICS
BYOF
JOB
REGISTERED
SERVICE
INDIVIDUALS
OFFI CES 1/ '1:.-/
PLACED
Amount
FY 1975% ofTotal Amount
FY 1974%ofTotal
NEBRASKA TOTAL
Urban
Under age 22
Not high school graduate
Female
Poor-olsadvantaged
UI claimant
VeteranVietnam eraHandicapped
Minority l/NegroAmerican IndianOther nonwhiteSpanish surname 1/
Aged 45 and over
Handicapped
WelfareWIN
Food Stamp
31,550
19,552
17,349
16,353
13,815
4,3863,882
3,645
5,1013,157
761
3,3411,761
475204
1,062
2,727
1,958
1,004~
837
100.0
62.0
55.0
52.8
43.8
13.912.3
11.6
16.210.02.4
10.65.61.50.63.4
8.6
6.2
3.21.7
2.7
33,092
24,128
18,364
17,292
13,676
5,9075,528
6,021
5,3793,211
645
5,2603,553
572237
1,072
3,013
1,858
1,3694I6
530
100.0
72.9
55.5
52.3
41.3
17.916.7
18.2
16.39:7
1.9
15.910.71.70.73.2
9.1
5.6
4.11.3
1.6
1/ Source of data: ESARS (Employment Security Automated Reporting System).2/ An individual may be classified in more than one category.3/ Spanish surname applicants may be repol~ted as either white or nonwhite, consequently totals for- Spanish applicants and nonwhite applicants may add to more than the total for all minority applicants.Prponred by Research and Statistics -21~
%ofTotal
-22-Prepared by Research and Statistics
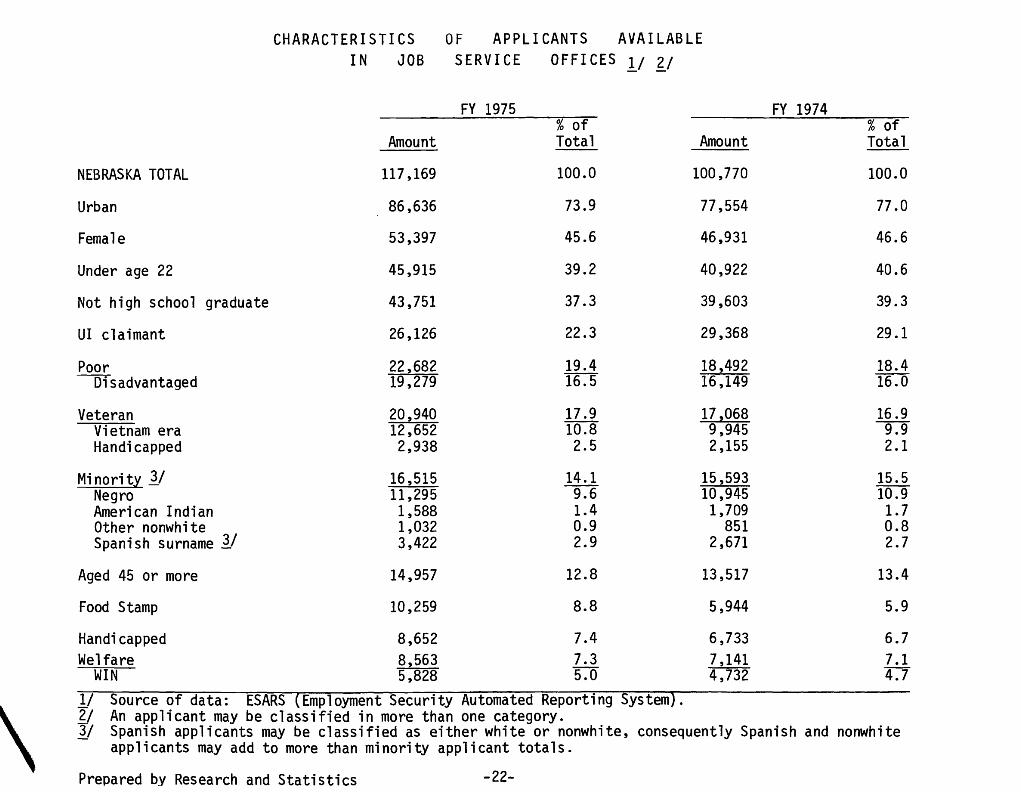
CHARACTERISTICS OF APPLICANTS AVAILABLEIN JOB SERVICE OFFICES II 'f/
FY 1975 FY 1974% of
--
Amount Total Amount
NEBRASKA TOTAL 117 t 169 100.0 100,770
Urban 86 t 636 73.9 77 t 554
Female 53 t 397 45.6 46,931
Under age 22 45,915 39.2 40,922
Not high school graduate 43 t 751 37.3 39,603
UI claimant 26,126 22.3 29,368
Poor 22,682 19.4 18 t 492---o1sadvantaged 19 t 279 16.5 16,149
Veteran 20 t 940 17.9 17,068Vietnam era 12,652 10.8 9,945Handicapped 2,938 2.5 2,155
Mi nori ty 31 16,515 14.1 15,593Negro 11,295 -U 10,945American Indian 1,588 1.4 1,709Other nonwhite 1,032 0.9 851Spanish surname 11 3,422 2.9 2,671
Aged 45 or more 14,957 12.8 13,517
Food Stamp 10,259 8.8 5.. 944
100.0
77.0
46.6
40.6
39.3
29.1
18.416.0
16.9g:g
2.1
15.510.91.70.82.7
13.4
5.9
Handicapped 8,652 7.4 6,733 6.7Welfare 8,563 7.3 7,141 7.1
WIN 5,828 5JD 4,732 4:71/ Source of data: ESARS (Employment Security Automated Reporting System).21 An applicant may be classified in more than one category.~ Spanish applicants may be classified as either white or nonwhite, consequently Spanish and nonwhite
applicants may add to more than minority applicant totals.
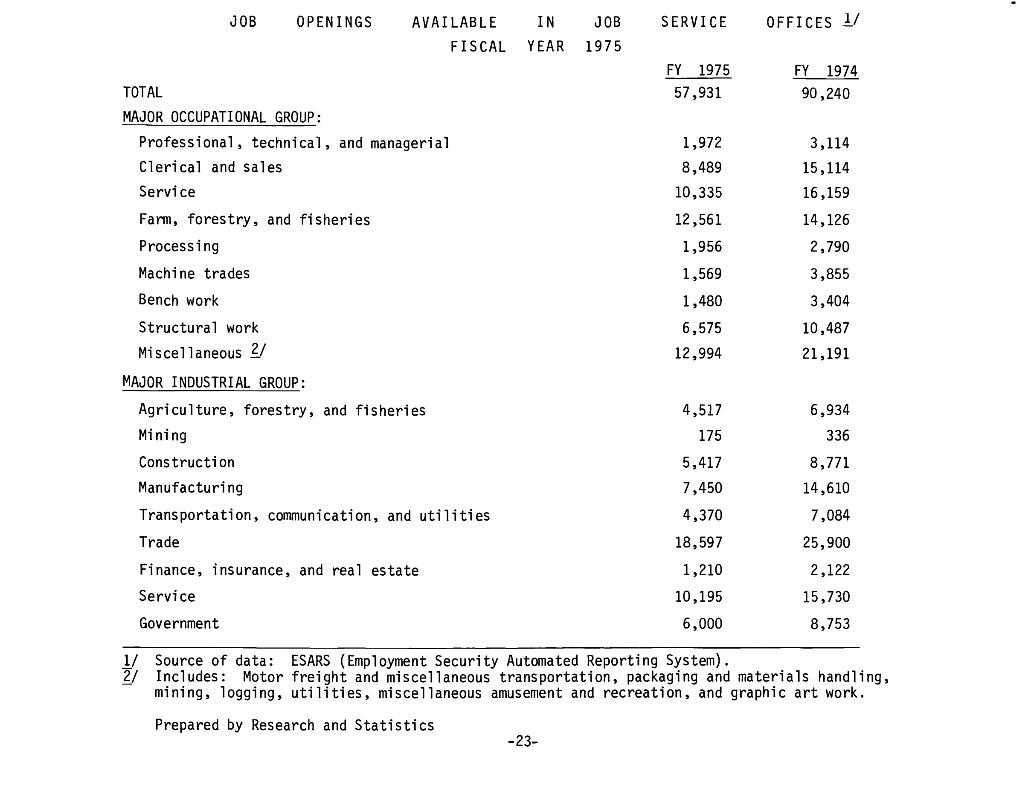
TOTALMAJOR OCCUPATIONAL GROUP:
Professional, technical, and managerialClerical and salesService
Farm, forestry, and fisheries
Processing
Machine trades
Bench work
Structural work
Miscellaneous ~
I
JOB OPENINGS AVAILABLEFISCAL
INYEAR
JOB1975
SERVICE OFFICES 1/
FY 1975 FY 197457,931 90,240
1,972 3,114
8,489 15,114
10,335 16,159
12,561 14,126
1,956 2,790
1,569 3,855
1,480 3,404
6,575 10,487
12,994 21,191
MAJOR INDUSTRIAL GROUP:
Agriculture, forestry, and fisheries
Mining
Construction
Manufacturing
Transportation, communication, and utilities
Trade
Finance, insurance, and real estate
Service
Government
4,517
175
5,417
7,450
4,370
18,597
1,210
10,195
6,000
6,934
336
8,771
14,610
7,084
25,900
2,122
15,730
8,753
1/ Source of data: ESARS (Employment Security Automated Reporting System).~ Includes: Motor freight and miscellaneous transportation, packaging and materials handling,
mining, logging, utilities, miscellaneous amusement and recreation, and graphic art work.
Prepared by Research and Statistics-23-
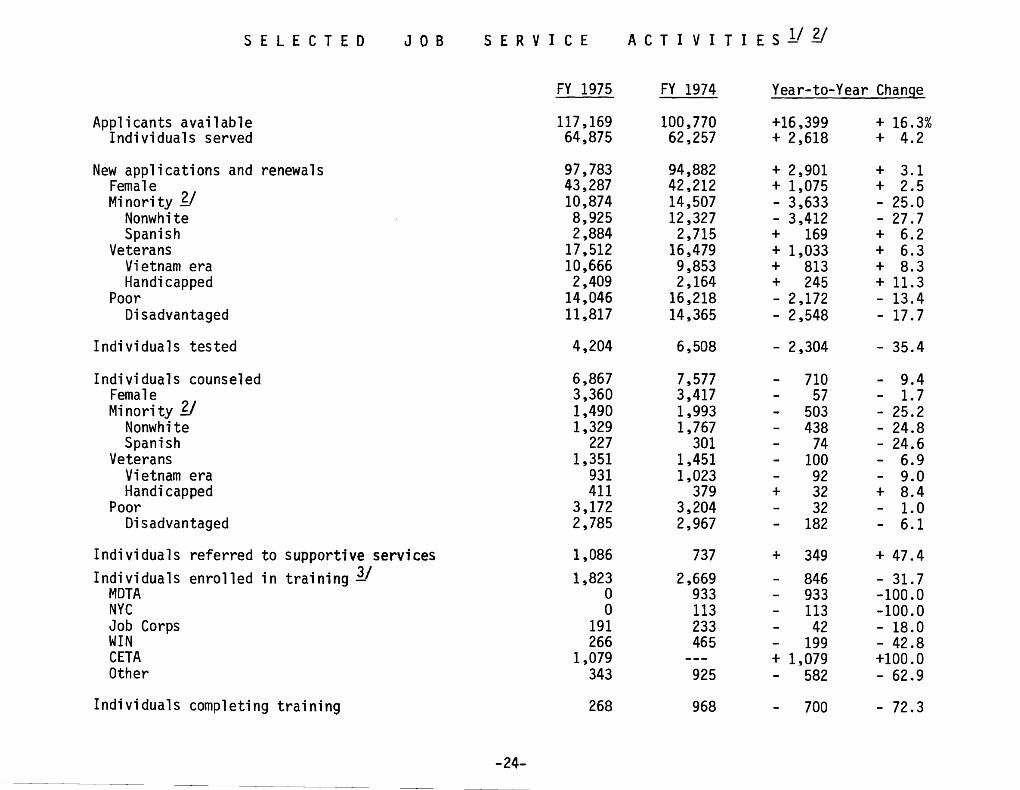
S E LEe TED JOB 5 E R V ICE ACT I V I TIE S 11 2/
FY 1975 FY 1974 Year-to-Year Change
Applicants available 117,169 100,770 +16,399 + 16.3%Individuals served 64,875 62,257 + 2,618 + 4.2
New applications and renewals 97,783 94,882 + 2,901 + 3.1Female 43,287 42,212 + 1,075 + 2.5Minority '1:../ 10,874 14,507 - 3,633 - 25.0
Nonwhite 8,925 12,327 - 3,412 - 27.7Spanish 2,884 2,715 + 169 + 6.2
Veterans 17,512 16,479 + 1,033 + 6.3Vietnam era 10,666 9,853 + 813 + 8.3Handicapped 2,409 2,164 + 245 + 11.3
Poor 14,046 16,218 - 2,172 - 13.4Disadvantaged 11,817 14,365 - 2,548 - 17.7
Individuals tested 4,204 6,508 - 2,304 - 35.4
Individuals counseled 6,867 7,577 - 710 - 9.4Female 3,360 3,417 - 57 - 1.7Minority '1:../ 1,490 1,993 - 503 - 25.2
Nonwhite 1,329 1,767 - 438 - 24.8Spanish 227 301 - 74 - 24.6
Veterans 1,351 1,451 - 100 - 6.9Vietnam era 931 1,023 - 92 - 9.0Handicapped 411 379 + 32 + 8.4
Poor 3,172 3,204 - 32 - 1.0Disadvantaged 2,785 2,967 - 182 - 6.1
Individuals referred to supportive services 1,086 737 + 349 + 47.4Individuals enrolled in training ~ 1,823 2,669 - 846 - 31.7
MDTA 0 933 - 933 -100.0NYC 0 113 - 113 -100.0Job Corps 191 233 - 42 - 18.0WIN 266 465 - 199 - 42.8CETA 1,079 --- + 1,079 +100.0Other 343 925 - 582 - 62.9
Individuals completing training 268 968 - 700 - 72.3
-24-
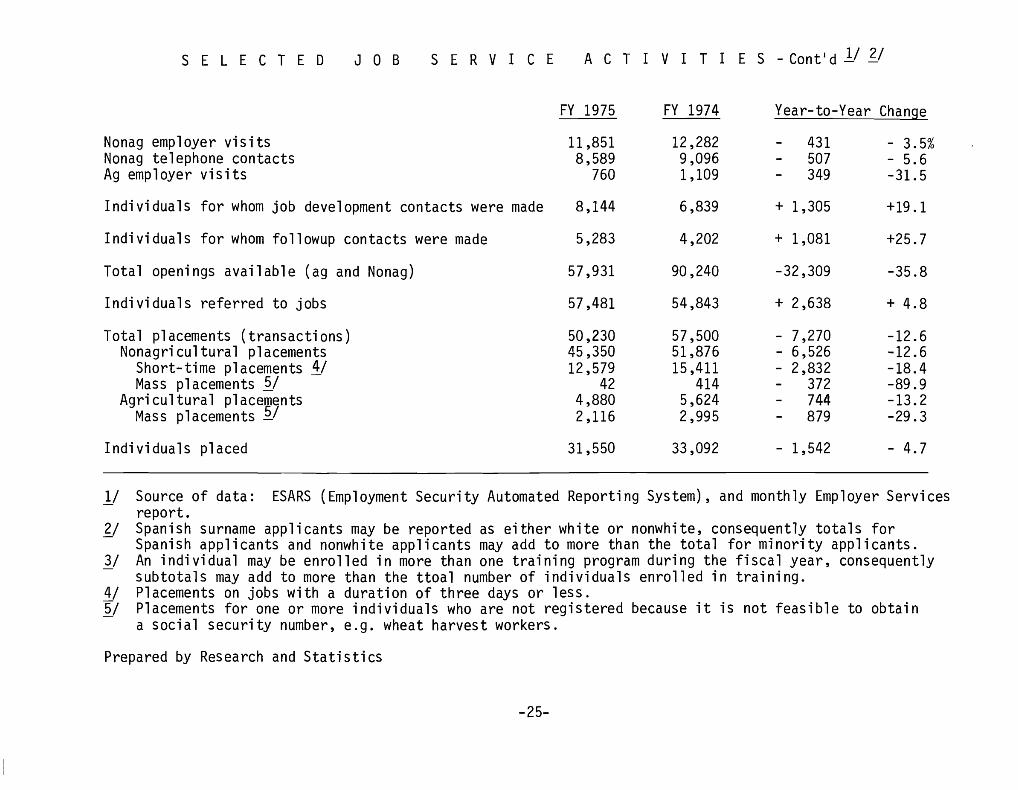
S E L E C TED JOB S E R V ICE ACT I V I TIE S - Cont I d 1J '{I
FY 1975 FY 1974 Year-to-Year Change
Nonag employer visits 11,851 12,282 - 431 - 3.5%Nonag telephone contacts 8,589 9,096 - 507 - 5.6Ag employer visits 760 1,109 - 349 -31.5
Individuals for whom job development contacts were made 8,144 6,839 + 1,305 +19.1
Individuals for whom followup contacts were made 5,283 4,202 + 1,081 +25.7
Total openings available (ag and Nonag) 57,931 90,240 -32,309 -35.8
Individuals referred to jobs 57,481 54,843 + 2,638 + 4.8
Total placements (transactions) 50,230 57,500 - 7,270 -12.6Nonagricultural placements 45,350 51,876 - 6,526 -12.6
Short-time placements 11 12,579 15,411 - 2,832 -18.4Mass placements ~ 42 414 - 372 -89.9
Agricultural placements 4,880 5,624 - 744 -13.2Mass placements ~I 2,116 2,995 - 879 -29.3
Individuals placed 31,550 33,092 - 1,542 - 4.7
11 Source of data: ESARS (Employment Security Automated Reporting System), and monthly Employer Servicesreport.
~I Spanish surname applicants may be reported as either white or nonwhite, consequently totals forSpanish applicants and nonwhite applicants may add to more than the total for minority applicants.
31 An individual may be enrolled in more than one training program during the fiscal year, consequently- subtotals may add to more than the ttoal number of individuals enrolled in training.41 Placements on jobs with a duration of three days or less.51 Placements for one or more individuals who are not registered because it is not feasible to obtain- a social security number, e.g. wheat harvest workers.
Prepared by Research and Statistics
-25-

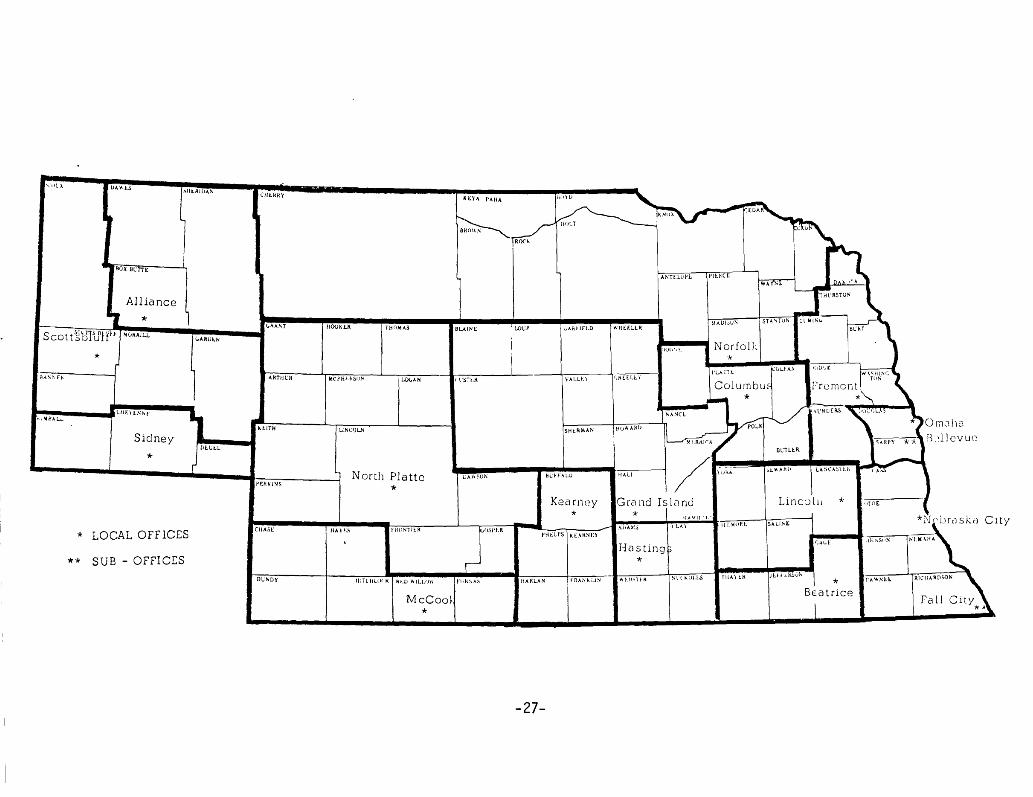
JOB SERVICE OFFICES
OFFICE MANAGER LOCATION
Alliance Mark Anderson 119 West 4th Street
Beatrice Clifford Simmons 1801 North 6th Street
Columbus Dallas Berney 2809 13th Street
*Fa11s City Betty Miller 1701 Stone Street
Fremont Sterling Siercks 406 East 6th Street
Grand Island John Lincoln 724 West Koenig
Hastings Homer Poush 918 West Fourth Street
Kearney Don Caha 2108 Avenue A
Lincoln Eugene Landkamer 1410 IIQII Street
McCook Carl Cole 220 West First Street
Nebraska City Charles Neerman 905 Third Corso
Norfolk Kenneth Boyer 119 Norfolk Avenue
North Platte Robert Kani ve 114 South Chestnut
Omaha Rod Barnes 5404 Cedar
Scottsbluff LeRoy Lance 1809 Avenue A
Sidney Chester Hickman 1133 Jackson Street
*Sub-Office
-26-
$
-\/I)L.\ UA\\lS
r["'''''''' (lIlliRY
I
illI\llk lYl. ""'IIA
h lIol.TBROIl I':
ROC'"
- ~.lOA/\'
LOCAL OFFICES
,;\18 ... L..lIiJ::YlM'o1'
*
fAWNll
BL'((T
}(;t)c.• [
Frcmont ..\
I
, *BEa trice
. ~
,\:Nlo£RS E"JC'. o 1Il:t)W
" ... RP)' "A'}: B.~llcvucDUTLlR.
·0LI' ....\
ST ... "TU/\ lenu"l.
Wit. h
Til ... \ lli
Columbu~
IIALJloU\
1·I.ArH:
!'IHC!:
1N~:folk
. Sl'l"ULI.:i
AI\Tt:LuP!.
',H)(}', L
I
/ ~Is III nd~ I" \( I I TI I'
1'11,11>' f:K
Hastingh*
""'L1
GrCll1d
*
r;lllll.l \
WHlf.LlR
• ...............-- rJill~vf..t'n ....", :.IN
KeaflH:Y
*
v ... hllfl.O
~·"'I.Lr:\
aUI''''I.u
PHr;L.I'S I KL,\KSI;Y
_ .\IIAMS
IIAIILAN
~
LJAIISO/\
J"'""',Il,\"'~
8UINl . LOU?
I
( l'~TUI
LLO<..AN
r1IU:-;TllR
McCoo~
*
THfJ/ll ...S
1I1l' ." I)I.K I IIl.lJ W/l.IiJII
North Platte*
IIA Y~:s
1.1 NCQl.N
McPHf./(Su!'
/looKlR
AIlT/IUIi
;/I;OY
(;IIAI\T
"lITH
rF:Rt\/ss
CIiASL
..
-
[lll,;lL
I
~
"ARDl",
,
1
*~(jIlIl/LL
ROX al'nE -----'
Alliance
J
SUB - OFFICES
*
**
~cott~b1UHH
Sidney
*R""'~ f"
~
-27-

•
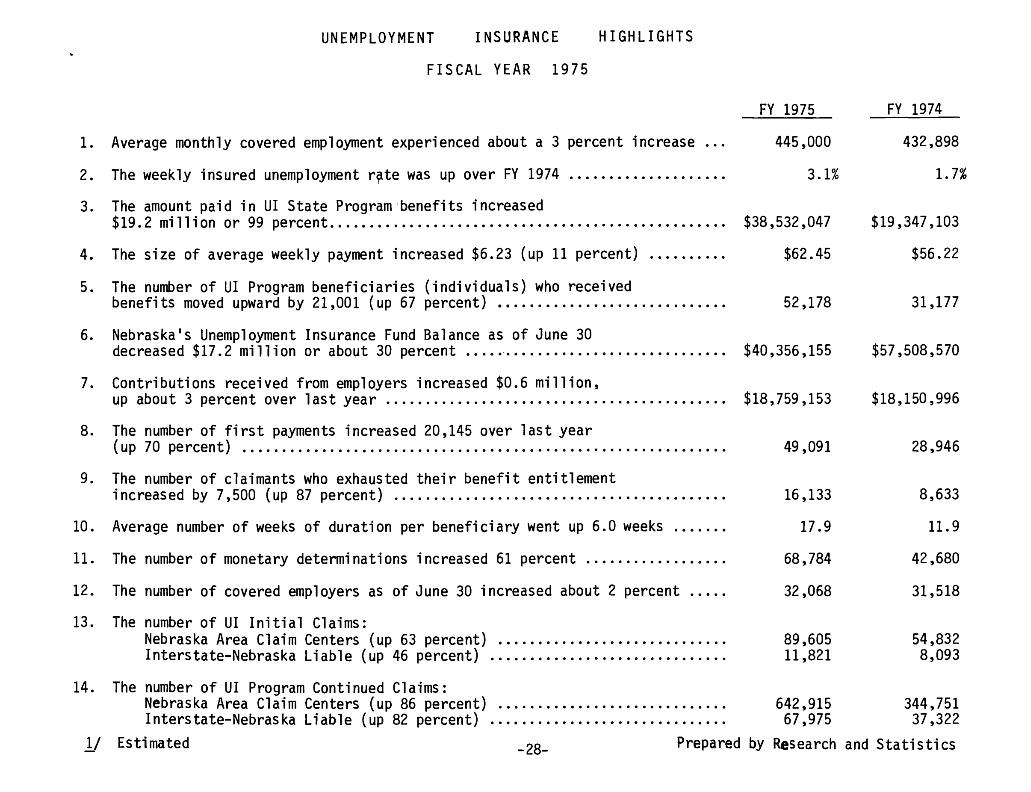
UNEMPLOYMENT INSURANCE HIGHLIGHTS
FISCAL YEAR 1975
FY 19~ FY 1974
445,000 432,898
3.1% 1.7%
$38,532,047 $19,347,103
$62.45 $56.22
52,178 31,177
$40,356,155 $57,508,570
$18,759,153 $18,150,996
49,091 28,946
16,133 8,633
17.9 11.9
68,784 42,680
32,068 31,518
89,605 54,83211,821 8,093
642,915 344,75167,975 37,322
2. The weekly insured unemployment r~te was up over FY 1974 .
3. The amount paid in UI State Program-benefits increased$19.2 million or 99 percent .
1. Average monthly covered employment experienced about a 3 percent increase ...
5. The number of UI Program beneficiaries (individuals) who receivedbenefits moved upward by 21,001 (up 67 percent) .
6. Nebraska's Unemployment Insurance Fund Balance as of June 30decreased $17.2 million or about 30 percent .......................•.........
7. Contributions received from employers increased $0.6 million,up about 3 percent over last year .
8. The number of first payments increased 20,145 over last year(up 70 percent) .
4. The size of average weekly payment increased $6.23 (up 11 percent)
9. The number of claimants who exhausted their benefit entitlementincreased by 7,500 (up 87 percent) .
10. Average number of weeks of duration per beneficiary went up 6.0 weeks .
11. The number of monetary determinations increased 61 percent .
12. The number of covered employers as of June 30 increased about 2 percent
13. The number of UI Initial Claims:Nebraska Area Claim Centers (up 63 percent) .Interstate-Nebraska Liable (up 46 percent) .
14. The number of UI Program Continued Claims:Nebraska Area Claim Centers (up 86 percent) ...........................•.Interstate-Nebraska Liable (up 82 percent) .
11 Estimated -28- Prepared by Research and Statistics
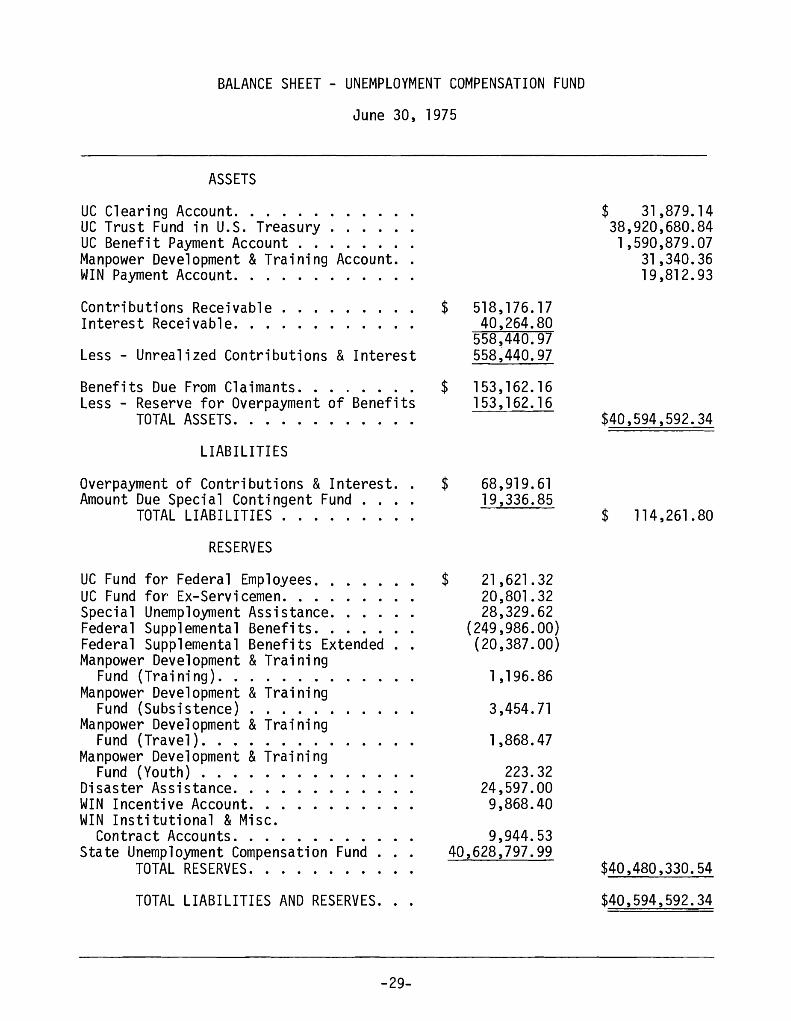
BALANCE SHEET - UNEMPLOYMENT COMPENSATION FUND
June 30, 1975
ASSETS
UC Clearing Account .UC Trust Fund in U.S. Treasury .UC Benefit Payment Account .Manpower Development &Training Account..WIN Payment Account. .. .....
Contributions Receivable. . . . . . . .. $ 518,176.17Interest Receivable. . . . . . . . . . . . 40,264.80
558,440.97Less - Unrealized Contributions &Interest 558,440.97
Benefits Due From Claimants. . . . . . .. $ 153,162.16Less - Reserve for Overpayment of Benefits 153,162.16
TOTAL ASSETS .
LIABILITIES
$ 31,879.1438,920,680.841,590,879.07
31 ,340.3619,812.93
$40,594,592.34
Overpayment of Contributions &Interest.. $Amount Due Special Contingent Fund ..
TOTAL LIABILITIES . . . . . . . . .
RESERVES
68,919.6119,336.85
$ 114,261.80
UC Fund for Federal Employees...UC Fund foY' Ex-Servi cemen. . . . . . . . .Special Unemployment Assistance .Federal Supplemental Benefits .Federal Supplemental Benefits ExtendedManpower Development &Training
Fund (Training) .Manpower Development &Training
Fund (Subsistence) .Manpower Development & Training
Fund (Travel) .Manpower Development & Training
Fund (Youth) . . . . . . . .Disaster Assistance .WIN Incentive Account. . . . . . .WIN Institutional &Misc.
Contract Accounts .State Unemployment Compensation Fund
TOTAL RESERVES. . . . . . . . .
TOTAL LIABILITIES AND RESERVES.
-29-
$ 21,621.3220,801.3228,329.62
(249,986.00)(20,387.00)
1,196.86
3,454.71
1,868.47
223.3224,597.009,868.40
9,944.5340,628,797.99
$40,480,330.54
$40,594,592.34
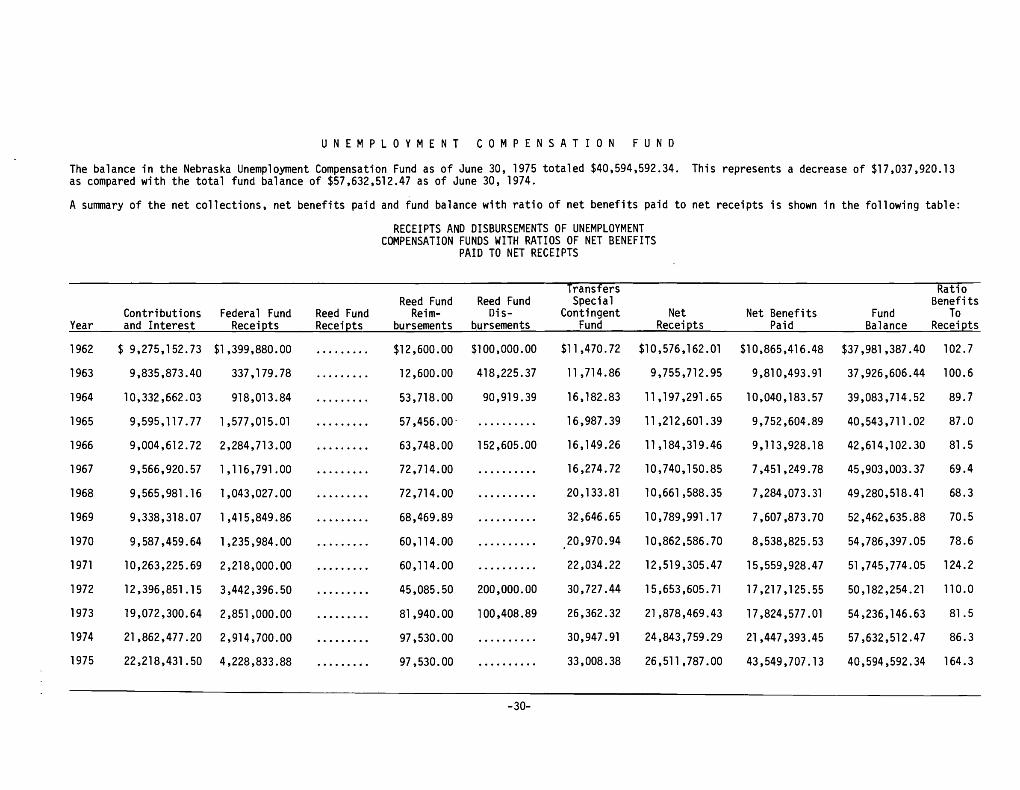
U N E MP LOY MEN T COM PEN SAT ION FUN D
The balance in the Nebraska Unemployment Compensation Fund as of June 30, 1975 totaled $40,594,592.34. This represents a decrease of $17,037,920.13as compared with the total fund balance of $57,632,512.47 as of June 30, 1974.
A summary of the net collections, net benefits paid and fund balance with ratio of net benefits paid to net receipts is shown in the following table:
RECEIPTS AND DISBURSEMENTS OF UNEMPLOYMENTCOMPENSATION FUNDS WITH RATIOS OF NET BENEFITS
PAID TO NET RECEIPTS
Transfers RatioReed Fund Reed Fund Special Benefits
Contributions Federal Fund Reed Fund Reim- Dis- Contingent Net Net Benefits Fund ToYear and Interest Receipts Receipts bursements bursements Fund Receipts Paid Balance Receipts
1962 $ 9,275,152.73 $1,399,880.00 ......... $12,600.00 $100,000.00 $11,470.72 $10,576,162.01 $10,865,416.48 $37,981,387.40 102.7
1963 9,835,873.40 337,179.78 ......... 12,600.00 418,225.37 11 ,714.86 9,755,712.95 9,810,493.91 37,926,606.44 100.6
1964 10,332,662.03 918,013.84 ......... 53,718.00 90,919.39 16,182.83 11,197,291.65 10,040 ,183 .57 39,083,714.52 89.7
1965 9,595,117.77 1,577,015.01 ........ . 57,456.00- .......... 16,987.39 11 ,212,601 .39 9,752,604.89 40,543,711.02 87.0
1966 9,004,612.72 2,284,713 .00 ......... 63,748.00 152,605.00 16,149.26 11,184,319.46 9,113,928.18 42,614,102.30 81.5
1967 9,566,920.57 1,116,791 .00 ........ . 72,714.00 .......... 16,274.72 10,740,150.85 7,451,249.78 45,903,003.37 69.4
1968 9,565,981.16 1,043,027.00 ........ . 72,714.00 .......... 20,133.81 10,661,588.35 7,284,073.31 49,280,518.41 68.3
1969 9,338,318.07 1,415,849.86 ........ . 68,469.89 .......... 32,646.65 10,789,991.17 7,607,873.70 52,462,635.88 70.5
1970 9,587,459.64 1,235,984.00 ........ . 60,114.00 .......... 20,970.94 10,862,586.70 8,538,825.53 54,786,397.05 78.6
1971 10,263,225.69 2,218,000.00 ........ . 60,114.00 .......... 22,034.22 12,519,305.47 15,559,928.47 51,745,774.05 124.2
1972 12,396,851.15 3,442,396.50 ......... 45,085.50 200,000.00 30,727.44 15,653,605.71 17,217,125.55 50,182,254.21 110.0
1973 19,072,300.64 2,851,000.00 ......... 81,940.00 100,408.89 26,362.32 21,878,469.43 17,824,577.01 54,236,146.63 81.5
1974 21,862,477.20 2,914,700.00 ....... .. 97,530.00 .......... 30,947.91 24,843,759.29 21,447,393.45 57,632,512.47 86.3
1975 22,218,431.50 4,228,833.88 ........ . 97,530.00 .......... 33,008.38 26,511 ,787.00 43,549,707.13 40,594,592.34 164.3
-30-

EMPLOYER COVERAGE AND FUND ACTIVITY
As of June 30, 1975, 32,068 employers were subject to the Nebraska EmploymentSecurity Law. Of those, 236 employers elected to make payments in lieu ofcontributions. A summary of the employer coverage for the fiscal year endingJune 30, 1975 is shown below:
SUMMARY OF EMPLOYER COVERAGE
Fiscal Year 1975
Contributory Reimbursable Total
Subject July 1, 1974. . · · . . . . . 31,273 245 31,518Firms becoming subject for the period 5,047 8 5,055
Tota1. . . . . . . · · . . . . . 36,320 253 36,573
Firms terminating liability. 4,488 17 4,505Subject June 30, 1975 . · · 31 ,832 236 32,068
VOLUNTARY CONTRIBUTIONS
The Nebraska Employment Security Law provides that employers may make voluntary contributions to increase reserve balances and qualify for reducedrates. In computing the rates for 1975, a total of 2,447 employers madevoluntary contributions of $1,000,196.77.
-31-

EXPERIENCE RATING
For the calendar year 1975 a total of 25,040 employers received a reducedcontribution rate. To be eligible for a reduced contribution rate, an employer's account must meet two statutory standards which require that (1) Benefitshave been payable from and chargeable to his experience account throughout thepreceding one calendar year and (2) Contributions have been payable to the fundand credited to his experience account with respect to the two preceding calendar years. A distribution of the employers contribution rate for the calendaryears 1973, 1974 and 1975 is shown in the following table:
DISTRIBUTION OF EMPLOYER CONTRIBUTION RATES FOR
1973, 1974 and 1975
RATENUMBER OF EMPLOYERS
1973 1974 1975 1973PERCENT1974 1975
Total 14,832 27,669 28,523 100.0 100.0 100.0
o. 1 · · · · · · · · 4,611 3,973 3,645 31 . 1 14.4 12.80.2 · · · · · · · · 1,105 1,077 2,099 7.4 3.9 7.40.3 · · · · · · · · 2,018 2,186 10,468 13.6 7.9 36.70.5 · · · · · · · · 2, 191 2,769 3,769 14.8 10.0 13.21.0 · · · · · · · · 1,153 1,408 1,721 7.8 5. 1 6.01.5 · · · · · · · · 577 741 822 3.9 2.7 2.92.0 · · · · · · · · 382 1,699 606 2.6 6. 1 2. 12.5 · · · · · · · · 772 10,651 1,910 5.2 38.5 6.7
Total Employers GivenReduced Ra tes · · · 12,809 24,504 25,040 86.4 88.6 87.8
Employers Assigned2.7 Rate. · · · · · 2,023 3,165 3,483 18.5 11 .4 12.2
-32-
•
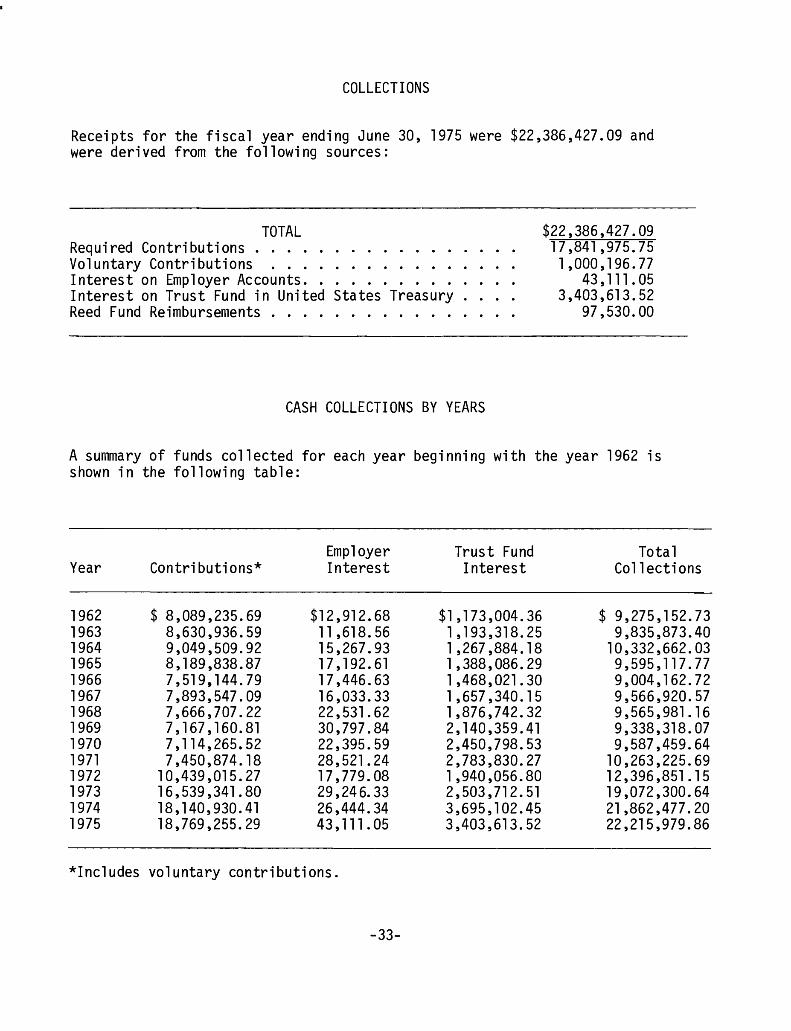
COLLECTIONS
Receipts for the fiscal year ending June 30, 1975 were $22,386,427.09 andwere derived from the following sources:
TOTALRequired Contributions .Voluntary Contributions .Interest on Employer Accounts .Interest on Trust Fund in United States Treasury.Reed Fund Reimbursements . . . . . . . . . . . . .
CASH COLLECTIONS BY YEARS
$22,386,427.0917,841,975.751,000,196.77
43,111.053,403,613.52
97,530.00
A summary of funds collected for each year beginning with the year 1962 isshown in the following table:
Employer Trust Fund TotalYear Contributions* Interest Interest Collections
1962 $ 8,089,235.69 $12,912.68 $1,173,004.36 $ 9,275,152.731963 8,630,936.59 11,618.56 1,193,318.25 9,835,873.401964 9,049,509.92 15,267.93 1,267,884.18 10,332,662.031965 8,189,838.87 17,192.61 1,388,086.29 9,595,117.771966 7,519.144.79 17,446.63 1,468,021.30 9,004,162.721967 7,893,547.09 16,033.33 1,657,340.15 9,566,920.571968 7,666,707.22 22,531.62 1,876,742.32 9,565,981.161969 7,167,160.81 30,797.84 2,140,359.41 9,338,318.071970 7,114,265.52 22,395.59 2,450,798.53 9,587,459.641971 7,450,874.18 28,521.24 2,783,830.27 10,263,225.691972 10,439,015.27 17,779.08 1,940,056.80 12,396,851.151973 16,539,341.80 29,246.33 2,503,712.51 19,072,300.641974 18,140 , 930 . 41 26,444.34 3,695,102.45 21,862,477.201975 18,769,255.29 43,111.05 3,403,613.52 22,215,979.86
*Includes voluntary contributions.
-33-
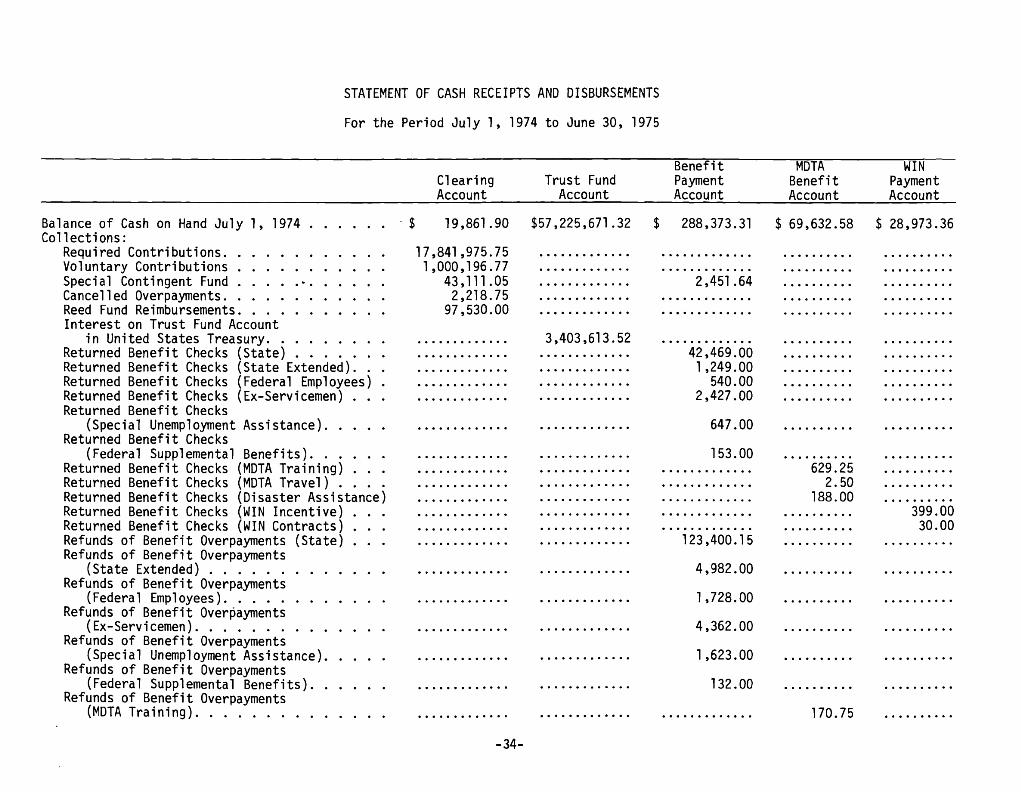
STATEMENT OF CASH RECEIPTS AND DISBURSEMENTS
For the Period July 1, 1974 to June 30, 1975
Benefit - MOTA WINClearing Trust Fund Payment Benefit PaymentAccount Account Account Account Account
Balance of Cash on Hand July 1, 1974 ...... . $ 19,861.90 $57,225,671.32 $ 288,373.31 $ 69,632.58 $ 28,973.36Collections:
Required Contributions............ 17,841,975.75 ·............ ·............ ·......... ·.........Voluntary Contributions ........... 1,000,196.77 ·............ ·............ ·......... ·.........Special Contingent Fund ............ 43,111 .05 ·............ 2,451 .64 ·......... ·.........Cancelled Overpayments............ 2,218.75 ·............ ·............ ......... . ..........Reed Fund Reimbursements........... 97,530.00 ·............ ·............ ·......... ..........Interest on Trust Fund Account
in United States Treasury......... ·............ 3,403,613.52 ·............ ·......... ..........Returned Benefi t Checks (State) . . . . . . . ·............ ·............ 42,469.00 ·......... ·.........Returned Benefit Checks (State Extended) ... ·............ ·............ 1,249.00 ·......... ·.........Returned Benefit Checks (Federal Employees) . ·............ ·............ 540.00 ·......... ·.........Returned Benefit Checks (Ex-Servicemen) ... ·............ ·............ 2,427.00 ·......... ·.........Returned Benefit Checks
(Special Unemployment Assistance) ..... ·............ ·............ 647.00 ·......... ·.........Returned Benefit Checks
(Federal Supplemental Benefits) ...... ·............ ·............ 153.00 ......... . ·.........Returned Benefit Checks (MOTA Training) ... ·............ ·............ ·............ 629.25 ·.........Returned Benefit Checks (MOTA Travel) .... ·............ ·............ ·............ 2.50 ..........Returned Benefit Checks (Disaster Assistance) ·............ ·............ ............. 188.00 ·.........Returned Benefit Checks (WIN Incentive) ... ·............ ·............ ·............ .......... 399.00Returned Benefit Checks (WIN Contracts) ... ·............ ·............ ·............ ·......... 30.00Refunds of Benefit Overpayments (State) ... ·............ ·............ 123,400.15 ·......... ..........Refunds of Benefit Overpayments
(State Extended) ............. ·............ ·............ 4,982.00 ·......... ·.........Refunds of Benefit Overpayments
(Federal Employees) ............ ·............ ·............ 1,728.00 ·......... ·.........Refunds of Benefit Overpayments
(Ex-Servicemen) .............. ·............ ·............ 4,362.00 .......... ..........Refunds of Benefit Overpayments
(Special Unemployment Assistance)..... ·............ ·............ 1,623.00 .......... ·.........Refunds of Benefit Overpayments
(Federal Supplemental Benefits) ...... ............ . ·............ 132.00 .......... ..........Refunds of Benefit Overpayments
(MOTA Training) .............. ·............ ·............ ·............ 170.75 ·.........-34-
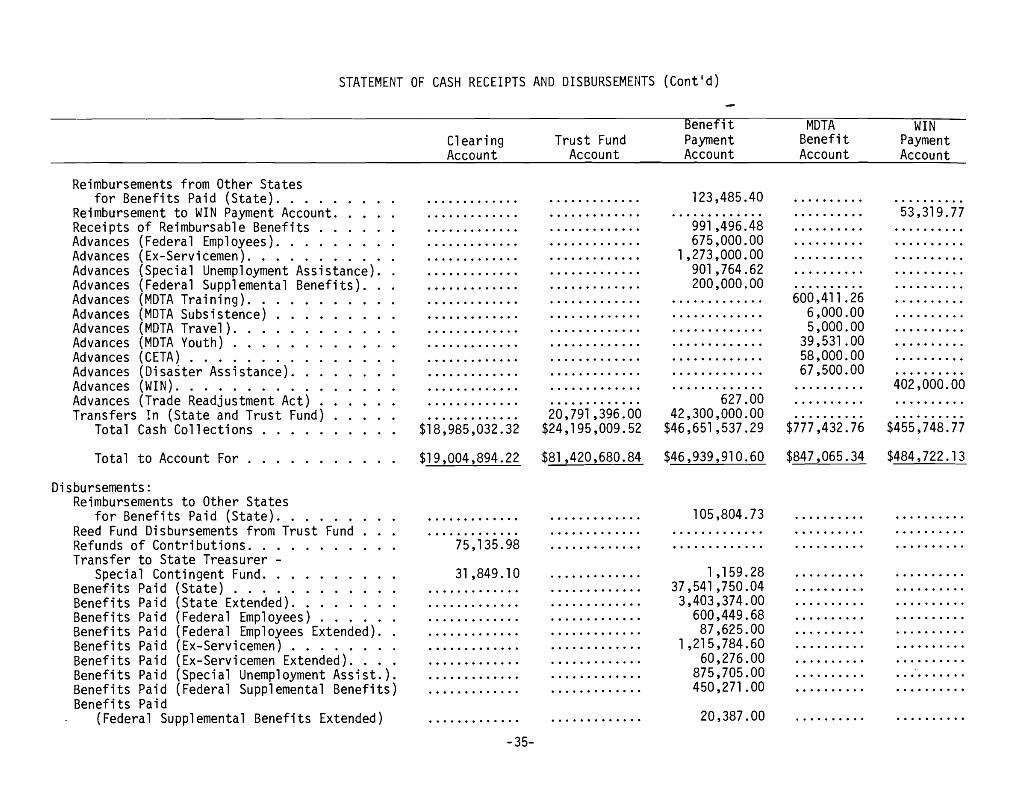
STATEMENT OF CASH RECEIPTS AND DISBURSEMENTS (Cont'd)
.' ClearingAccount
Trust FundAccount
BenefitPaymentAccount
MOTABenefitAccount
WINPaymentAccount
Reimbursements from Other Statesfor Benefits Paid (State) ...
Reimbursement to WIN Payment Account.Receipts of Reimbursable Benefits .Advances (Federal Employees) .Advances (Ex-Servicemen) .Advances (Special Unemployment Assistance) ..Advances (Federal Supplemental Benefits).Advances (MOTA Training) ..Advances (MOTA Subsistence) .Advances (MOTA Travel) .Advances (MOTA Youth) .Advances (CETA) . . . . . . . . . . . .Advances (Disaster Assistance) .Advances (WIN) .Advances (Trade Readjustment Act) . . . . . .Transfers In (State and Trust Fund) ..
Total Cash Collections .
Total to Account For . . . .
............ . ............ . 123,485.40 .......... ..........
............ . ............ . ............ . .......... 53,319.77
............ . ............ . 991 ,496.48 .......... ..........
............ . ............ . 675,000.00 .......... ..........
............ . ............ . 1,273,000.00 .......... ..........
............ . ............ . 901 ,764.62 .......... ..........
............ . ............ . 200,000.00 .......... ..........
............ . ............ . ............. 600,411.26 ..........
............ . ............ . ............ . 6,000.00 ..........
............ . ............ . ............ . 5,000.00 ..........
............ . ............ . ............ . 39,531 .00 ..........
............ . ............ . ............ . 58,000.00 ..........
............ . ............ . ............ . 67,500.00 ..........
............ . ............ . ............ . .......... 402,000.00
............ . ............ . 627.00 .......... ..........
............ . 20,791 ,396.00 42,300,000.00 ......... . ..........$18,985,032.32 $24,195,009.52 $46,651,537.29 $777,432.76 $455,748.77
$19,004,894.22 $81 ,420,680.84 $46,939,910.60 $847,065.34 $484,722. 13
Disbursements:Reimbursements to Other States
for Benefits Paid (State) .Reed Fund Disbursements from Trust Fund .Refunds of Contributions .Transfer to State Treasurer -
Special Contingent Fund. . . . . . .Benefits Paid (State) .Benefits Paid (State Extended) ..Benefits Paid (Federal Employees) .Benefits Paid (Federal Employees Extended) ..Benefits Paid (Ex-Servicemen) .Benefits Paid (Ex-Servicemen Extended) .Benefits Paid (Special Unemployment Assist.).Benefits Paid (Federal Supplemental Benefits)Benefits Paid
(Federal Supplemental Benefits Extended)
75,135.98
31 ,849. 10
-35-
105,804.73 ...................... . ...................... . ..........
1,159.28 ..........37,541,750.04 ..........3,403,374.00 ..........
600,449.68 ..........87,625.00 ..........
1,215,784.60 ..........60,276.00 ..........
875,705.00 ..........450,271 .00 ..........
20,387.00 ..........
STATEMENT OF CASH RECEIPTS AND DISBURSEMENTS (Cont'd)
Benefit -~--1tlDiA WINClearing Trust Fund Payment Benefit PaymentAccount Account Account Account Account
Benefits Paid (Trade Readjustment Act) .... ·............ ·............ 627.00 ·......... ·.........Reimbursable Benefits Paid .....•.... ·............ ·............ 985,818.20 ·......... ·.........Benefits Paid (MDTA Training) ........ ·............ ·............ ·............ 637,318.44 ·.........Benefits Paid (MOTA Subsistence)....... ............ . ·............ ·............ 5,534.00 ·.........Benefits Paid (MOTA Travel) ......... ·............ ·............ ·............ 20,855.54 ·.........Benefits Paid (MOTA Youth) .......... ·............ .. , .......... ·............ 50,926.00 ·.........Benefits Paid (CETA) ............. ·............ ·............ ·............ 58,000.00 ·.........Benefits Paid (Disaster Assistance) ..... ·............ ·............ ·............ 43,091.00 ·.........Benefits Paid (WIN Incentive) ........ ·............ ·............ ·............ ·......... 124,316.00Contracts Paid (WIN) ............. ·............ ·............ ·............ ·......... 340,593.20Transfers Out (State and Trust Fund) .•... 18,866,030.00 42,500,000.00 ·............ ·......... ·.........
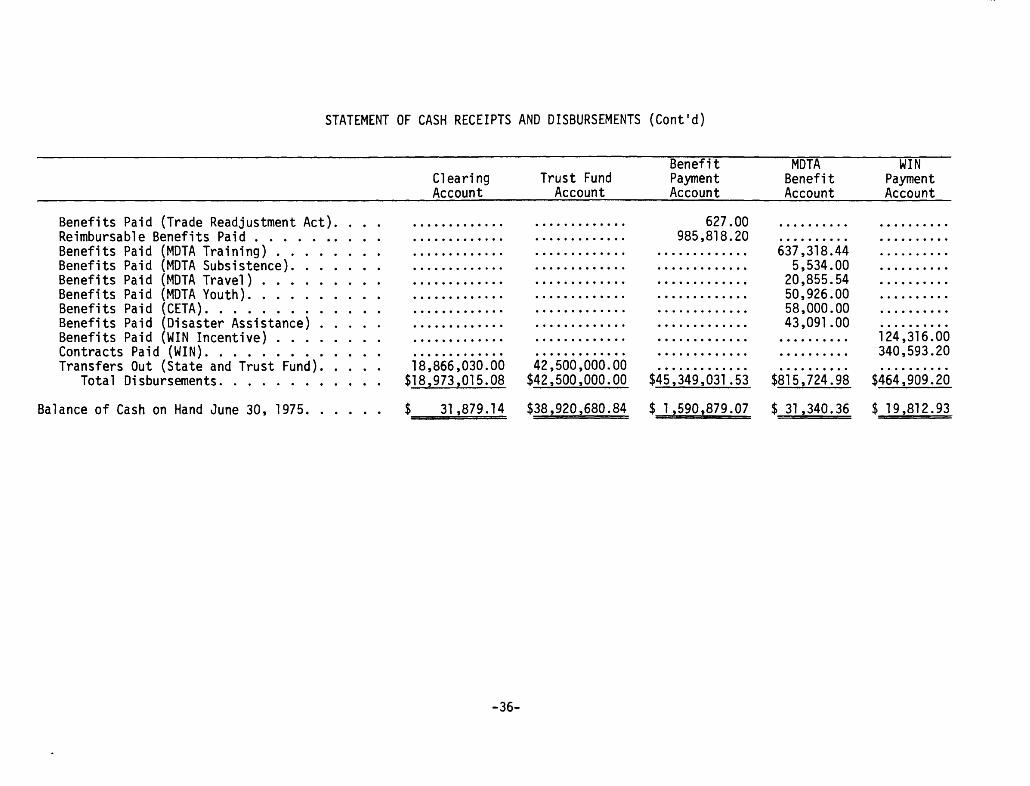
Total Disbursements............ $18,973,015.08 $42,500,000.00 $4~,:t49,031 .53 $815,724.98 $464,909.20
Balance of Cash on Hand June 30, 1975...... $ 31,879.14 $38,920,680.84 $ 1,~90t879.07 $ 31 ,340.36 $ 19,812.93
~36-
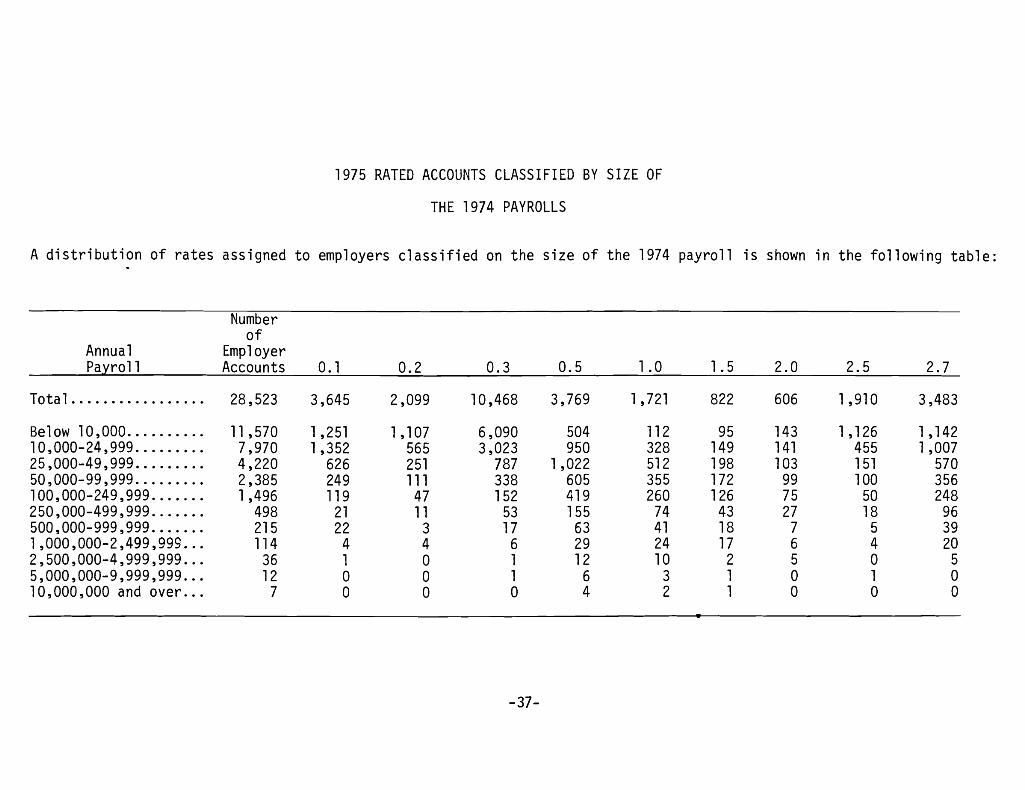
1975 RATED ACCOUNTS CLASSIFIED BY SIZE OF
THE 1974 PAYROLLS
A distribution of rates assigned to employers classified on the size of the 1974 payroll is shown in the following table:
Numberof
Annual EmployerPayroll Accounts O. 1 0.2 0.3 0.5 1.0 1.5 2.0 2.5 2.7
Tota1................. 28,523 3,645 2,099 10,468 3,769 1,721 822 606 1,910 3,483
Below 10,000.......... 11 ,570 1,251 1,107 6,090 504 112 95 143 1,126 1,14210,000-24,999 ......... 7,970 1,352 565 3,023 950 328 149 141 455 1,00725,000-49,999 ......... 4,220 626 251 787 1,022 512 198 103 151 57050,000-99,999 ......... 2,385 249 111 338 605 355 172 99 100 356100,000-249,999 ....... 1,496 119 47 152 419 260 126 75 50 248250,000-499,999 ....... 498 21 11 53 155 74 43 27 18 96500,000-999,999 ....... 215 22 3 17 63 41 18 7 5 391,000,000-2,499,999 ... 114 4 4 6 29 24 17 6 4 202,500,000-4,999,999 ... 36 1 0 1 12 10 2 5 0 55,000,000-9,999,999 ... 12 0 0 1 6 3 1 0 1 010,000,000 and over ... 7 0 0 0 4 2 1 0 0 0
-37-
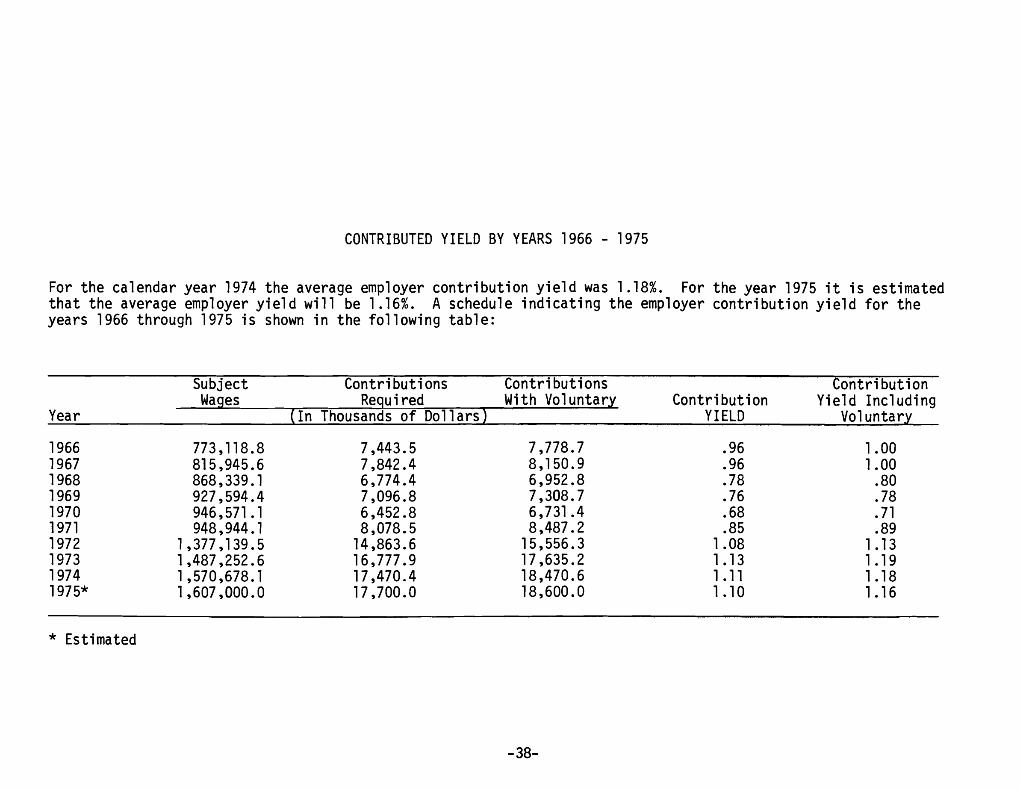
CONTRIBUTED YIELD BY YEARS 1966 - 1975
For the calendar year 1974 the average employer contribution yield was 1.18%. For the year 1975 it is estimatedthat the average employer yield will be 1.16%. A schedule indicating the employer contribution yield for theyears 1966 through 1975 is shown in the following table:
Contributions Contributions ContrlbutionRequired With Voluntary Contribution Yield Including
Year lln Thousands of Dollars} YIELD Vo1untar
1966 773,118.8 7,443.5 7,778.7 .96 1.001967 815,945.6 7,842.4 8,150.9 .96 1.001968 868,339.1 6,774.4 6,952.8 .78 .801969 927,594.4 7,096.8 7,308.7 .76 .781970 946,571.1 6,452.8 6,731.4 .68 .711971 948,944. 1 8,078.5 8,487.2 .85 .891972 1,377,139.5 14,863.6 15,556.3 1.08 1.131973 1,487,252.6 16,777.9 17,635.2 1.13 1.191974 1,570,678. 1 17,470.4 18,470.6 1.11 1.181975* 1,607,000.0 17,700.0 18,600.0 1.10 1.16
* Estimated
-38-
CLAIMS AND BENEFITS
The Claims and Benefits Section of the Unemployment Insurance Service authorized and paid unemployment insurance benefits, Federal Unemployment Compensation Civilian and Military, Manpower Development Training Act Allowances,and Interstate unemployment insurance benefits.
Through the Nebraska Employment Security Law, unemployment insurance coveragewas provided to an estimated 452,000 jobs at the end of June 1975. This wasa moderate increase over the 450,000 covered at the end of the previous year.During the fiscal year ending June 1975, the average monthly covered employmentwas estimated at 445,000.
A total of $38,532,047 was paid in state unemployment insurance benefits duringthe twelve-month period ending June 30, 1975. Benefits were paid to 52,178individuals. The average duration for individuals receiving benefits was17.9 weeks. Average weekly pa~TIents to those totally unemployed amounted to$62.45.
FEDERAL UNEMPLOYMENT COMPENSATION PROGRAMS
Two Federal Unemployment Compensation programs were administered by the Divisionduring Fiscal 1975. Funds necessary for these payments were provided by theFederal Government. Payments, therefore, had no effect upon the Nebraska Unemployment Compensation Fund.
Former civilian employees of the Federal Government have received unemployment insurance protection under a program known as Unemployment Compensationfor Federal Employees. During the fiscal year ending June 1975, 649 individuals were paid $597,102 under UCFE.
Individuals separated from the military service have been entitled to unemployment insurance protection through a program known as IIUnemployment Compensation for Ex-Servicemen. 1I During fiscal year ending June 1975, a total of1,214,756 benefit dollars were paid to 1,374 ex-servicemembers.
-39-
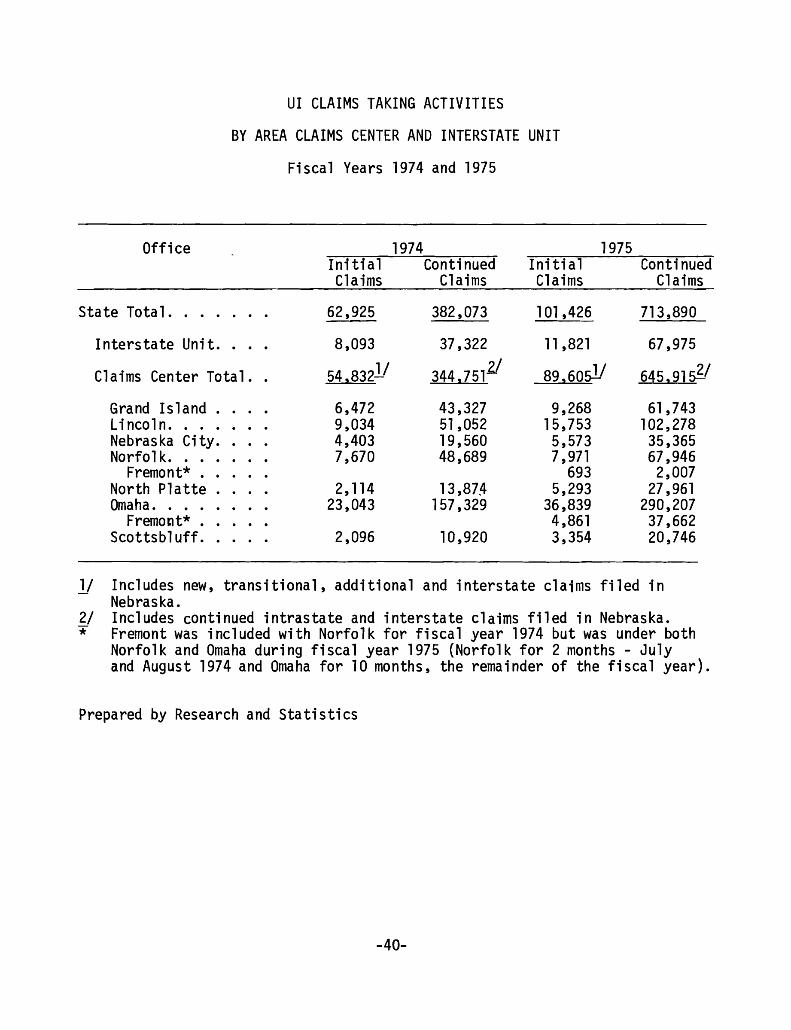
UI CLAIMS TAKING ACTIVITIES
BY AREA CLAIMS CENTER AND INTERSTATE UNIT
Fiscal Years 1974 and 1975
Office
State Total ....
Interstate Unit..
Claims Center Total ..
Gra nd Is1and .Li nco1n. . . . .Nebras ka Ci ty.Norfo1k. . .
Fremont* ..North Platte .Omaha. . . .
Fremotlt* . .Scottsbluff.....
1974 1975Initial Continued Initial ContinuedClaims Claims Claims Claims
62,925 382,073 101 ,426 713,890
8,093 37,322 11,821 67,975
54,83211 344,75,.21 89,60sl! 645,91sY
6,472 43,327 9,268 61,7439,034 51,052 15,753 102,2784,403 19,560 5,573 35,3657,670 48,689 7,971 67,946
693 2,0072, 114 13 ,87~ 5,293 27,961
23,043 157,329 36,839 290,2074,861 37,662
2,096 10,920 3,354 20,746
1/ Includes new, transitional, additional and interstate claims filed inNebraska.
2/ Includes continued intrastate and interstate claims filed in Nebraska.* Fremont was included with Norfolk for fiscal year 1974 but was under both
Norfolk and Omaha during fiscal year 1975 (Norfolk for 2 months - Julyand August 1974 and Omaha for 10 months, the remainder of the fiscal year).
Prepared by Research and Statistics
-40-
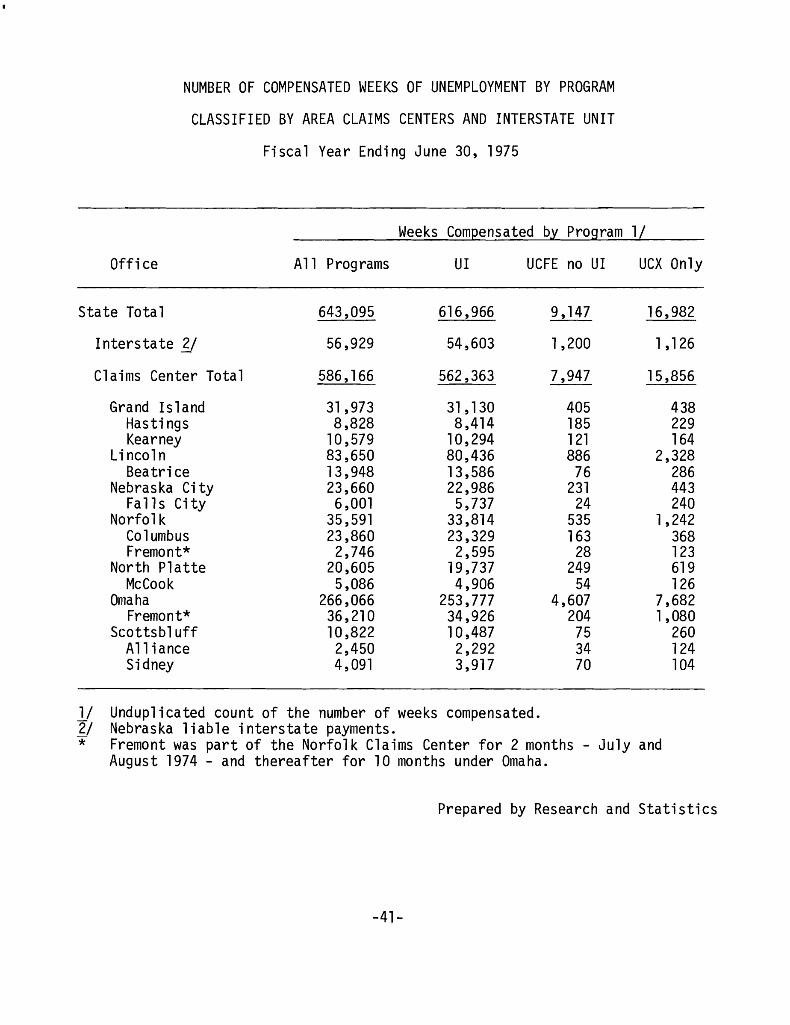
NUMBER OF COMPENSATED WEEKS OF UNEMPLOYMENT BY PROGRAM
CLASSIFIED BY AREA CLAIMS CENTERS AND INTERSTATE UNIT
Fiscal Year Ending June 30, 1975
Weeks Compensated by Program 1/
Office All Programs UI UCFE no UI UCX Only
State Total 643,095 616,966 9,147 16,982
Interstate y 56,929 54,603 1,200 1,126
Claims Center Total 586, 166 562,363 7,947 15,856
Grand Is 1and 31 ,973 31,130 405 438Hastings 8,828 8,414 185 229Kearney 10,579 10,294 121 164
Lincoln 83,650 80,436 886 2,328Beatrice 13,948 13,586 76 286
Nebraska City 23,660 22,986 231 443Falls City 6,001 5,737 24 240
Norfolk 35,591 33,814 535 1,242Columbus 23,860 23,329 163 368Fremont* 2,746 2,595 28 123
North Platte 20,605 19,737 249 619McCook 5,086 4,906 54 126
Omaha 266,066 253,777 4,607 7,682Fremont* 36,210 34,926 204 1,080
Scottsbluff 10,822 10,487 75 260Alliance 2,450 2,292 34 124Sidney 4,091 3,917 70 104
1/ Undup1icated count of the number of weeks compensated.2/ Nebraska liable interstate payments.* Fremont was part of the Norfolk Claims Center for 2 months - July and
August 1974 - and thereafter for 10 months under Omaha.
Prepared by Research and Statistics
-41-
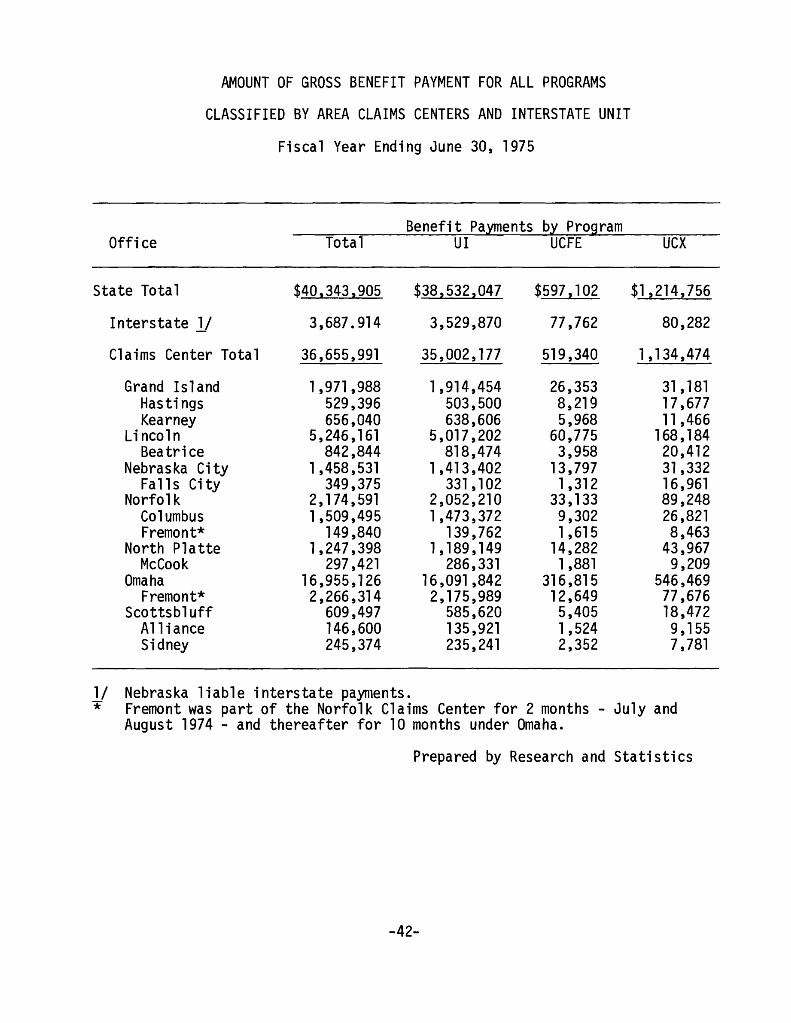
AMOUNT OF GROSS BENEFIT PAYMENT FOR ALL PROGRAMS
CLASSIFIED BY AREA CLAIMS CENTERS AND INTERSTATE UNIT
Fiscal Year Ending June 30, 1975
Benefit Payments by ProgramOffice Total UI UCFE UCX
State Total $40,343,905 $38,532,047 $597 ,102 $1,214,756
Interstate 1/ 3,687.914 3,529,870 77,762 80,282
Claims Center Total 36,655,991 35,002,177 519,340 1,134,474
Grand Island 1,971,988 1,914,454 26,353 31 ,181Hastings 529,396 503,500 8,219 17,677Kearney 656,040 638,606 5,968 11,466
Lincoln 5,246,161 5,017,202 60,775 168, 184Beatri ce 842,844 818,474 3,958 20,412
Nebras ka Ci ty 1,458,531 1,413,402 13,797 31,332Fa 11 s Ci ty 349,375 331,102 1,312 16,961
Norfolk 2,174,591 2,052,210 33,133 89,248Columbus 1,509,495 1,473,372 9,302 26,821Fremont* 149,840 139,762 1,615 8,463
North Platte 1,247,398 1,189,149 14,282 43,967McCook 297,421 286,331 1,881 9,209
Omaha 16,955,126 16,091,842 316,815 546,469Fremont* 2,266,314 2,175,989 12,649 77,676
Scottsbluff 609,497 585,620 5,405 18,472Alliance 146,600 135,921 1,524 9,155Sidney 245,374 235,241 2,352 7,781
1/ Nebraska liable interstate payments.* Fremont was part of the Norfolk Claims Center for 2 months - July and
August 1974 - and thereafter for 10 months under Omaha.
Prepared by Research and Statistics
-42-
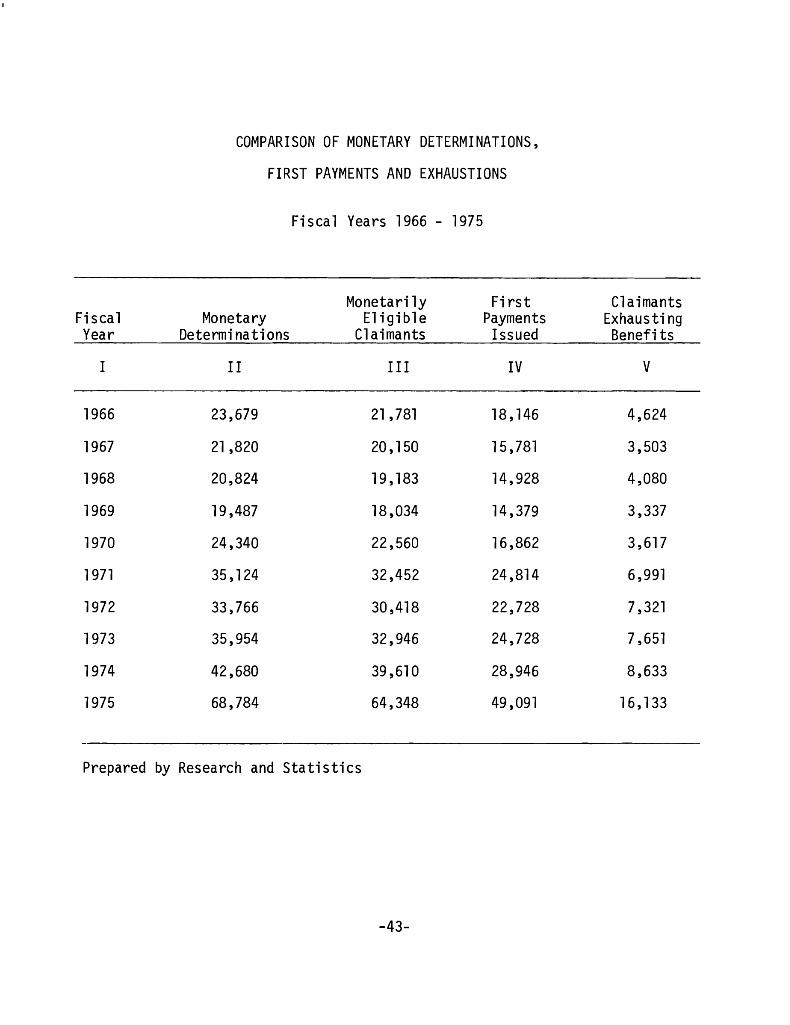
COMPARISON OF MONETARY DETERMINATIONS,
FIRST PAYMENTS AND EXHAUSTIONS
Fiscal Years 1966 - 1975
Monetarily Fi rst ClaimantsFi sca1 Monetary Eligible Payments ExhaustingYear Determi na ti ons Claimants Issued Benefits
I II III IV V
1966 23,679 21 ,781 18,146 4,624
1967 21 ,820 20,150 15,781 3,503
1968 20,824 19,183 14,928 4,080
1969 19,487 18,034 14,379 3,337
1970 24,340 22,560 16,862 3,617
1971 35,124 32,452 24,814 6,991
1972 33,766 30,418 22,728 7,321
1973 35,954 32,946 24,728 7,651
1974 42,680 39,610 28,946 8,633
1975 68,784 64,348 49,091 16,133
Prepared by Research and Statistics
-43-
----~--------------- ._---------
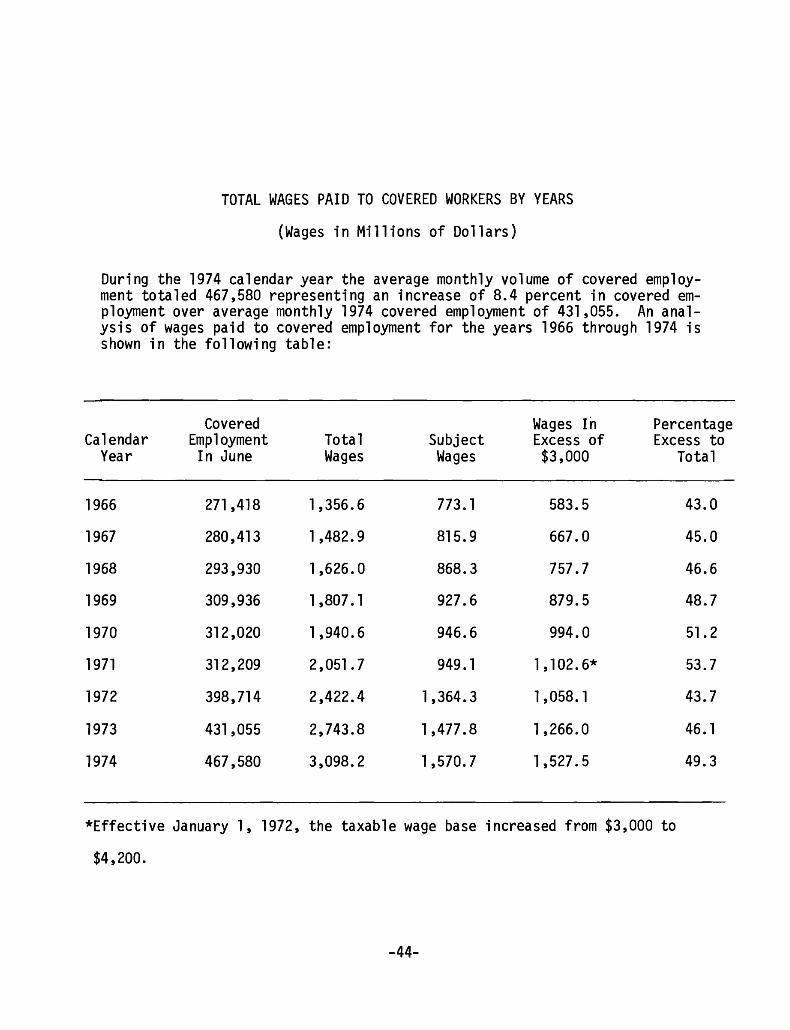
TOTAL WAGES PAID TO COVERED WORKERS BY YEARS
(Wages in Millions of Dollars)
During the 1974 calendar year the average monthly volume of covered employment totaled 467~580 representing an increase of 8.4 percent in covered employment over average monthly 1974 covered employment of 431~055. An analysis of wages paid to covered employment for the years 1966 through 1974 isshown in the following table:
Covered Wages In PercentageCalendar Employment Total Subject Excess of Excess to
Year In June Wages Wages $3,000 Total
1966 271,418 1,356.6 773. 1 583.5 43.0
1967 280,413 1,482.9 815.9 667.0 45.0
1968 293,930 1,626.0 868.3 757.7 46.6
1969 309,936 1,807 . 1 927.6 879.5 48.7
1970 312,020 1,940.6 946.6 994.0 51.2
1971 312,209 2,051.7 949.1 1,102.6* 53.7
1972 398,714 2,422.4 1,364.3 1,058. 1 43.7
1973 431,055 2,743.8 1,477.8 1,266.0 46. 1
1974 467,580 3,098.2 1,570.7 1,527.5 49.3
*Effective January 1, 1972, the taxable wage base increased from $3,000 to
$4,200.
-44-
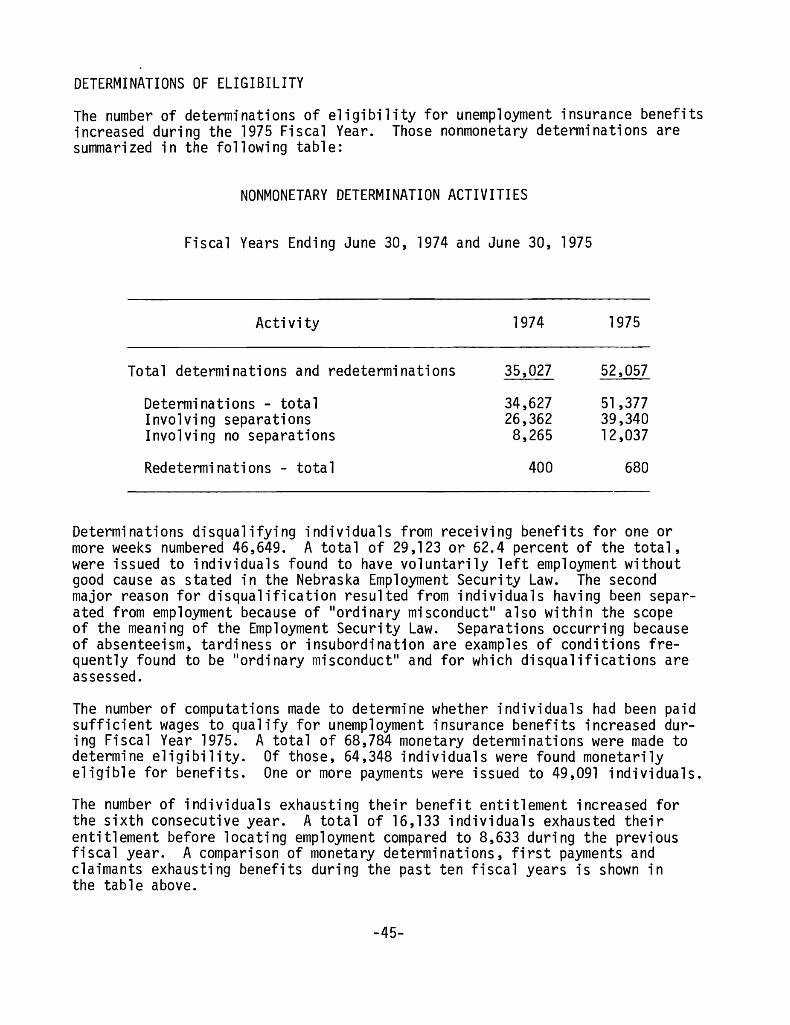
DETERMINATIONS OF ELIGIBILITY
The number of determinations of eligibility for unemployment insurance benefitsincreased during the 1975 Fiscal Year. Those nonmonetary determinations aresummarized in the following table:
NONMONETARY DETERMINATION ACTIVITIES
Fiscal Years Ending June 30, 1974 and June 30, 1975
Activity 1974 1975
Total deternri nati ons and redeterminations 35,027 52,057
Determinations - total 34,627 51,377Involving separations 26,362 39,340Involving no separations 8,265 12,037
Redeterminations - total 400 680
Determinations disqualifying individuals from recelvlng benefits for one ormore weeks numbered 46,649. A total of 29,123 or 62.4 percent of the total,were issued to individuals found to have voluntarily left employment withoutgood cause as stated in the Nebraska Emp1o~nent Security Law. The secondmajor reason for disqualification resulted from individuals having been separated from employment because of "ordinary misconduct" also within the scopeof the meaning of the Employment Security Law. Separations occurring becauseof absenteeism, tardiness or insubordination are examples of conditions frequently found to be "ordinary misconduct" and for which disqualifications areassessed.
The number of computations made to determine whether individuals had been paidsufficient wages to qualify for unemployment insurance benefits increased during Fiscal Year 1975. A total of 68,784 monetary determinations were made todetermine eligibility. Of those, 64,348 individuals were found monetarilyeligible for benefits. One or more payments were issued to 49,091 individuals.
The number of individuals exhausting their benefit entitlement increased forthe sixth consecutive year. A total of 16,133 individuals exhausted theirentitlement before locating employment compared to 8,633 during the previousfiscal year. A comparison of monetary determinations, first payments andclaimants exhausting benefits during the past ten fiscal years is shown inthe table above.
-45-
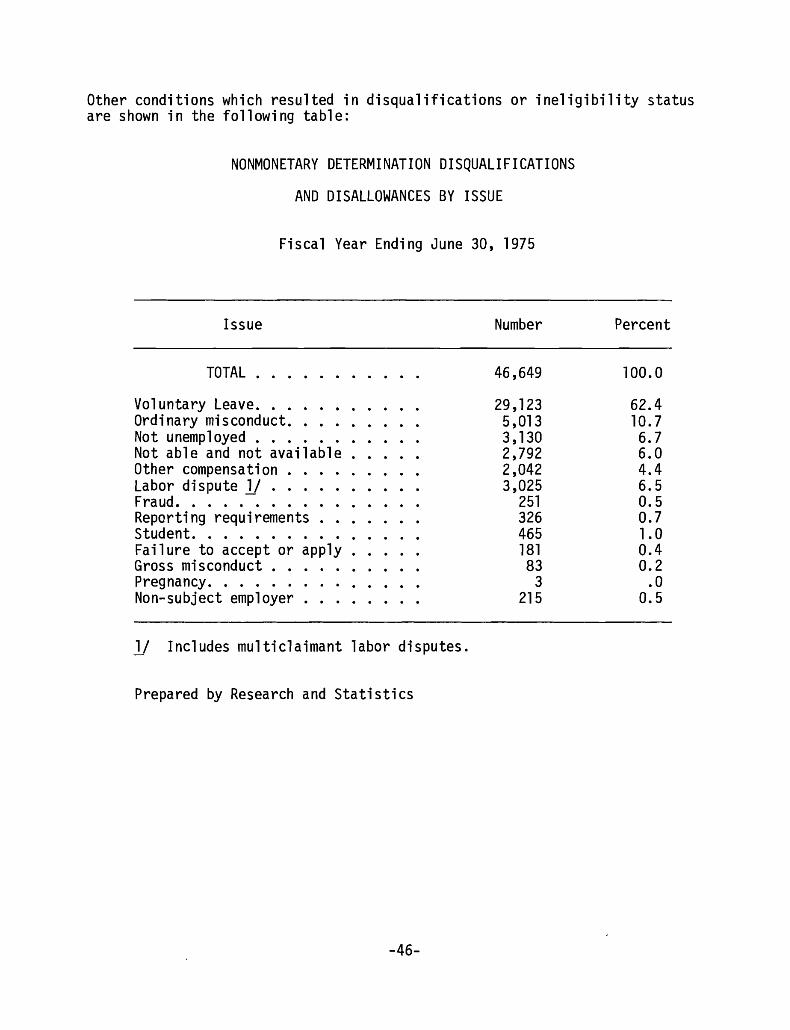
Other conditions which resulted in disqualifications or ineligibility statusare shown in the following table:
NONMONETARY DETERMINATION DISQUALIFICATIONS
AND DISALLOWANCES BY ISSUE
Fiscal Year Ending June 30, 1975
Issue Number Percent
TOTAL . 46,649 100.0
Voluntary Leave. · · · · 29,123 62.4Ordinary misconduct. · 5,013 10.7Not unemployed . · · · · · 3,130 6.7Not able and not available 2,792 6.0Other compensation . · 2,042 4.4Labor dispute 11 · · · · · 3,025 6.5Fraud. . . · · · · · · · · 251 0.5Reporting requirements . · · 326 0.7Student. . · · · · · · · · 465 1.0Failure to accept or apply. . 181 0.4Gross misconduct. · · · · · 83 0.2Pregnancy. · · · · · · 3 .0Non-subject employer . · · · . . . . 215 0.5
1/ Includes mu1tic1aimant labor disputes.
Prepared by Research and Statistics
-46-
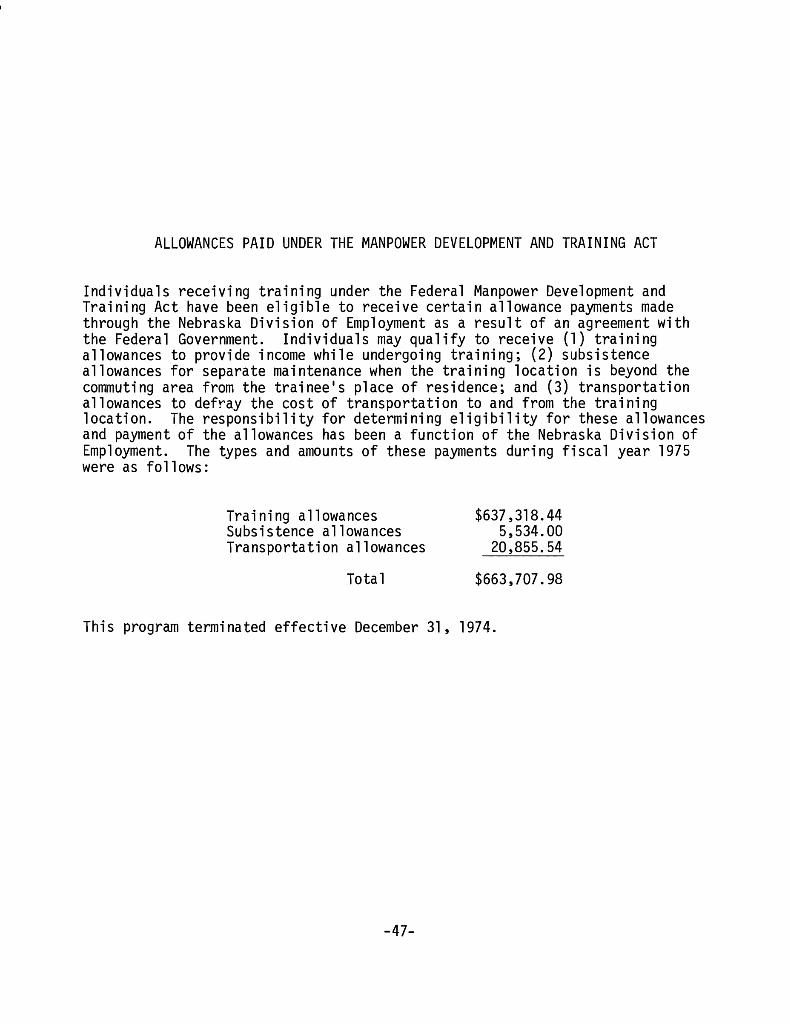
ALLOWANCES PAID UNDER THE MANPOWER DEVELOPMENT AND TRAINING ACT
Individuals receiving training under the Federal Manpower Development andTraining Act have been eligible to receive certain allowance payments madethrough the Nebraska Division of Employment as a result of an agreement withthe Federal Government. Individuals may qualify to receive (1) trainingallowances to provide income while undergoing training; (2) subsistenceallowances for separate maintenance when the training location is beyond thecommuting area from the trainee's place of residence; and (3) transportationallowances to defray the cost of transportation to and from the traininglocation. The responsibility for determining eligibility for these allowancesand payment of the allowances has been a function of the Nebraska Division ofEmployment. The types and amounts of these payments during fiscal year 1975were as follows:
Training allowancesSubsistence allowancesTransportation allowances
Total
$637,318.445,534.00
20,855.54
$663,707.98
This program terminated effective December 31,1974.
-47-
.i..
SPECIAL UNEMPLOYMENT COMPENSATION PROGRAMS
Congress passed the Emergency Unemployment Compensation Act of 1974 to crea~e
two temporary programs in response to unusually high unemployment across thenation -- Special Unemployment Assistance (SUA) and Federal Supplemental Benefits (FSB). Funds necessary for these payments were received from the FederalGovernment and, therefore, had no effect upon the Nebraska Unemployment Compensation Fund.
SPECIAL UNEMPLOYMENT ASSISTANCE (SUA)
SUA became effective on December 12, 1974, to provide for a maximum of 26 weeks·benefits to individuals employed in non-covered employment and, therefore, notentitled to regular unemployment insurance benefits. (Examples of unemployedworkers who may qualify for SUA were farm workers, domestic workers, localgovernment workers, etc.). SUA claims are based on the individua1·s earningsin the 52-week period immediately preceding the effective date of claim. Unemployed workers must meet basically the sa.me eligibility requirements for SUAas for State Unemployment Insurance.
FEDERAL - STATE EXTENDED UNEMPLOYMENT COMPENSATION PROGRAM (EB)
The Federal - State Extended Unemployment Compensation Act is a program whichbecomes effective when the unemployment climbs to specific high rates. Itspurpose is to help unemployed workers who have no further benefits availablefrom regular unemployment claims.
The periods in which this program becomes active are known as Extended Benefits(EB) period. A National Extended Benefit period triggered on effectiveFebruary 23, 1975. Unemployed workers in all States who met certain requirements may have been entitled to Extended Benefits.
Qualified individuals were entitled to receive EB in the same weekly amountreceived on the last unemployment claim. The maximum entitlement was the lesserof 13 times the weekly benefit amount or 50 percent of the total amount payableon the regular claim.
FEDERAL SUPPLEMENTAL BENEFITS (FSB)
FSB required a claimant be an exhaustee of regular compensation as well as anexhaustee of extended compensation and had no rights to any other compensationfrom any State, the Railroad Unemployment Insurance Act, any other Federal Unemployment Compensation Law, etc. Eligibility requirements for FSB are basically the same as for State Unemployment Insurance. The maximum entitlement isthe lesser of 50 percent of the total amount of regular compensation or thirteen (13) times the weekly benefit amount.
-48-
FEDERAL SUPPLEMENTAL BENEFITS - EXTENDED
The Tax Reduction Act of 1975 signed by President Ford included a provisionfor Federal Supplemental Benefits - Extended (FSB-X). This Bill, in essence,provides 100 percent of the original entitlement on a regular claim underFSB/FSB-X. After a claimant has exhausted a regular claim, EB claim, FSBclaim, and has no entitlement for any other regular claim, he may be entitledto FSB-X Benefits. The funds for these payments are received from the FederalGovernment.
FSB-X benefits are not payable after July 1, 1975, unless the date is extendedby Congress.
DISASTER UNEMPLOYMENT ASSISTANCE (DUA)
Following a tornado on May 6, 1975, Governor J. James Exon announced individuals in the tornado area in Omaha, Ralston and Magnet, Nebraska were entitledto Disaster Unemployment Assistance. Both workers and self-employed individuals who were employed in the disaster area and became unemployed as a directresult of the tornado, qualified for weekly payments from $61 to $74 per week.
Individuals were required to make application for DUA within the 30-day periodbeginning May 6, 1975, and ending on June 8, 1975.
During Fiscal Year 1975, a total of 480 DUA claims were processed with a totalof $43,134 paid.
-49-
--- -~--------

SUA COMPENSATED AND GROSS BENEFIT PAYMENT WEEKS
CLASSIFIED BY AREA CLAIMS CENTERS AND INTERSTATE UNIT
Fiscal Year Ending June 30, 1975
Office
State Total
Interstate !I
Claims Center Total
Grand IslandHastingsKearney
LincolnBeatrice
Nebraska CityFalls City
NorfolkColumbus
North PlatteMcCook
OmahaFremont
ScottsbluffAllianceSidney
Weeks Compensated Benefit paiTentsTotal Tota
14,087 $858,795
1,363 81 ,721
12,724 777,074
832 49,673233 12,963261 17,471
2,140 138,905155 10,824723 44,762420 27,363
1,229 66,718501 28,580707 44,841
43 2,3993,491 223,0091,093 56,833
706 37,08484 5,715
160 9,934
!I Nebraska liable interstate payments
Prepared by Research and Statistics
-50-

NUMBER OF COMPENSATED WEEKS OF UNEMPLOYMENT BY PROGRAM EB
CLASSFIED BY AREA CLAIMS CENTERS AND INTERSTATE UNIT
Fiscal Year Ending June 30, 1975
Weeks Compensated by Program JJ
Office All Programs UI UCFE no UI UCX Only
State Total 60,465 58,219 1,375 871
Interstate y 6,078 5,728 255 95
Claims Center Total 54,387 52,491 1,120 776
Grand Island 2,672 2,646 26 °Hastings 478 454 17 7Kearney 868 852 16 °Lincoln 7,306 7,077 130 99Beatrice 583 576 2 5
Nebraska City 1,861 1,805 31 25Falls City 697 686 ° 11
Norfo"1 k 2,537 2,442 81 14Columbus 2,047 2,007 24 16
North Platte 1,473 1,442 13 18McCook 249 249 ° °Omaha 28,356 27,111 750 495Fremont 4,012 3,927 3 82
Scottsbluff 792 785 7 °Alliance 135 111 20 4Sidney 321 321 ° °
1/ Undup1icated count of the number of weeks compensated.'II Nebraska liable interstate payments.
Prepared by Research and Statistics
-51-
------~-------------

AMOUNT OF EXTENDED BENEFITS GROSS BENEFIT PAYMENT FOR ALL PROGRAMS
CLASSIFIED BY AREA CLAIMS CENTERS AND INTERSTATE UNIT
Fiscal Year Ending June 30, 1975
Benefit Payments by Program - EB
Office Total UI UCFE UCX
State Total $3,551,459 $3,403,558 $87,625 $60,276
Interstate 11 393,983 371 ,995 15,411 6~577
Claims Center Total 3,157,476 3,031 ,563 72,214 53,699
Grand Island 151 ,613 150,166 1,447 0Hastings 25,741 24, 158 1;#065 518Kearney 48,113 47 ,461 652 0
Lincoln 423,794 408,179 8,779 6,836Beatrice 33,054 32,663 81 310
Nebraska City 102,001 98,113 2,070 1,818Fa 11 s Ci ty 36,597 35,783 0 814
Norfolk 140,402 134,342 5,044 1,016Columbus 112,01 5 109,583 1,248 1,184
North Platte 81 ,317 79,322 787 1,208McCook 13,156 13, 156 0 0
Omaha 1,696,548 1,612,883 49,726 33,939Fremont 229,934 223,964 216 5,754
Scottsbluff 39,376 39,117 259 0Alliance 6,914 5,772 840 302Sidney 16,901 16,901 0 0
11 Nebraska liable interstate payments.
-52-

NUMBER OF COMPENSATED WEEKS OF UNEMPLOYMENT BY FSB AND FSBX
CLASSIFIED BY AREA CLAIMS CENTERS AND INTERSTATE UNIT
Fiscal Year Ending June 30, 1975
Weeks Compensated
Office Total FSB FSBX
State Total 8,371 8,012 359
Interstate 11 927 890 37
Claims Center Total 7,444 7, 122 322
Grand Island 445 417 28Hastings 55 50 5Kearney 102 101 1
Lincoln 1,126 1,087 39Beatrice 50 49 1
Nebraska City 244 229 15Falls City 102 102 0
Norfolk 306 299 7Columbus 397 393 4
North Platte 128 128 0McCook 25 25 0
Omaha 3,556 3,379 177Fremont 728 697 31
Scottsbluff 133 120 13Alliance 5 5 0Sidney 42 41 1
11 Nebraska liable interstate payments.
Prepared by Research and Statistics
-53-

AMOUNT OF FSB AND FSBX GROSS BENEFIT PAYMENT CLASSIFIED
BY AREA CLAIMS CENTERS AND INTERSTATE UNIT
Fiscal Year Ending June 30, 1975
Benefit PaymentsOffice Total FSB FSBX
State Total $458,330 $439,065 $192265
Interstate Jj 53,424 51,522 1,902
Claims Center Total 404,906 387,543 17,363
Grand Island 24,929 23,309 1,620Hastings 3,176 2,854 322Kearney 5,625 5,555 70
Lincoln 61,284 59,188 2,096Bea tri ce 2,886 2,812 74
Nebraska City 12,875 12,157 718Fa 11 s Ci ty 4,818 4,818 0
Norfolk 16,308 15,952 356Columbus 19,987 19,827 160
North Platte 5,733 5,733 0McCook 1,240 1,240 0
Omaha 198,332 188,649 9,683Fremont 38,956 37,388 1,568
Scottsbluff 6,712 6,070 642Alliance 150 150 0Sidney 1,895 1,841 54
Jj Nebraska liable interstate payments.
Prepared by Research and Statistics
-54-
g i

U I C L A I M S T A KIN G ACT I V I T Y
B Y S P E C I ALP R 0 G RAM S
Fiscal Year 1975
EBInitial Continued
FSB FSBX SUAInitial Continued Initial Continued Initial Continued
STATE TOTAL
Interstate Unit
Claims Center Total
Grand Island
Lincoln
Nebraska City
Norfolk
North Platte
Omaha
Fremont
Scottsbluff
10,292
1,110
9,182 !I
764
1,426
485
839
314
4,433
645
276
56,090
4,913
51,177 Y4,134
7,029
2,592
4,620
1,624
26,092
3,827
1,259
2,298
251
2,047 11
136
344
144
178
43
966
186
50
7,789
1,132
6,657 Y
563
1,096
318
757
142
2,949
680
152
240
o
240 !I--3 '.J
174
33
141 Y
15
25
4
22
o
54
10
11
4,190
288
3,902 !I
411
551
254
539
141
1,446
318
242
17,239
1,924
15,315 Y2,108
2,554
1,609
1,892
1,071
3,765
1,178
1,138
Prepared by Research and Statistics
1/ Includes new, transitional, additional and interstate claims filed in Nebraska.
y Includes continued intrastate and interstate claims filed in Nebraska.
~/ Processed in administrative office.
-55-

U NEM P LOYMENT INSURANCE AREA CLAIM CENTERS
• n d
ITINERANT POINTS
CD:'
~c.
,;~o~"V":>Oi,:AHA
B\.~Ll
1114,'£R
~E"'AkGluRk York I00 •
S((~OLl.>
\o\)SE
ANfEWI'E
r.Rlt:~E¥
f'RA~~I.I"
Ord(\
~"I ' t,'
SHERIIAN
OINeill "
'. .,'.'.
t1l)l.T
Kearney
.,."" '~/e:- • - -I - ~IJRAND ISI.JJ\
I l HAMIl.T' I' , ...J.J-A..,....,.UA...,-II,-=-.-1,.".,.------- ,""" !,.u" I
Ha~tingS
I'HI::LI'S I K[.\IlSEY
........
HAIU.AN
ROC~
f)SI'I::~
['A·.·,~L~
u;rA "A"I.
......."0
Lexi."'~ton
\
LOGAN • LsTER
HITlHLOCol
~INCOLN
HA y~:..r;
IICPlIFRSUN
Ogallala0-. •
'RTHlR
tiTH
.HI:llIIY
DUHDY
,'I.RKI~S
-HAS;:
J I (''-'VU~.'I\. I I I 1!5,,-_....1,,__":""'__, . " _ ....." _ ....1__1.........1 I I I I )C:
IIEUI:LSidney
,;rJ\.'l\ IOA"'U
'Ai'<~tR
Valentine().............. h:KO\\"......... .
• 1.Ains:vorth ........
00' urn ',. \
• . I/ .. f) Allia~Ce ,,,1>, I h'.I\"."" l.AI"1:: l.Ul:I' -IIoA"tlll.D I .. ilHUk
$<..UT:7 l'i; /IIUIlJiIl.l. _. _
, ~;01'l'S.GLUFF.
AREA CLAIM CENTERS WEEKLY ITINE~~T POINTS BI-WEEKLY ITINERANT POINTS OY~HA SATELLITE OFF.ICES
Grand IslandLincolnNebraska CityNorfolkNorth PlatteOmaha,Scottsbluff
AllianceBeatriceColumbusFalls CityHastingsKearneyLexingtonHrr.o()l~
-56-
AinsworthEmersonOgallalaO'NeillOrdValentineYork
BellevueFremontNorth OmahaPapillion
DailyDailyDailyDaily

AREA CLAIMS CENTERS
OFFICE MANAGER LOCATION
Grand Island Kenneth Keown 724 West Koenig
Lincoln Lester Alber 1410 IIQII Street
Nebraska City Walter H. Burns 905 Third Corso
Norfolk Kenneth Boche 119 Norfolk Avenue
North Platte Lowell Lape 114 South Chestnut
Omaha Gus Carlson 5404 Cedar Street
Scottsbluff Allan Amsberry 1809 Avenue A
-57-


