Berger, W.H., Kroenke, L.W., Mayer, L.A., et al., 1993 Proceedings of the Ocean Drilling Program, Scientific Results, Vol. 130 39. VARIATIONS OF POROSITY IN CALCAREOUS SEDIMENTS FROM THE ONTONG JAVA PLATEAU 1 Franck C. Bassinot, 2 Janice C. Marsters, 3 Larry A. Mayer, 4 and Roy H. Wilkens 3 ABSTRACT Based on index properties measurements made on board the JOIDES Resolution, we studied porosity changes with depth in the fairly homogeneous deep-sea calcareous sediments cored during Ocean Drilling Program Leg 130 on the Ontong Java Plateau. Using Leg 130 data, we present evidence that the rate of porosity decrease with burial in calcareous oozes and chalks is related to the depth of deposition and thus probably depends on the "conditioning" of calcareous sediments by winnowing or dissolution processes during the time of deposition. The ooze-to-chalk transition is not clearly reflected in porosity profiles. In the ooze-chalk sections studied (the upper 600 mbsf), mechanical compaction is most likely the major process controlling the porosity decrease with depth of burial, whereas the chalk-limestone transition (at about 1100 mbsf at Site 807) is characterized by an intense chemical compaction leading to a drastic decrease in porosity values within 100 m. In oozes and chalks, porosity values were corrected to "original" (uncompacted) values using site-specific empirical regression equations. When plotted vs. age, corrected porosity profiles appear to correlate quite well from site to site in the sediments deposited during the last 15 m.y. This observation has considerable implications for seismic stratigraphy. Our attempt to correlate variations in porosity (or wet-bulk density) profiles with changes in carbonate content remained unsatisfactory. Index properties changes are likely caused by changes in the foraminifer content. If this is the case, we propose that large-scale porosity fluctuations that correlate from site to site are the result of changes in the surface productivity that lead to changes in the foraminifers-to-nannofossils ratio. INTRODUCTION Based on Deep Sea Drilling Project (DSDP) and Ocean Drilling Program (ODP) data, numerous studies have been conducted on changes of porosity and wet-bulk density with depth of burial and age in pelagic calcareous sediments (Schlanger and Douglas, 1974; Hamilton, 1976; Milholland et al., 1980; Kim et al., 1985; Wilkens and Handyside, 1985). Reduction in porosity with burial (and a concomitant increase in wet-bulk density) is controlled by two main mechanisms: (1) mechanical compaction, the dewatering of sedi- ments and reorientation and repacking of grains; and (2) chemical compaction, the dissolution of calcite at grain contacts and the precipitation of authigenetic calcite in voids and at sites of lesser stress (a good review of burial diagenesis processes can be found in Scholle and Halley, 1985). These compaction processes are complex. They not only depend on the continuous increase of overburden pressure with burial but are also controlled by many other factors, such as sediment composition or local heat flow value (which both play a major role in chemical compaction (e.g., Schlanger and Douglas, 1974; Wetzel, 1989). De- spite this complexity, many efforts have been dedicated to the quan- tification and modeling of porosity and density changes with burial. Modeling is useful for numerous basic or applied purposes, such as gravity studies of the oceanic crust (Hamilton, 1976), the prediction of elastic wave velocities in seismic interpretation (Hamilton, 1976), or the quantification of pore fluid migration in compacting sedimen- tary sections (Einsele, 1977; de Caritat, 1989). Furthermore, if burial effects on porosity and density can be quantified, corrections can be applied to retrieve "original" (uncompacted) porosity and density 1 Berger, W.H., Kroenke, L.W., Mayer, L.A., et al., 1993. Proc. ODP, Sci. Results, 130: College Station, TX (Ocean Drilling Program). 2 Laboratoire de Géologie du Quaternaire, Case 907, CNRS-Luminy, 13288 Marseille Cedex 9, France. 3 Department of Geology and Geophysics, School of Ocean and Earth Science and Technology, University of Hawaii, 2525 Correa Road, Honolulu, HI 96822, U.S.A. 4 Ocean Mapping Group, Department of Surveying Engineering, University of New Brunswick, P.O. Box 4400, Fredericton, New Brunswick E3B 5A3, Canada. values. These original values only depend on changes in sediment composition and therefore provide valuable information on deposi- tional processes and on changes in the sedimentary environment. Recent works have shown the importance of these corrections in high-resolution studies using continuously recorded physical proper- ties logs. For instance, in piston cores from the eastern equatorial Pacific, Mayer (1979) has shown that wet-bulk density can be used as a proxy for carbonate content. In DSDP/ODP sites from that area, when densities are corrected for burial effects, the continuous and high-resolution record of density obtained with the gamma-ray at- tenuation porosity evaluator (GRAPE) can be used to provide ultra- high resolution carbonate curves (Mayer, 1991). High-resolution studies of density and porosity changes recorded with the GRAPE have recently been proposed for deep-sea calcareous sediments of other areas (Herbert and Mayer, 1991). For such studies, it is neces- sary to quantify accurately porosity and density changes with burial. Mainly because of their implications in oil recovery, numerous studies have been conducted on predictive equations and the model- ing of porosity loss with increasing depth of burial in terrigenous sediments (Athy, 1930; Hedberg, 1936). There is less work on deep- sea pelagic sediments. Based on DSDP data, Hamilton (1976) empiri- cally derived polynomial equations of porosity and density vs. depth for various types of deep-sea sediments (pelagic clay, radiolarian ooze, diatomaceous ooze, and calcareous ooze). These generalized equations give an approximate idea of how porosity evolves with depth of burial. However, understanding burial effects in deep-sea sediments, and especially in pelagic calcareous sediments, still re- quires much work. During Leg 130, nearly 4800 m of pelagic calcareous sediments were recovered from 16 holes drilled at 5 sites (803-807) on a depth transect located in the northeastern part of the Ontong Java Plateau (Fig. 1; Kroenke, Berger, Janecek, et al., 1991). The absence of major disturbances in the sediment column at 4 of the 5 sites as well as the compositional homogeneity of these calcareous sediments at each site seemed to be very promising for a study of burial effects on the porosities of pure calcareous pelagic sediments. These data are also very interesting in a study of the relationship between index properties and sediment composition. The high quantity and good quality of 653
Transcript
Berger, W.H., Kroenke, L.W., Mayer, L.A., et al., 1993Proceedings of the Ocean Drilling Program, Scientific Results, Vol. 130
39. VARIATIONS OF POROSITY IN CALCAREOUS SEDIMENTSFROM THE ONTONG JAVA PLATEAU1
Franck C. Bassinot,2 Janice C. Marsters,3 Larry A. Mayer,4 and Roy H. Wilkens3
ABSTRACT
Based on index properties measurements made on board the JOIDES Resolution, we studied porosity changes with depth inthe fairly homogeneous deep-sea calcareous sediments cored during Ocean Drilling Program Leg 130 on the Ontong Java Plateau.
Using Leg 130 data, we present evidence that the rate of porosity decrease with burial in calcareous oozes and chalks is relatedto the depth of deposition and thus probably depends on the "conditioning" of calcareous sediments by winnowing or dissolutionprocesses during the time of deposition. The ooze-to-chalk transition is not clearly reflected in porosity profiles. In the ooze-chalksections studied (the upper 600 mbsf), mechanical compaction is most likely the major process controlling the porosity decreasewith depth of burial, whereas the chalk-limestone transition (at about 1100 mbsf at Site 807) is characterized by an intense chemicalcompaction leading to a drastic decrease in porosity values within 100 m.
In oozes and chalks, porosity values were corrected to "original" (uncompacted) values using site-specific empirical regressionequations. When plotted vs. age, corrected porosity profiles appear to correlate quite well from site to site in the sedimentsdeposited during the last 15 m.y. This observation has considerable implications for seismic stratigraphy.
Our attempt to correlate variations in porosity (or wet-bulk density) profiles with changes in carbonate content remainedunsatisfactory. Index properties changes are likely caused by changes in the foraminifer content. If this is the case, we proposethat large-scale porosity fluctuations that correlate from site to site are the result of changes in the surface productivity that leadto changes in the foraminifers-to-nannofossils ratio.
INTRODUCTION
Based on Deep Sea Drilling Project (DSDP) and Ocean DrillingProgram (ODP) data, numerous studies have been conducted onchanges of porosity and wet-bulk density with depth of burial andage in pelagic calcareous sediments (Schlanger and Douglas, 1974;Hamilton, 1976; Milholland et al., 1980; Kim et al., 1985; Wilkensand Handyside, 1985). Reduction in porosity with burial (and aconcomitant increase in wet-bulk density) is controlled by two mainmechanisms: (1) mechanical compaction, the dewatering of sedi-ments and reorientation and repacking of grains; and (2) chemicalcompaction, the dissolution of calcite at grain contacts and theprecipitation of authigenetic calcite in voids and at sites of lesserstress (a good review of burial diagenesis processes can be found inScholle and Halley, 1985).
These compaction processes are complex. They not only dependon the continuous increase of overburden pressure with burial but arealso controlled by many other factors, such as sediment compositionor local heat flow value (which both play a major role in chemicalcompaction (e.g., Schlanger and Douglas, 1974; Wetzel, 1989). De-spite this complexity, many efforts have been dedicated to the quan-tification and modeling of porosity and density changes with burial.Modeling is useful for numerous basic or applied purposes, such asgravity studies of the oceanic crust (Hamilton, 1976), the predictionof elastic wave velocities in seismic interpretation (Hamilton, 1976),or the quantification of pore fluid migration in compacting sedimen-tary sections (Einsele, 1977; de Caritat, 1989). Furthermore, if burialeffects on porosity and density can be quantified, corrections can beapplied to retrieve "original" (uncompacted) porosity and density
1 Berger, W.H., Kroenke, L.W., Mayer, L.A., et al., 1993. Proc. ODP, Sci. Results,130: College Station, TX (Ocean Drilling Program).
2 Laboratoire de Géologie du Quaternaire, Case 907, CNRS-Luminy, 13288 MarseilleCedex 9, France.
3 Department of Geology and Geophysics, School of Ocean and Earth Science andTechnology, University of Hawaii, 2525 Correa Road, Honolulu, HI 96822, U.S.A.
4 Ocean Mapping Group, Department of Surveying Engineering, University of NewBrunswick, P.O. Box 4400, Fredericton, New Brunswick E3B 5A3, Canada.
values. These original values only depend on changes in sedimentcomposition and therefore provide valuable information on deposi-tional processes and on changes in the sedimentary environment.
Recent works have shown the importance of these corrections inhigh-resolution studies using continuously recorded physical proper-ties logs. For instance, in piston cores from the eastern equatorialPacific, Mayer (1979) has shown that wet-bulk density can be usedas a proxy for carbonate content. In DSDP/ODP sites from that area,when densities are corrected for burial effects, the continuous andhigh-resolution record of density obtained with the gamma-ray at-tenuation porosity evaluator (GRAPE) can be used to provide ultra-high resolution carbonate curves (Mayer, 1991). High-resolutionstudies of density and porosity changes recorded with the GRAPEhave recently been proposed for deep-sea calcareous sediments ofother areas (Herbert and Mayer, 1991). For such studies, it is neces-sary to quantify accurately porosity and density changes with burial.
Mainly because of their implications in oil recovery, numerousstudies have been conducted on predictive equations and the model-ing of porosity loss with increasing depth of burial in terrigenoussediments (Athy, 1930; Hedberg, 1936). There is less work on deep-sea pelagic sediments. Based on DSDP data, Hamilton (1976) empiri-cally derived polynomial equations of porosity and density vs. depthfor various types of deep-sea sediments (pelagic clay, radiolarianooze, diatomaceous ooze, and calcareous ooze). These generalizedequations give an approximate idea of how porosity evolves withdepth of burial. However, understanding burial effects in deep-seasediments, and especially in pelagic calcareous sediments, still re-quires much work.
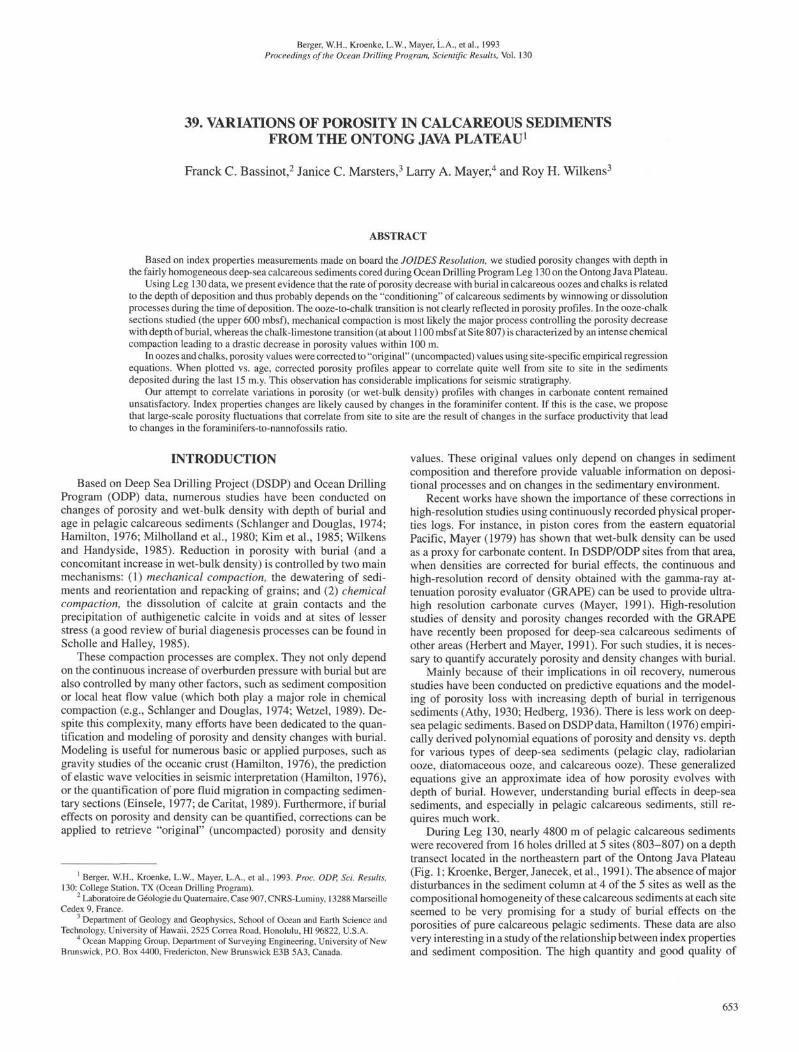
During Leg 130, nearly 4800 m of pelagic calcareous sedimentswere recovered from 16 holes drilled at 5 sites (803-807) on a depthtransect located in the northeastern part of the Ontong Java Plateau(Fig. 1; Kroenke, Berger, Janecek, et al., 1991). The absence of majordisturbances in the sediment column at 4 of the 5 sites as well as thecompositional homogeneity of these calcareous sediments at each siteseemed to be very promising for a study of burial effects on theporosities of pure calcareous pelagic sediments. These data are alsovery interesting in a study of the relationship between index propertiesand sediment composition. The high quantity and good quality of
Figure 1. Locations of Leg 130 and previous DSDP drilling sites on the northeastern portion of the Ontong Java Plateau. Bathymetric contours are in meters.
index-properties laboratory measurements at Leg 130 sites wereespecially suitable for such studies.
SITE SELECTION
To obtain the simplest signal of burial compaction, we decided tostudy only sections that were not affected by major postdepositionalreworking. Seismic lines recorded when approaching Site 804 clearlyshow that this site was affected by mass movement. Seismic profilesexhibit irregular seismic reflections and show evidence of wedging.Physical properties profiles at Site 804 reflect these major sedimentdisturbances. Intervals of anomalously low porosities have beeninterpreted as reflecting rapid consolidation caused by enhanceddewatering during slumping (Kroenke, Berger, Janecek, et al., 1991).Thus, we did not study Site 804.
The four sites selected for this study provide a nearly continuousrecord of calcareous pelagic sediments deposited at different waterdepths on the Ontong Java Plateau: Sites 803 (3410 m), 805 (3188 m),806 (2520 m), and 807 (2805 m). Of special interest is the study ofSites 803, 805, and 806. These sites are close geographically and liebeneath pelagic ocean waters that display homogeneous biogenicproductivity such that the quantity and composition of sedimentsupply can be assumed to have always been equivalent. Therefore,differences in physical properties and in compaction behavior at thesesites can be ascribed to dissolution and winnowing effects on sedi-ment composition during the time of deposition. We studied porositychanges in the calcareous ooze and chalk interval within the upper600 mbsf at Sites 803, 805, 806, and 807, and porosity changes inlimestone at Site 807.
METHODS
Fulthorpe et al. (1989) have shown that logging data from theOntong Java Plateau yield a reliable measure of in-situ sedimentphysical properties. In this study, however, we chose to use shipboardlaboratory porosity and density values instead of borehole log valuesfor two reasons: (1) laboratory profiles cover the entire sedimentarysections, whereas logged profiles start at about 100 mbsf; and (2)sedimentological analyses (such as carbonate content) were per-formed on the same sample taken for index properties measurements.
Thus, cross-correlation studies of index properties and sedimentcomposition are easier with shipboard index properties data.
We were aware that elastic rebound caused by the removal ofoverburden pressure, which has been observed in other deposits(Hamilton, 1976; Marine Geotechnical Consortium, 1985), may haveled to small discrepancies between the shipboard laboratory porosityand density values and the true in-situ values. However, Urmos et al.(this volume), by comparing Leg 130 laboratory and log density andporosity data, show that differences between in-situ and lab valuesare very small (l%-2%) and remain relatively constant with burial.Such results imply that pelagic carbonate sediments on the OntongJava Plateau have undergone mostly plastic deformation during burialand thus show little elastic rebound of their mineral matrix whenretrieved from borehole and brought to laboratory conditions. Thisconclusion is supported by results of laboratory consolidation tests.These tests performed on ooze and chalk samples from Sites 803 and807 yielded estimates of mechanical porosity rebound of <O. 1 % overa 1000-m equivalent depth range (Lind, this volume). Urmos et al.(this volume) applied a simple hydraulic rebound correction to thelaboratory data that compensates for pore fluid expansion during corerecovery. This correction is very small and relatively constant, so itdoes not affect significantly the total amounts of porosity and theporosity-depth trends. Therefore, in this study, we did not find itnecessary to correct shipboard measurements to in-situ values. Weshall keep in mind, however, that in-situ porosities are slightly lowerthan shipboard measured values.
Porosities (Φ) and wet-bulk densities (WBD) of discrete sampleswere calculated on board the JOIDES Resolution from measurementsof wet and dry weights and dry volume. Sample weights were deter-mined to a precision of ±0.01 g using a Scitech electronic balance.Volumes were determined using a Quantachrome Penta-pycnometer(a helium-displacement pycnometer). The Quantachrome pycnometermeasured volumes to an approximate precision of 10"4 cm3.
At Site 803 (the first site of Leg 130), each sample was run twicethrough the pycnometer for wet and dry volumes. It quickly becameapparent that the samples from subsequent sites should only be runonce if we were to keep up with the desired sampling frequency.Furthermore, dry volumes measured by the pycnometer are probablymore accurate than wet volumes because the presence of volatiles inthe wet samples may result in erroneous pressure readings. Therefore,
654
CALCAREOUS SEDIMENT POROSITY, ONTONG JAVA PLATEAU
for subsequent Leg 130 sites, only dry samples were run through thepycnometer. Dry weight and volume measurements were obtainedafter the samples were oven dried at 110°C for 24 hr and allowed tocool in a desiccator.
Porosity was calculated from the wet and dry weights (Ww and Wd,respectively) and dry volume (Vd). The wet volume (Vw) was calcu-lated by adding the volume of the water lost through drying of thesample to the dry volume, using the following equation:
Porosity (%)
40 50 60 70 80 90
Vw=Vd+[(Ww-Wd)/df], (1)
where df is the density of evaporated water (assumed equal to 1 g/cm3
at laboratory conditions). The dry volume, Vj, includes both thevolume of the sediment or rock constituents and the volume of saltremaining in the dry sample. Salt-corrected porosity (Φ) was thencalculated according to Hamilton (1971) assuming a 35-ppt intersti-tial fluid salinity and a seawater density of 1.0245 g/cm3 at labora-tory conditions:
= [(Ww - Wd)/(l - O.O35)]/[ 1.0245 • VJ, (2)
Wet-bulk density (WBD) was calculated using the calculated wetvolume (Vw; Eq. 1) and the wet weight (Ww) according to Boyce'sequation (1973):
WBD = WJVW. (3)
POROSITY CHANGES WITH BURIAL
Sediment Composition, Porosity,and Wet-bulk Density Changes
The sediments retrieved in the upper 600 mbsf at the Leg 130 sitesconsist of Pleistocene to upper Eocene calcareous oozes and chalksmade of nannofossils with varying amounts of foraminifers. At eachsite, because of the fairly uniform sediment composition, sedimentarysequences were divided into subunits based on the degree of consoli-dation. At Site 807, Eocene to Cretaceous limestones were coredbetween 1098 and 1351 mbsf.
In the intervals studied, the mineralogical composition of OntongJava Plateau sediments is dominated by biogenic calcite with variable,but minor, amounts of biogenic silica (nonbiogenic components al-ways represent <5% abundance). If we except small ash layers andsome Eocene radiolarian-rich intervals (at Site 807), the carbonatecontent of the calcareous sediments is usually high, ranging from 80%to 95%.
In Figure 2, porosity-depth curves of the upper 600 mbsf arepresented for Holes 803D, 8O5B, 806B, and 807A. Profiles show aclear trend of decreasing porosity with depth of burial. Porosityranges from about 72% at the tops of sections to values as low as40% (around 600 mbsf in Hole 803D).
Ooze-chalk transitions, as assigned by sedimentologists on boardLeg 130, are marked by small arrows in Figure 2 (Site 803: 217 mbsf;Site 805: 294 mbsf; Site 806: 339 mbsf; and Site 807: 293 mbsf).Whatever the site considered, no evidence exists for a clear changein the porosity-depth trend at about the ooze-chalk transition.
Superimposed on the general trends of decreasing porosities withburial are second-order fluctuations of tens of meters of wavelength(Fig. 2). These fluctuations probably reflect changes in sedimentcomposition. They will be studied in more detail in the followingsection when porosity profiles are corrected to "original" values.
Density curves are not presented in this paper because porosityand density profiles are mirror images of one another, as shown bythe high correlation coefficients of regression equations calculated forthe porosity vs. density plots displayed in Figure 3. In marine sedi-ments, wet-bulk density (WBD) depends on porosity (Φ) and on graindensity (D ):
J O
Q_CDQ
o -
100 -
200 -
-
300 -
_-
400 -
500 -
i i i i I i i i i I i i i i I i i i i I i i i i
2J /--;-. ~jXèp-
Site 805
Site 803 <+5%>(true scale)
Site 806(+10%)
Site 807(+15%)
Figure 2. Porosity-depth curves for Holes 803D, 805B, 806B, and 807Aplottedwith exponential regression curves calculated at each site (regression equationsare given in Table 1). Arrows indicate ooze-chalk transitions as identified bysedimentologists on board Leg 130.
Φ I L + (1-Φ) ö« (4)
where Dw = the density of interstitial water.In Leg 130 sites, because of the fairly homogeneous mineralogical
composition of the sediments (dominated by biogenic calcite), graindensity at all sites averages 2.68 g/cm3 (calcite has a grain density of2.7 g/cm3) and shows minor-amplitude changes (see "Physical Prop-erties" chapters in Kroenke, Berger, Janecek, et al., 1991). Interpolat-ing the wet-bulk density at the zero porosity point for Site 807 (Fig. 3)shows that for this site, where high carbonate contents were measured(up to 99%), the mean grain density is 2.719 g/cm3, the grain densityof pure calcite. In Equation 4, porosity is the only variable thatdisplays large-amplitude changes, thus explaining the good density-porosity relationship.
As seen above, sediment drilled at all Leg 130 sites are fairlyuniform in composition (calcareous sediments made of nannofossilswith varying amounts of foraminifers). At each site, considering theabsence of major changes in the sedimentary column, we assumedthat the general trend of decreasing porosity with depth of burial onlyresults from compaction processes (mechanical or chemical). Giventhis assumption, compaction effects in ooze and chalk intervals wereempirically quantified by applying standard regression techniques onporosity-depth data from the upper 600 mbsf at Sites 803, 805, 806,and 807 (porosity-depth profiles at each site were obtained by merg-
Figure 3. Regression of wet-bulk density vs. porosity for Sites 803, 805, 806, and 807.
y=2.719-00723x, R=O.996
40 45 50 55 60 65 70 75
Porosity (%)
ing data sets from the different holes). Calculations showed thatsmooth exponential equations satisfactorily fit the porosity-depthcurves. The regression curves are superimposed on the measuredporosity-depth profiles in Figure 2, and the regression equations arepresented in Table 1. Site 803, however, displays a little divergencefrom the regression curve below 250 mbsf. From the top of the sectionto 250 mbsf, the exponential equation fits the porosity-depth curvewell. At about 250 mbsf, a small drop in porosity values marks thebeginning of an interval that shows only minor decreases in porositywith depth of burial and thus diverges from the regression curve. Thereason for this remains unexplained at present although it is worthnoting that the top of this interval corresponds to a hiatus spanningalmost 5 m.y. between 15 and 20 Ma.
Regression equations at all sites yield nearly identical porosityvalues (around 69%) at the sediment surface (Fig. 2 and Table 1). Thismeans that porosities in uncompacted sediments fluctuate aroundmean values that are fairly identical whatever the depth of deposition.Hamilton et al. (1982) had shown that porosity values of surficialsediments show only little change in a depth transect on the flank ofthe Ontong Java Plateau. In Ontong Java Plateau sediments, a signifi-cant amount of foraminifers is present. Because these foraminifertests are hollow, they result in higher porosity sediment than similar-sized solid particles and cause intraparticle porosity (i.e., voids
within tests) as well as interparticle porosity (Hamilton et al., 1982;Bachman, 1984). Hamilton et al. suggested that "the small change intotal porosity with water depth for the Plateau samples is a result ofthe intraparticle porosity being gradually transferred to interparticleporosity as the test walls on the sand-sized Foraminifera break downunder dissolution which increases with water depth" (Hamilton et al.,1982, pp. 742-743).
Porosity Changes with Depth of Burial:Mechanical vs. Chemical Compaction
Based on DSDP data, Schlanger and Douglas (1974) proposed adiagenetic model for calcareous sediments. In this model, two stagesare present in the reduction of porosity with depth of burial: (1) anearly dewatering stage in the upper 200 mbsf, in which porosity isreduced from about 80% to 60% and the dominant mechanism ismechanical compaction; and (2) a slower dewatering stage in whichporosity is reduced from about 65% to 40% between 200 and1000 mbsf and the dominant mechanism is cementation. Recentstudies have shown that the initiation of cementation through solu-tion-precipitation mechanisms may occur more rapidly (after burialof a few tens of meters) in the calcareous sedimentary column, withcement reaching about 25% of the solid volume at the ooze-chalk
656
CALCAREOUS SEDIMENT POROSITY, ONTONG JAVA PLATEAU
Table 1. Equations of the regression curves that fit porosity-depth profilesat Sites 803, 805, 806, and 807, and mean grain sizes measured in oozescored at these same sites.
Sites
803
805
806
807
Water depths(mbsl)
3410
3188
2520
2805
Regression equationsand
compaction parameters
0=68.6 exp(-0.00075.z)ß=O 00075
0=70.2 exp(-0.00076.Z)ß = O. 00076
0=69.2 exp(-0.00045.z)ß=O.00045
0=69.6 exp(-0.00051.z)ß=O.00051
Mean grain sizes(µm)
20
18
25
29
transition (Wetzel, 1989). However, in Leg 130 sites, this is not thecase. Based on consolidation test results and on SEM observations,Lind (this volume) concludes that apparently chemical compaction isof minor importance in ooze and chalk samples from Sites 803 and807. Furthermore, no marked change exists in the trends of theporosity-depth curves within the ooze-chalk intervals studied (Fig.2). The fact that "smooth" exponential curves can satisfactorily fit theporosity-depth profiles might indicate that the processes that reducepore space in oozes and chalks act continuously from the sedimentsurface to about 600 mbsf. Given these observations, we concludethat mechanical compaction is most likely the major process actingthroughout the entire ooze-chalk sections studied.
Site 807 provides a good opportunity to study the compactioneffects on porosity at deeper depths in limestone. At this site, sedimentscored consist of Pleistocene to Cretaceous ooze to limestone calcareoussediments. Radiolarian-rich intervals and chert layers of Eocene agewere encountered. Samples with carbonate content lower than 90%were removed from our data base. Thus, by looking at porosity changesin fairly homogeneous sediments (in terms of carbonate content), wefocused only on compaction processes and avoided effects caused byimportant changes in sediment composition.
The compaction model calculated for the upper 600 m of theooze-chalk interval of Site 807 was interposed into the limestoneinterval and was superimposed on the measured porosity-depth pro-file (Fig. 4). Clear divergences from the compaction model are seenin the deep part of Site 807.
The rate of porosity loss is maximum between 1050 and 1150 mbsf,with porosity being reduced from 48% to about 15% within 100 m.This rapid decrease corresponds to the onset of limestone formationthat first appears at about 1000 mbsf and is dominant below 1100 mbsf(chalk-limestone transition at 1100 mbsf, in Kroenke, Berger, Janecek,et al., 1991). Smear slides indicate that between 1060 and 1140 mbsfa transition occurs from material dominated by calcareous nannofossilsto material dominated by unidentified carbonate particles. Below1140 mbsf, these unidentified carbonate particles constitute up to 90%of the limestone. We assume that these unidentified carbonate particlesare authigenetic calcite precipitated during chemical compaction proc-esses. Thus, below 1140 mbsf, most of the initial biogenic carbonatehas been reprecipitated into authigenetic calcite. Below about700 mbsf, occurrences of small microstylolites have been noted bysedimentologists (Kroenke, Berger, Janecek, et al., 1991). With in-creasing depth of burial, these microstylolites grade into flaser struc-tures and well-developed stylolites. These stylolites are especially welldeveloped in the limestone interval. All these observations clearlyshow that the drastic porosity reduction at the chalk-limestone transi-tion is caused by major chemical compaction processes.
Stylolite-like features indicate that calcite has been removed al-most totally from some intervals. This calcite is available for theinfilling of the void space of adjacent layers. Thus, porosity reduction
not only results from changes in the shape and distribution of solidsin a given volume of sediment but also (mainly?) from the introduc-tion of "external" solids (calcite) that come from nearby stylolite-likelayers. Why such a drastic chemical compaction occurs so rapidly atabout the chalk-limestone transition still remains under question.
Differences in Compaction Behavior among Leg 130 Sites
The regression curves displayed in Figure 5 clearly show that,despite the almost identical porosity values at the sediment surface,rates of porosity loss with burial vary from site to site depending onthe water depth. Rates at the deeper sites (Sites 803 at 3410 m, andSite 805 at 3188 m) are higher than those at the shallower sites(Sites 806 at 2520 m, and Site 807 at 2805 m; Fig. 5). Sites 803, 805,and 806 are close geographically so that the quantity and compositionof the sediment supply have always been equivalent. Thus, differ-ences in compaction behavior can be confidently ascribed to "condi-tioning" of the sediments during the time of deposition by eitherdissolution processes or current winnowing at the seafloor. Thecompaction behavior of Ontong Java Plateau sediments changesrapidly between water depths of 2800 and 3200 m, which correspondto those at Sites 805 and 807 respectively.
In surficial sediments from Ontong Java Plateau, studies haveshown that dissolution and winnowing lead to the reduction of meangrain size with depth of deposition (Johnson et al., 1977; Hamiltonet al., 1982). At each site, we averaged the grain-size data obtainedon board the JOIDES Resolution (Table 1; Kroenke, Berger, Jane-cek, et al., 1991). This rough grain-size information shows thatsediments from the deeper sites (Sites 803 and 805) are statisticallyfiner than sediments from the shallower sites (Sites 806 and 807).Fine calcareous sediments usually lose their porosity more rapidlyduring burial than coarse sediments (Scholle and Halley, 1985), andthus differences in grain size might explain why porosity is reducedmore rapidly in the deeper sites of Leg 130. However, differences incompaction behavior between fine and coarse sediments are usuallyascribed to the fact that coarse sediments reach a resistant grain-sup-ported framework when compacted. In the shallower Leg 130 sites,we do not think that sediment can reach a grain-supported frame-work during compaction. Thus, we suggest that another mechanismmore than likely explains the differences between compaction be-haviors of Leg 130 sediments.
At the Ontong Java Plateau, dissolution processes lead to the higherfragmentation of weakened foraminifers deposited at deeper sites(Johnson et al., 1977; Hamilton et al., 1982). The breakdown offoraminifers results in the intraparticle porosity within foraminiferchambers being transferred to interparticle porosity (Hamilton et al.,1982). Intraparticle porosity is only slightly affected by compaction.Geotechnical studies have shown that when foraminifers are sur-rounded by a fine-grained matrix they hardly break down duringcompaction (Valent et al., 1982); thus, voids in foraminifer chambersare preserved and intraparticle porosity does not significantly change.Consolidation tests performed on ooze and chalk samples fromLeg 130 also clearly show that interparticle porosity is the most effec-tive porosity as far as mechanical compaction is concerned (Lind, thisvolume). Thus, we suggest that sediments from the deep sites are morerapidly and strongly affected by compaction than sediments from theshallow sites because they have a higher ratio of interparticle vs.intraparticle porosity.
INTERSITE COMPARISON OF POROSITYVS. AGE PROFILES
Correction of Porosities:Calculation of Uncompacted Values
The correction of porosities to retrieve uncompacted values isnecessary for two main purposes: (1) correlation of original porositychanges with such sedimentological parameters as carbonate content
Figure 4. Regression curve calculated in the first 600 mbsf of Site 807 is interpolated at deeper depths andsuperimposed on the total porosity-depth curve of Site 807 (merged data sets from Holes 807A and 807C). Acleardivergence between the model and the porosity-depth curve is seen at about the chalk-limestone transition. Majorchemical compaction processes explain the rapid decrease in porosity.
or grain size, and (2) comparison of original porosities from sedimentof different sites to analyze the effects of site location (water depth,etc.) on index properties of surficial sediments.
In the ooze and chalk intervals, we used the empirically derivedporosity regression equations to correct measured porosities to origi-nal (uncompacted) values. The exponential regression equations thatfit the data are similar to the porosity-depth relationships formulatedby Athy (1930) for mechanical compaction in fine terrigenous sedi-ments. In Athy's equation, sediment deposits are characterized by acompression parameter ß. This compression parameter is dependenton sediment composition, but it is independent of depth of burial.When the original porosity (Φo) is known, porosity (<j>) at a depth ofburial z is given by:
Φ = Φo exp(-ßzj (5)
By analogy to Athy's formula, constants that appear in the exponentialterm of our regression equations (Table 1) can be considered asempirically defined compaction parameters. The compaction behav-ior of sediments cored within the first hundred meters of the sitesstudied is totally defined by these compaction parameters ß. As seenabove, these parameters are dependent on the depth of deposition. Ateach site, initial (uncompacted) porosities (Φo) were calculated usingmeasured porosities (Φ) and the compaction parameters by
Φ0=Φ/exp(-ßz), (6)
where z is the depth in meters below seafloor. The result of such acorrection is displayed in Figure 6, which illustrates the uncorrectedand corrected porosity profiles at Site 807.
Intersite Comparison of Corrected Porosityvs. Age Profiles
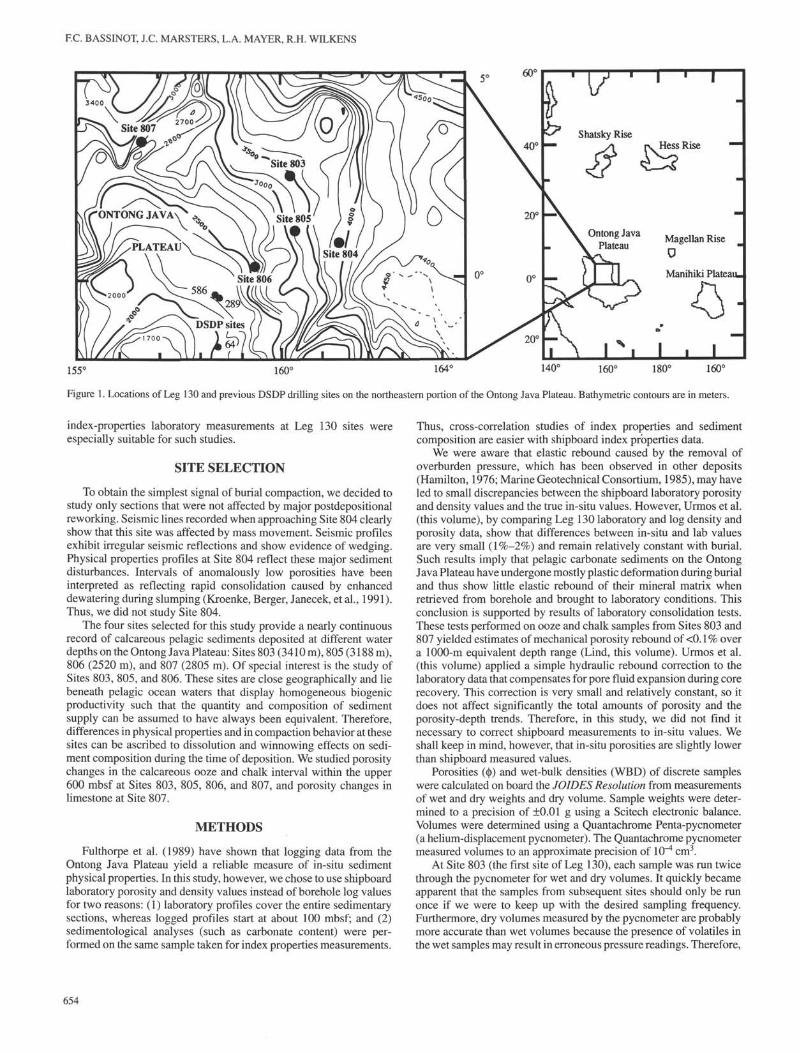
We used the age-depth model derived from the biostratigraphy andthe few available magnetostratigraphy data to construct correctedporosity vs. age profiles at Holes 803D, 805B, 806B, and 807A.Depth-age control points are those selected in the "SedimentationRates" chapters of the Initial Reports (Kroenke, Berger, Janecek, etal., 1991; Table 2). Based on this time scale, we converted the datafrom the depth domain into the time domain by linear interpolationbetween age control points. A few dubious porosity values wereremoved from the data sets before corrected data were plotted as afunction of age for intersite comparisons. At Hole 803D, we alsoremoved the high porosity values recorded in the ash layer encoun-tered at 180 mbsf (Kroenke, Berger, Janecek, et al., 1991). Beforeplotting, data were smoothed by a 3-point running average.
It is beyond the scope of this study to look at possible correlationsof small-scale porosity fluctuations among the Leg 130 sites. Thecomparison of laboratory porosity profiles recorded in two differentholes drilled at a same site (Fig. 7) clearly shows that minor scalefluctuations are not well resolved by laboratory profiles. Improve-
658
CALCAREOUS SEDIMENT POROSITY, ONTONG JAVA PLATEAU
40
Porosity (%)
45 50 55 60 65 70
CD
Q
0
100 -
200 ~
-
300 ~
-
400 -
500 -
ΛΛΛ
I 1 I • I I I • • I 1 I 1 1 1 1
Site 805(3188 mbsl) \
//Site 803 ^ I I(3410 mbsipV/
It
• . i i i i i i i i i i i i
7///i
i' Site 807
(2805 mbsl)
^ Site 806(2520 mbsl)
Figure 5. Regression curves for Sites 803, 805, 806, and 807 (regressionequations are given in Table 1). The rate of porosity decrease with depth ofburial is related to water depths of sites.
ments in the depth-age models and the use of continuously recordedGRAPE data will make it possible to look at these small-scale changesin more detail in an upcoming paper.
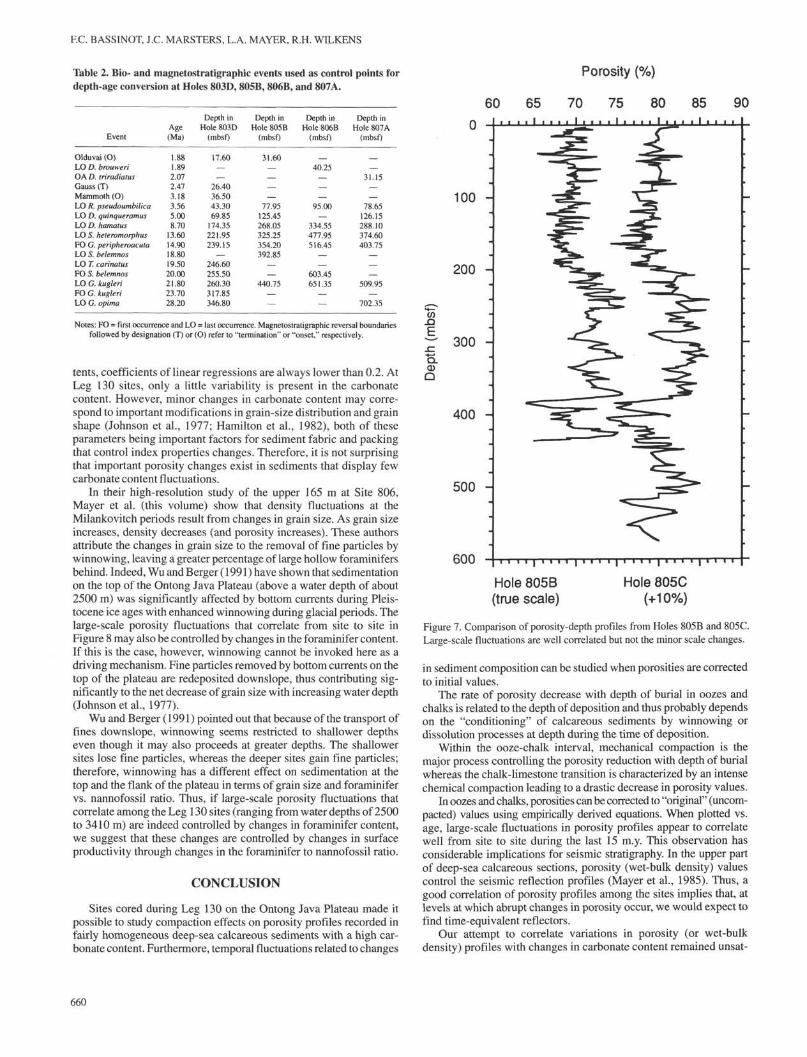
Corrected porosity values are plotted as a function of age and arecompared among sites in Figure 8. For the last 15 m.y., large-scalefluctuations in the porosity profiles appear to correlate quite wellfrom site to site. Profiles are not well correlated for older times. Thus,in the upper part of the sedimentary sections cored during Leg 130,large-scale porosity fluctuations may be controlled by regional pale-oceanographic changes. Such a result has considerable implicationsfor the seismic stratigraphy. As seen previously, wet-bulk densitychanges are primarily a function of porosity changes. Previousstudies have shown that, in the upper section of deep-sea calcareoussediments, wet-bulk density changes dominate acoustic impedancecontrasts (Mayer et al., 1985). Thus, a correlation of porosity profilesamong sites implies that, at levels at which abrupt changes inporosity occur, we would expect to find time-equivalent reflectors.A shift that is well correlated among the sites occurs, for instance, atabout 7 Ma (Fig. 8).
Johnson et al. (1977) and Hamilton et al. (1982) have shown thatporosities from surficial sediments are only weakly affected by dis-solution with increasing water depth. Enhanced dissolution withdepth of deposition leads to the transfer of intraparticle to interparticle
Porosity (%)
45 50 55 60 65 70 75 80 85
l • . . . I . •• • l . , • • I . •• • l . . . • l • • •• I .
enE
Q.ΦQ
600
1 0 0 -
2 0 0 -
3 0 0 -
4 0 0 -
5 0 0 -
Uncorrected porosities Corrected porosities
Figure 6. Comparison of uncorrected porosity curve at Hole 807A with the
corrected (uncompacted) porosity curve.
porosity as foraminifers break down, with no major loss in totalporosity. Our results show that this could have been true during thelast 15 m.y. Indeed, not only major porosity fluctuations correlatebetween sites, but also little difference seems to be present betweenthe absolute values of porosity in time-equivalent layers (Fig. 8).
In their study of density and carbonate data from Atlantic andequatorial Pacific DSDP/ODP sites, Herbert and Mayer (1991) haveconcluded that density in calcareous sediments is dominated bydifferences in packing rather than by differences in mineral graindensities. Such a conclusion is applicable to the carbonate-richsediments of the Ontong Java Plateau as density changes are con-trolled by changes in porosity in these sediments (Fig. 3). Porosity(which reflects the amount of voids in a given volume of sedimentand is, therefore, tightly related to packing) displays large-scalefluctuations, whereas grain density shows only minor changes (see"Physical Properties" chapters in Kroenke, Berger, Janecek, et al.,1991) because of the fairly homogeneous mineralogical compositionof the sediments.
In pelagic carbonate sediments from the east and central equato-rial Pacific, index properties are sensitive to sediment compositionand are especially well correlated to changes in carbonate content(Mayer, 1979; Luz and Shackleton, 1975). Packing is controlled bythe amount of porous tests of radiolarians that compose the noncar-bonate fraction. The carbonate-free material has an average porosityof 90%, whereas pure carbonate has a porosity of 55% (Wilkens andHandyside, 1985). In Ontong Java Plateau sediments, however,changes in index properties are not related to changes in carbonatecontent. When corrected porosities are plotted vs. carbonate con-
Table 2. Bio- and magnetostratigraphic events used as control points fordepth-age conversion at Holes 803D, 805B, 806B, and 807A.
Porosity (%)
Event
Olduvai (O)LO D. brouweriOAD. triradiatusGauss (T)Mammoth (O)LO R. pseudoumbilicaLO D. quinqueramusLO D. hamatusLO 5. heteromorphusFO G. peripheroacutaLO S. belemnosLO T. carinatusFO 5. belemnosLO G. kugleriFO G. kugleriLO G. opima
Age(Ma)
1.881.892.072.473.183.565.008.70
13.6014.9018.8019.5020.0021.8023.7028.20
Notes: FO = first occurrence and LC
Depth inHole 8O3D
(mbsf)
17.60——
26.4036.5043.3069.85
174.35221.95239.15
—246.60255.50260.30317.85346.80
Depth inHole 805B
(mbsf)
31.60——
—77.95
125.45268.05325.25354.20392.85
440.75—
—
Depth inHole 806B
(mbsf)
_
40.25
—95.00
—334.55477.95516.45
603.45651.35
—
—
Depth inHole 807A
(mbsf)
_
—31.15
—78.65
126.15288.10374.60403.75
509.95—
702.35
• = last occurrence. Magnetostratigraphic reversal boundariesfollowed by designation (T) or (O) refer to "termination" or"onset," respectively.
tents, coefficients of linear regressions are always lower than 0.2. At
i (m
bs
H.CD
Q
60 65 70 90
Leg 130 sites, only a little variability is present in the carbonatecontent. However, minor changes in carbonate content may corre-spond to important modifications in grain-size distribution and grainshape (Johnson et al., 1977; Hamilton et al., 1982), both of theseparameters being important factors for sediment fabric and packingthat control index properties changes. Therefore, it is not surprisingthat important porosity changes exist in sediments that display fewcarbonate content fluctuations.
In their high-resolution study of the upper 165 m at Site 806,Mayer et al. (this volume) show that density fluctuations at theMilankovitch periods result from changes in grain size. As grain sizeincreases, density decreases (and porosity increases). These authorsattribute the changes in grain size to the removal of fine particles bywinnowing, leaving a greater percentage of large hollow foraminifersbehind. Indeed, Wu and Berger (1991) have shown that sedimentationon the top of the Ontong Java Plateau (above a water depth of about2500 m) was significantly affected by bottom currents during Pleis-tocene ice ages with enhanced winnowing during glacial periods. Thelarge-scale porosity fluctuations that correlate from site to site inFigure 8 may also be controlled by changes in the foraminifer content.If this is the case, however, winnowing cannot be invoked here as adriving mechanism. Fine particles removed by bottom currents on thetop of the plateau are redeposited downslope, thus contributing sig-nificantly to the net decrease of grain size with increasing water depth(Johnson et al., 1977).
Wu and Berger (1991) pointed out that because of the transport offines downslope, winnowing seems restricted to shallower depthseven though it may also proceeds at greater depths. The shallowersites lose fine particles, whereas the deeper sites gain fine particles;therefore, winnowing has a different effect on sedimentation at thetop and the flank of the plateau in terms of grain size and foraminifervs. nannofossil ratio. Thus, if large-scale porosity fluctuations thatcorrelate among the Leg 130 sites (ranging from water depths of 2500to 3410 m) are indeed controlled by changes in foraminifer content,we suggest that these changes are controlled by changes in surfaceproductivity through changes in the foraminifer to nannofossil ratio.
CONCLUSION
Sites cored during Leg 130 on the Ontong Java Plateau made itpossible to study compaction effects on porosity profiles recorded infairly homogeneous deep-sea calcareous sediments with a high car-bonate content. Furthermore, temporal fluctuations related to changes
100 -
200 -
300 -
400 -
500 -
600
Hole 805B(true scale)
Hole 805C(+10%)
Figure 7. Comparison of porosity-depth profiles from Holes 805B and 805C.Large-scale fluctuations are well correlated but not the minor scale changes.
in sediment composition can be studied when porosities are correctedto initial values.
The rate of porosity decrease with depth of burial in oozes andchalks is related to the depth of deposition and thus probably dependson the "conditioning" of calcareous sediments by winnowing ordissolution processes at depth during the time of deposition.
Within the ooze-chalk interval, mechanical compaction is themajor process controlling the porosity reduction with depth of burialwhereas the chalk-limestone transition is characterized by an intensechemical compaction leading to a drastic decrease in porosity values.
In oozes and chalks, porosities can be corrected to "original" (uncom-pacted) values using empirically derived equations. When plotted vs.age, large-scale fluctuations in porosity profiles appear to correlatewell from site to site during the last 15 m.y. This observation hasconsiderable implications for seismic stratigraphy. In the upper partof deep-sea calcareous sections, porosity (wet-bulk density) valuescontrol the seismic reflection profiles (Mayer et al., 1985). Thus, agood correlation of porosity profiles among the sites implies that, atlevels at which abrupt changes in porosity occur, we would expect tofind time-equivalent reflectors.
Our attempt to correlate variations in porosity (or wet-bulkdensity) profiles with changes in carbonate content remained unsat-
660
CALCAREOUS SEDIMENT POROSITY, ONTONG JAVA PLATEAU
Porosity (%)
65 70 75 80 85 90 95
03
α>
Hole 803D(true
Hole 805B(+5%)
Hole 806B(+14%)
Hole 807A(+19%)
Figure 8. Corrected porosity vs. age at Holes 803D, 805B, 806B, and 807 A forthe last 25 m.y. Large-scale fluctuations in the porosity profiles appear to bewell correlated during the last 15 m.y. and less so before.
isfactory. Index properties changes are likely a result of changes inthe foraminifer content. If this is the case, we propose that large-scaleporosity fluctuations that correlate from site to site are caused bychanges in the surface productivity that lead to changes in theforaminifer to nannofossil ratio.
ACKNOWLEDGMENTS
We thank the two reviewers, K.A. Dadey and P. Holler, whoseconstructive criticisms helped improve the manuscript. F.B. expressesspecial thanks to F. Rostek for fruitful discussions.
F.B. acknowledges funding from INSU/CNRS under DBT (contri-bution No. 449) and 1ST programs.
Bachman, R.T., 1984. Intratest porosity in foraminifera. J. Sediment. Petrol,54:257-262.
Boyce, R.E., 1973. Appendix I. Physical properties—methods. In Edgar, N.T.,Saunders, J.B., et al., ML Repts. DSDP, 15: Washington (U.S. Govt.Printing Office), 1115-1128.
de Caritat, P., 1989. Note on the maximum upward migration of pore water inresponse to sediment compaction. Sediment. Geol., 65:371-377.
Einsele, G., 1977. Range, velocity, and material flux of compaction flow ingrowing sedimentary sequences. Sedimentology, 24:639-655.
Fulthorpe, C.S., Schlanger, S.O., and Jarrard, R.D., 1989. In situ acousticproperties of pelagic sediments on the Ontong Java Plateau. J. Geophys.Res., 94:4025^032.
Hamilton, E.L., 1971. Prediction of in-situ acoustic and elastic properties ofmarine sediments. Geophysics, 36:266-284.
, 1976. Variations of density and porosity with depth in deep-seasediments. J. Sediment. Petrol., 46:280-300.
Hamilton, E.L., Bachman, R.T., Berger, W.H., Johnson, T.C., and Mayer, L. A.,1982. Acoustic and related properties of calcareous deep-sea sediments. J.Sediment. Petrol, 52:733-753.
Hedberg, H.D., 1936. Gravitational compaction of clays and shales. Am. J.Sci., 31:241-287.
Herbert, T.D., and Mayer, L.A., 1991. Long climatic time series from sedimentphysical property measurements. J. Sediment. Petrol, 61:1089-1108.
Johnson, T.C., Hamilton, E.L., and Berger, W.H., 1977. Physical properties ofcalcareous ooze: control by dissolution at depth. Mar. Geol, 24:259-277.
Kim, D.C., Manghnani, M.H., and Schlanger, S.O., 1985. The role of diagene-sis in the development of physical properties of deep-sea carbonate sedi-ments. Mar. Geol, 69:69-91.
Kroenke, L.W., Berger, W.H., Janecek, T.R., et al., 1991. Proc. ODP, Init.Repts., 130: College Station, TX (Ocean Drilling Program).
Luz, B., and Shackleton, N.J., 1975. CaCO3 solution in the tropical east Pacificduring the past 130,000 years. In Sliter, W.V., Be, A.W.H., and Berger,W.H. (Eds.), Dissolution of Deep-sea Carbonates. Spec. Publ., CushmanFoundation Foram. Res., 13:164-168.
Marine Geotechnical Consortium, 1985. Geotechnical properties of northwestPacific pelagic clays: Deep Sea Drilling Project Leg 86, Site 576A. In Heath,R.C., Burckle, L.H., et al., Init. Repts. DSDP, 86: Washington (U.S. Govt.Printing Office), 723-758.
Mayer, L. A., 1979. Deep-sea carbonates: acoustic, physical and stratigraphicproperties. J. Sediment. Petrol, 49:819-836.
, 1991. Extraction of high-resolution carbonate data for palaeocli-mate reconstruction. Nature, 352:148-150.
Mayer, L.A., Shipley, T.H., Theyer, F., Wilkens, R.W., and Winterer, E.L.,1985. Seismic modeling and paleoceanography at Deep Sea DrillingProject Site 574. In Mayer, L.A., Theyer, F., Thomas, E., et al., Init. Repts.DSDP, 85: Washington (U.S. Govt. Printing Office), 947-970.
Milholland, P.D., Manghnani, M.H., Schlanger, S.O., and Sutton, G., 1980.Geoacoustic modeling of deep-sea carbonate sediments. J. Acoust. Soc.Am., 68:1351-1360.
Schlanger, S.O., and Douglas, R.G., 1974. The pelagic ooze-chalk-limestonetransition and its implications for marine stratigraphy. In Hsü, K.J., andJenkyns, H.C. (Eds.), Pelagic Sediments: On Land and Under the Sea.Spec. Publ., Int. Assoc. Sedimentol., 1:117-148.
Scholle, P.A., and Halley, R.B., 1985. Burial diagenesis: out of sight, out ofmind. In Schneidermann, N., and Harris, P.M. (Eds.), Carbonate Cements.Spec. Publ., SEPM, 36:309-334.
Valent, P.J., Altschaeffl, A.G., and Lee, H.J., 1982. Geotechnical properties oftwo calcareous oozes. In Demars, K.R., and Chaney, R.C. (Eds.), Geotech-nical Properties, Behavior, and Performance of Calcareous Soils: Philadel-phia, PA (Am. Soc. Testing Materials), 79-96.
Wetzel, A., 1989. Influence of heat flow on ooze/chalk cementation: quantifi-cation from consolidation parameters in DSDP Sites 504 and 505 sedi-ments. J. Sediment. Petrol, 59:539-547.
Wilkens, R.H., and Handyside, T, 1985. Physical properties of equatorialPacific sediments. In Mayer, L.A., Theyer, F., Thomas, E., et al., Init.Repts. DSDP, 85: Washington (U.S. Govt. Printing Office), 839-847.
Wu, G., and Berger, W.H., 1991. Pleistocene δ 1 8 θ records from Ontong JavaPlateau: effects of winnowing and dissolution. Mar. Geol, 96:193-209.
REFERENCES
Athy, L.F., 1930. Density, porosity, and compaction of sedimentary rocks. AAPGBull, 14:1-24.
Date of initial receipt: 6 December 1991Date of acceptance: 20 May 1992Ms 130B-058