5/5/2017
1
Improved Test Methods & Practices for Characterizing Steel Corrosion Potential of Earthen Materials
9th Geo3T2
Session 3A-2North Carolina DOT
Carey, NCApril 11, 2017
NCHRP Project 21‐11
PI : Ken Fishman, McMahon & Mann Consulting Engineers, P.C.Co-PI’s : Soheil Nazarian, Shane Walker, and Arturo Bronson
University of Texas, El Paso
1
NCHRP 21‐11 WORKPLAN
• PHASE I (Tasks 1‐4) – Collect Existing Information• Identify knowledge gaps
• Develop a detailed work plan to improve methods for sampling and testing and characterization of corrosiveness of earthen materials.
• PHASE II (Tasks 5 & 6) – Implement Work Plan Developed in Phase I• Study Laboratory and field tests for measurement of electrochemical parameters, and characterizing steel corrosion
• Draft protocol for characterizing corrosiveness of earthen materials
• Formulate a detailed work plan to evaluate practical application of proposed protocol
5/5/2017
2
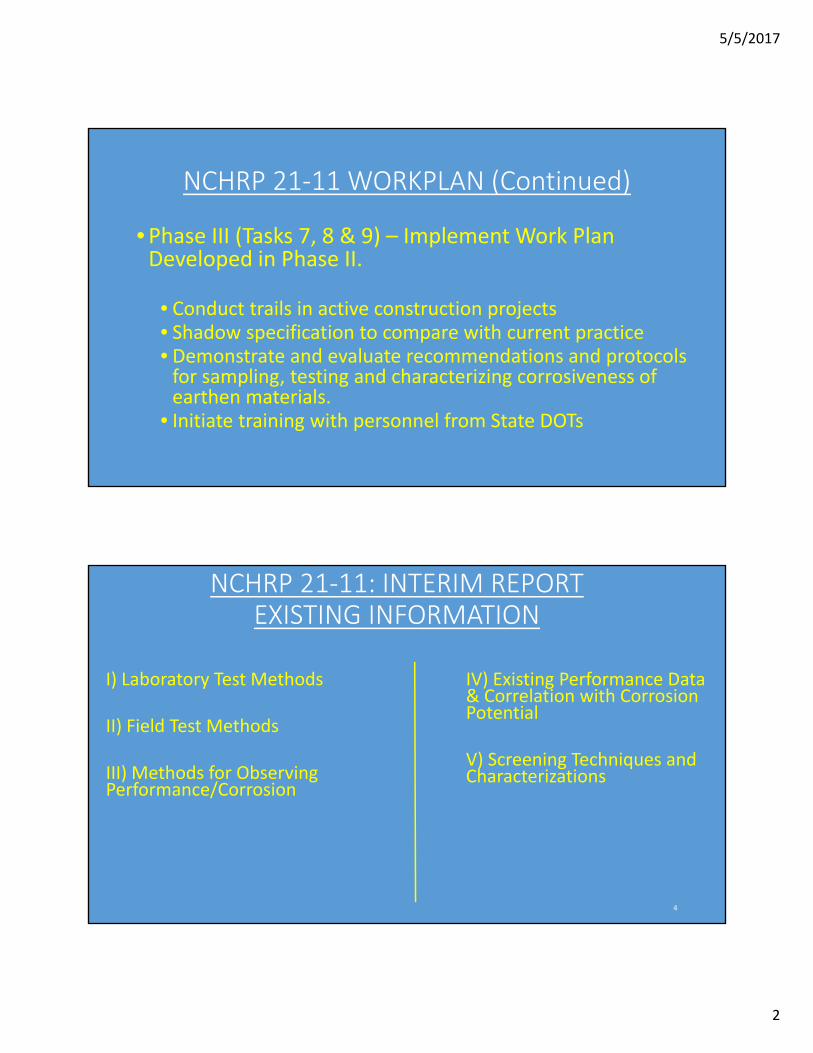
NCHRP 21‐11 WORKPLAN (Continued)
•Phase III (Tasks 7, 8 & 9) – Implement Work Plan Developed in Phase II.
• Conduct trails in active construction projects• Shadow specification to compare with current practice• Demonstrate and evaluate recommendations and protocols for sampling, testing and characterizing corrosiveness of earthen materials.
• Initiate training with personnel from State DOTs
NCHRP 21‐11: INTERIM REPORTEXISTING INFORMATION
I) Laboratory Test Methods
II) Field Test Methods
III) Methods for Observing Performance/Corrosion
IV) Existing Performance Data & Correlation with Corrosion Potential
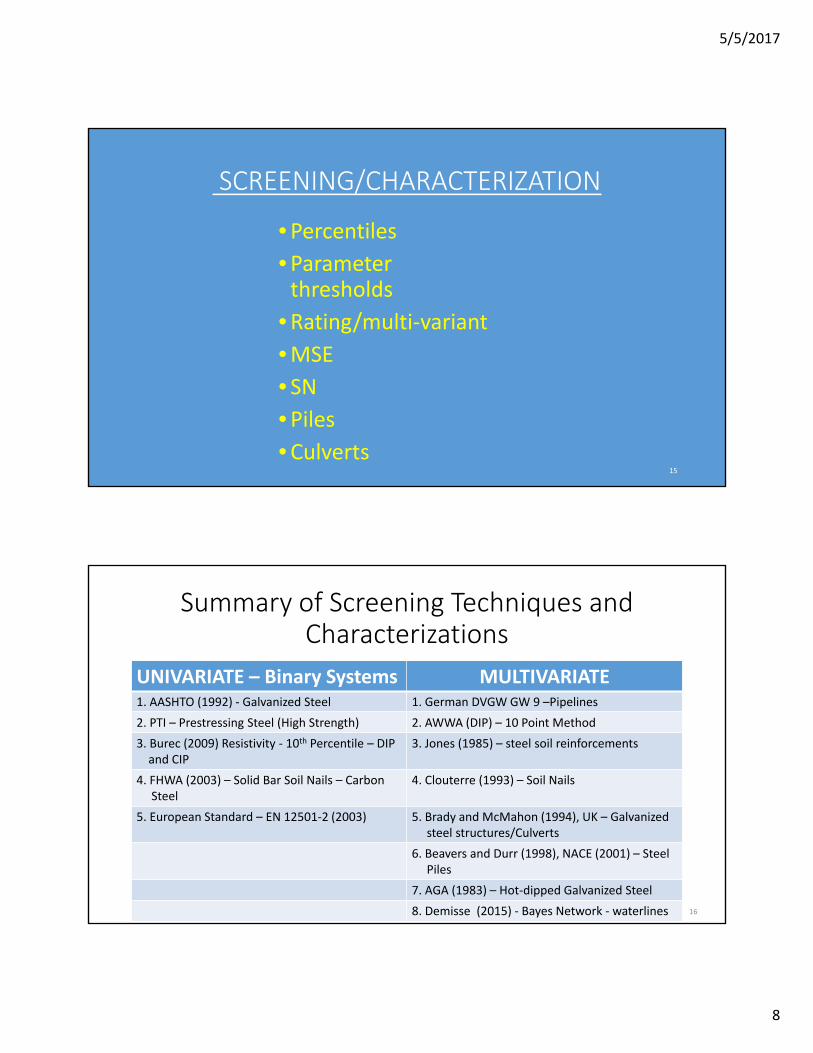
V) Screening Techniques and Characterizations
4
5/5/2017
3
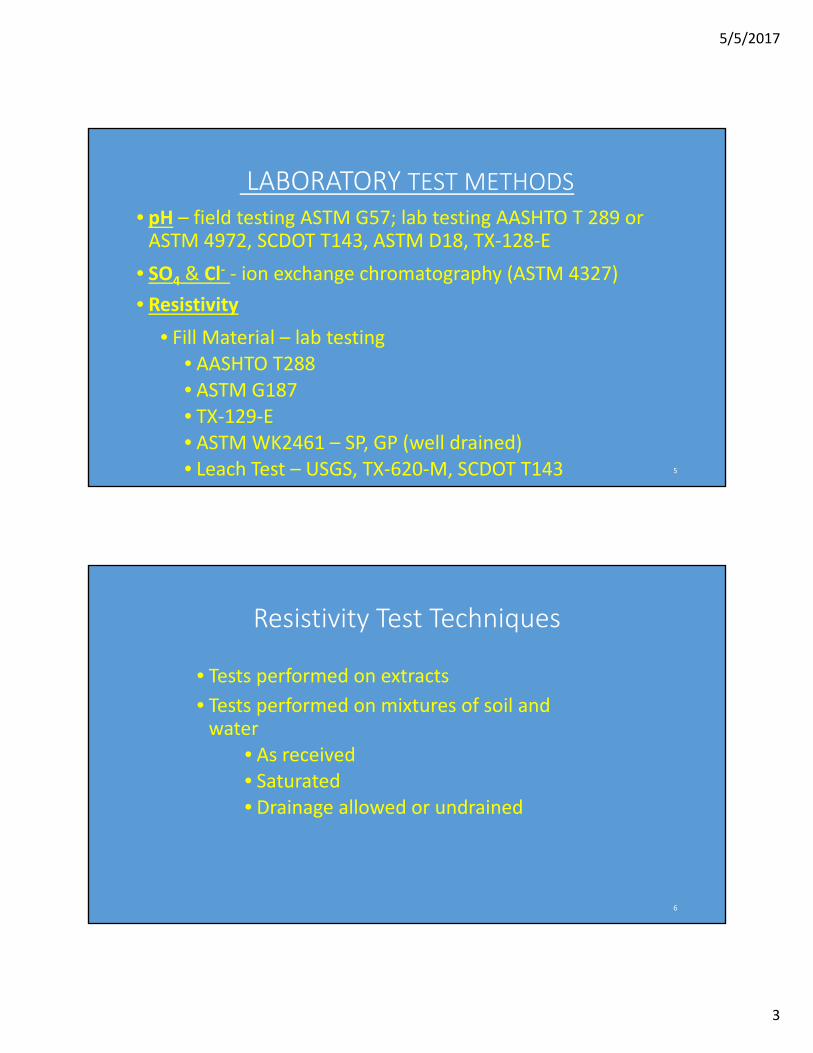
LABORATORY TEST METHODS
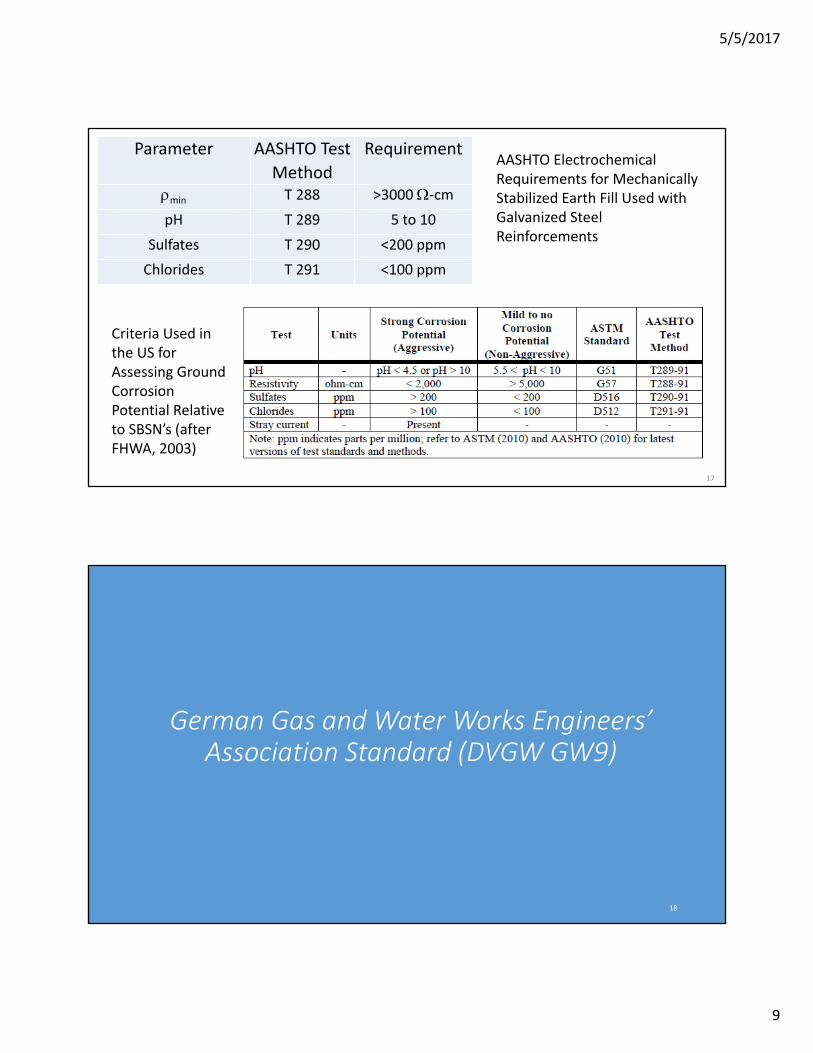
• pH – field testing ASTM G57; lab testing AASHTO T 289 or ASTM 4972, SCDOT T143, ASTM D18, TX‐128‐E
• SO4 & Cl‐ ‐ ion exchange chromatography (ASTM 4327)
• Resistivity
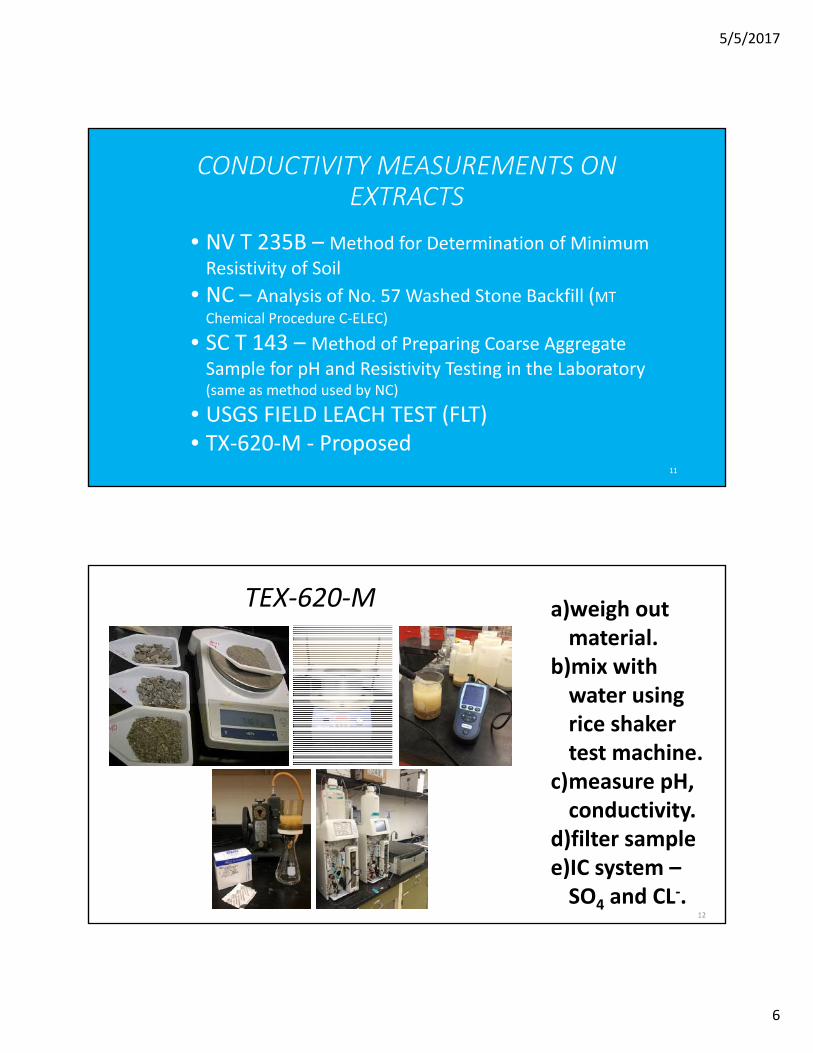
• Fill Material – lab testing• AASHTO T288• ASTM G187• TX‐129‐E• ASTM WK2461 – SP, GP (well drained)• Leach Test – USGS, TX‐620‐M, SCDOT T143 5
Resistivity Test Techniques
• Tests performed on extracts
• Tests performed on mixtures of soil and water
• As received• Saturated• Drainage allowed or undrained
6
5/5/2017
4
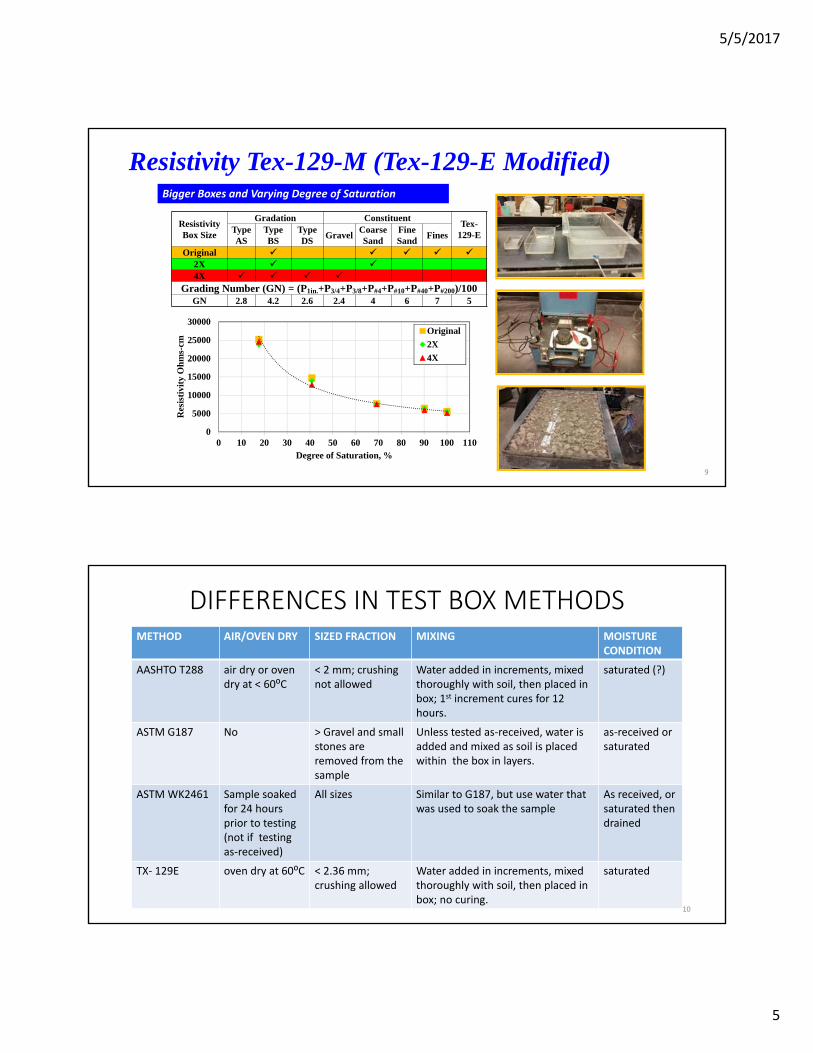
RESISTIVITY MEASUREMENTS WITH SOIL BOX
•Water added in Increments – “minimum resistivity” – AASHTO T 288, LDOTD TR 4529‐88, FM‐551, ADOT 236c, TX 129E, CTM 643, WSDOT T 417, PA Test Method No. 128
•Saturated or As‐Received – ASTM G187, French Practice
•Saturated and Drained – ASTM WK24261
7
1X 2X 4X
SOIL BOXES
8
5/5/2017
5
Resistivity Tex-129-M (Tex-129-E Modified)
0
5000
10000
15000
20000
25000
30000
0 10 20 30 40 50 60 70 80 90 100 110
Res
isti
vity
Oh
ms-
cm
Degree of Saturation, %
Original
2X
4X
Resistivity Box Size
Gradation ConstituentTex-
129-E Type AS
Type BS
Type DS
Gravel Coarse Sand
Fine Sand
Fines
Original 2X 4X
Grading Number (GN) = (P1in.+P3/4+P3/8+P#4+P#10+P#40+P#200)/100GN 2.8 4.2 2.6 2.4 4 6 7 5
9
Bigger Boxes and Varying Degree of Saturation
DIFFERENCES IN TEST BOX METHODSMETHOD AIR/OVEN DRY SIZED FRACTION MIXING MOISTURE
CONDITION
AASHTO T288 air dry or oven dry at < 60⁰C
< 2 mm; crushing not allowed
Water added in increments, mixed thoroughly with soil, then placed in box; 1st increment cures for 12 hours.
saturated (?)
ASTM G187 No > Gravel and small stones are removed from the sample
Unless tested as‐received, water is added and mixed as soil is placed within the box in layers.
as‐received or saturated
ASTM WK2461 Sample soaked for 24 hours prior to testing (not if testing as‐received)
All sizes Similar to G187, but use water that was used to soak the sample
As received, or saturated then drained
TX‐ 129E oven dry at 60⁰C < 2.36 mm; crushing allowed
Water added in increments, mixed thoroughly with soil, then placed in box; no curing.
saturated
10
5/5/2017
6
CONDUCTIVITY MEASUREMENTS ON EXTRACTS
• NV T 235B – Method for Determination of Minimum
Resistivity of Soil
• NC – Analysis of No. 57 Washed Stone Backfill (MT
Chemical Procedure C‐ELEC)
• SC T 143 – Method of Preparing Coarse Aggregate
Sample for pH and Resistivity Testing in the Laboratory (same as method used by NC)
• USGS FIELD LEACH TEST (FLT)• TX‐620‐M ‐ Proposed
11
a)weigh out material.
b)mix with water using rice shaker test machine.
c)measure pH, conductivity.
d)filter samplee)IC system –SO4 and CL
‐.
TEX‐620‐M
12
5/5/2017
7
DIFFERENCES IN TEST METHODS PERFORMED WITH EXTRACTS
METHOD SAMPLE SIZE
(grams)
DILUTIONRATIO
(H20:solids)
MIXING SETTLING TIME(hours)
FILTER
NC/SC 143T 2000 1:1 Mix and stand for 30 minutes, then agitate for 3 min. at 0, 2 and 4 hour intervals.
20 YES
NV T235B 100 g passing the #4 sieve
2:1 Agitate until solids are completely in suspension.
24 NO;Decanted
TX‐620‐M 100gDried
10:1 Shake vigorously for 30 minutes 1 NO;Tip of electrode placed 5 cm into the mixture
13
14
METHODSIZE RATIO
MIXINGSTAND
FILTER
(g) hours1.) ASTM D
497210 (air dried, passing
2 mm sieve)1:1 Mix thoroughly 1 NO
2.) TX‐128‐E30 used (passing
#40 sieve)5:1
Stir upon mixing, every 15 minutes for one hour after, and immediately before electrode immersion.
0 NO
3.) CorrTest (21‐06)
40 to 60 (greater than 10 mm
removed by hand)1:1 Stir to thoroughly disperse soil. 0.5 NO
4.) SC DOT T 143
2000 (passing 37.5 mm sieve)
1:1Mix and stand for 30 minutes, then agitate for 3 min. at 0, 2 and 4 hour intervals.
20 YES
5.) TX‐620‐M Varies 10:1 Mechanically shake for 30 minutes. 1 NO
6.) ASTM D18≥200 (bring to SSD state after obtaining
sample)2:1
Stir for at least 1 minute upon mixing. Stir for 1 minute every 15 minutes for 1 hour after. Stir immediately before emersion of electrode.
0 NO
TEST METHODS FOR pH
5/5/2017
8
SCREENING/CHARACTERIZATION
•Percentiles•Parameter thresholds
•Rating/multi‐variant
•MSE
• SN•Piles•Culverts
15
Summary of Screening Techniques and Characterizations
UNIVARIATE – Binary Systems MULTIVARIATE1. AASHTO (1992) ‐ Galvanized Steel 1. German DVGW GW 9 –Pipelines
2. PTI – Prestressing Steel (High Strength) 2. AWWA (DIP) – 10 Point Method
3. Burec (2009) Resistivity ‐ 10th Percentile – DIPand CIP
3. Jones (1985) – steel soil reinforcements
4. FHWA (2003) – Solid Bar Soil Nails – CarbonSteel
4. Clouterre (1993) – Soil Nails
5. European Standard – EN 12501‐2 (2003) 5. Brady and McMahon (1994), UK – Galvanized steel structures/Culverts
6. Beavers and Durr (1998), NACE (2001) – SteelPiles
7. AGA (1983) – Hot‐dipped Galvanized Steel
8. Demisse (2015) ‐ Bayes Network ‐ waterlines 16
5/5/2017
9
Parameter AASHTO Test
Method
Requirement
min T 288 >3000 ‐cm
pH T 289 5 to 10
Sulfates T 290 <200 ppm
Chlorides T 291 <100 ppm
AASHTO Electrochemical Requirements for Mechanically Stabilized Earth Fill Used with Galvanized Steel Reinforcements
Criteria Used in the US for Assessing Ground Corrosion Potential Relative to SBSN’s (after FHWA, 2003)
17
German Gas and Water Works Engineers’ Association Standard (DVGW GW9)
18
5/5/2017
10
ITEM MEASURED VALUE MARKS
Soil Composition
Calcareous, marly limestone, sandy marl, not stratified sand
+2
Loam, sandy loam (loam content 75% or less), marly loam, sandy clay soil (silt content 75% or less)
0
Clay, marly clay, humus ‐2
Peat, thick loam, marshy soil ‐4
Ground water level at buried position
None 0
Exist ‐1
Vary ‐2
Resistivity
> 10,000 ‐cm 0
5000 ‐cm – 10,000 ‐cm ‐1
2300 ‐cm – 5000 ‐cm ‐2
1000 ‐cm – 2300 ‐cm ‐3
> 10000 ‐cm ‐4 19
ITEM MEASURED VALUE MARKS
Moisture Content 20% or less 0
20% or more ‐1
pH 6 or more 0
6 or less ‐2
Sulfide and Hydrogen Sulfide
None 0
Trace ‐2
Exist ‐4
Carbonate5% or more +2
1% to 5% +1
< 1% 0
Chloride< 100 ppm 0
> 100 ppm ‐1
20
5/5/2017
11
ITEM MEASURED VALUE MARKS
Sulfate< 200 ppm 0
500 ppm – 200 ppm ‐1
1000 ppm – 500 ppm ‐2
> 1000 ppm ‐3
Cinder & CokeNone 0
exist ‐4
21
SCORE CHARACTERIZATION
> 0 Noncorrosive
0 to ‐4 Slightly Corrosive
‐5 to ‐10 Corrosive
< ‐10 Very Corrosive
DVGW GW9 –Characterization of Corrosivity
22
5/5/2017
12
Total
Score
General
Corrosion
Rate
Range Localized
(Pitting)
Corrosion
Rate
Range
µm/yr µm/yr
0 Ia 5 2.5 – 10 30 15 – 60
‐1 to ‐4 Ib 10 5 – 20 60 30 – 120
‐5 to ‐10 II 20 10 – 40 200 100 – 400
< ‐10 III 60 30 ‐ 120 400 200 ‐ 800
Soil Corrosivity/Aggressiveness (Carbon Steel) DIN 50 929 Part 3
23
SAMPLNG PLANSTATE # OF
SOURCESDESCRIPTION
CA 6 Gravel fill at northern sites, fine sand southern sites
FL 2 Fine sand
KY 2 Coarse Aggregate
NV 2 Sand and Gravels; High sulfates
NY 4 Well graded sands and gravels
NC 2 No 57 Stone
TX 6 Coarse Aggregate – Different Gradations
SC 2 Light weight fil and Granular Base
OH 2 Well graded sands and gravels
ARK 1 Coarse fill
BC 1 Natural gravel – poorly graded 24
5/5/2017
13
25
I‐540 & Triangle Town CenterConstructed 2004CR ≈ 5 µm/yr
US 1 West – Wake ForestConstructed 2005CR ≈ .25 µm/yr
SITES IN NORTH CAROLINA ‐ RALEIGH
Issue (I):Evaluate Test Methods Used to
Measure Electrochemical Properties
Issue (II):Characterize Corrosion Potential
1. Compare results from different tests –i.e., few sources, many tests (5.1 & 5.2).
1. Observe CR from laboratory tests – use same sources of materials included in Issue I (5.4).
2. Compare Results from Different Materials – i.e., many sources, few replicates, and few tests (5.3).
2. Test fill obtained from sites with ongoing corrosion monitoring – these materials are included in Issue I (5.3).
3. Additional instrumentation and monitoring at selected field sites –materials tested in Issue I and in situ testing for resistivity (5.5)
General Organization of Testing for Task 5
26
5/5/2017
14
PRELIMINARY DRAFT PROTOCOL
1. Identify Application
2. Identify Earthen Material
3. Requirements for Sampling and Testing
4. Methods of Testing – Lab vs. Field
5. Data Check Quality Control
6. Screening/Characterization
CONCLUSIONS & DISCUSSION
•Sources of Materials for Task 5
•Sites for Field Trials• Input on Preliminary Protocol
•Other Test Methods???
28