Monica Zoppè Scientific Visualization Unit IFC – CNR Pisa IBF – CNR Milano 3D data visualization and biology: visualizing the invisible Pisa, 21 Novembre 2019 Scientific and Large Data Visualization
Transcript
Monica ZoppèScientific Visualization Unit
IFC – CNR PisaIBF – CNR Milano
3D data visualization and biology: visualizing the invisible
Pisa, 21 Novembre 2019Scientific and Large Data Visualization
OutlineYour speakerWhat we visualize
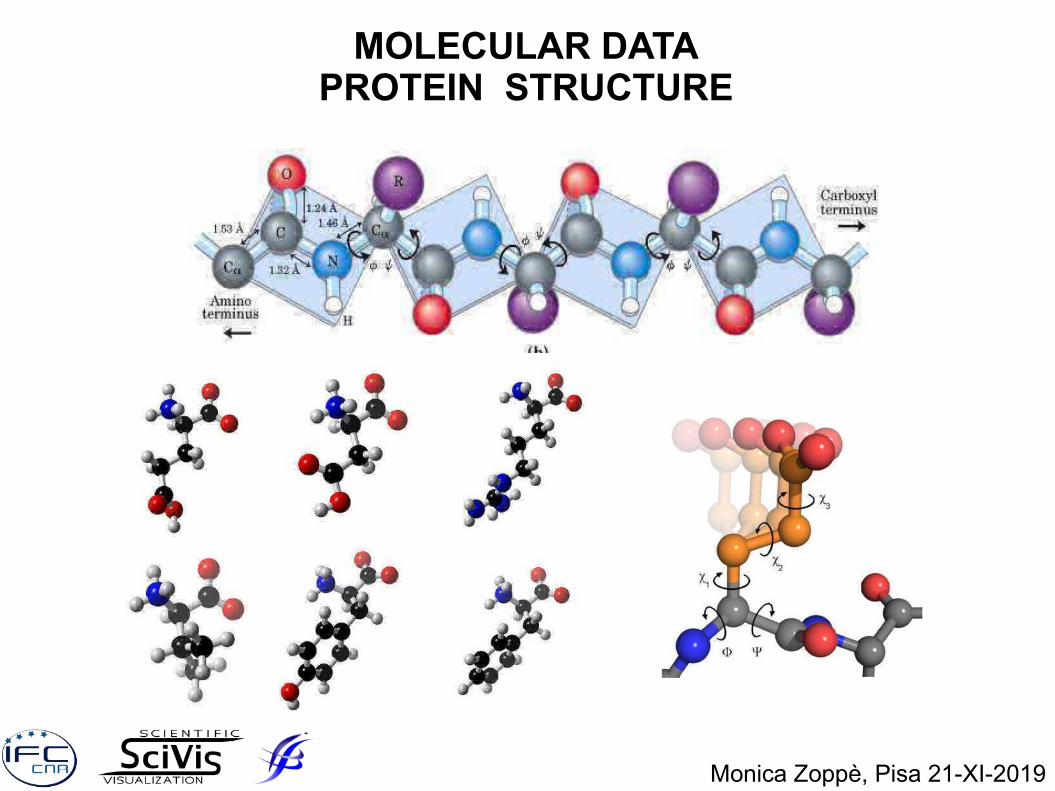
The cellProteins
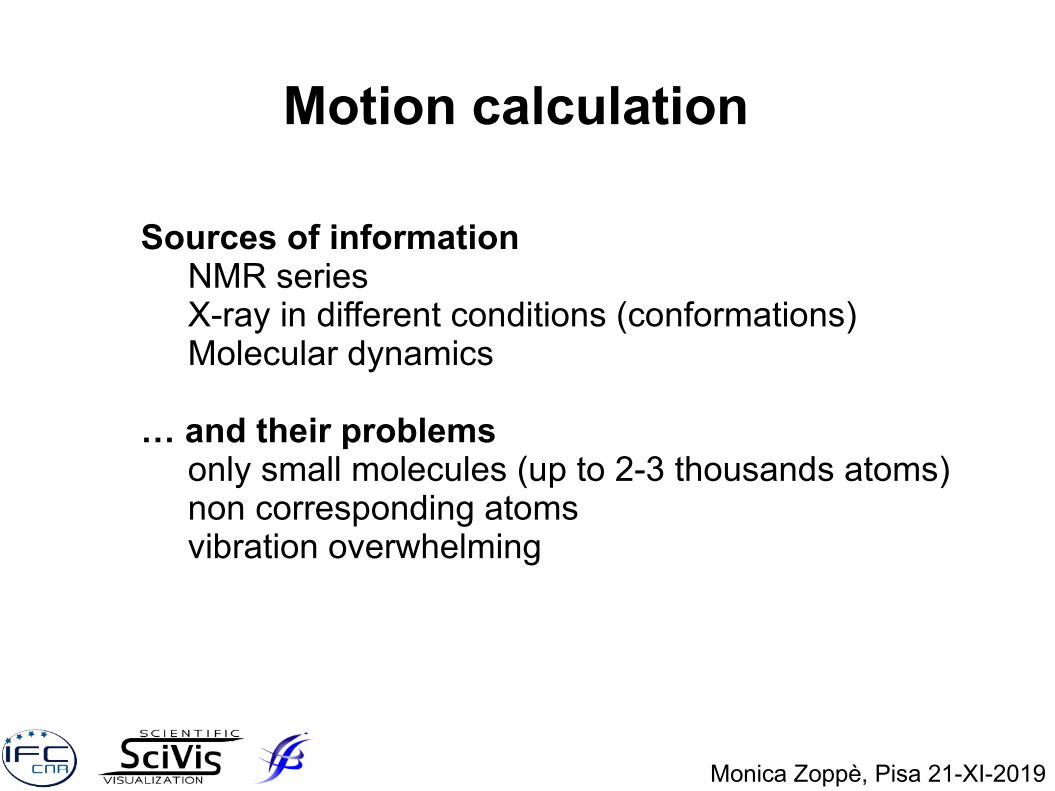
Tools and proceduresBioBlenderVisualization (Shape, MLP, EP)Motion Calculation
Environment building (cellular landscape)(Physical models – 3D soft prints)
In 2003 switch to ‘visual biology’● Increasing complexity● CG tools mature enough● Need to visualize a different world
Monica Zoppè, Pisa 21-XI-2019
Monica Zoppè, Pisa 21-XI-2019
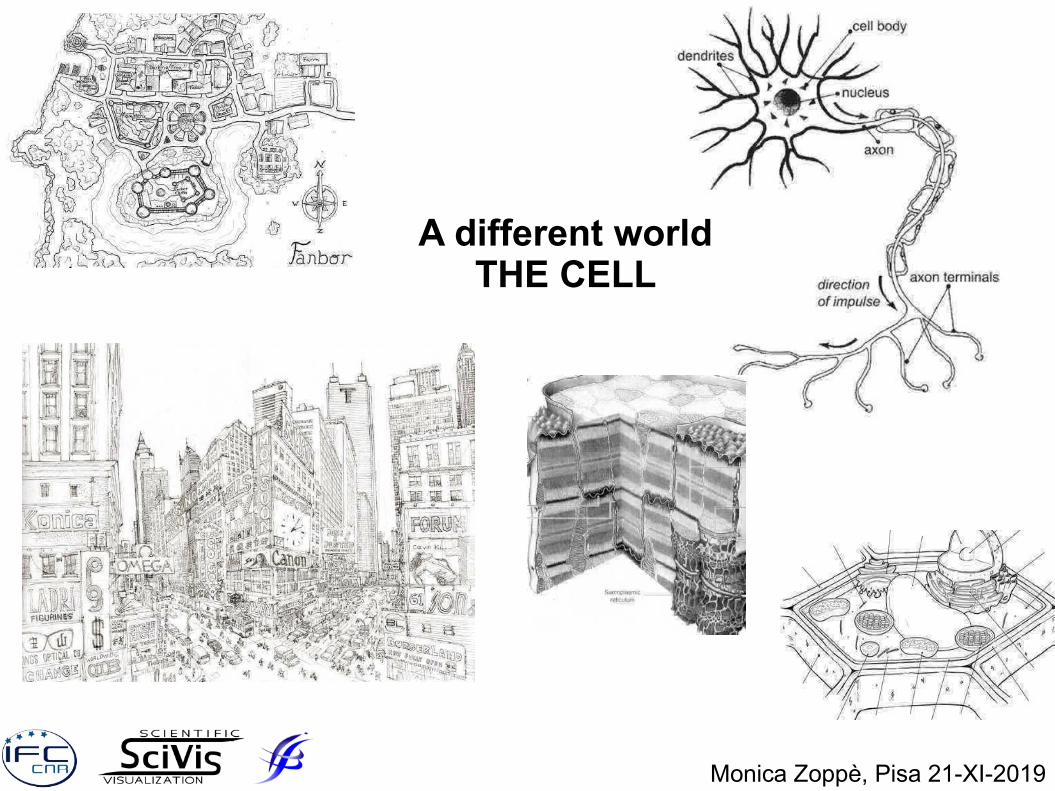
A different worldTHE CELL
A different worldTHE CELL
Cells are the fundamental unit of all living systems
Common features ● Encolosed space (peripheral and internal membranes)● DNA (Nucleus)● Energy mamangement (Mitochondria, chloroplasts)● Transport systems (Skeleton)
ALL INVOLVING PROTEINS
Specific features
● Size ● Shape● Internal organization● Specific functions
...
Monica Zoppè, Pisa 21-XI-2019
The TenMillion Times perceptive scale
Monica Zoppè, Pisa 21-XI-2019
Direct perception mm to few kmCellular scales nm to few mm
Major caveats:2D vs 3Ddifferent forcesnon gravitydifferent environmental features
CELL 5 – 50 mm
Internal structures
Nucleus 3 – 15 mm
Golgi 1 – 5 mm
Membrane (thickness) 5 – 7 nm
Ribosomes 30 nm
Proteins
GFP, Actin 3 – 4 nm
Spectrin 100 nm
NFkB complex 10 – 12 nm
DNA double helix 2 nm – 2 m
Other molecules
ATP 1,5 nm
Ca++ ion (naked) 0,2 nm
Ca++ ion (hydrated) 1,2 nm
Water (H2O) 0,28 nm
Sugar (glucose) 0,6 nm
Cholesterol 2 nm
Virus (HIV) 100 nm
How big (small) is a cell?
TOWN 50 – 500 m
Internal structures
Sports fled, Major building 300 –150 m
Building (3-6 floors), Airplane 10 – 50 m
Internal wall, Door 5 – 7 cm
Cats 30 cm
Apricot 3 – 4 cm
Snake 1 m
Grapefruit 10 – 12 cm
Water pipe – North to South pole 2 cm–20000 km
Cherry 1,5 cm
Small ant 2 mm
Nut 1.2 cm
Mosquito 2.8 mm
Pea 6 mm
Bee 2 cm
Kid 5 - 6 y human 1 m
x 10 milions
Visualizing the cell
Monica Zoppè, Pisa 21-XI-2019
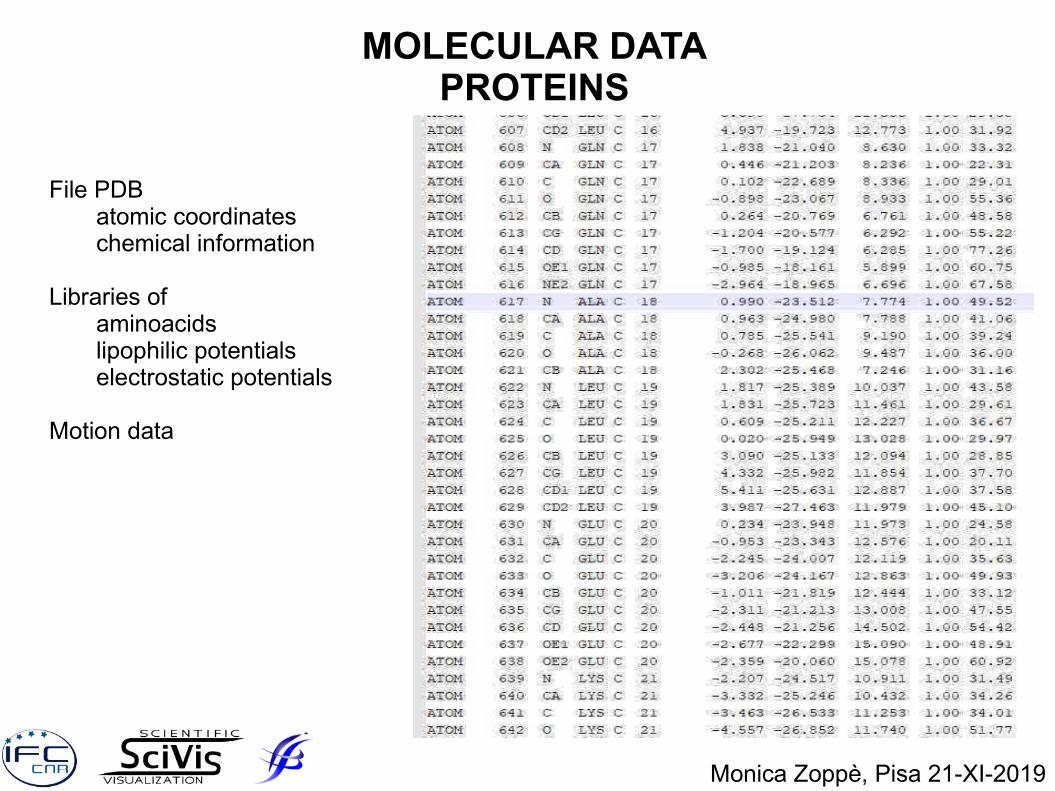
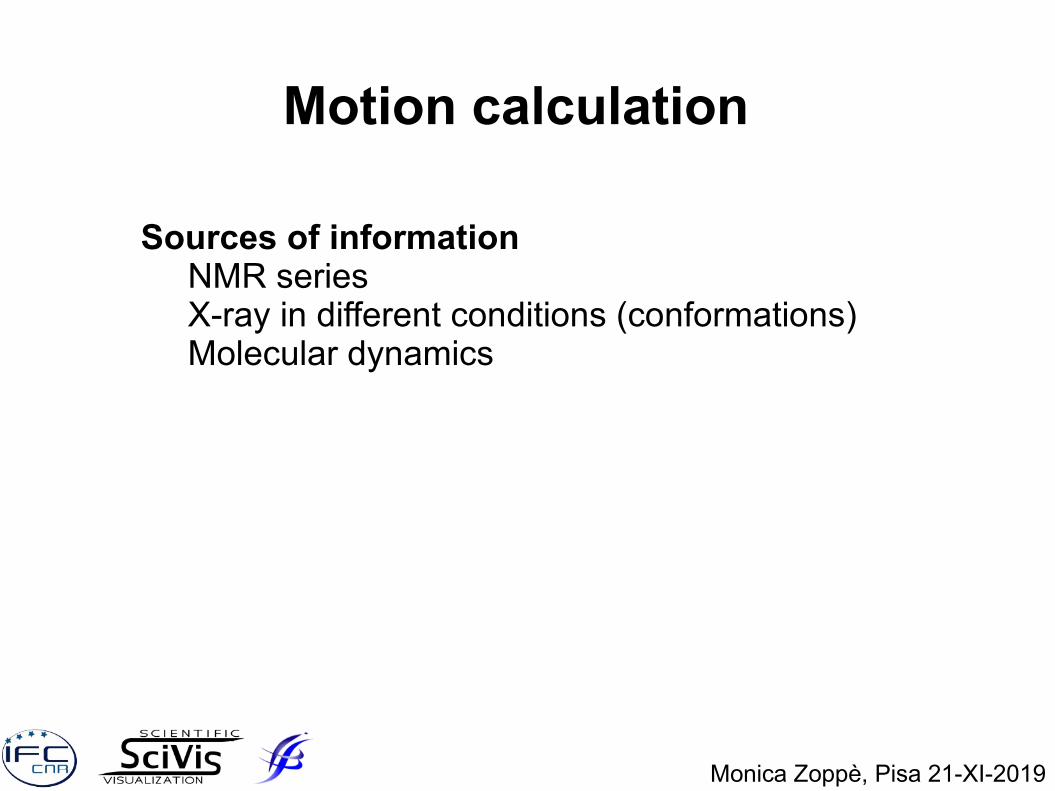
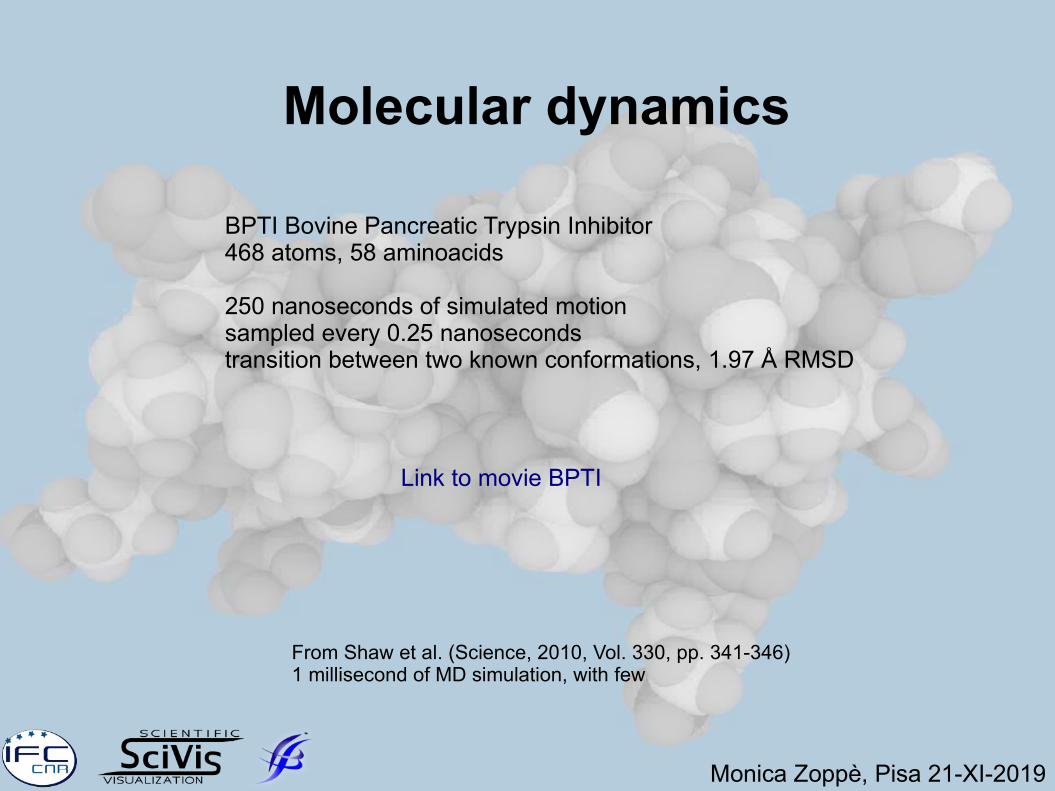
Sources of informationMicroscopy (at ever increasing resolution)Molecular data (X-ray crystallography, NMR and EM)Molecular dynamics and theoretical models Physico-chemical properties
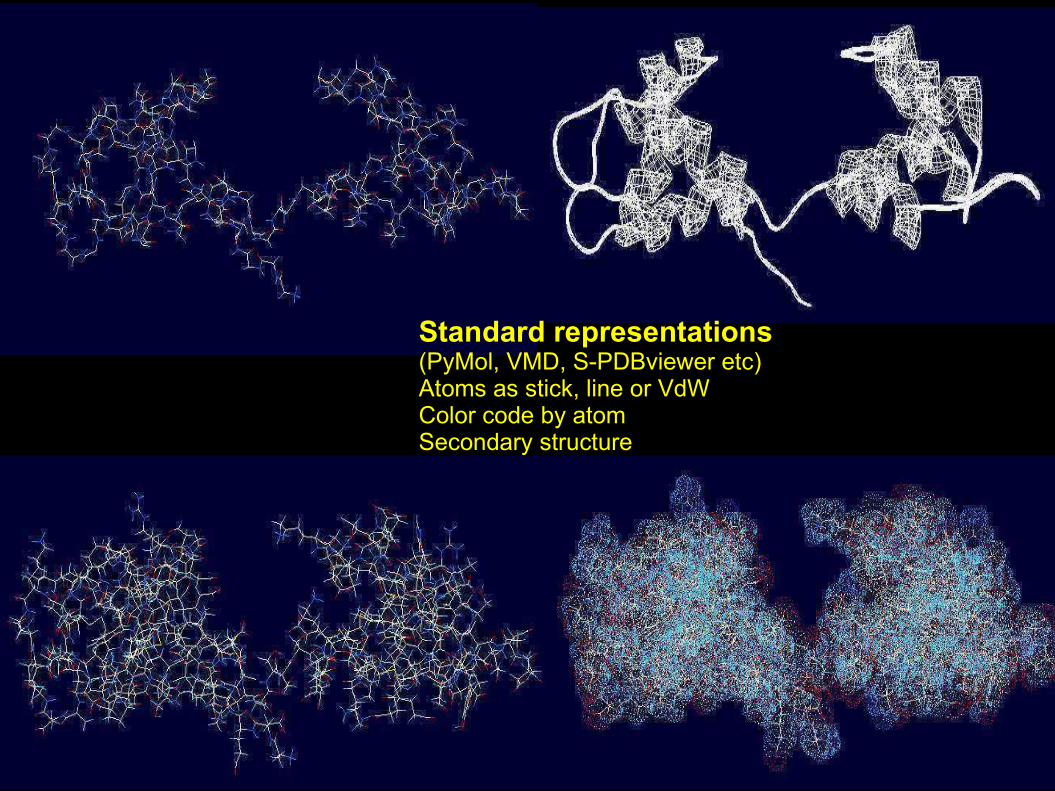
Standard representations(PyMol, VMD, S-PDBviewer etc)Atoms as stick, line or VdWColor code by atomSecondary structure
IMPORTERImport PDB in Blender space (tmp file) incl. molecular features (atom type, chemical bonds, charge)
VISUALIZATION in 3D viewportMain ChainAll atomsAll + HSurfaceAtomic MLP
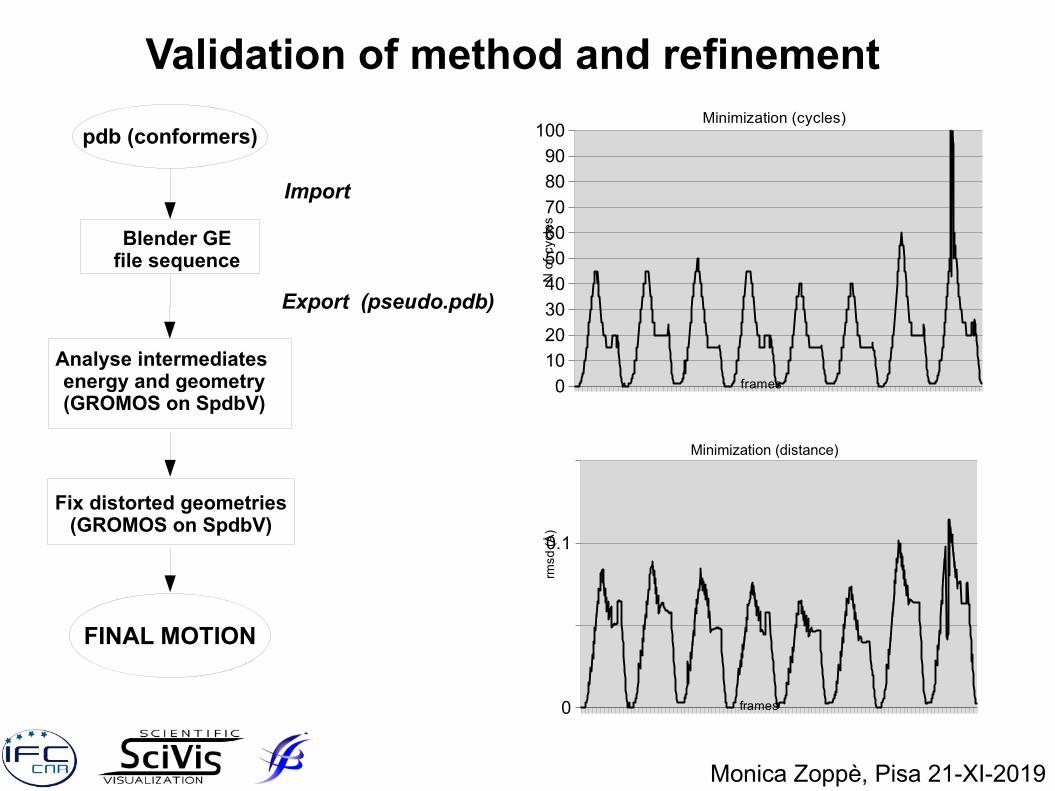
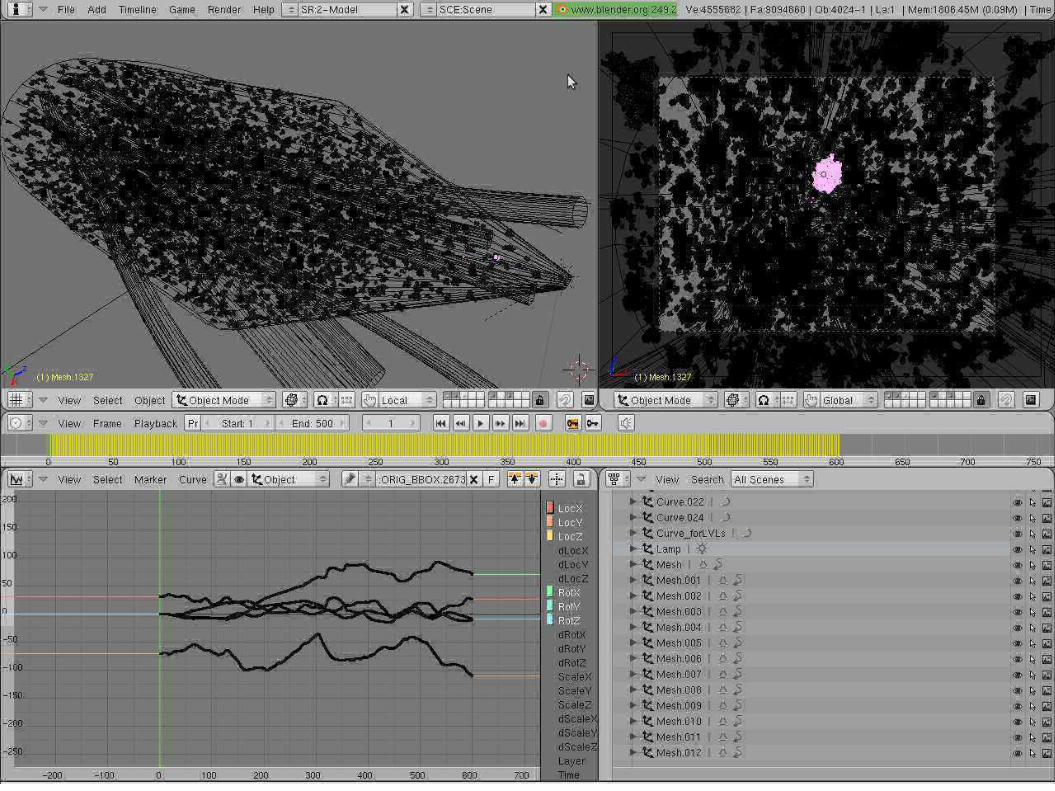
MOTIONBuild Molecule (Atoms, bonds) GE (Rigid Body Joint + colision)Load NMA (ProDy)
Render Visualization......
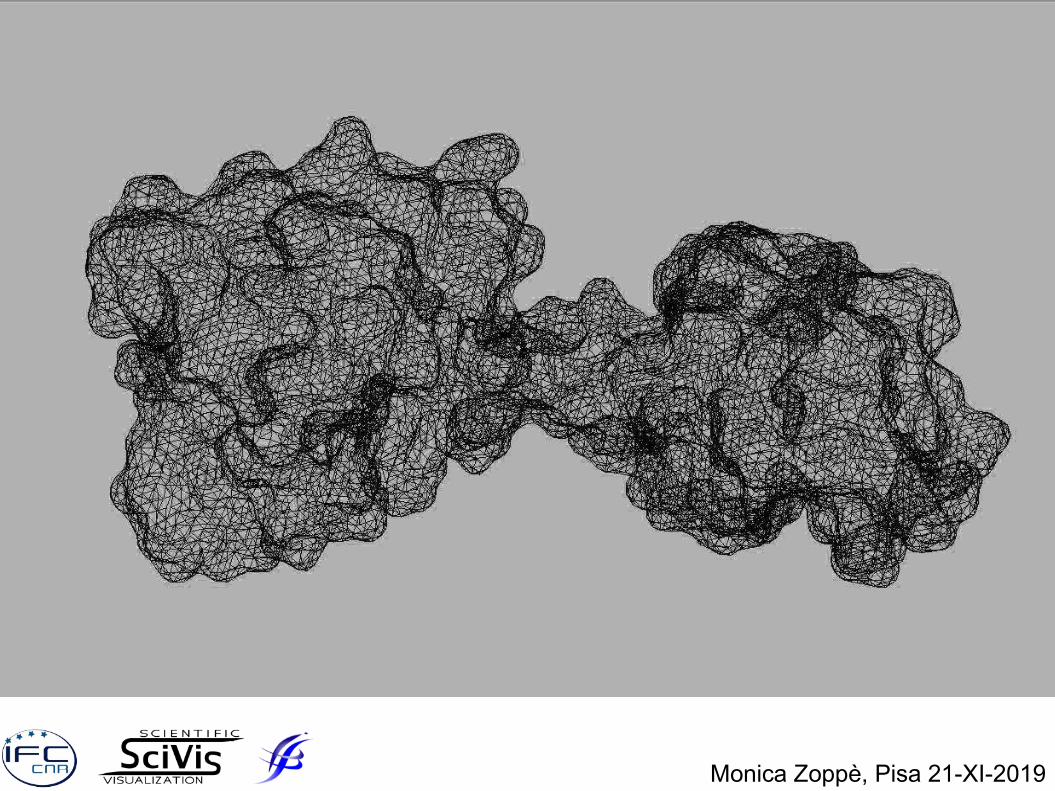
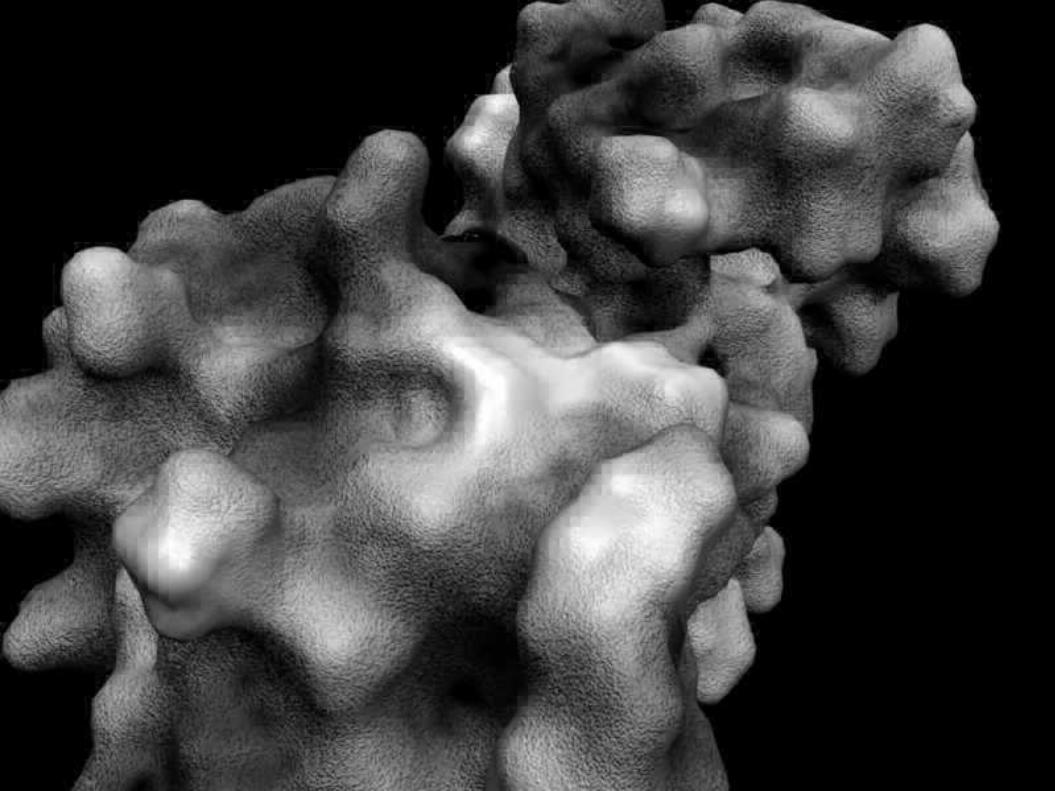
From atoms to shapes
Monica Zoppè, Pisa 21-XI-2019
SES Solvent Excluded SurfaceRolling probe of 1.4 nm (water radius)Performed by external program (PyMOL)
Import in Blender, as wrl file to be ‘Cleaned’ internal surfacesfix normals
Monica Zoppè, Pisa 21-XI-2019
From shapes to surfaces
Monica Zoppè, Pisa 21-XI-2019
Molecular Lipophilic Potential MLP
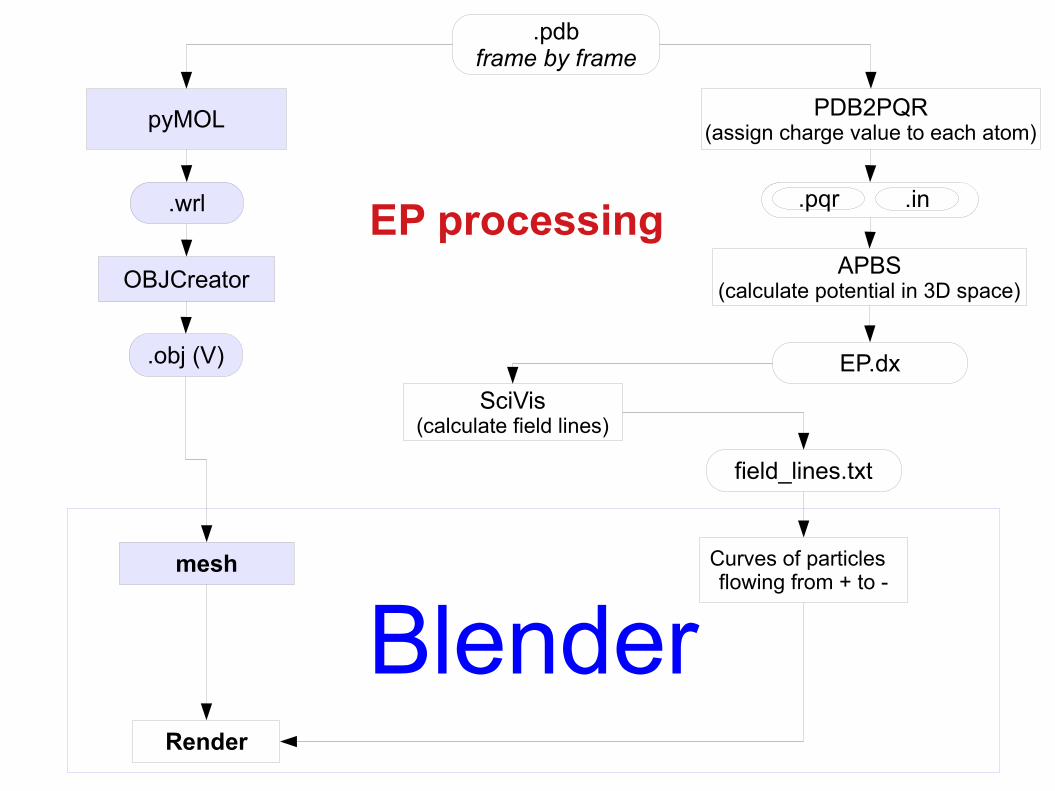
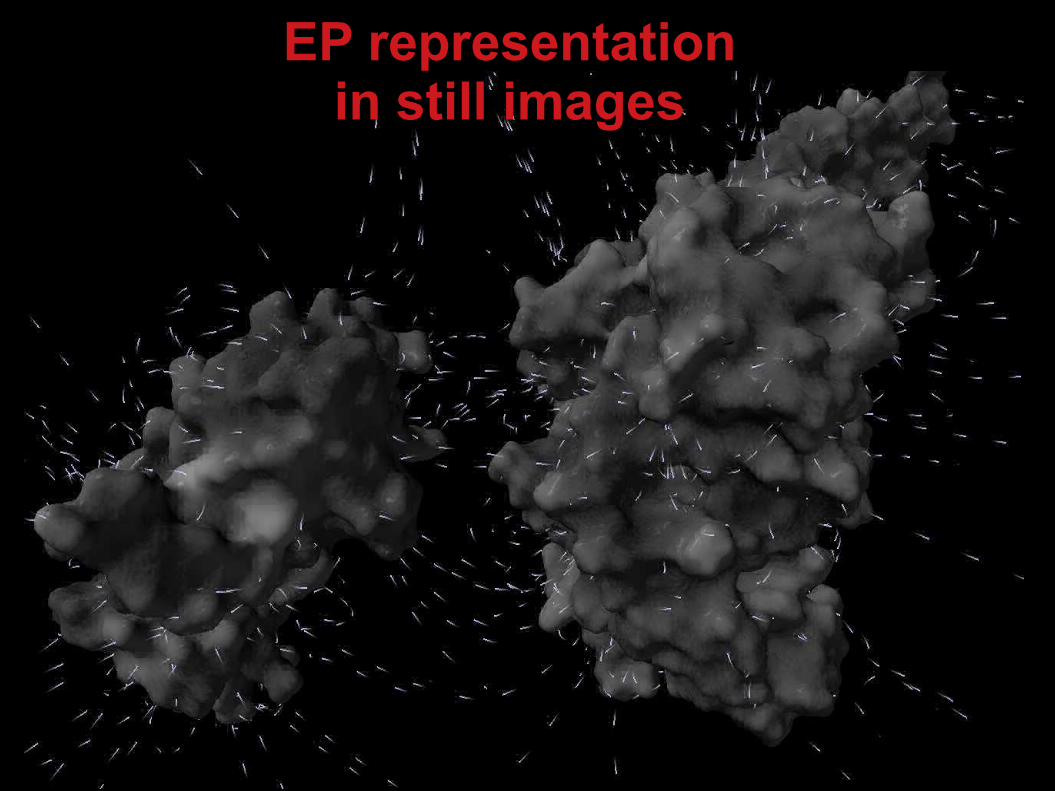
Electrostatic Potential
representing physico/chemical properties that are important for moleculear behavior
MLP processing
Monica Zoppè, Pisa 21-XI-2019
Molecular lipophilic potentialdetermined by nature, position and chemicalbonds of atomsaffects the atomic interactions in the closeneighborhood calculated as ‘bulk’ (by aminoacid) or on atomic basisintegrated in volume, where few atoms influence each other
...it all starts with the PDB
.pdbframe by frame
PyMOL (generate mesh)
pyMLP.py(calculate potential
ATDL, Testa formula)
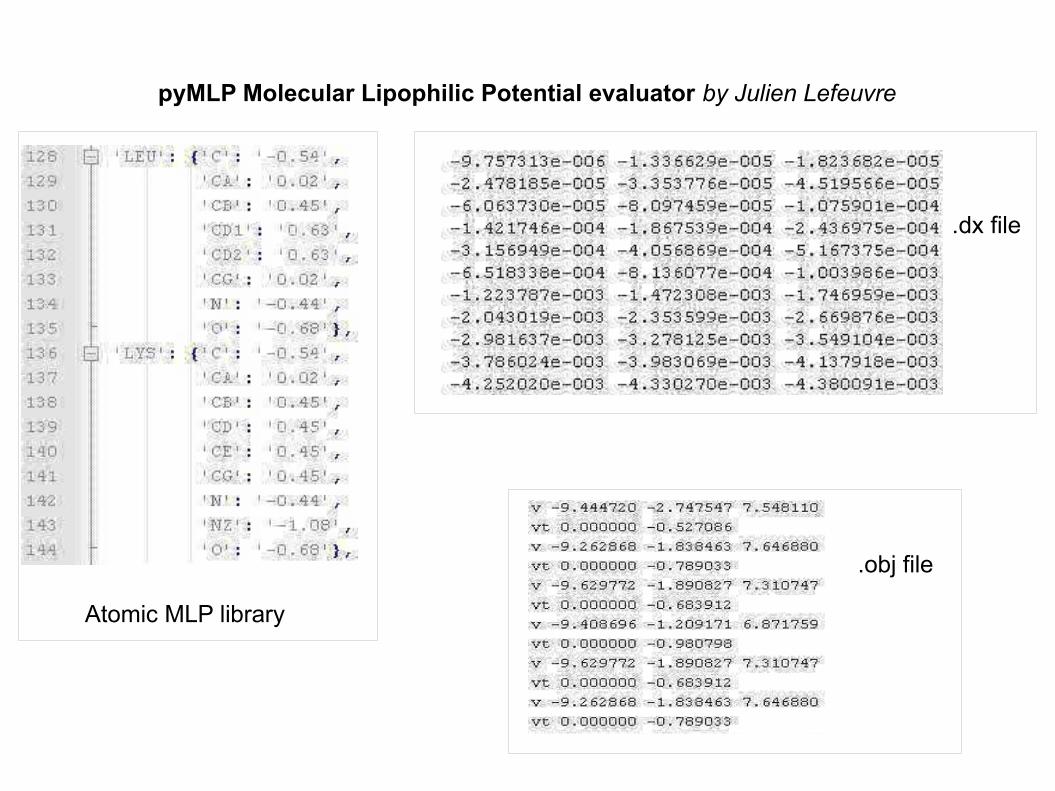
.wrl(mesh file) MLP.dx
(grid of MLP potential)
.obj(V)
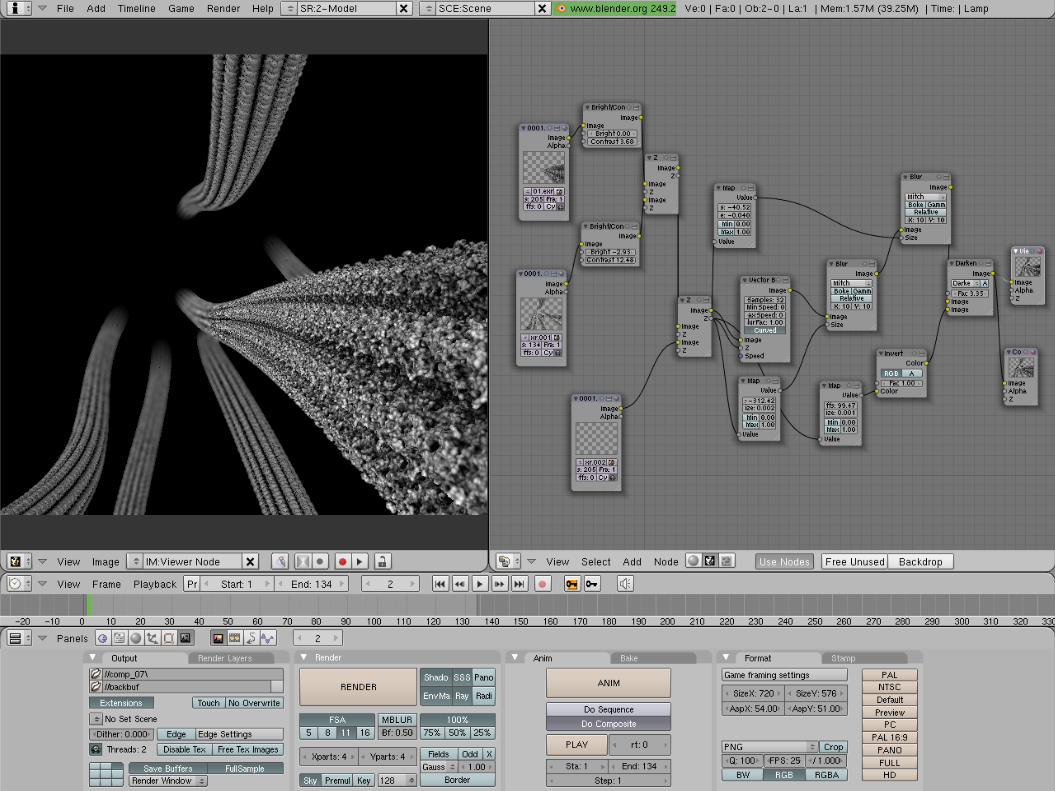
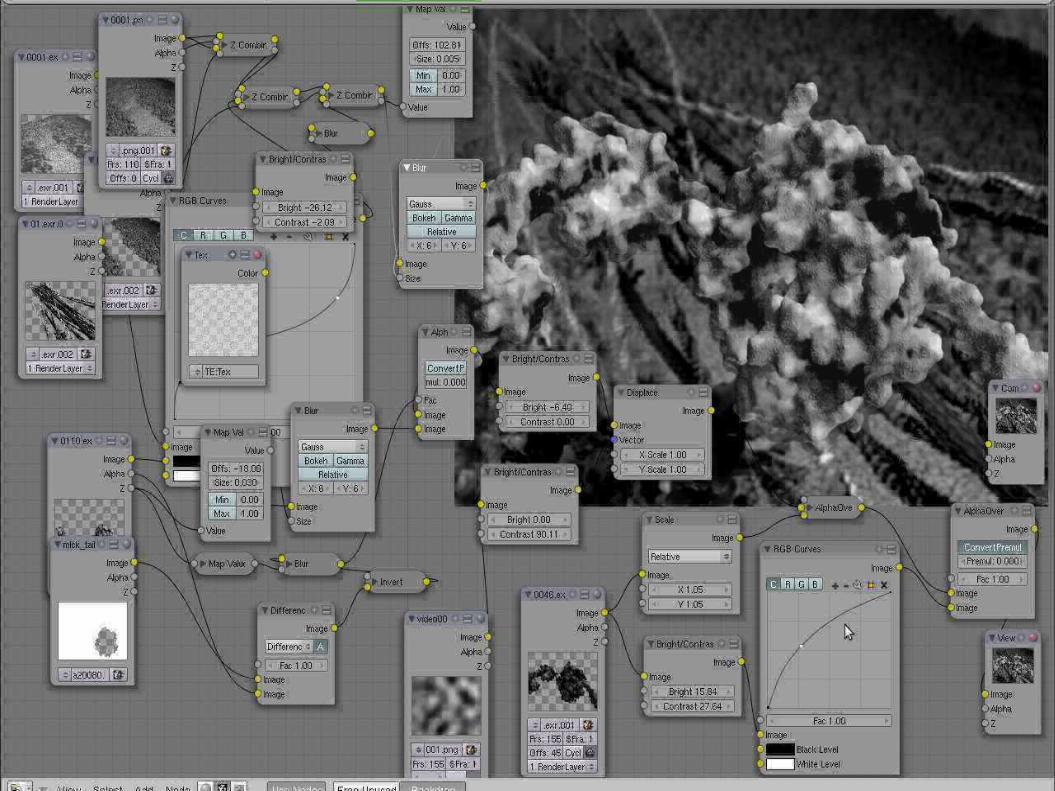
mesh V: transform to image texture
Add noiseBump node
Render
OBJCreator(maps MLP on meshTrilinear interpolation)
Specular Color (grey)(ramp)
Blender
pyMLP Molecular Lipophilic Potential evaluator by Julien Lefeuvre