3D Seismic study of a shale expulsion syncline at the base of the Champion delta, offshore Brunei and its implications for the early structural evolution of large delta systems P. Van Rensbergen * , C.K. Morley Department of Petroleum Geosciences, University Brunei Darussalam, Brunei Received 17 December 1999; received in revised form 26 May 2000; accepted 7 June 2000 Abstract An example of a Late Miocene expulsion rollover syncline related to mobile shale is described from 3D seismic data offshore Brunei. Prodelta shales accumulated in the subsiding syncline were altered after deep burial by overpressure increase and hydraulic fracturing. Consequently seismic facies was modified from a continuous divergent reflection pattern to a low-amplitude, disrupted to chaotic seismic facies bounded by a high-amplitude event that cross-cuts original stratification. Without the resolution provided by 3D data, the high- amplitude event would be mistaken for early growth faults and the subdued country-rock reflections for mobile shale, typical features at the base of large deltas. This study shows the existence of expulsion rollovers related to mobile shale, which have not been described before, and demonstrates that not all bright reflections at chaotic-coherent facies boundaries are actually fault planes. It also suggests that expulsion synclines, even during early phases of delta development may be compaction-related features rather than ones that drive the shale mass out of the area of progradation. q 2000 Elsevier Science Ltd. All rights reserved. Keywords: 3D Seismic study; Champion delta, Brunei; Mobile shale; Growth faults 1. Introduction Thick shale sequences, especially in deltaic settings, are often overpressured or undercompacted. The primary over- pressuring mechanism is disequilibrium compaction when pore fluids cannot escape at the rate necessary for the sedi- ment to compact normally. The effect of disequilibrium compaction will dissipate with time and often secondary causes for overpressure need to be considered. Secondary overpressure mechanisms involve either pore space reduc- tion (tectonic compression) or fluid volume increase, of which gas generation in mature, organic-rich shale is thought to be the most important (see review by Osborne & Swarbrick, 1997). In deltaic settings, overpressured prodelta shale constitutes the substratum for the prograding delta wedge. Analogous to salt, the overpressured shale is believed to be mobile and to respond to differential loading by shale withdrawal and shale diapirism. It is characterized by a chaotic seismic facies that occurs in ridges, vertical intrusions and dome-shaped forms. The “mobile” shale contrasts with stratified prodelta shale, which is perceived as bedded and static. From 2D seismic interpretation and analogue models, biased by salt-related examples, it is suggested that shale expulsion from beneath the prograding delta creates delta-top grabens bounded by paired regional and counter-regional listric growth faults (Doust & Omatsola, 1990; McClay, Dooley & Lewis, 1998). Coun- ter-regional faults occur near the delta front and often appear to detach over the landward flank of shale diapirs. The contrast in seismic facies between chaotic “mobile” shale and stratified overburden is typically used in seismic interpretation to locate the landward dipping fault. For example the association of structures, shale diapirs and paired regional and counter-regional growth faults, was described by Doust & Omatsola (1990) at the base of the onshore Niger delta as the main structure bounding large depobelts and has since inspired structural interpretation in deltaic provinces. New 3D seismic data have enhanced the resolution of seis- mic studies. Some areas of poor to chaotic reflections on 2D data, when imaged on 3D data, reveal that while the chaotic regions are more weakly reflective and discontinuous than Marine and Petroleum Geology 17 (2000) 861–872 0264-8172/00/$ - see front matter q 2000 Elsevier Science Ltd. All rights reserved. PII: S0264-8172(00)00026-X www.elsevier.com/locate/marpetgeo * Corresponding author. Renard Centre of Marine Geology, Universiteit Gent, Krijgslaan 281-S8, 9000 Gent, Belgium. Tel.: 132-9-264-4590; fax: 132-9-264-4967. E-mail address: [email protected](P. Van Rensbergen).
Transcript
3D Seismic study of a shale expulsion syncline at the base of theChampion delta, offshore Brunei and its implications for the early
structural evolution of large delta systems
P. Van Rensbergen*, C.K. Morley
Department of Petroleum Geosciences, University Brunei Darussalam, Brunei
Received 17 December 1999; received in revised form 26 May 2000; accepted 7 June 2000
Abstract
An example of a Late Miocene expulsion rollover syncline related to mobile shale is described from 3D seismic data offshore Brunei.Prodelta shales accumulated in the subsiding syncline were altered after deep burial by overpressure increase and hydraulic fracturing.Consequently seismic facies was modified from a continuous divergent reflection pattern to a low-amplitude, disrupted to chaotic seismicfacies bounded by a high-amplitude event that cross-cuts original stratification. Without the resolution provided by 3D data, the high-amplitude event would be mistaken for early growth faults and the subdued country-rock reflections for mobile shale, typical features at thebase of large deltas. This study shows the existence of expulsion rollovers related to mobile shale, which have not been described before, anddemonstrates that not all bright reflections at chaotic-coherent facies boundaries are actually fault planes. It also suggests that expulsionsynclines, even during early phases of delta development may be compaction-related features rather than ones that drive the shale mass out ofthe area of progradation.q 2000 Elsevier Science Ltd. All rights reserved.
Keywords: 3D Seismic study; Champion delta, Brunei; Mobile shale; Growth faults
1. Introduction
Thick shale sequences, especially in deltaic settings, areoften overpressured or undercompacted. The primary over-pressuring mechanism is disequilibrium compaction whenpore fluids cannot escape at the rate necessary for the sedi-ment to compact normally. The effect of disequilibriumcompaction will dissipate with time and often secondarycauses for overpressure need to be considered. Secondaryoverpressure mechanisms involve either pore space reduc-tion (tectonic compression) or fluid volume increase, ofwhich gas generation in mature, organic-rich shale isthought to be the most important (see review by Osborne& Swarbrick, 1997). In deltaic settings, overpressuredprodelta shale constitutes the substratum for the progradingdelta wedge. Analogous to salt, the overpressured shale isbelieved to be mobile and to respond to differential loadingby shale withdrawal and shale diapirism. It is characterized
by a chaotic seismic facies that occurs in ridges, verticalintrusions and dome-shaped forms. The “mobile” shalecontrasts with stratified prodelta shale, which is perceivedas bedded and static. From 2D seismic interpretation andanalogue models, biased by salt-related examples, it issuggested that shale expulsion from beneath the progradingdelta creates delta-top grabens bounded by paired regionaland counter-regional listric growth faults (Doust &Omatsola, 1990; McClay, Dooley & Lewis, 1998). Coun-ter-regional faults occur near the delta front and oftenappear to detach over the landward flank of shale diapirs.The contrast in seismic facies between chaotic “mobile”shale and stratified overburden is typically used in seismicinterpretation to locate the landward dipping fault. Forexample the association of structures, shale diapirs andpaired regional and counter-regional growth faults, wasdescribed by Doust & Omatsola (1990) at the base of theonshore Niger delta as the main structure bounding largedepobelts and has since inspired structural interpretation indeltaic provinces.
New 3D seismic data have enhanced the resolution of seis-mic studies. Some areas of poor to chaotic reflections on 2Ddata, when imaged on 3D data, reveal that while the chaoticregions are more weakly reflective and discontinuous than
Marine and Petroleum Geology 17 (2000) 861–872
0264-8172/00/$ - see front matterq 2000 Elsevier Science Ltd. All rights reserved.PII: S0264-8172(00)00026-X
www.elsevier.com/locate/marpetgeo
* Corresponding author. Renard Centre of Marine Geology, UniversiteitGent, Krijgslaan 281-S8, 9000 Gent, Belgium. Tel.:132-9-264-4590; fax:132-9-264-4967.
surrounding areas, they do contain coherent data. Hence chao-tic areas on 2D seismic data are not necessarily mobile shalebut bedded shale, probably fractured by overpressured porefluid and/or shale dyke intrusion (Van Rensbergen, Morley,Hoan & Lam, 1999). Early structures at the base of the deltaare, on 2D seismic data, masked by this effect. As a result, theoccurrence of mobile shale is overestimated and the variety ofstructural styles related to shale mobility has been poorlydocumented and limited to the classical examples of Doustand Omatsola (1990).
This paper describes an example of an expulsion rollover(Ge, Jackson & Vendeville, 1997) associated with shaletectonics as recognised on 3D data from offshore Brunei.On 2D seismic data the feature is masked because ofdimming effects related to overpressure and used to be inter-preted as a low-angle listric detachment over mobile shale.It is believed to be the first expulsion rollover, which hasbeen identified in association with shale tectonics. Onlyrecently have expulsion rollovers (synclines and anticlines)been recognised as salt features (see review in Ge et al.,1997) and only a few natural examples associated withsalt have been described (Demercian, Szatmari & Cobbold,1993; Mohriak et al., 1995; Ge et al., 1997).
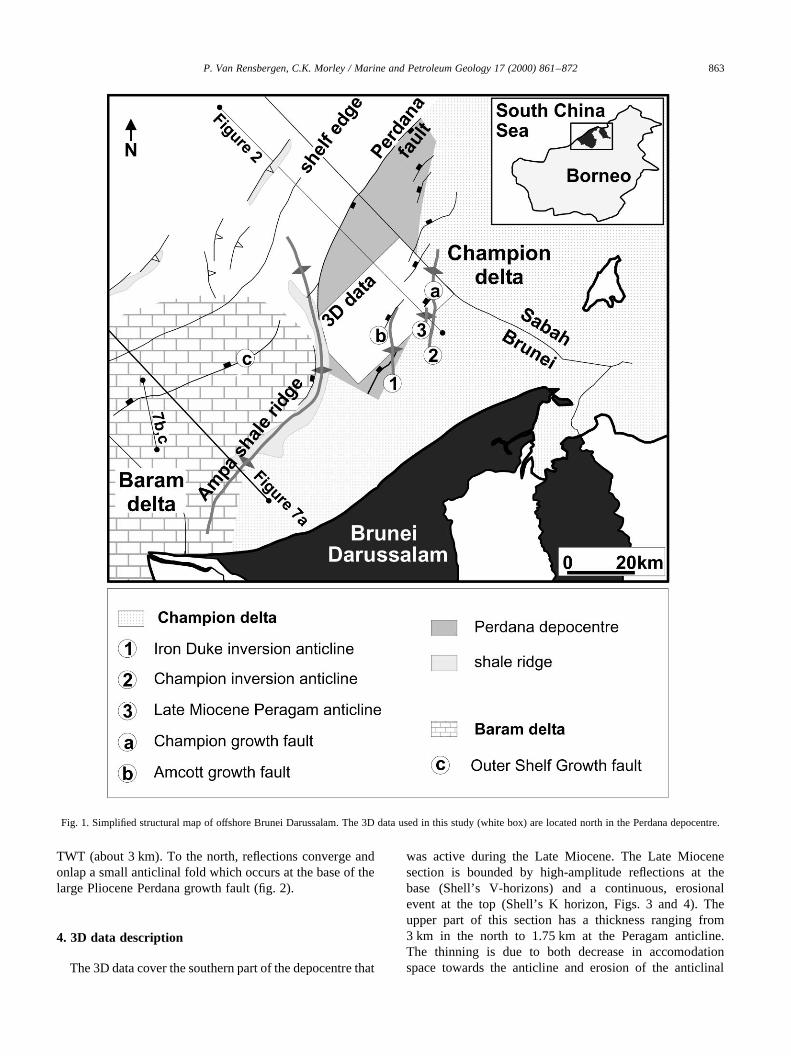
The offshore area of Brunei is composed of thick MiddleMiocene–Recent marine deltaic deposits up to 10 km thick,which display gravity structures associated with large deltas(growth faults, shale diapirs, toe thrusts) and (moreunusually) inversion folds and thrusts related to episodicphases of compression (e.g. James 1984; Sandal 1996).The Champion delta is a Middle to Late Miocene systemfound on the eastern part of the Brunei shelf. The Baramdelta is a Plio–Pleistocene system at the western part of theBrunei shelf. This study focuses on one of the early struc-tural features associated with the Champion delta system.One dominant structural feature on this margin is the land-ward dipping (counter-regional) Perdana fault (Fig. 1). Theexpulsion rollover discussed in this paper occurs in thehanging wall of the Perdana growth fault at the base ofthe delta (Fig. 2).
For comparison, the discussion paragraph includes abrief description of the structure at the base of the outerpart of the Baram delta, offshore Brunei. The Baram deltastructure is much younger and undisturbed by effectsrelated to extreme overpressure or Pliocene compressivetectonic pulses.
2. Data
The study is based on seismic data supplied by BruneiShell Petroleum (BSP) which consist of a regional seismicline perpendicular to the shore and a post-stack timemigrated 3D seismic survey covering part of the Perdana-Champion graben. The 3D dataset covers an area of900 km2 with a line and trace spacing of 25 m. The datawere interpreted using Landmark Seisworks 3D software.
The study concentrated on the deeper part of the sectionbetween 3 and 5 s (about 4.8–8 km). Wells that penetratedthe Peragam anticline provided information about lithology,depositional environment and approximate age correlationfor some horizons. BSP also provided additional illustra-tions (selected screen dumps) of pre-stack migrated 3Ddata of the Perdana-Champion depocentre and of the outerpart of the Baram delta.
3. Data description
3.1. General delta structure
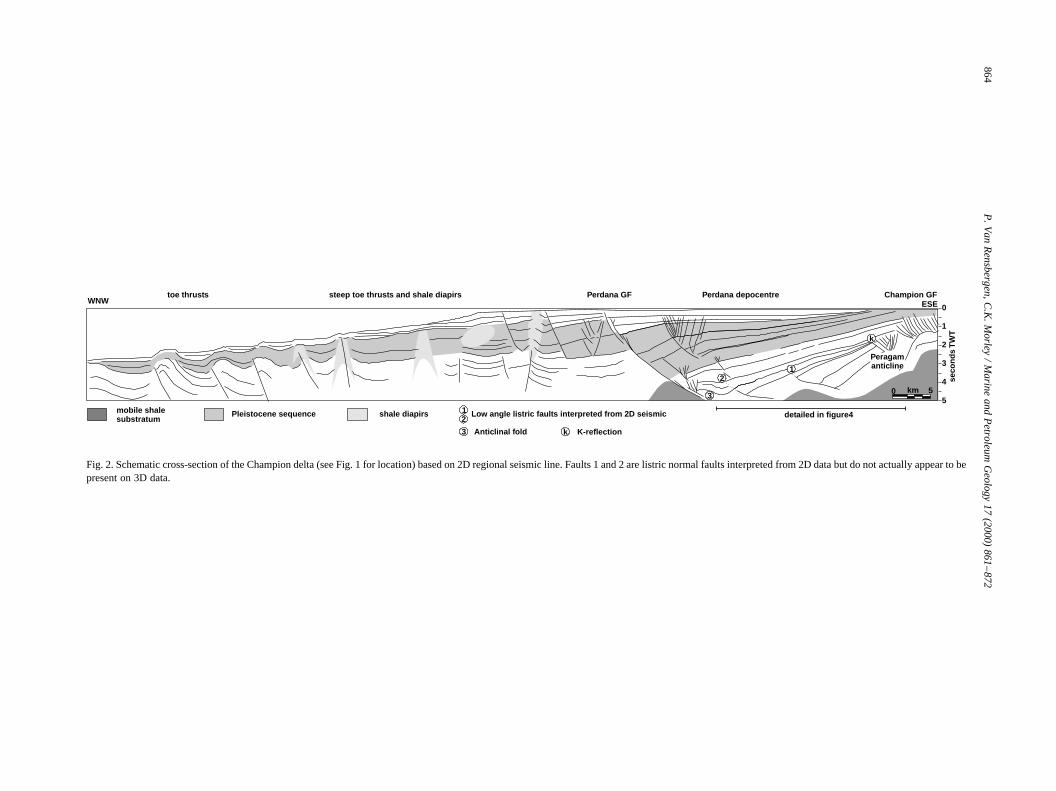
The Champion delta has all the characteristics of a deltaformed by differential loading of a mobile substratum. Thedelta toe consists of a succession of toe thrusts, which stee-pen landwards (Fig. 2). Intrusive mobile shale diapirs andpipes affect some of the thrusts, and become more frequentpassing landwards. At the shelf edge, a series of counter-regional growth faults occur, of which the Perdana growthfault is the oldest and largest with an estimated maximumvertical offset of about 2.65 km. The Perdana growth fault isover 100 km long and probably continues into the easternpart of the Ampa shale ridge. It bounds the Perdana-Cham-pion depocentre that accumulated about 4.5 s (about6.75 km) of sediment since the Late Miocene and coversover 1400 km2. Part of the depocentre lies in the adjacentterritory of Sabah. The Perdana-Champion depocentreconsists structurally and stratigraphically of a Late Miocenedepocentre and a Plio–Pleistocene depocentre. The Plio–Pleistocene Perdana-Champion depocentre is a typical with-drawal graben bounded by paired counter-regional andregional growth faults. At its southeastern margin, the depo-centre is bounded by a series of ‘en echelon’ regionalgrowth faults (a.o. Amcott fault, Champion fault, …). Thegrowth section that expands into these faults dates fromthe Plio–Pleistocene. Some of the extensional structures,like the Amcott fault at the Iron Duke inversion anticline(Fig. 3), have been deformed in a series of compressionalphases throughout the Pliocene. They form in this area theoceanward limit of tectonic deformation.
The Late Miocene depocentre has a half graben geome-try, subsiding in the north and bounded in the south by theLate Miocene Peragam anticline. At the base, reflectionsexhibit an apparent downlap onto the sub-horizontal topof the acoustic substratum over a distance of about 9 km(Fig. 4). This top is a continuous, high-amplitude event(D-event) that can be traced in the southern part of thedepocentre but is not properly imaged near the Perdanafault. According to the original interpretation from 2D seis-mic data, the apparent downlap resulted from continuedsubsidence along the early counter-regional growth faultsat the base of the section (Fig. 2). The maximum differentialsubsidence measured between the Peragam anticline and theLate Miocene Perdana depocenter is approximately 2 s
P. Van Rensbergen, C.K. Morley / Marine and Petroleum Geology 17 (2000) 861–872862
TWT (about 3 km). To the north, reflections converge andonlap a small anticlinal fold which occurs at the base of thelarge Pliocene Perdana growth fault (fig. 2).
4. 3D data description
The 3D data cover the southern part of the depocentre that
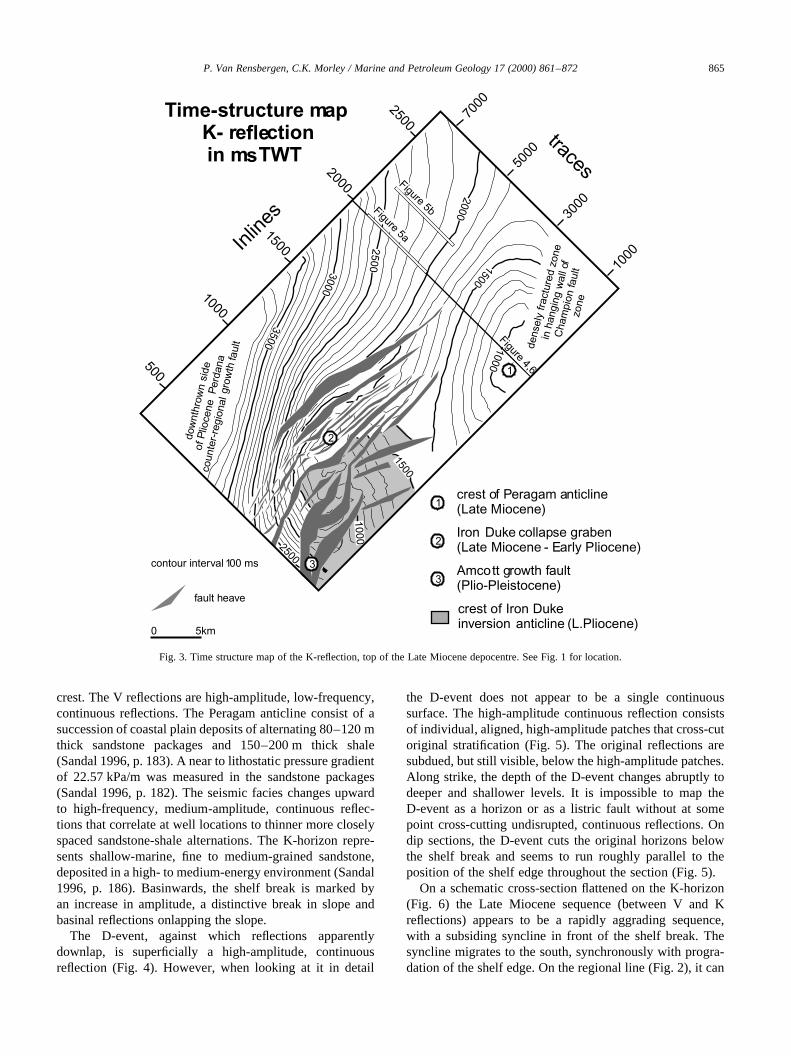
was active during the Late Miocene. The Late Miocenesection is bounded by high-amplitude reflections at thebase (Shell’s V-horizons) and a continuous, erosionalevent at the top (Shell’s K horizon, Figs. 3 and 4). Theupper part of this section has a thickness ranging from3 km in the north to 1.75 km at the Peragam anticline.The thinning is due to both decrease in accomodationspace towards the anticline and erosion of the anticlinal
P. Van Rensbergen, C.K. Morley / Marine and Petroleum Geology 17 (2000) 861–872 863
Fig. 1. Simplified structural map of offshore Brunei Darussalam. The 3D data used in this study (white box) are located north in the Perdana depocentre.
P.
Va
nR
en
sbe
rge
n,
C.K
.M
orle
y/
Ma
rine
an
dP
etro
leu
mG
eo
log
y1
7(2
00
0)
86
1–
87
2864
5
4
3
2
1
0
seco
nd
sT
WT
0 5km
WNWChampion GFPerdana GFsteep toe thrusts and shale diapirstoe thrusts
detailed in figure4
ESEPerdana depocentre
12
Peragamanticline
mobile shalesubstratum
Pleistocene sequence shale diapirs 12
Low angle listric faults interpreted from 2D seismic
3
3 Anticlinal fold
k
k K-reflection
Fig. 2. Schematic cross-section of the Champion delta (see Fig. 1 for location) based on 2D regional seismic line. Faults 1 and 2 are listric normal faults interpreted from 2D data but do not actually appear to bepresent on 3D data.
crest. The V reflections are high-amplitude, low-frequency,continuous reflections. The Peragam anticline consist of asuccession of coastal plain deposits of alternating 80–120 mthick sandstone packages and 150–200 m thick shale(Sandal 1996, p. 183). A near to lithostatic pressure gradientof 22.57 kPa/m was measured in the sandstone packages(Sandal 1996, p. 182). The seismic facies changes upwardto high-frequency, medium-amplitude, continuous reflec-tions that correlate at well locations to thinner more closelyspaced sandstone-shale alternations. The K-horizon repre-sents shallow-marine, fine to medium-grained sandstone,deposited in a high- to medium-energy environment (Sandal1996, p. 186). Basinwards, the shelf break is marked byan increase in amplitude, a distinctive break in slope andbasinal reflections onlapping the slope.
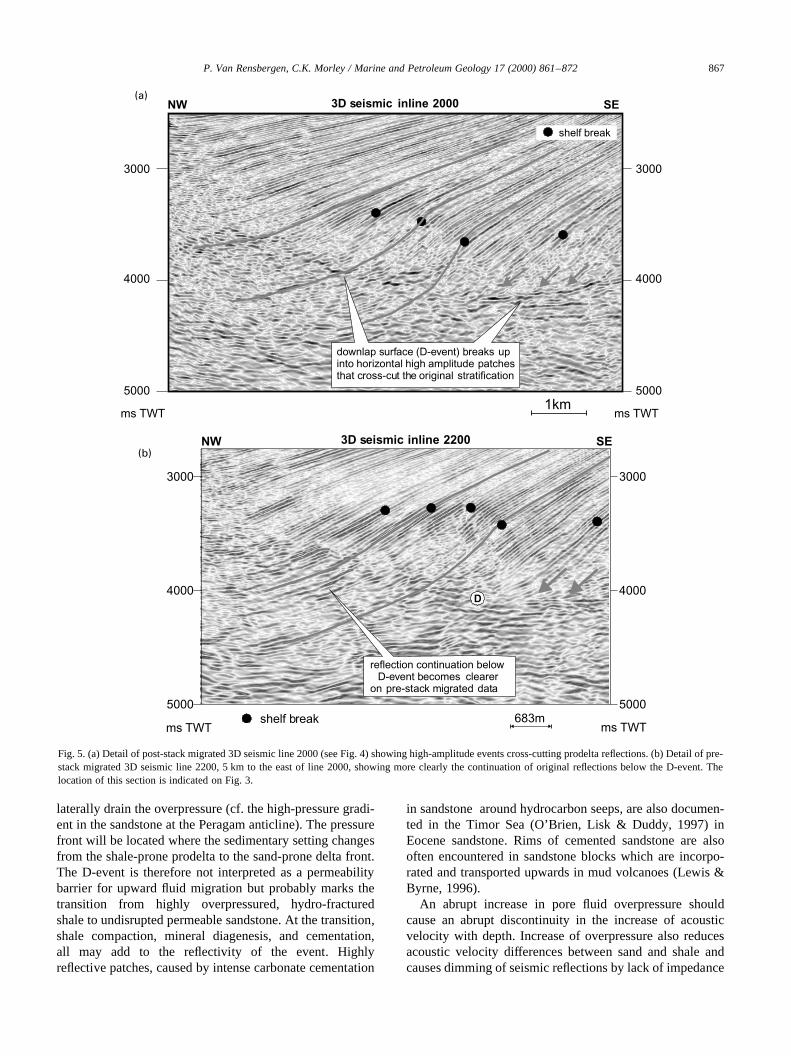
The D-event, against which reflections apparentlydownlap, is superficially a high-amplitude, continuousreflection (Fig. 4). However, when looking at it in detail
the D-event does not appear to be a single continuoussurface. The high-amplitude continuous reflection consistsof individual, aligned, high-amplitude patches that cross-cutoriginal stratification (Fig. 5). The original reflections aresubdued, but still visible, below the high-amplitude patches.Along strike, the depth of the D-event changes abruptly todeeper and shallower levels. It is impossible to map theD-event as a horizon or as a listric fault without at somepoint cross-cutting undisrupted, continuous reflections. Ondip sections, the D-event cuts the original horizons belowthe shelf break and seems to run roughly parallel to theposition of the shelf edge throughout the section (Fig. 5).
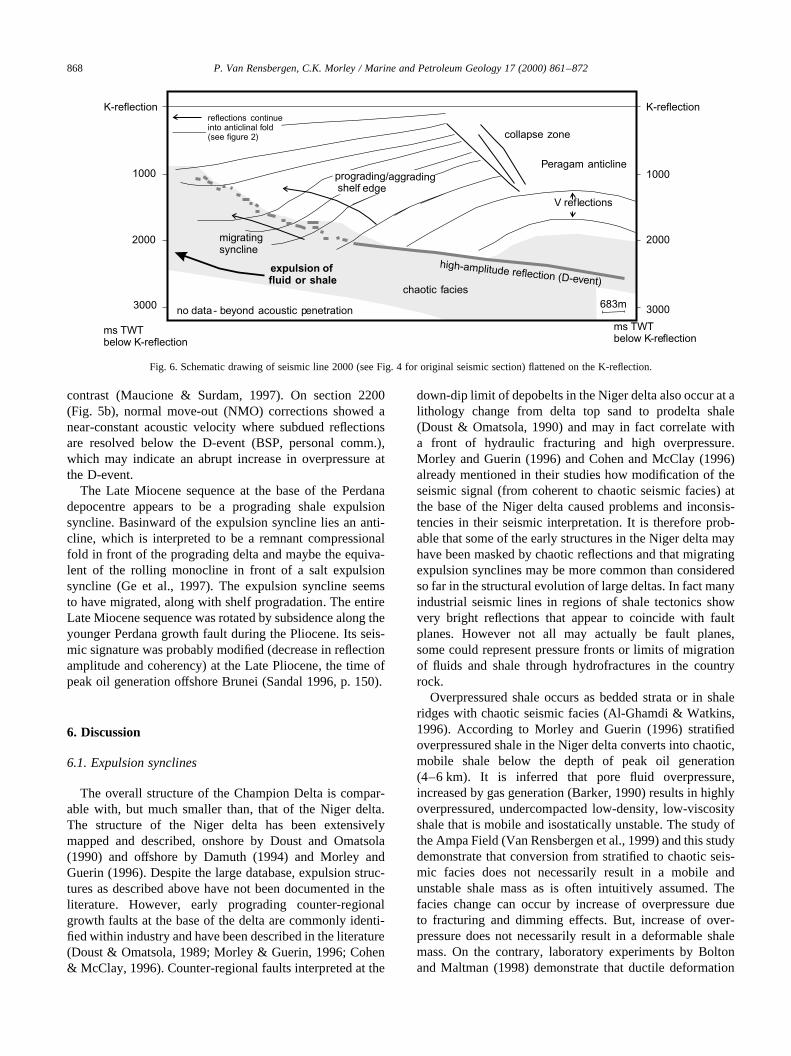
On a schematic cross-section flattened on the K-horizon(Fig. 6) the Late Miocene sequence (between V and Kreflections) appears to be a rapidly aggrading sequence,with a subsiding syncline in front of the shelf break. Thesyncline migrates to the south, synchronously with progra-dation of the shelf edge. On the regional line (Fig. 2), it can
P. Van Rensbergen, C.K. Morley / Marine and Petroleum Geology 17 (2000) 861–872 865
3500
3000
2500
2000
1500
1000
1500
1000
2500
Figure5a
Figure5b
Figure4,6
1000
1500
2000
500
7000
5000
2500
3000
1000
Inlin
es
traces
dens
ely
frac
ture
dzo
nein
hang
ing
wal
l of
Cha
mpi
onfa
ult
zone
crest of Iron Dukeinversion anticline (L.Pliocene)
Time-structure mapK- r eflectionin ms TWT
1
2
3
dow
nth
row
nsi
de
of P
lioce
ne
Perd
ana
counte
r-re
gio
nal
grow
thfa
ult
1crest of Peragam anticline(Late Miocene)
3Amcott growth fault(Plio-Pleistocene)
Iron Duke collapse graben(Late Miocene - Early Pliocene)2
0 5km
contour interval 1 00 m s
fault heave
Fig. 3. Time structure map of the K-reflection, top of the Late Miocene depocentre. See Fig. 1 for location.
be seen that the syncline, below the K-reflection, is flankedbasinward by a small anticlinal fold north of the 3D block.The northern flank of the anticlinal fold is truncated by thePerdana fault.
5. Interpretation
The D-event could be interpreted as a low-angle normalfault if the section below it were simply regarded ascomposed of incoherent reflections, as it appears on 2Ddata. The 3D data presented here show the presence ofsubdued reflections below the high-amplitude D-event.The subdued reflections have similar dips to the strongreflections overlying the D-event and do not appear to beoffset much by it. Listric normal faults in deltas typicallydisplay strongly rotated beds in the hanging wall and sub-horizontal beds in the footwall. Drag faults associated to alarger listric fault may cause small offsets between reflec-tions of similar dips at the base of the rollover (Mauduit &Brun, 1998). This is unlikely in this case since the onset ofthe major listric growth fault, the Perdana fault, clearly post-dates deposition of the Late Miocene sequence. Conse-quently, both from offset of reflections and geometrically,the D-event does not, in detail, resemble a typical growthfault and the section below it cannot be interpreted as“mobile” shale.
The D-event is not random noise but occurs in coherentpatches and is restricted to the prodelta sediment. The high-amplitude D-event marks the top of a zone where originalprodelta reflections are subdued. A similar lateral facies
change from high-amplitude, continuous reflections tosubdued, disrupted reflections has also been documentedfor a Late Miocene depocentre near the Ampa Field in theBaram delta, offshore Brunei (Van Rensbergen et al., 1999).In the Ampa Field area the facies change also only affectedprodelta sediments. The effect was attributed to increasingoverpressure within already overpressured shale after deepburial, probably by hydrocarbon maturation and crackingof oil to gas. Hydrofracturing and expulsion of highlyoverpressured fluid was the proposed mechanism fordegeneration of the seismic reflections and resulted inthe formation of a swarm of intrusive shale dykes and sillsin the Pliocene overburden. For the Ampa Field the over-pressuring event was found to occur about 9 Ma later thaninitial synsedimentary deformation of the underlying Setapshale.
The modification of the seismic facies at the base of theChampion delta is, in accordance to the example in theAmpa field area, interpreted as a result of extreme over-pressure increase and hydrofracturing within beddedprodelta deposits. The D-event is interpreted to representthe front of hydraulic fracturing related to overpressuredfluid migration, from an underlying region of mobile shaleinto stratified prodelta sediments, or to secondary overpres-sure generation within the prodelta sediment itself. Theconsequences of our interpretation imply that overpressuremay be generated within the Late Miocene prodelta sedi-ment rather than caused by migration of overpressuredfluids from below. If overpressure is generated locally itmay attain lithostatic values within the prodelta shale butit will dissipate where sandstone is sufficiently abundant to
P. Van Rensbergen, C.K. Morley / Marine and Petroleum Geology 17 (2000) 861–872866
1000
0
2000
3000
4000
5000 5000
4000
3000
2000
1000
0SENW
ms TWT ms TWT
1km
V
K
Champion GF
ChampionPeragamChampion WestPerdana Growth Fault
Peragamanticline
DD
3D seismic inline 2000Figure5a
Fig. 4. 3D Seismic line 2000 through the Late Miocene Perdana depocentre (about similar position as Fig 2). Note the apparent downlap on a high-amplitudeevent (D-event).
laterally drain the overpressure (cf. the high-pressure gradi-ent in the sandstone at the Peragam anticline). The pressurefront will be located where the sedimentary setting changesfrom the shale-prone prodelta to the sand-prone delta front.The D-event is therefore not interpreted as a permeabilitybarrier for upward fluid migration but probably marks thetransition from highly overpressured, hydro-fracturedshale to undisrupted permeable sandstone. At the transition,shale compaction, mineral diagenesis, and cementation,all may add to the reflectivity of the event. Highlyreflective patches, caused by intense carbonate cementation
in sandstone around hydrocarbon seeps, are also documen-ted in the Timor Sea (O’Brien, Lisk & Duddy, 1997) inEocene sandstone. Rims of cemented sandstone are alsooften encountered in sandstone blocks which are incorpo-rated and transported upwards in mud volcanoes (Lewis &Byrne, 1996).
An abrupt increase in pore fluid overpressure shouldcause an abrupt discontinuity in the increase of acousticvelocity with depth. Increase of overpressure also reducesacoustic velocity differences between sand and shale andcauses dimming of seismic reflections by lack of impedance
P. Van Rensbergen, C.K. Morley / Marine and Petroleum Geology 17 (2000) 861–872 867
3000
4000
5000 5000
4000
3000
ms TWTms TWT1km
downlap surface (D-event) breaks upinto horizontal high amplitude patchesthat cross-cut the original stratification
Fig. 5. (a) Detail of post-stack migrated 3D seismic line 2000 (see Fig. 4) showing high-amplitude events cross-cutting prodelta reflections. (b) Detail of pre-stack migrated 3D seismic line 2200, 5 km to the east of line 2000, showing more clearly the continuation of original reflections below the D-event. Thelocation of this section is indicated on Fig. 3.
contrast (Maucione & Surdam, 1997). On section 2200(Fig. 5b), normal move-out (NMO) corrections showed anear-constant acoustic velocity where subdued reflectionsare resolved below the D-event (BSP, personal comm.),which may indicate an abrupt increase in overpressure atthe D-event.
The Late Miocene sequence at the base of the Perdanadepocentre appears to be a prograding shale expulsionsyncline. Basinward of the expulsion syncline lies an anti-cline, which is interpreted to be a remnant compressionalfold in front of the prograding delta and maybe the equiva-lent of the rolling monocline in front of a salt expulsionsyncline (Ge et al., 1997). The expulsion syncline seemsto have migrated, along with shelf progradation. The entireLate Miocene sequence was rotated by subsidence along theyounger Perdana growth fault during the Pliocene. Its seis-mic signature was probably modified (decrease in reflectionamplitude and coherency) at the Late Pliocene, the time ofpeak oil generation offshore Brunei (Sandal 1996, p. 150).
6. Discussion
6.1. Expulsion synclines
The overall structure of the Champion Delta is compar-able with, but much smaller than, that of the Niger delta.The structure of the Niger delta has been extensivelymapped and described, onshore by Doust and Omatsola(1990) and offshore by Damuth (1994) and Morley andGuerin (1996). Despite the large database, expulsion struc-tures as described above have not been documented in theliterature. However, early prograding counter-regionalgrowth faults at the base of the delta are commonly identi-fied within industry and have been described in the literature(Doust & Omatsola, 1989; Morley & Guerin, 1996; Cohen& McClay, 1996). Counter-regional faults interpreted at the
down-dip limit of depobelts in the Niger delta also occur at alithology change from delta top sand to prodelta shale(Doust & Omatsola, 1990) and may in fact correlate witha front of hydraulic fracturing and high overpressure.Morley and Guerin (1996) and Cohen and McClay (1996)already mentioned in their studies how modification of theseismic signal (from coherent to chaotic seismic facies) atthe base of the Niger delta caused problems and inconsis-tencies in their seismic interpretation. It is therefore prob-able that some of the early structures in the Niger delta mayhave been masked by chaotic reflections and that migratingexpulsion synclines may be more common than consideredso far in the structural evolution of large deltas. In fact manyindustrial seismic lines in regions of shale tectonics showvery bright reflections that appear to coincide with faultplanes. However not all may actually be fault planes,some could represent pressure fronts or limits of migrationof fluids and shale through hydrofractures in the countryrock.
Overpressured shale occurs as bedded strata or in shaleridges with chaotic seismic facies (Al-Ghamdi & Watkins,1996). According to Morley and Guerin (1996) stratifiedoverpressured shale in the Niger delta converts into chaotic,mobile shale below the depth of peak oil generation(4–6 km). It is inferred that pore fluid overpressure,increased by gas generation (Barker, 1990) results in highlyoverpressured, undercompacted low-density, low-viscosityshale that is mobile and isostatically unstable. The study ofthe Ampa Field (Van Rensbergen et al., 1999) and this studydemonstrate that conversion from stratified to chaotic seis-mic facies does not necessarily result in a mobile andunstable shale mass as is often intuitively assumed. Thefacies change can occur by increase of overpressure dueto fracturing and dimming effects. But, increase of over-pressure does not necessarily result in a deformable shalemass. On the contrary, laboratory experiments by Boltonand Maltman (1998) demonstrate that ductile deformation
P. Van Rensbergen, C.K. Morley / Marine and Petroleum Geology 17 (2000) 861–872868
Fig. 6. Schematic drawing of seismic line 2000 (see Fig. 4 for original seismic section) flattened on the K-reflection.
of shale only occurs when overpressure is below lithostatic.Overpressure increase above lithostatic results mainly inbrittle deformation, fracturing and fluid expulsion. As isdemonstrated onshore and offshore Brunei (Morley et al.,1998; Van Rensbergen et al., 1999), shale diapirism asso-ciated with hydrocarbon-generated overpressuring occursthrough upward flow of low-viscosity shale along shaledykes and results in mud volcanism at the sea floor.
Most mobilisation of shale is interpreted to occur atsome considerable depth (several kilometres) whenoverburden loading of undercompacted shale leads tooverpressured conditions of the pore fluids. Howeverthere is also evidence for mobile shale activity at veryshallow (upper few hundred meters) depths of burial aswell, for example in the Palaeocene clays of the NorthSea (Henriet et al., 1991). The creation of an expulsionsyncline requires loading of the mobile unit at a relativelyshallow depth (e.g. Ge et al., 1997). In the case of salt,expulsion is achieved by driving the salt out from under-neath the prograding wedge to form a primary weld.Expulsion associated with shale is still poorly understood.It may include some movement of the shale mass, but itmay be primarily a compaction-related mechanism wherefluids are driven out from the shale mass underneath theprograding wedge, but most of the shale remains behind.If in the shallow subsurface shale contains about 50–60%water then there would clearly be the potential to createconsiderable accommodation space by compaction andloss of pore fluids accompanied by extensive minor fault-ing, as described by Henriet, De Batist and Verschuren(1991). This interpretation is further elaborated in thefollowing paragraph that shortly describes an exampleof a shale ridge in the footwall of a large, down-to-basin, Outer Shelf Growth Fault in the Baram deltaprovince.
6.2. Shale ridges
Shale rollers or shale ridges at the base of large down-to-basin growth faults are often interpreted as rising shalebulges or reactive diapirs created by shale withdrawalfrom beneath the prograding/aggrading delta (Doust &Omatsola, 1990; Bradshaw & Watkins 1996; McClayet al., 1998). It can be expected to find a shale ridge basin-wards of a migrating expulsion syncline but the datadescribed above do not-except for a small anticlinal fold-image such structure. In the Champion delta area the outlineand structure of early shale rollers are concealed by over-pressure-induced chaotic seismic facies and probablydeformed into inversion anticlines (e.g. the Ampa anticline)during the Late Pliocene. For comparison, a seismic sectionof the outer part of the Baram delta is discussed here (Fig. 7).The outer part of the Baram delta is mainly Late Pliocene toPleistocene in age and the seismic facies has not beenaltered by extreme overpressure increase induced by gasgeneration. The discussion is illustrated with some selected
screen dumps kindly provided by BSP but no detailedhorizon interpretation could be made.
The Pliocene Baram delta prograded over the easternmargin of the Champion delta and accumulated over6 km of sediment. Maximum thickness is reached inthe hanging wall of the Outer Shelf Growth Fault,close to the present day shelf edge (Fig. 1). The structureof the Baram delta is characterized by a Gulf of Mexicostructural style (e.g. Bradshaw & Watkins, 1996) ofparallel, down-to-basin growth faults perpendicular tothe direction of sediment supply from the Baram river(Fig. 7). The Outer Shelf Growth Fault is up to 50 kmlong and has a maximum throw of about 6 km. In itsfootwall, a large shale ridge of about 9 km wide and1.5 s (about 4.5 km) high occurs along the entire lengthof the fault (Fig. 7).
Fig. 7 compares a 2D seismic section through the shaleridge with a 3D seismic section at about the same location.On 2D seismic data the shale ridge is characterized by atypical chaotic facies interpreted as mobile shale. But, on3D seismic data the shale ridge appears to be a stratifiedhorst block of probably prodelta shale. The weak stratifica-tion of shale is on 2D data lost in noise below faults. Thealmost undeformed shale ridge occurs between two subsid-ing basins filled with prodelta to sandy delta top sediment.The sediment in the subsiding basin in the footwall of thegrowth fault consists of a lower sequence of densely faultedprodelta shales (sequence 1), a sequence containing a seriesof prograding/aggrading delta fronts (sequence 2), andan overburden of delta top sediment (sequence 3).Sequence 1 is densely faulted and fractured, sequences2 and 3 are affected by subsidence along paired regionaland counter-regional growth faults.
The most striking difference between prodelta sedimentin the shale ridge and the prodelta sediment in the adjoiningsubsiding basin (sequence 1) is the degree of fracturing.Sequence 1 is affected by intense, extensional faulting.This deformation can be interpreted as result of fluidexpulsion and subsequent collapse of undercompacted,shale (Cartwright & Dewhurst, 1998). This process islimited to sequence 1 and occurred during relatively shal-low burial and probably triggered growth faulting of theoverburden. The shale ridge stands out as an unfaulted horstblock and shows that shale ridges are not necessarily diapiricstructures of isostatically unstable shale and that adjacentexpulsion depocentres can be created by localised compac-tion and fluid expulsion without much movement of shale(Fig. 8).
7. Conclusions
This paper describes an example of a migrating expulsionsyncline related to mobile shale, interpreted from 3D seis-mic data offshore Brunei. Such structures have not beenpreviously described for mobile shale, partly due to the
P. Van Rensbergen, C.K. Morley / Marine and Petroleum Geology 17 (2000) 861–872 869
Fig. 7. (A) Line drawing of section through the Baram delta at the western part of the Brunei shelf (after Sandal, 1996). See Fig. 1 for location. (B) Detail of 2D seismic section of the Baram delta at the Outer ShelfGrowth Fault. The ridge with chaotic seismic facies in the footwall of the Outer Shelf Growth Fault is traditionally interpreted as a bulge of mobile shale formed by differential loading and shale expulsion in frontof a prograding delta. (C) Detail of 3D seismic section at about the same location showing undisturbed stratification within the shale ridge. The ridgeappears to be horst block of prodelta shale between twosubsiding basins filled with delta top sediment.
limited resolution of seismic data in areas of mobile shale.Associated with the feature is a sub-horizontal reflection,which divides steeply dipping strongly reflective unitsabove from similarly dipping, weakly reflective unitsbelow. It is interpreted to represent a front associated withhydraulic fracturing due to overpressure increase in prodeltashale. Without the resolution provided by 3D seismic datasuch features could easily be interpreted as detachmentsrelated to listric normal faults over a substratum of mobileshale. Expulsion synclines associated with mobile shalemay develop more by compaction and expulsion of porefluids, than by driving the entire shale mass out of the
area of progradation. In this mechanism shale expulsionsynclines differ from those associated with salt.
Acknowledgements
We would like to thank Brunei Shell Petroleum (BSP)and the Petroleum Unit (PU) for supporting the Departmentof Petroleum Geosciences at the University of BruneiDarussalam (UBD) and making the seismic data availablefor research. Seismic interpretation software was suppliedby Landmark Graphics Cooperation under the StrategicUniversity Alliance Grant Agreement (no. LG137V166/122). P. Van Rensbergen holds a UBD research fellowship.
The manuscript was reviewed for Marine and PetroleumGeology by P. Cobbold.
References
Al-Ghamdi, A. M., & Watkins, J. S. (1996). Structural styles and deposi-tional history of North and South Padre Island OCS areas, OffshoreSouth Texas. In J. O. Jones & R. L. Freed,Structural framework ofthe Northern Gulf of Mexico. Special Publication of the Gulf CoastAssociation of Geological Societies(pp. 1–8). Gulf Coast Associationof Geological Societies.
Barker, C. (1990). Calculated volume and pressure changes during the thermalcracking of oil to gas in reservoirs.AAPG Bulletin, 74, 1404–1413.
Bolton, A., & Maltman, A. (1998). Fluid-flow pathways in actively deform-ing sediments: the role of pore fluid pressures and volume change.Marine and Petroleum Geology, 15, 281–297.
Bradshaw, B. E., & Watkins, J. S. (1996). Growth fault evolution inoffshore Texas. In J. O. Jones & R. L. Freed,Structural framework ofthe Northern Gulf of Mexico. Special Publication of the Gulf CoastAssociation of Geological Societies(pp. 103–110). Gulf CoastAssociation of Geological Societies.
Cartwright, J. A., & Dewhurst, D. N. (1998). Layer-bound compactionfaults in fine grained sediments.Geological Society of America Bulletin,110, 1242–1257.
Cohen, H. A., & McClay, K. (1996). Sedimentation and shale tectonics ofthe northwestern Niger Delta front.Marine and Petroleum Geology, 13,313–328.
Damuth, J. E. (1994). Neogene gravity tectonics and depositional processeson the deep Niger Delta continental margin.Marine and PetroleumGeolgoy, 11, 320–346.
Demercian, S., Szatmari, P., & Cobbold, P. R. (1993). Style and pattern ofsalt diapirs due to thin-skinned gravitational gliding, Campos andSantos basins, offshore Brazil.Tectonophysics, 228, 393–433.
Doust, H., & Omatsola, E. (1990). Niger Delta. In J. D. Edwards &P. A. Santogrossi,Divergent/Passive Margin Basins. AAPG Memoir48 (pp. 201–238). AAPG.
Ge, H., Jackson, M. P. A., & Vendeville, B. C. (1997). Kinematics anddynamics of salt tectonics driven by progradation.AAPG Bulletin,81 (3), 398–423.
Henriet, J. P., De Batist, M., & Verschuren, M. (1991). Early fracturing ofPalaeogene clays, southermost North Sea: relevance to mechanisms ofprimary hydrocarbon migration. In A. M. Spencer,Special Publicationof the European Association of Petroleum Geosciences(pp. 217–227),vol. 1. European Association of Petroleum Geosciences.
James, D. M. D. (1984).The geology and hydrocarbon resources of Negarabrunei Darussalam, Berhad: Muzium Brunei and Brunei ShellPetroleum Company (special publication).
Lewis, J. C., & Byrne, T. (1996). Deformation and diagenesis in an ancientmud diapir, southwest Japan.Geology, 24, 303–306.
P. Van Rensbergen, C.K. Morley / Marine and Petroleum Geology 17 (2000) 861–872 871
prograding deltaundercompacted
prodelta shale2
1
65
43
21
54
3
21
apparent rollingmonocline
migrating expulsionsyncline
prograding/aggradingshelf edge
54
3
21
compaction accommodatedby delta top growth faults
3
21
localised compactionof prodelta shale
localised compaction ofwaterlogged shale
delta top sediment
baselap in subsidingprodelta basin
prodelta sediment
Fig. 8. Cartoon illustrating the possible formation of a migrating expulsionsyncline in front of a prograding/aggrading delta. Compaction of water-logged prodelta shale under a prograding delta front can create localisedsubsidence that proceeds in pace with delta progradation. Basinwards,undercompacted shale may form a rolling monocline that traps turbiditesand slope sediments. Later, after deep burial, deterioration of the acousticstratification due to hydrocarbon generation often masks early expulsionsynclines on seismic data. See text for discussion.
Maucione, D. T., & Surdam, R. C. (1997). Seismic response characteristicsof a regional scale pressure compartment boundary, Alberta Basin,Canada. In R. C. Surdam,Seals, traps, and the petroleum systemAAPG Memoir 67(pp. 269–281).
Mauduit, T., & Brun, J. P. (1998). Growth fault/rollover systems: birth,growth, and decay.Journal of Geophysical Research, 103 (B8), 18,119–18,136.
McClay, K. R., Dooley, T., & Lewis, G. (1998). Analog modeling ofprogradational delta systems.Geology, 26 (9), 771–774.
Mohriak, W. U., Macedo, J. M., Castellani, R. T., Rangel, H. D., Barros, A.Z. N., Latge, M. A., Ricci, J. A., Mizusaki, A. M., Szatmari, P., Demer-cian, L. S., Rizzo, J. G., & Aires, J. R. (1995). Salt tectonics andstructural style in the deep water province of the Cabo Frio region,Rio de Janeiro, Brazil. In M. P. A. Jackson, R. G. Roberts & S. Snelson,et al.,Salt tectonics: a global perspective. AAPG Memoir 65(pp. 273–304).
Morley, C. K., & Guerin, G. (1996). Comparison of gravity-drivendeformation styles and behaviour associated with mobile shale andsalt.Tectonics, 15, 1154–1170.
Morley, C. K., Crevello, P., & Haji Ahmad, Z. (1998). Shale tectonics and
deformation associated with active diapirism: the Jerudong Anticline,Brunei Darussalam.Journal of the Geological Society of London, 155,475–490.
O’Brien G. W., Lisk, M., & Duddy, I. (1997). Fault reactivation as aprimary control on trap breach and fluid migration histories: TimorSea, north-western Australia. In: J. Hendry, P. Carey, J. Parnell, A.Ruffel, R. Worden (Eds.),Geofluids II Extended Abstract Volume,University of Belfast, pp. 166–169.
Osborne, M. J., & Swarbrick, R. E. (1997). Mechanisms for generatingoverpressure in sedimentary basins: a reevaluation.AAPG Bulletin,81, 1023–1041.
Sandal, S. T. (1996).The Geology and Hydrocarbon Resources ofNegara Brunei Darussalem, (1996 revision). Brunei Shell PetroleumCompany/Brunei Museum, Syabas Bandar Seri Begawan, BruneiDarussalem.
Van Rensbergen, P., Morley, C. K., Ang, D. W., Hoan, T. Q., & Lam,N. T. (1999). Structural evolution of shale diapirs from reactiverise to mud volcanism: 3D seismic data from the Baram delta,offshore Brunei Darussalam.Journal of the Geological Society ofLondon, 156, 633–650.
P. Van Rensbergen, C.K. Morley / Marine and Petroleum Geology 17 (2000) 861–872872