+ All Categories
Home > Documents > 3D Urban Visualization - proceedings.esri.com

3D Urban Visualization - proceedings.esri.com

Date post: 30-Jan-2022
Category:
Upload: others
View: 10 times
Download: 0 times
Share this document with a friend
23
1001 Bishop Street, Suite 822 Pauahi Tower, Honolulu Hawaii 96813 Honolulu, Hawaii Building Footprint Geo-Database Project: 3D Urban Visualization Paper# 1693 June 25, 2004 Primary Authors: Harley Pennington and Steven Hochart Co-Authors: Ken Schmidt and Alan Cadieux
Transcript

1001 Bishop Street, Suite 822 Pauahi Tower, Honolulu Hawaii 96813

Honolulu, Hawaii Building Footprint Geo-Database Project: 3D Urban Visualization

Paper# 1693 June 25, 2004

Primary Authors: Harley Pennington and Steven Hochart

Co-Authors: Ken Schmidt and Alan Cadieux

Honolulu, Hawaii Building Footprint Geo-Database Project: Paper#: 1693 3D Urban Visualization Date: June 30, 2004

© I-Hawaii, Inc. 2004 Page 2 of 23 USTable of Contents – Table of Figures

.

TABLE OF CONTENTS

Table of Contents............................................................................................................................ 2 Table of Figures .......................................................................................................................... 3 Table of Tables ........................................................................................................................... 3

Abstract ........................................................................................................................................... 4 1 Forward ................................................................................................................................... 5 2 Introduction............................................................................................................................. 6 3 Project Work Plan and Implementation.................................................................................. 7

3.1 Project Preparation and Deliverables.............................................................................. 7 3.2 Implementation Software................................................................................................ 8 3.3 Aerial Photography Acquisition ..................................................................................... 9 3.4 Project Phase Acquisition Area .................................................................................... 10 3.5 SDTS DEM................................................................................................................... 10 3.6 Registration of Maps, Images and Cameras ................................................................. 11

4 Modeling Methods For Buildings......................................................................................... 12 4.1 Modeling Primitives...................................................................................................... 12 4.2 Building Textures......................................................................................................... 13 4.3 Ground Textures ........................................................................................................... 13

5 Visualization ......................................................................................................................... 14 5.1 Animations.................................................................................................................... 14 5.2 Representation of Building Models in ArcScene.......................................................... 15

5.2.1 Purpose Of Creating ArcScene Projects ............................................................... 15 5.2.2 Creating The ArcScene Projects Using ArcGIS9 Model Builder......................... 15

6 Building FootPrint Geo-Database Applications ................................................................... 17 6.1 Building Footprint Geo-Database Design..................................................................... 17

6.1.1 Purpose Of The Design......................................................................................... 17 6.1.2 Design ................................................................................................................... 17

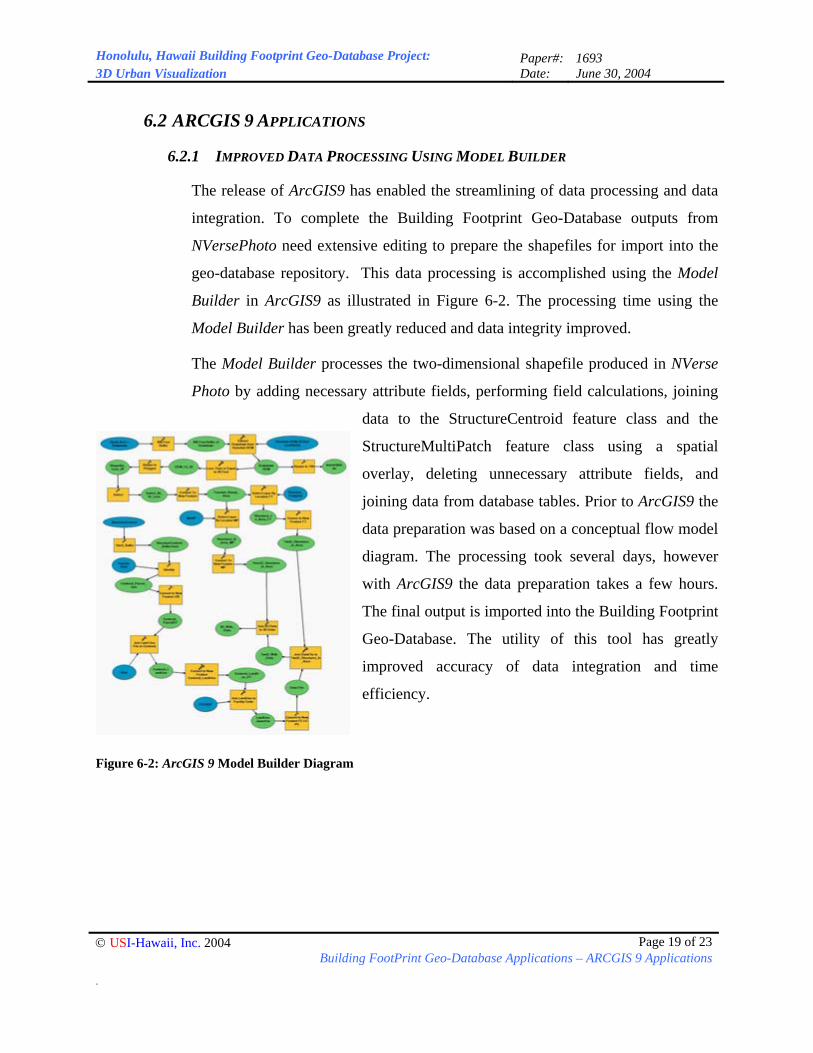
6.2 ARCGIS 9 Applications ............................................................................................... 19 6.2.1 Improved Data Processing Using Model Builder ................................................. 19

7 Conclusion ............................................................................................................................ 20 8 Acknowledgements............................................................................................................... 21 9 Notes ..................................................................................................................................... 21 10 References......................................................................................................................... 22 11 Authors’ Information ........................................................................................................ 23

Honolulu, Hawaii Building Footprint Geo-Database Project: Paper#: 1693 3D Urban Visualization Date: June 30, 2004

© I-Hawaii, Inc. 2004 Page 3 of 23 USTable of Contents – Table of Figures

.

TABLE OF FIGURES

Figure 3-1: GIS Planning & System Life Cycle ............................................................................. 7 Figure 3-2: ArcScene Models and Deliverables ............................................................................. 7 Figure 3-3: Image End-lap & Side-lap Example ............................................................................ 9 Figure 3-4: Phase 1 Acquisition, Image Footprints ........................................................................ 9 Figure 3-5: Project Phases ............................................................................................................ 10 Figure 3-6: SDTS DEM................................................................................................................ 10 Figure 3-7: Tie Points and Ground Control Points ....................................................................... 11 Figure 3-8: Ground Control Point Map ........................................................................................ 11 Figure 4-1: Flat Roof Example ..................................................................................................... 12 Figure 4-2: Modeling Diagram ..................................................................................................... 12 Figure 5-1: ArcScene Project........................................................................................................ 15 Figure 5-2: ArcScene Downtown Honolulu 3D Cube .................................................................. 16 Figure 6-1: Visio Geo-Database Model ........................................................................................ 18 Figure 6-2: ArcGIS 9 Model Builder Diagram ............................................................................. 19

TABLE OF TABLES

Table 4-1: Texture Example ......................................................................................................... 13 Table 4-2: Obscured Roof............................................................................................................. 13 Table 4-3: Obscuration Detected .................................................................................................. 13 Table 4-4: Buildings w/ Ground Textures .................................................................................... 14 Table 5-1: Camera Path ................................................................................................................ 14 Table 6-1: Two-Dimensional Feature Class Attributes ................................................................ 17

Honolulu, Hawaii Building Footprint Geo-Database Project: Paper#: 1693 3D Urban Visualization Date: June 30, 2004

© I-Hawaii, Inc. 2004 Page 4 of 23 USAbstract – Table of Tables

.

Paper#: 1693 Session Tile: Visualization Methods for Urban Planning Date: Thursday, August 12, 2004 Time: 1:30 pm – 3:00 pm Room: 25-C

ABSTRACT

The Building Footprint Geo-Database Project (Project) was undertaken by the City and County of Honolulu (City), Department of Planning and Permitting to further enhance the City's existing Geographical Information System (GIS). The City contracted USI-Hawaii Inc. to implement data acquisition and Geo-Database development. The Project examined acquisition methods and building data sources, evaluated building geometry extraction software, planned implementation and data acquisition for the island of Oahu, designed a Building Footprint Geo-Database, and implemented an initial Project phase. This paper summarizes methods used to implement the Project which delivered user data requirements and system assessment reports, system design documents, work plans, aerial photography, ArcGIS control point maps, ESRI Geo-Databases, Nverse Photo project files, ArcScene project files, and fly-thru animations. ArcGIS 9 enhanced functionality will greatly improve the users experience with 3D spatial information and enhancement. All of these enhancements in technologies and data acquisition will further support necessary City services for land use planning, tax assessment, construction permitting, utility management, homeland security, and other major programs.

Honolulu, Hawaii Building Footprint Geo-Database Project: Paper#: 1693 3D Urban Visualization Date: June 30, 2004

© I-Hawaii, Inc. 2004 Page 5 of 23 USForward – Table of Tables

.

1 FORWARD

Building footprints have typically been created and maintained as a 2D polygon

with or without building height data. With improvements in GIS 3D viewing, i.e.,

ArcScene, users have been able to extrude these polygons to create simple models.

These simple models fall short of characterizing the building architecture. Converting

2D as-built drawings and designs of 3D buildings is very costly. Likewise, CAD files

would be costly to convert as these are more often used in 2D rather than 3D to create

building plans. Acquisition of 3D CAD files from architectural firms would also be cost

prohibitive.

Aerial photography has been used as a primary source of building footprints

while commercial satellite imagery has only recently advanced enough to provide the

required detail to begin to compete. Aerial photography was used for this Project as

image resolutions need to be at least 1 foot per pixel. High resolution images provide

the ability to precisely measure elevations and produce the best building models. Low

resolution images may only be able to pick up a few pixels of elevation displacement

from one image to the next and results in poor building models with roughly the same

amount of effort.

The exciting development in this Project is software improvements that allow

the capturing and visualization of detailed building shapes, roof morphology, and

realistic texturing from aerial photography. Similar types of 3D software packages use

stereo imaging which is an off-shoot of the days when photogrammetrist would use

zoom transfer scopes and other stereo viewing equipment. Typical stereo viewing

software requires users to wear glasses and use special computer pointing devices to

navigate through images while capturing 3D data.

Nverse Photo allows users to work comfortably in a 2D environment and

capture 3D buildings, surfaces, and other structures. Modeling urban environments has

never been easier. We are excited about what we have accomplished in Honolulu and

we hope you will benefit from our experience.

Honolulu, Hawaii Building Footprint Geo-Database Project: Paper#: 1693 3D Urban Visualization Date: June 30, 2004

© I-Hawaii, Inc. 2004 Page 6 of 23 USIntroduction – Table of Tables

.

2 INTRODUCTION

The Building Footprint Geo-Database Project (Project) was undertaken by the

City and County of Honolulu (City), Department of Planning and Permitting to further

enhance the City's existing Geographical Information System (GIS). The City

contracted USI-Hawaii Inc. to implement data acquisition and Geo-Database

development. The Project examined acquisition methods and building data sources,

evaluated building geometry extraction software, planned implementation and data

acquisition for the island of Oahu, designed a Building Footprint Geo-Database, and

implemented an initial Project phase.

This paper summarizes methods used to implement the Project which delivered

user data requirements and system assessment reports, system design documents, work

plans, aerial photography, ArcGIS control point maps, ESRI Geo-Databases, Nverse

Photo project files, ArcScene project files, and fly-thru animations. ArcGIS 9 enhanced

functionality will greatly improve the users experience with 3D spatial information.

All of these enhancements in technologies and data acquisition will further support

necessary City services for land use planning, tax assessment, construction permitting,

utility management, homeland security, and other major programs.

These following sections cover the 1) Project Work Plan and Implementation,

2) Modeling Methods for Buildings, 3) Visualization, and 4) Building Footprint Geo-

Database Applications. The Project Work Plan and Implementation section discusses

the project preparation, implementation software, and acquisition of aerial photography,

digital image requirements, SDTS DEM acquisition, ground control points and image

registration. Modeling Methods outline the simple geometric primitives used to

construct a building model. Visualization discusses building and ground textures,

Ortho-Rectification, the setup of images, models, and cameras used to prepare a fly-

thru animation. Building Footprint Geo-Database Applications focuses on improving

the user experience by leveraging ArcGIS 9 to process 3D spatial information.

Honolulu, Hawaii Building Footprint Geo-Database Project: Paper#: 1693 3D Urban Visualization Date: June 30, 2004

© I-Hawaii, Inc. 2004 Page 7 of 23

3 PROJECT WORK PLAN AND IMPLEMENTATION

3.1 PROJECT PREPARATION AND DELIVERABLES

The City implemented, to some degree, all of the initial GIS planning steps,

e.g., strategic business plan review, planning proposal, technology seminars, user

needs, and requirements analysis. This Project determined the City GIS system scope,

decided on a preliminary system design, provided a work plan, and 4) implement the

work plan.

Three preparatory steps were taken prior to the

Project implementation. This delivered the following three

Building Footprint Project documents:

1. Source Data Analysis & Design Report 2. Geo-Database Pilot Study – Software

Evaluation 3. Work Plan & Pricing Proposal

Figure 3-1: GIS Planning & System Life Cycle

With the Project planning documents now

in place, USI-Hawaii proceeded with creating the

following major contract deliverables:

USProject Work Plan and Implementation – Project Preparation and Deliverables

.

4. Animations, 640 x 480 30 fps, 1 m(4 -preliminary & finals)

inute

5. Nverse Photo Project Files 6. Control Point Map Book (for locating

ground stations) 7. Geo-Database System Design Report 8. 4 - Building Footprint Geo-Databases 9. 4 - ArcScene Project Files & GIS

layers (clipped DEM, Background, Ortho-Photo)

Figure 3-2: ArcScene Models and Deliverables

The Source Data Analysis & Design Report established the system scope for the

building information and provided a preliminary system design. Based on this report a

Honolulu, Hawaii Building Footprint Geo-Database Project: Paper#: 1693 3D Urban Visualization Date: June 30, 2004

© I-Hawaii, Inc. 2004 Page 8 of 23 USProject Work Plan and Implementation – Implementation Software

.

final decision was made to complete the design phase by developing a prototype Geo-

Database using two commercially available software packages and documenting the

results in the Geo-Database Pilot Study – Software Evaluation report. The Work Plan

documents, in general terms, all tasks, deliverables, schedules, and budgets for all

phases of the Project. Additionally, the Pricing Proposal Section outlined the specific

tasks, deliverables, schedules and cost for the Project Phase 1 location.

3.2 IMPLEMENTATION SOFTWARE

Implementation of the Building Footprint Geo-Database Project augments a

mature City GIS, as well as, initiates the “Inception Phase” of one or more new

applications by delivering 3D information and improved technology to the City. The

GIS user is provided with practical tools and a feasible approach through improvements

in new technology that aid in data management, acquisition, and visualization of 3D

buildings and other structures. Improvements in ESRI’s ArcGIS allow an enterprise-

wide GIS to manage and distribute 3D spatial information. ArcScene and ArcGlobe

provide a simple but flexible 3D viewing, animation, and simulation interface. These

tools can be used to visualize various analyses thru simulation and animation which is

an exciting experience for the technical and non-technical end users. The introduction

of Model Builder in ArcGIS 9.0 allows for the documenting and execution of complex

GIS processes. These complex processes could take days, but once stored in Model

Builder now can be repeated in minutes to retrieve, clip, analyze, and then setup data in

ArcScene.

The acquisition of 3D building information is simplified for GIS users by

extracting 3D geometry from high resolution aerial photography in a 2D environment.

Precision Lightworks’ Nverse Photo creates detailed textured structures in any standard

projection and datum from multiple aerial photographs using basic digitizing skills and

simple geometric primitives. Additionally, many export formats are supported which

include ESRI’s Multipatch Shapefile format. Nverse Photo is a plug-in for Discreet’s

3D Studio Max, or Visio, which supports the creation of professional 3D modeling

environments. Other video software (e.g., Adobe Premiere) can be used to produce

Honolulu, Hawaii Building Footprint Geo-Database Project: Paper#: 1693 3D Urban Visualization Date: June 30, 2004

© I-Hawaii, Inc. 2004 Page 9 of 23

professional animations with credits, transitions, and other effects from ArcScene or 3D

Studio Max. Leveraging both 3D data and improved technology will result in

innovative ways to help meet demands for GIS related services.

3.3 AERIAL PHOTOGRAPHY ACQUISITION

The minimum imagery requirement for modeling 3D

buildings is digital stereo images of the City & County of

Honolulu. The overlap between images on the same flight path

is at least 60% end-lap. Overlap with parallel flight paths is at

least 30% side-lap. Our estimates would call for a flight

altitude of approximately 6,000 feet or a photograph scale of 1

inch equals 1,000 feet. Each of the 26 images was scanned at

2,117 dots per inch, each creating 1.2 gigabyte TIFF file size.

Figure 3-3: Image End-lap & Side-lap Example

Although Nverse Photo only requires images that overlap, stereo image pairs

ensures a complete acquisition with as few data gaps as

possible. Oblique images are preferred, particularly for

specific site locations; however, flight paths of just oblique

aerial photography could result in many data gaps. Stereo

image pairs provide the most economical and efficient

means to cover large areas. If cost is not a factor, increase

the amount of overlap between images and utilize oblique

shots for landmark areas.

Figure 3-4: Phase 1 Acquisition, Image Footprints

USProject Work Plan and Implementation – Aerial Photography Acquisition

.

Honolulu, Hawaii Building Footprint Geo-Database Project: Paper#: 1693 3D Urban Visualization Date: June 30, 2004

© I-Hawaii, Inc. 2004 Page 10 of 23

3.4 PROJECT PHASE ACQUISITION AREA

The areas interest or Neighborhood Boards include Downtown, Kakaako,

Waikiki, and Diamond Head. The entire

Project building acquisition area spans 7

miles with a width of about 1.5 miles over

the core business, financial, and visitor

accommodations. Imagery extends from

Downtown to Diamond Head as depicted

in Figure 2-4. The Phase 1 area, Figure 2-

5, was later modified to reduce the number

of residential homes and focus on dense

apartment and business corridors.

Figure 3-5: Project Phases

3.5 SDTS DEM

USGS Digital Elevation Models (DEM) for Honolulu was used in the SDTS

format to define the ground elevation. Building base

elevations can either be derived from the DEM or measured

from the imagery. Other DEMs can be used if placed in the

SDTS format. Ground elevation points were often used

within Nverse Photo to refine the DEM elevations. SDTS

DEM’s can be acquired freely from USGS through the GIS

Data Depot, (www.gisdatadepot.com).

Figure 3-6: SDTS DEM

USProject Work Plan and Implementation – SDTS DEM

.

Honolulu, Hawaii Building Footprint Geo-Database Project: Paper#: 1693 3D Urban Visualization Date: June 30, 2004

© I-Hawaii, Inc. 2004 Page 11 of 23

3.6 REGISTRATION OF MAPS, IMAGES AND CAMERAS

Tie Points and Ground Control Points create registration between images and to

City base maps. Square flat shapes are used as tie points

in Figure 3-7 and, in practice, are not drawn as part of the

modeling; these are maintained in separate files to aid the

registration process. Ground Control Points can be used

between images, however, maintained separately both in

Nverse Photo and in ArcGIS Geo-Database which is

registered to the City base maps.

Figure 3-7: Tie Points and Ground Control Points

Maps of each ground control point are provided in Adobe PDF format, in

addition to a ground control point database. Each map locates the site on City base

maps, Nverse Photo aerial photograph, and a vicinity map of City streets, as depicted in

Figure 3-8. The accuracy assessment is scheduled to be completed and will acquire

GPS coordinates to associate with the Ground Control Points (GCP). By deriving the

GCP from the City base maps instead of using a GPS initially, end users will be able to

use the Building Footprint Geo-Database with other City data sets. In this case, relative

accuracy is more important than absolute positional accuracy. The GPS coordinates can

be applied to the Nverse Photo models when the prority for absolute positional

accuracy changes. However, the average 3D error is

approximately 2.29 pixels or 1.09 feet when registered to

the City base maps. Points that vary more than a few feet,

as much as 15 feet are either corrected for placement

while others are not used. Figure 3-7 shows an enlarged

image of a ground control point shown as a purple dot (.) and the location based on the inherent error between

controls in Nverse Photo as a red triangle ( ).

Figure 3-8: Ground Control Point Map

USProject Work Plan and Implementation – Registration of Maps, Images and Cameras

.

Honolulu, Hawaii Building Footprint Geo-Database Project: Paper#: 1693 3D Urban Visualization Date: June 30, 2004

© I-Hawaii, Inc. 2004 Page 12 of 23

4 MODELING METHODS FOR BUILDINGS

4.1 MODELING PRIMITIVES

Buildings are created using simple primitive

shapes and require digitizing a polygon on only one

image. The primitive shape is automatically

transferred to a registered image. Elevation is

measured by placing the primitive on the same object

located in the adjacent image, Figure 4-1. The object

is then extruded to a base elevation, or ground, which

is defined by the DEM or from the image parallax.

Figure 4-1: Flat Roof Example

g.

The basic primitives include points, lines, polygons, as well as an

ellipse. Basic attributes modify the extrusion, set elevation, blend

between primitives to create slopes, define diameters for points and

lines, create awning or slab

effects, and even overhangs for

the eve of a roof. Most of these

basic attributes have parameters

which adjust the actual look of a

technique applied to primitives.

Primitives, attributes, and

parameters in combination result

in precise objects that can form

complex structures. Complex

structures are quite common and

can be easily created by users

with limited trainin

Figure 4-2: Modeling Diagram

USModeling Methods For Buildings – Modeling Primitives

.

Honolulu, Hawaii Building Footprint Geo-Database Project: Paper#: 1693 3D Urban Visualization Date: June 30, 2004

© I-Hawaii, Inc. 2004 Page 13 of 23

4.2 BUILDING TEXTURES

Once a model of a building is constructed, each registered image is used as the

source for the model, even if the geometry is not

physically on the image. The amount of image side-

lap from parallel flight paths and end-lap from

sequential camera stations becomes very important.

Also, oblique shots can greatly improve the image

textures for specific sites. Those buildings that are

full or partially obscured in one or more images

could still draw textures from additional images.

USModeling Methods For Buildings – Building Textures

.

Table 4-1: Texture Example

Obscuration of a building in one image by another building can be

detected once the geometry exists for the buildings involved. This feature can

be used to remove texture mapping errors caused by intervening structures, and

can also be used to remove building lean in an orthographic image. This

provides for incredible results, however, this feature can be costly in terms of

processing time.

Table 4-2: Obscured Roof

ArcGIS 9 MultiPatch objects support image coordinates of 3DS

Max textures. Preliminary testing allow for importing of MultiPatch

textured buildings as marker symbols, however, this is not the

recommended means to import textures. Some development is

necessary before the export of buildings and textures into the new

MultiPatch Geo-Database is possible from Nverse Photo.

Table 4-3: Obscuration Detected

4.3 GROUND TEXTURES

Ground textures represent a mosaic of Ortho-Rectified images draped on a

ground surface defined by the user to provide a seamless appearance to the model.

With models that are near the edge of aerial photographs, masking out of the fiducial

Honolulu, Hawaii Building Footprint Geo-Database Project: Paper#: 1693 3D Urban Visualization Date: June 30, 2004

© I-Hawaii, Inc. 2004 Page 14 of 23

marks is necessary. Masking prevents large black spots from appearing on the

buildings and on the ground.

Additionally, gaps do occur on the

ground image in regions that are

completely obscured by buildings or not

covered by aerial photographs. This can

be corrected by overlaying multiple

orthographic images to fill in the gaps.

Having completed this, some touch-up

may still be needed using an image editor

like Adobe Photoshop.

Table 4-4: Buildings w/ Ground Textures

5 VISUALIZATION

5.1 ANIMATIONS

Once the ground and building textures have been created, the model is nearly

ready for animations. Cameras and paths for the camera need to be created. Then it is

a simple matter of positioning the camera. USI-Hawaii’s animations provide one

minute of fly-thru images at 30 frames per second.

This requires generating 1,800 still images. Using

3DS Max on a Pentium 4 - 3.2 GHz, with 3.62 GB

RAM, it takes approximately 10 to 15 seconds to

generate each 640 x 480 frame from a 1,200-building

model. The larger the model the more time it takes to

render each scene. However, by working on smaller

scenes and transitioning animations together, the

animations can be made to appear seamless.

Table 5-1: Camera Path

USVisualization – Animations

.

Honolulu, Hawaii Building Footprint Geo-Database Project: Paper#: 1693 3D Urban Visualization Date: June 30, 2004

© I-Hawaii, Inc. 2004 Page 15 of 23

5.2 REPRESENTATION OF BUILDING MODELS IN ARCSCENE

5.2.1 PURPOSE OF CREATING ARCSCENE PROJECTS

The Building Footprint Geo-Database Design Project has an end goal of

providing the building models in ArcScene projects with defined extents to limit the

size of the dataset and enhance performance on the user end. The process for clipping

and compiling data for the ArcScene

projects needed to be repeatable and

easily changed to provide multiple

ArcScene projects for various areas in

the Honolulu region. The final product

as illustrated in, Figure 5-1, includes a

16 foot DEM, TIN, building models for

the study area, 3D cube development,

and a clipped Ortho-Photo. The

processing of the data is performed in

ArcGIS9 Model Builder.

Figure 5-1: ArcScene Project

5.2.2 CREATING THE ARCSCENE PROJECTS USING ARCGIS9 MODEL BUILDER

The process of producing multiple ArcScene projects from multiple large datasets is

accomplished using the Model Builder. The Model Builder application has allowed

USI-Hawaii to create a process model that is executable and repeatable. The inputs

into the model include a 16 foot grid cell DEM for Honolulu, LIDAR data for the

coastline, building models for the Honolulu region, and a large Ortho-Photo for the

Honolulu region. The large datasets are processed using Model Builder to clip the

large datasets to the extent of the defined study area. The study areas for the Building

Footprint Geo-Database Project are defined by the neighborhood board boundaries.

USVisualization – Representation of Building Models in ArcScene

.

Honolulu, Hawaii Building Footprint Geo-Database Project: Paper#: 1693 3D Urban Visualization Date: June 30, 2004

©

The results of the processing are illustrated in Figure 5-2. Where the end product is a

3D area defined by the extent of the request. The process in Model Builder includes

clipping the large DEM and creating a detailed TIN from the DEM to drape the

Ortho-Photo over. The next step is clipping the Ortho-Photo to the same extent. The

final process is clipping the LIDAR data and mosaicing the LIDAR data to the DEM

Grid. The result is a seamless grid representing elevation on land and in the sea. The

final step is selecting the building in the study area and creating a new 1D, 2D, and

3D representation of those objects. The process takes a few minutes to complete and

can be repeated for different extents making the large datasets small enough for the

end user.

USI-Hawaii, Inc. 2004 Page 16 of 23

Figure 5-2: ArcScene Downtown Honolulu 3D Cube

Visualization – Representation of Building Models in ArcScene .

Honolulu, Hawaii Building Footprint Geo-Database Project: Paper#: 1693 3D Urban Visualization Date: June 30, 2004

© I-Hawaii, Inc. 2004 Page 17 of 23 USBuilding FootPrint Geo-Database Applications – Building Footprint Geo-Database Design

.

6 BUILDING FOOTPRINT GEO-DATABASE APPLICATIONS

6.1 BUILDING FOOTPRINT GEO-DATABASE DESIGN

6.1.1 PURPOSE OF THE DESIGN

The Building Footprint Geo-Database Design is intended to allow the user

access to relevant information on the building structures in 3D, 2D and 1D format. The

three representation formats enhance the usability of the data by making it functional in

the 3D environment in ArcScene as well as the 2D and 1D environment in ArcMap. The

attribute fields in the two dimensional feature class listed in Table 6-1 were established

during a series of meetings with the City and County of Honolulu to identify the user

needs of the Building Footprint Geo-Database and ensure all relevant attributes were

included in the data model.

ID Field Name Description Definition Source 1 OBJECTID Object ID Internal Object Identification GIS 2 SHAPE Shape Geometric entities GIS 3 Bldg_Name Building Name The name of a building USI-Hawaii 4 FacCode Facility Code Land use code for facilities Land Use

5 FacCodeDsc Facility Description Land use code description Facility 6 TotFlrArea Total Floor Area Land use floor area total Land Use 7 YearBlt Year Built Year Building Complete Land Use 8 TMK Tax Map Key 9 digit TMK use to link to parcels Parcel

9 Stru_ID Structure ID Auto-generated unique id uses the Neighborhood Board x 10,000 + incremented value GIS

10 CentLat Centroid Latitude Latitude in wgs84 GIS 11 CentLon Centroid Longitude Longitude in wgs84 GIS 12 Perimeter_GIS Shape Length Perimeter of polygon GIS 13 Area_GIS Shape Area Area of polygon GIS 14 Bldg_Hght_GIS Building Height Calculated from the 3D Building model GIS

15 Floors Floor Count Above Ground

This is the number of floors in a building above ground. Land Use

16 SourceInfo Source Information Source Name: Source Type: Acquisition Date: Notes USI-Hawaii

Table 6-1: Two-Dimensional Feature Class Attributes

6.1.2 DESIGN

The Building Footprint Geo-Database is designed to provide the City and

County of Honolulu with optimal performance when querying and editing data.

The geo-database is composed of three feature classes: StructureCentroid(Feature

Honolulu, Hawaii Building Footprint Geo-Database Project: Paper#: 1693 3D Urban Visualization Date: June 30, 2004

© I-Hawaii, Inc. 2004 Page 18 of 23

Point), StructureFootprint(Feature Polygon), and StructureMultiPatch(Feature

MultiPatch) as illustrated in Figure 6-1. The central feature class in the model is

the StructureFootprint representing the two-dimensional footprint of each

structure. The StructureMultiPatch and StructureCentroid feature classes are

related to the StructureFootprint using a relationship class with a one-to-one

cardinality between objects as illustrated in Figure 6-1. The unique identification

number between the objects is a number generated during the pre-processing of

the data. The structure that has been created allows the user to access data stored

in the StructureFootprint using any of the three feature classes. This format allows

the user to access the data in ArcScene using either the two-dimensional

StructureFootprint or the three-dimensional StructureMultiPatch.

Figure 6-1: Visio Geo-Database Model

USBuilding FootPrint Geo-Database Applications – Building Footprint Geo-Database Design

.

Honolulu, Hawaii Building Footprint Geo-Database Project: Paper#: 1693 3D Urban Visualization Date: June 30, 2004

© I-Hawaii, Inc. 2004 Page 19 of 23

6.2 ARCGIS 9 APPLICATIONS

6.2.1 IMPROVED DATA PROCESSING USING MODEL BUILDER

The release of ArcGIS9 has enabled the streamlining of data processing and data

integration. To complete the Building Footprint Geo-Database outputs from

NVersePhoto need extensive editing to prepare the shapefiles for import into the

geo-database repository. This data processing is accomplished using the Model

Builder in ArcGIS9 as illustrated in Figure 6-2. The processing time using the

Model Builder has been greatly reduced and data integrity improved.

The Model Builder processes the two-dimensional shapefile produced in NVerse

Photo by adding necessary attribute fields, performing field calculations, joining

data to the StructureCentroid feature class and the

StructureMultiPatch feature class using a spatial

overlay, deleting unnecessary attribute fields, and

joining data from database tables. Prior to ArcGIS9 the

data preparation was based on a conceptual flow model

diagram. The processing took several days, however

with ArcGIS9 the data preparation takes a few hours.

The final output is imported into the Building Footprint

Geo-Database. The utility of this tool has greatly

improved accuracy of data integration and time

efficiency.

Figure 6-2: ArcGIS 9 Model Builder Diagram

USBuilding FootPrint Geo-Database Applications – ARCGIS 9 Applications

.

Honolulu, Hawaii Building Footprint Geo-Database Project: Paper#: 1693 3D Urban Visualization Date: June 30, 2004

© I-Hawaii, Inc. 2004 Page 20 of 23 USConclusion – ARCGIS 9 Applications

.

7 CONCLUSION

The technologies outlined in this paper demonstrate the growing potential for

three dimensional representation of the world. The ability to accurately represent

building structures in three dimensions with real textured facades demonstrates

advancements in computer software and technology that was not practical or cost

effective. The integration of database formats such as the ESRI Geo-Database with

three dimensional textured building structures provides the user with a dynamic

representation of their area of interest allowing them access to pertinent information

about each structure in the model.

Interactive urban models such as the one outlined in this paper provide urban

planners and developers with tools to make informed decisions. The ability to model re-

development areas represents one of many application of this technology. The models

that are being developed will also further support necessary City services for land use

planning, tax assessment, construction permitting, utility management, homeland

security, and other major programs. The integration of large datasets into models such

as those outlined in this paper will also allow emergency response technicians the

ability make informed decisions in the field where life is at stake.

The ability to represent the world we inhabit in realistic three dimensional

models connected to large databases is at the forefront of this new and emerging

technology. This project demonstrates the ability to capture architectural details from

high resolution images that are then linked to other enterprise level information system

components. Future capabilities will need to provide flexible 3D viewing tools capable

of providing realistic urban simulations. This can possibly be delivered via the

development of thin-client interfaces that run on field computers bringing technology

into the hands of emergency response technicians and infrastructure managers to

increase informed decision making.

Honolulu, Hawaii Building Footprint Geo-Database Project: Paper#: 1693 3D Urban Visualization Date: June 30, 2004

© I-Hawaii, Inc. 2004 Page 21 of 23 USNotes – ARCGIS 9 Applications

.

8 ACKNOWLEDGEMENTS

Special Thanks to USI-Hawaii staff for long hours and eye candy images:

L. Michele Sato – Animator, Graphic Artist, & Systems Analyst

Janna Cole – 3D Modeler

Special Thanks to City & County of Honolulu staff:

Jon Hodge

Mark Lierman

9 NOTES

USI-Hawaii recognized for excellence in Design Services

May 25, 2004 - The American Council of Engineering Company’s – Hawaii held their Annual Symposium where the Department of Design and Construction of the City & County of Honolulu presented their awards for recognition of outstanding consultants. USInfrastructure-Hawaii received a Certificate of Appreciation for Design Service, which acknowledged outstanding service provided to the Department of Planning and Permitting of the City & County of Honolulu. The award of this certificate was based on the quality of USI-Hawaii’s work, exceptional responsiveness, communication, ability to work under changing direction, and submittals of thorough and innovative assessments that have been instrumental in the continued development of the City and County of Honolulu’s Geographic Information System (GIS). Services provided to Honolulu’s GIS include the development of a Geo-database design and feature dataset of 3-Dimensional Building Structures for the Honolulu Primary Urban Corridor, the data conversion of Storm Drainage Facilities, and strategic planning of GIS initiatives.

Contact Information Address:

USI-Hawaii, Inc.

1001 Bishop Street

Pahauii Tower Suite 822

Honolulu, Hawaii 96813

Phone: 808.527.2214

Email: [email protected]

[email protected]

Honolulu, Hawaii Building Footprint Geo-Database Project: Paper#: 1693 3D Urban Visualization Date: June 30, 2004

© I-Hawaii, Inc. 2004 Page 22 of 23 USReferences – ARCGIS 9 Applications

.

10 REFERENCES

Brail, R., R Klosterman 2001. Planning Support Systems - Integrated Geographic Systems, Models, and Visualization Tools. ESRI, Redlands California.

Longley, Paul A., M. Batty 2003. Advanced Spatial Analysis. The CASA Book of GIS. ESRI, Redlands California.

Paine, David P. 1981. Aerial photography and image interpretation for resource management. John Wiley & Sons, Inc., New York.

Tomlinson, Roger F. 2003. Thinking about GIS: geographic information system planning for managers. ESRI , Redlands California.

Zeiler, Michael 1999. Modeling Our World. ESRI, Redlands California.

Honolulu, Hawaii Building Footprint Geo-Database Project: Paper#: 1693 3D Urban Visualization Date: June 30, 2004

© I-Hawaii, Inc. 2004 Page 23 of 23 USAuthors’ Information – ARCGIS 9 Applications

.

11 AUTHORS’ INFORMATION

Harley F. Pennington is a father and husband to his two boys and wife on the island of Oahu, overlooking Diamond Head and Waikiki. He works for USI-Hawaii providing GIS services to the City and County of Honolulu, State of Hawaii, and other agencies. He has been providing GIS services in Hawaii for the last 12 years. He received a Bachelor of Arts degree in Geography, in 1992, from the University of California Santa Barbara. Prior to entering college, he worked as an Avionics and Electrical Inspector for McDonald Douglass, Long Beach California after serving in the Military. While in the Marine Corps for 8 years he earned his Associate of Arts degree from National University and enjoyed working in the air, on land and sea.

Steven E. Hochart is married and lives in Kailua on the island of Oahu. He works for USI-Hawaii providing GIS services to clients. He has been providing GIS services in Hawaii for the past 3 years. He received a Bachelor of Arts degree in Geography in 2001, from the University of California at Santa Barbara. Steven was raised in Pacific Beach, San Diego California where he grew up sailing and competing in races nationally and internationally. Prior to working at USI-Hawaii he worked for The University of Hawaii on the Hawaii Gap Analysis Project. He is currently working on his Masters Degree at the University of Hawaii, Department of Urban and Regional Planning.

Ken Schmidt is the GIS Coordinator for the City & County of Honolulu and has over 20 years of experience in developing and managing GIS and related computer technologies. He is responsible for defining the City-wide GIS programs strategic plans, goals and objectives. He also provides technical oversight for the design, implementation, and operations of a client-server computing system that tracks and manages data relating to City construction and development permits. Additionally, he is the supervisor for the Honolulu Land Information System. His background includes production of wetland maps using an analytical stereoploter, a GIS Analyst for the Suwannee River Flood Protection Program, and the Southwest Florida Water Management District.

Mr. Cadieux is currently a Vice President, for US Infrastructure-Hawaii, Inc. located in Honolulu. He has more than 20 years of experience in all phases of the project and construction management process on major national and international transportation, infrastructure and GIS projects. Alan has extensive experience in business development, startup and management of a business unit/office including planning, financial management, human resource management and corporate reporting, bidding process, fee negotiations, project startup and oversight, quality control and client interaction and job satisfaction. Alan has led the startup of five successful offices both nationally and internationally.


Recommended