MICROBIOLOGICAL METHODS 3M™ Petrifilm™ Enterobacteriaceae Count Plate Method for Enumeration of Enterobacteriaceae in Selected Foods: Collaborative Study 1 KAREN M. SILBERNAGEL rtech laboratories, PO Box 64101, St. Paul, MN 55164-0101 KATHRYN G. LINDBERG 3M Co., 3M Center, Bldg 260-6B-01, St. Paul, MN 55144-1000 Collaborators: S. Beatty; K. Bell; T. Boylston; G. Brock; L. Bryant; M. DeSmet; J. Eifert; K. Grzanek; S. Pulasani; L. Saunders; M. Scantling; P. Wilson The practice of detecting and enumerating all oxidase-negative, glucose-fermenting-Gram-nega- tive rods (i.e., the family Enterobacteriaceae) is used to indicate unsanitary or inadequate food process- ing conditions. The objective of this interlaboratory collaborative study was to evaluate and compare the methods described in Standard Methods for the Examination of Dairy Products (SMEDP) and the Compendium of Methods for the Microbiological Ex- amination of Foods (Compendium) with a commer- cial product, the 3M TM Petrifilm TM Enterobacteriaceae Count Plate, for the recovery of Enterobacteriaceae in foods. Six foods—cheddar cheese, milk, flour, frozen prepared meals, frozen broccoli, and nut pieces—were analyzed for Enterobacteriaceae by 12 collaborating laboratories. For each food tested, the collaborators received 8 blind test portions consist- ing of a control test portion and 3 levels of inocu- lated test portion, each in duplicate. Each test por- tion was tested by the Petrifilm Enterobacteriaceae Count Plate method as well as the SMEDP or Com- pendium methods. The precision estimates (repeat- ability or within-laboratory variation, and reproducibility or between-laboratory variation) were calculated with standard statistical techniques. D etermination of coliforms has traditionally been used in the food industry as an indicator of unsanitary con- ditions or inadequate processing. This method identi- fies coliforms by their ability to ferment lactose with the pro- duction of gas and acid; however, it does not determine the presence of all members of the Enterobacteriaceae group. The practice of detecting and enumerating all fermentative Gram-negative organisms (i.e., the family Enterobacteriaceae) has become more common in the food industry, especially in European countries. It is thought that enumeration of a wider, better-defined group of organisms, such as Enterobacteriaceae, rather than a more specific group like the coliforms, will provide a more thorough assessment of the food (1). Enterobacteriaceae are enumerated by counting Gram-negative rods which ferment glucose. Organisms are enumerated regardless of their ability to produce gas. Tradi- tional methods for enumerating Enterobacteriaceae use violet red bile agar with glucose (VRBG; 2). The 3M TM Petrifilm TM Enterobacteriaceae (EB) Count Plate is designed for the enumeration of Enterobacteriaceae in foods. The product consists of a medium optimized for the growth of Enterobacteriaceae, yet inhibitory to the growth of Gram-positive bacteria. A pH indicator, a dye to enhance the visualization of growth, and a cold-water-soluble gelling agent are included in the plate. Diluted test portions are added at a volume of 1.0 mL per plate. Pressure applied to a plastic spreader placed on the overlay film spreads the test portion over a growth area of approximately 20 cm 2 . The gelling agent is allowed to solidify and the plates are then incubated. A comparative study (3) demonstrated that the Petrifilm EB plate provided results similar to those of the reference method for enumeration of Enterobacteriaceae. This report describes a collaborative study comparing the Petrifilm EB Count Plate method with the reference methods described in Standard Methods for the Examination of Dairy Products (SMEDP; 4) and the Compendium of Methods for the Micro- biological Examination of Foods (Compendium; 2). In addi- tion, ISO standard 7402 (5) was consulted for guidance on the enumeration of Enterobacteriaceae. 802 SILBERNAGEL &LINDBERG:JOURNAL OF AOAC INTERNATIONAL VOL. 86, NO. 4, 2003 Submitted for publication March 2002. The recommendation was approved by the Methods Committee on Microbiology and Extraneous Materials as First Action. See “Official Methods Program Actions,” (2003) Inside Laboratory Management, May/June issue. Corresponding author’s e-mail: [email protected]. 1 Poster presentation at the 1997 AOAC Annual Meeting. 3M Literature code: 70-2009-4678-1.
Transcript
MICROBIOLOGICAL METHODS
3M™ Petrifilm™ Enterobacteriaceae Count Plate Method forEnumeration of Enterobacteriaceae in Selected Foods:Collaborative Study1
KAREN M. SILBERNAGEL
rtech laboratories, PO Box 64101, St. Paul, MN 55164-0101KATHRYN G. LINDBERG
3M Co., 3M Center, Bldg 260-6B-01, St. Paul, MN 55144-1000
Collaborators: S. Beatty; K. Bell; T. Boylston; G. Brock; L. Bryant; M. DeSmet; J. Eifert; K. Grzanek; S. Pulasani;L. Saunders; M. Scantling; P. Wilson
The practice of detecting and enumerating alloxidase-negative, glucose-fermenting-Gram-nega-tive rods (i.e., the family Enterobacteriaceae) is usedto indicate unsanitary or inadequate food process-ing conditions. The objective of this interlaboratorycollaborative study was to evaluate and comparethe methods described in Standard Methods for theExamination of Dairy Products (SMEDP) and theCompendium of Methods for the Microbiological Ex-amination of Foods (Compendium) with a commer-cial product, the 3MTM PetrifilmTM EnterobacteriaceaeCount Plate, for the recovery of Enterobacteriaceaein foods. Six foods—cheddar cheese, milk, flour,frozen prepared meals, frozen broccoli, and nutpieces—were analyzed for Enterobacteriaceae by 12collaborating laboratories. For each food tested, thecollaborators received 8 blind test portions consist-ing of a control test portion and 3 levels of inocu-lated test portion, each in duplicate. Each test por-tion was tested by the Petrifilm EnterobacteriaceaeCount Plate method as well as the SMEDP or Com-pendium methods. The precision estimates (repeat-ability or within-laboratory variation, andreproducibility or between-laboratory variation)were calculated with standard statistical techniques.
Determination of coliforms has traditionally been usedin the food industry as an indicator of unsanitary con-ditions or inadequate processing. This method identi-
fies coliforms by their ability to ferment lactose with the pro-duction of gas and acid; however, it does not determine thepresence of all members of the Enterobacteriaceae group.The practice of detecting and enumerating all fermentativeGram-negative organisms (i.e., the family Enterobacteriaceae)has become more common in the food industry, especially inEuropean countries. It is thought that enumeration of a wider,better-defined group of organisms, such asEnterobacteriaceae, rather than a more specific group like thecoliforms, will provide a more thorough assessment of thefood (1). Enterobacteriaceae are enumerated by countingGram-negative rods which ferment glucose. Organisms areenumerated regardless of their ability to produce gas. Tradi-tional methods for enumerating Enterobacteriaceae use violetred bile agar with glucose (VRBG; 2).
The 3MTM PetrifilmTM Enterobacteriaceae (EB) CountPlate is designed for the enumeration of Enterobacteriaceaein foods. The product consists of a medium optimized for thegrowth of Enterobacteriaceae, yet inhibitory to the growth ofGram-positive bacteria. A pH indicator, a dye to enhance thevisualization of growth, and a cold-water-soluble gellingagent are included in the plate. Diluted test portions are addedat a volume of 1.0 mL per plate. Pressure applied to a plasticspreader placed on the overlay film spreads the test portionover a growth area of approximately 20 cm2. The gelling agentis allowed to solidify and the plates are then incubated.
A comparative study (3) demonstrated that the Petrifilm
EB plate provided results similar to those of the reference
method for enumeration of Enterobacteriaceae. This report
describes a collaborative study comparing the Petrifilm EB
Count Plate method with the reference methods described in
Standard Methods for the Examination of Dairy Products
(SMEDP; 4) and the Compendium of Methods for the Micro-
biological Examination of Foods (Compendium; 2). In addi-
tion, ISO standard 7402 (5) was consulted for guidance on the
enumeration of Enterobacteriaceae.
802 SILBERNAGEL & LINDBERG: JOURNAL OF AOAC INTERNATIONAL VOL. 86, NO. 4, 2003
Submitted for publication March 2002.The recommendation was approved by the Methods Committee on
Microbiology and Extraneous Materials as First Action. See “OfficialMethods Program Actions,” (2003) Inside Laboratory Management,May/June issue.
Corresponding author’s e-mail: [email protected] Poster presentation at the 1997 AOAC Annual Meeting.3M Literature code: 70-2009-4678-1.
Collaborative Study
Test Foods
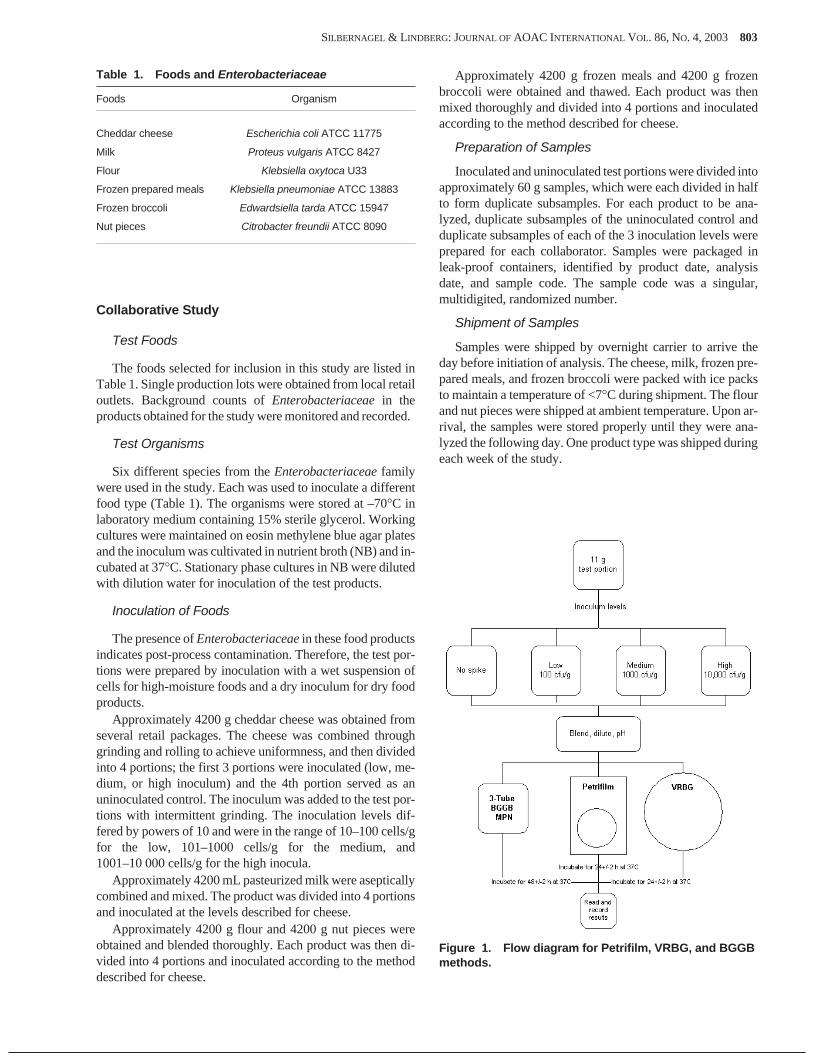
The foods selected for inclusion in this study are listed inTable 1. Single production lots were obtained from local retailoutlets. Background counts of Enterobacteriaceae in theproducts obtained for the study were monitored and recorded.
Test Organisms
Six different species from the Enterobacteriaceae familywere used in the study. Each was used to inoculate a differentfood type (Table 1). The organisms were stored at –70�C inlaboratory medium containing 15% sterile glycerol. Workingcultures were maintained on eosin methylene blue agar platesand the inoculum was cultivated in nutrient broth (NB) and in-cubated at 37�C. Stationary phase cultures in NB were dilutedwith dilution water for inoculation of the test products.
Inoculation of Foods
The presence of Enterobacteriaceae in these food productsindicates post-process contamination. Therefore, the test por-tions were prepared by inoculation with a wet suspension ofcells for high-moisture foods and a dry inoculum for dry foodproducts.
Approximately 4200 g cheddar cheese was obtained fromseveral retail packages. The cheese was combined throughgrinding and rolling to achieve uniformness, and then dividedinto 4 portions; the first 3 portions were inoculated (low, me-dium, or high inoculum) and the 4th portion served as anuninoculated control. The inoculum was added to the test por-tions with intermittent grinding. The inoculation levels dif-fered by powers of 10 and were in the range of 10–100 cells/gfor the low, 101–1000 cells/g for the medium, and1001–10 000 cells/g for the high inocula.
Approximately 4200 mL pasteurized milk were asepticallycombined and mixed. The product was divided into 4 portionsand inoculated at the levels described for cheese.
Approximately 4200 g flour and 4200 g nut pieces wereobtained and blended thoroughly. Each product was then di-vided into 4 portions and inoculated according to the methoddescribed for cheese.
Approximately 4200 g frozen meals and 4200 g frozenbroccoli were obtained and thawed. Each product was thenmixed thoroughly and divided into 4 portions and inoculatedaccording to the method described for cheese.
Preparation of Samples
Inoculated and uninoculated test portions were divided intoapproximately 60 g samples, which were each divided in halfto form duplicate subsamples. For each product to be ana-lyzed, duplicate subsamples of the uninoculated control andduplicate subsamples of each of the 3 inoculation levels wereprepared for each collaborator. Samples were packaged inleak-proof containers, identified by product date, analysisdate, and sample code. The sample code was a singular,multidigited, randomized number.
Shipment of Samples
Samples were shipped by overnight carrier to arrive theday before initiation of analysis. The cheese, milk, frozen pre-pared meals, and frozen broccoli were packed with ice packsto maintain a temperature of <7�C during shipment. The flourand nut pieces were shipped at ambient temperature. Upon ar-rival, the samples were stored properly until they were ana-lyzed the following day. One product type was shipped duringeach week of the study.
SILBERNAGEL & LINDBERG: JOURNAL OF AOAC INTERNATIONAL VOL. 86, NO. 4, 2003 803
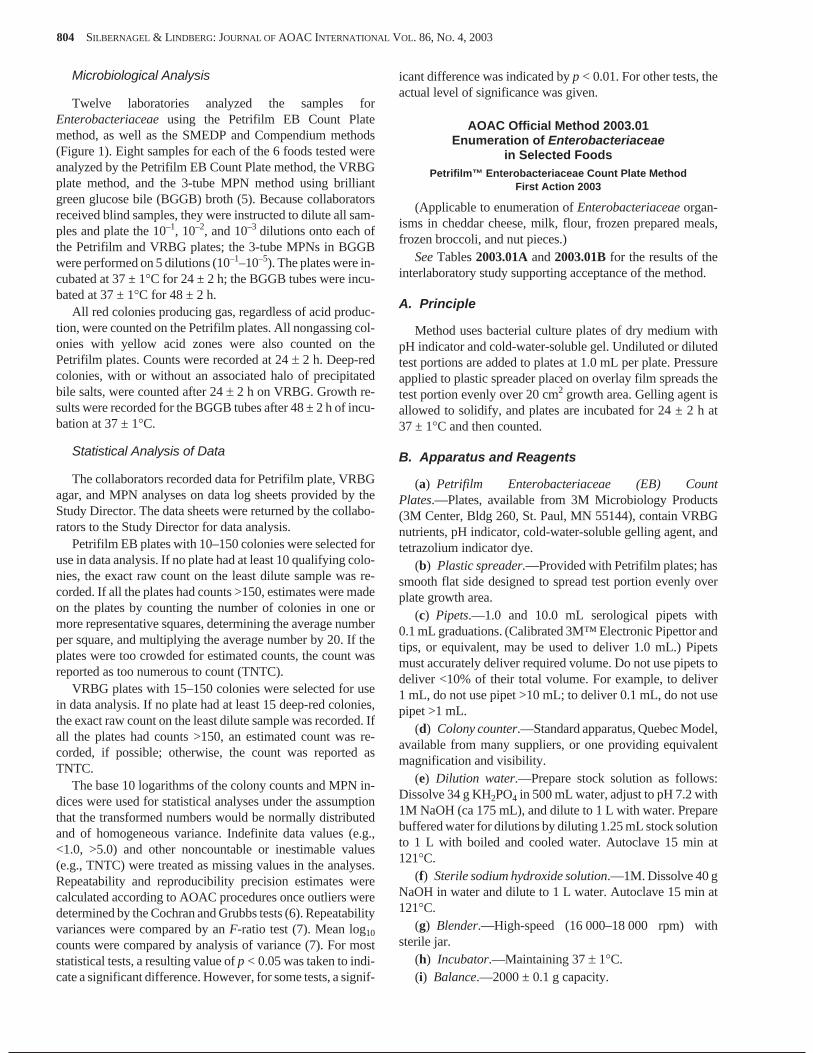
Figure 1. Flow diagram for Petrifilm, VRBG, and BGGBmethods.
Microbiological Analysis
Twelve laboratories analyzed the samples forEnterobacteriaceae using the Petrifilm EB Count Platemethod, as well as the SMEDP and Compendium methods(Figure 1). Eight samples for each of the 6 foods tested wereanalyzed by the Petrifilm EB Count Plate method, the VRBGplate method, and the 3-tube MPN method using brilliantgreen glucose bile (BGGB) broth (5). Because collaboratorsreceived blind samples, they were instructed to dilute all sam-ples and plate the 10–1, 10–2, and 10–3 dilutions onto each ofthe Petrifilm and VRBG plates; the 3-tube MPNs in BGGBwere performed on 5 dilutions (10–1–10–5). The plates were in-cubated at 37 ± 1�C for 24 ± 2 h; the BGGB tubes were incu-bated at 37 ± 1�C for 48 ± 2 h.
All red colonies producing gas, regardless of acid produc-tion, were counted on the Petrifilm plates. All nongassing col-onies with yellow acid zones were also counted on thePetrifilm plates. Counts were recorded at 24 � 2 h. Deep-redcolonies, with or without an associated halo of precipitatedbile salts, were counted after 24 � 2 h on VRBG. Growth re-sults were recorded for the BGGB tubes after 48 ± 2 h of incu-bation at 37 ± 1�C.
Statistical Analysis of Data
The collaborators recorded data for Petrifilm plate, VRBGagar, and MPN analyses on data log sheets provided by theStudy Director. The data sheets were returned by the collabo-rators to the Study Director for data analysis.
Petrifilm EB plates with 10–150 colonies were selected foruse in data analysis. If no plate had at least 10 qualifying colo-nies, the exact raw count on the least dilute sample was re-corded. If all the plates had counts >150, estimates were madeon the plates by counting the number of colonies in one ormore representative squares, determining the average numberper square, and multiplying the average number by 20. If theplates were too crowded for estimated counts, the count wasreported as too numerous to count (TNTC).
VRBG plates with 15–150 colonies were selected for usein data analysis. If no plate had at least 15 deep-red colonies,the exact raw count on the least dilute sample was recorded. Ifall the plates had counts >150, an estimated count was re-corded, if possible; otherwise, the count was reported asTNTC.
The base 10 logarithms of the colony counts and MPN in-dices were used for statistical analyses under the assumptionthat the transformed numbers would be normally distributedand of homogeneous variance. Indefinite data values (e.g.,<1.0, >5.0) and other noncountable or inestimable values(e.g., TNTC) were treated as missing values in the analyses.Repeatability and reproducibility precision estimates werecalculated according to AOAC procedures once outliers weredetermined by the Cochran and Grubbs tests (6). Repeatabilityvariances were compared by an F-ratio test (7). Mean log10
counts were compared by analysis of variance (7). For moststatistical tests, a resulting value of p < 0.05 was taken to indi-cate a significant difference. However, for some tests, a signif-
icant difference was indicated by p < 0.01. For other tests, theactual level of significance was given.
AOAC Official Method 2003.01Enumeration of Enterobacteriaceae
in Selected FoodsPetrifilm™ Enterobacteriaceae Count Plate Method
First Action 2003
(Applicable to enumeration of Enterobacteriaceae organ-isms in cheddar cheese, milk, flour, frozen prepared meals,frozen broccoli, and nut pieces.)
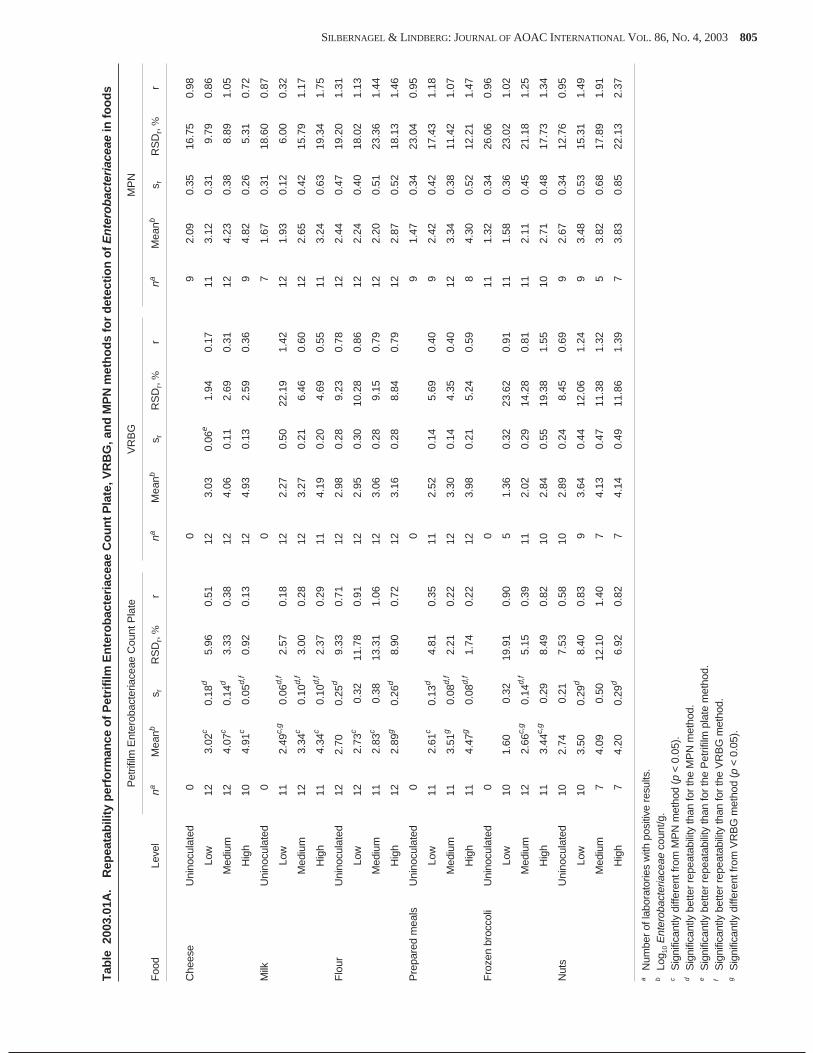
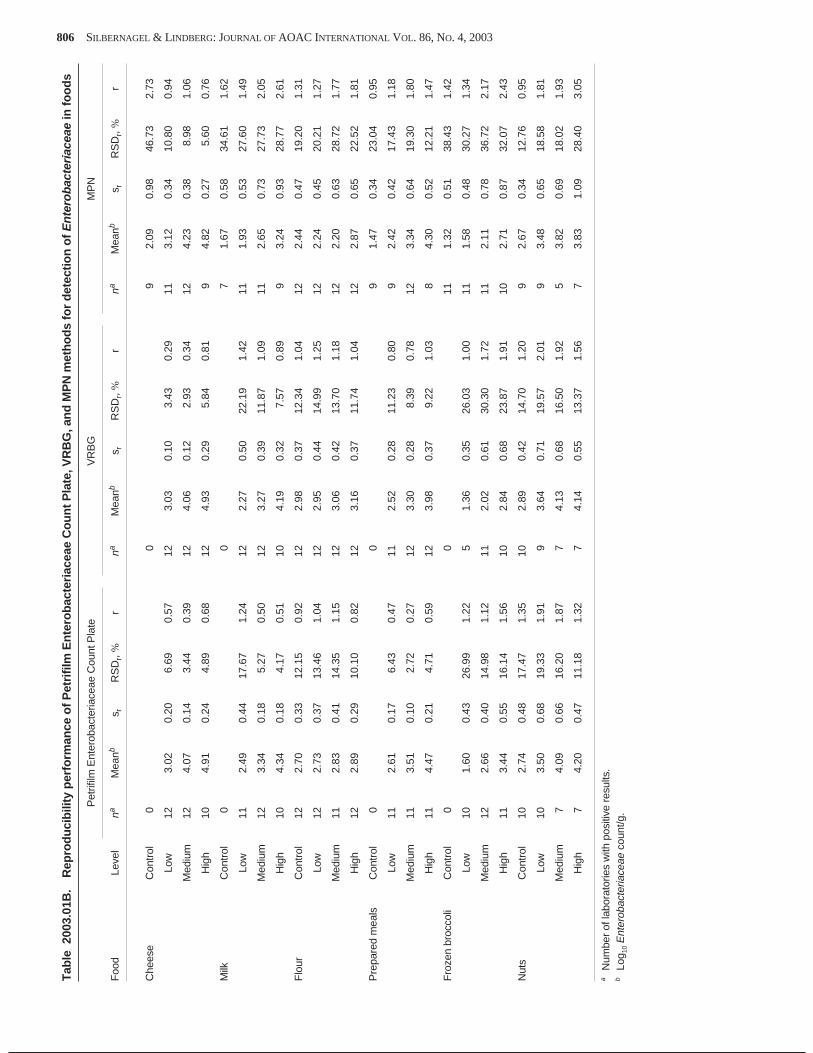
See Tables 2003.01A and 2003.01B for the results of theinterlaboratory study supporting acceptance of the method.
A. Principle
Method uses bacterial culture plates of dry medium withpH indicator and cold-water-soluble gel. Undiluted or dilutedtest portions are added to plates at 1.0 mL per plate. Pressureapplied to plastic spreader placed on overlay film spreads thetest portion evenly over 20 cm2 growth area. Gelling agent isallowed to solidify, and plates are incubated for 24 ± 2 h at37 ± 1�C and then counted.
B. Apparatus and Reagents
(a) Petrifilm Enterobacteriaceae (EB) CountPlates.—Plates, available from 3M Microbiology Products(3M Center, Bldg 260, St. Paul, MN 55144), contain VRBGnutrients, pH indicator, cold-water-soluble gelling agent, andtetrazolium indicator dye.
(b) Plastic spreader.—Provided with Petrifilm plates; hassmooth flat side designed to spread test portion evenly overplate growth area.
(c) Pipets.—1.0 and 10.0 mL serological pipets with0.1 mL graduations. (Calibrated 3M™ Electronic Pipettor andtips, or equivalent, may be used to deliver 1.0 mL.) Pipetsmust accurately deliver required volume. Do not use pipets todeliver <10% of their total volume. For example, to deliver1 mL, do not use pipet >10 mL; to deliver 0.1 mL, do not usepipet >1 mL.
(d) Colony counter.—Standard apparatus, Quebec Model,available from many suppliers, or one providing equivalentmagnification and visibility.
(e) Dilution water.—Prepare stock solution as follows:Dissolve 34 g KH2PO4 in 500 mL water, adjust to pH 7.2 with1M NaOH (ca 175 mL), and dilute to 1 L with water. Preparebuffered water for dilutions by diluting 1.25 mL stock solutionto 1 L with boiled and cooled water. Autoclave 15 min at121�C.
(f) Sterile sodium hydroxide solution.—1M. Dissolve 40 gNaOH in water and dilute to 1 L water. Autoclave 15 min at121�C.
(h) Incubator.—Maintaining 37 � 1�C.(i) Balance.—2000 ± 0.1 g capacity.
804 SILBERNAGEL & LINDBERG: JOURNAL OF AOAC INTERNATIONAL VOL. 86, NO. 4, 2003
SILBERNAGEL & LINDBERG: JOURNAL OF AOAC INTERNATIONAL VOL. 86, NO. 4, 2003 805
Tab
le20
03.0
1A.
Rep
eata
bili
typ
erfo
rman
ceo
fPet
rifil
mE
nte
rob
acte
riac
eae
Co
un
tPla
te,V
RB
G,a
nd
MP
Nm
eth
od
sfo
rd
etec
tion
of
En
tero
bac
teri
acea
ein
foo
ds
Foo
dLe
vel
Pet
rifilm
Ent
erob
acte
riace
aeC
ount
Pla
teV
RB
GM
PN
naM
eanb
s rR
SD
r,%
rna
Mea
nbs r
RS
Dr,
%r
naM
eanb
s rR
SD
r,%
r
Che
ese
Uni
nocu
late
d0
09
2.09
0.35
16.7
50.
98
Low
123.
02c
0.18
d5.
960.
5112
3.03
0.06
e1.
940.
1711
3.12
0.31
9.79
0.86
Med
ium
124.
07c
0.14
d3.
330.
3812
4.06
0.11
2.69
0.31
124.
230.
388.
891.
05
Hig
h10
4.91
c0.
05d,
f0.
920.
1312
4.93
0.13
2.59
0.36
94.
820.
265.
310.
72
Milk
Uni
nocu
late
d0
07
1.67
0.31
18.6
00.
87
Low
112.
49c,
g0.
06d,
f2.
570.
1812
2.27
0.50
22.1
91.
4212
1.93
0.12
6.00
0.32
Med
ium
123.
34c
0.10
d,f
3.00
0.28
123.
270.
216.
460.
6012
2.65
0.42
15.7
91.
17
Hig
h11
4.34
c0.
10d,
f2.
370.
2911
4.19
0.20
4.69
0.55
113.
240.
6319
.34
1.75
Flo
urU
nino
cula
ted
122.
700.
25d
9.33
0.71
122.
980.
289.
230.
7812
2.44
0.47
19.2
01.
31
Low
122.
73c
0.32
11.7
80.
9112
2.95
0.30
10.2
80.
8612
2.24
0.40
18.0
21.
13
Med
ium
112.
83c
0.38
13.3
11.
0612
3.06
0.28
9.15
0.79
122.
200.
5123
.36
1.44
Hig
h12
2.89
g0.
26d
8.90
0.72
123.
160.
288.
840.
7912
2.87
0.52
18.1
31.
46
Pre
pare
dm
eals
Uni
nocu
late
d0
09
1.47
0.34
23.0
40.
95
Low
112.
61c
0.13
d4.
810.
3511
2.52
0.14
5.69
0.40
92.
420.
4217
.43
1.18
Med
ium
113.
51g
0.08
d,f
2.21
0.22
123.
300.
144.
350.
4012
3.34
0.38
11.4
21.
07
Hig
h11
4.47
g0.
08d,
f1.
740.
2212
3.98
0.21
5.24
0.59
84.
300.
5212
.21
1.47
Fro
zen
broc
coli
Uni
nocu
late
d0
011
1.32
0.34
26.0
60.
96
Low
101.
600.
3219
.91
0.90
51.
360.
3223
.62
0.91
111.
580.
3623
.02
1.02
Med
ium
122.
66c,
g0.
14d,
f5.
150.
3911
2.02
0.29
14.2
80.
8111
2.11
0.45
21.1
81.
25
Hig
h11
3.44
c,g
0.29
8.49
0.82
102.
840.
5519
.38
1.55
102.
710.
4817
.73
1.34
Nut
sU
nino
cula
ted
102.
740.
217.
530.
5810
2.89
0.24
8.45
0.69
92.
670.
3412
.76
0.95
Low
103.
500.
29d
8.40
0.83
93.
640.
4412
.06
1.24
93.
480.
5315
.31
1.49
Med
ium
74.
090.
5012
.10
1.40
74.
130.
4711
.38
1.32
53.
820.
6817
.89
1.91
Hig
h7
4.20
0.29
d6.
920.
827
4.14
0.49
11.8
61.
397
3.83
0.85
22.1
32.
37
aN
umbe
rof
labo
rato
ries
with
posi
tive
resu
lts.
bLo
g 10
Ent
erob
acte
riace
aeco
unt/g
.c
Sig
nific
antly
diffe
rent
from
MP
Nm
etho
d(p
<0.
05).
dS
igni
fican
tlybe
tter
repe
atab
ility
than
for
the
MP
Nm
etho
d.e
Sig
nific
antly
bette
rre
peat
abili
tyth
anfo
rth
eP
etrif
ilmpl
ate
met
hod.
fS
igni
fican
tlybe
tter
repe
atab
ility
than
for
the
VR
BG
met
hod.
gS
igni
fican
tlydi
ffere
ntfr
omV
RB
Gm
etho
d(p
<0.
05).
806 SILBERNAGEL & LINDBERG: JOURNAL OF AOAC INTERNATIONAL VOL. 86, NO. 4, 2003
Tab
le20
03.0
1B.
Rep
rod
uci
bili
typ
erfo
rman
ceo
fPet
rifil
mE
nte
rob
acte
riac
eae
Co
un
tPla
te,V
RB
G,a
nd
MP
Nm
eth
od
sfo
rd
etec
tion
of
En
tero
bac
teri
acea
ein
foo
ds
Foo
dLe
vel
Pet
rifilm
Ent
erob
acte
riace
aeC
ount
Pla
teV
RB
GM
PN
naM
eanb
s rR
SD
r,%
rna
Mea
nbs r
RS
Dr,
%r
naM
eanb
s rR
SD
r,%
r
Che
ese
Con
trol
00
92.
090.
9846
.73
2.73
Low
123.
020.
206.
690.
5712
3.03
0.10
3.43
0.29
113.
120.
3410
.80
0.94
Med
ium
124.
070.
143.
440.
3912
4.06
0.12
2.93
0.34
124.
230.
388.
981.
06
Hig
h10
4.91
0.24
4.89
0.68
124.
930.
295.
840.
819
4.82
0.27
5.60
0.76
Milk
Con
trol
00
71.
670.
5834
.61
1.62
Low
112.
490.
4417
.67
1.24
122.
270.
5022
.19
1.42
111.
930.
5327
.60
1.49
Med
ium
123.
340.
185.
270.
5012
3.27
0.39
11.8
71.
0911
2.65
0.73
27.7
32.
05
Hig
h10
4.34
0.18
4.17
0.51
104.
190.
327.
570.
899
3.24
0.93
28.7
72.
61
Flo
urC
ontr
ol12
2.70
0.33
12.1
50.
9212
2.98
0.37
12.3
41.
0412
2.44
0.47
19.2
01.
31
Low
122.
730.
3713
.46
1.04
122.
950.
4414
.99
1.25
122.
240.
4520
.21
1.27
Med
ium
112.
830.
4114
.35
1.15
123.
060.
4213
.70
1.18
122.
200.
6328
.72
1.77
Hig
h12
2.89
0.29
10.1
00.
8212
3.16
0.37
11.7
41.
0412
2.87
0.65
22.5
21.
81
Pre
pare
dm
eals
Con
trol
00
91.
470.
3423
.04
0.95
Low
112.
610.
176.
430.
4711
2.52
0.28
11.2
30.
809
2.42
0.42
17.4
31.
18
Med
ium
113.
510.
102.
720.
2712
3.30
0.28
8.39
0.78
123.
340.
6419
.30
1.80
Hig
h11
4.47
0.21
4.71
0.59
123.
980.
379.
221.
038
4.30
0.52
12.2
11.
47
Fro
zen
broc
coli
Con
trol
00
111.
320.
5138
.43
1.42
Low
101.
600.
4326
.99
1.22
51.
360.
3526
.03
1.00
111.
580.
4830
.27
1.34
Med
ium
122.
660.
4014
.98
1.12
112.
020.
6130
.30
1.72
112.
110.
7836
.72
2.17
Hig
h11
3.44
0.55
16.1
41.
5610
2.84
0.68
23.8
71.
9110
2.71
0.87
32.0
72.
43
Nut
sC
ontr
ol10
2.74
0.48
17.4
71.
3510
2.89
0.42
14.7
01.
209
2.67
0.34
12.7
60.
95
Low
103.
500.
6819
.33
1.91
93.
640.
7119
.57
2.01
93.
480.
6518
.58
1.81
Med
ium
74.
090.
6616
.20
1.87
74.
130.
6816
.50
1.92
53.
820.
6918
.02
1.93
Hig
h7
4.20
0.47
11.1
81.
327
4.14
0.55
13.3
71.
567
3.83
1.09
28.4
03.
05
aN
umbe
rof
labo
rato
ries
with
posi
tive
resu
lts.
bLo
g 10
Ent
erob
acte
riace
aeco
unt/g
.
C. Sample Preparation
Aseptically weigh 11.0 g unthawed test portion intoblender jar, B(g). Add 99 mL dilution water, B(e), and blend at16 000–18 000 rpm for 2 min to homogenize. If entire testsample is <50 g, weigh portion of test sample and add dilutionwater to make 1:10 dilution. Adjust pH of diluted test portionto 6.5–7.5 with 1M NaOH, B(f), ca 0.1 mL/g test portion. Donot use diluents containing citrate, bisulfite, or thiosulfate asthey can inhibit growth. Prepare all decimal dilutions with90 mL dilution water plus 10 mL from previous dilution. Mixall dilutions by shaking 25 times through 30 cm arc in 7 s.
D. Analysis
Place dry Petrifilm EB plate, B(a), on flat surface. Lift topfilm and inoculate 1 mL test suspension onto center of filmbase. Carefully roll top film down onto inoculum. Distributetest portion over 20 cm2 growth area with downward pressureon center of plastic spreader device, B(b), flat side down.Leave plate undisturbed for minimum of 1 min to permit gel tosolidify. Incubate plates for 24 ± 2 h at 37 ± 1�C. In incubator,place plates in horizontal position, clear side up, in stacks notexceeding 20 plates. Count plates promptly (within 2 h) afterincubation period.
Count Petrifilm EB plates on standard colony counter,B(d), or other illuminated magnifier. Count all red coloniesproducing gas regardless of acid production. Also count allnongassing colonies with yellow acid zones. Select plateswith 10–150 colonies. If no plate has at least 10 qualifying col-onies, record the exact raw count on the least dilute test sus-
pension. If all the plates have counts >150, make estimates onplates by counting the number of colonies in one or more repre-sentative squares, determining the average number per square,and multiplying the average number by 20. If plates are toocrowded for estimated counts, report the count as too numerousto count (TNTC). Do not count colonies on the foam dam be-cause they are removed from the selective influence of the me-dium. Do not count artifact bubbles that may be present.
Ref.: J. AOAC Int. 86, 804–807(2003)
Results
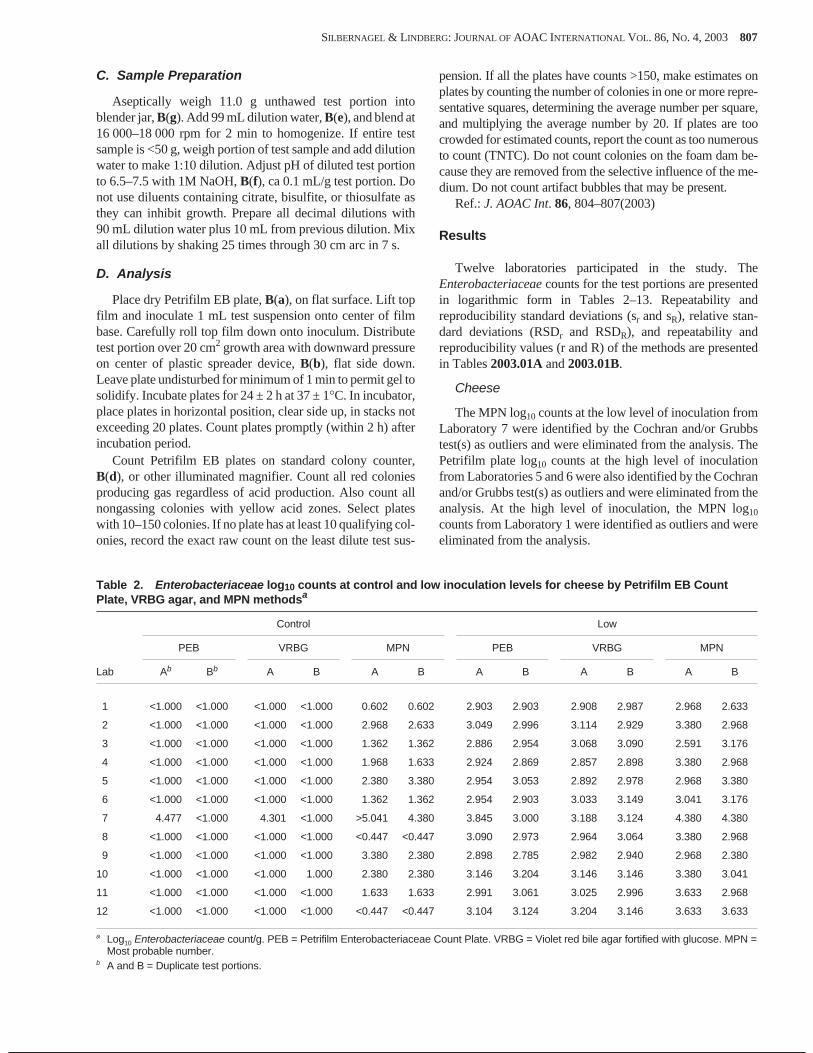
Twelve laboratories participated in the study. TheEnterobacteriaceae counts for the test portions are presentedin logarithmic form in Tables 2–13. Repeatability andreproducibility standard deviations (sr and sR), relative stan-dard deviations (RSDr and RSDR), and repeatability andreproducibility values (r and R) of the methods are presentedin Tables 2003.01A and 2003.01B.
Cheese
The MPN log10 counts at the low level of inoculation fromLaboratory 7 were identified by the Cochran and/or Grubbstest(s) as outliers and were eliminated from the analysis. ThePetrifilm plate log10 counts at the high level of inoculationfrom Laboratories 5 and 6 were also identified by the Cochranand/or Grubbs test(s) as outliers and were eliminated from theanalysis. At the high level of inoculation, the MPN log10
counts from Laboratory 1 were identified as outliers and wereeliminated from the analysis.
SILBERNAGEL & LINDBERG: JOURNAL OF AOAC INTERNATIONAL VOL. 86, NO. 4, 2003 807
Table 2. Enterobacteriaceae log10 counts at control and low inoculation levels for cheese by Petrifilm EB CountPlate, VRBG agar, and MPN methodsa
a Log10 Enterobacteriaceae count/g. PEB = Petrifilm Enterobacteriaceae Count Plate. VRBG = Violet red bile agar fortified with glucose. MPN =Most probable number.
b A and B = Duplicate test portions.
808 SILBERNAGEL & LINDBERG: JOURNAL OF AOAC INTERNATIONAL VOL. 86, NO. 4, 2003
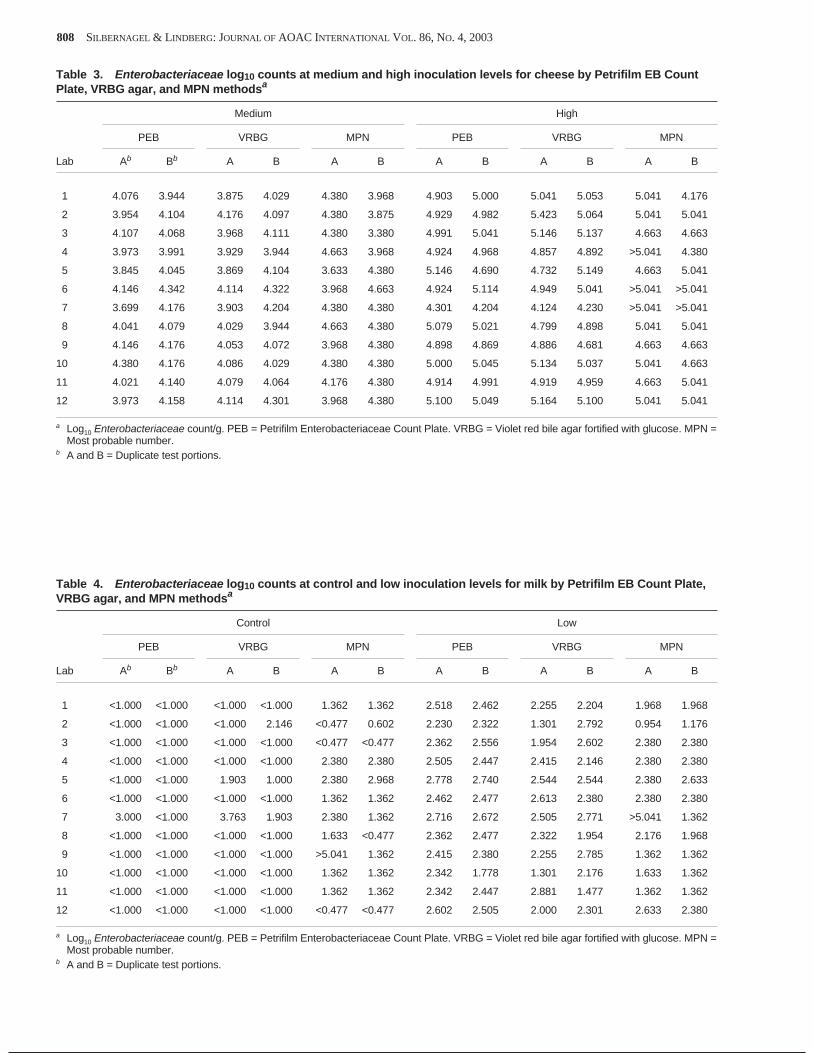
Table 3. Enterobacteriaceae log10 counts at medium and high inoculation levels for cheese by Petrifilm EB CountPlate, VRBG agar, and MPN methodsa
a Log10 Enterobacteriaceae count/g. PEB = Petrifilm Enterobacteriaceae Count Plate. VRBG = Violet red bile agar fortified with glucose. MPN =Most probable number.
b A and B = Duplicate test portions.
Table 4. Enterobacteriaceae log10 counts at control and low inoculation levels for milk by Petrifilm EB Count Plate,VRBG agar, and MPN methodsa
a Log10 Enterobacteriaceae count/g. PEB = Petrifilm Enterobacteriaceae Count Plate. VRBG = Violet red bile agar fortified with glucose. MPN =Most probable number.
b A and B = Duplicate test portions.
SILBERNAGEL & LINDBERG: JOURNAL OF AOAC INTERNATIONAL VOL. 86, NO. 4, 2003 809
Table 5. Enterobacteriaceae log10 counts at medium and high inoculation levels for milk by Petrifilm EB Count Plate,VRBG agar, and MPN methodsa
a Log10 Enterobacteriaceae count/g. PEB = Petrifilm Enterobacteriaceae Count Plate. VRBG = Violet red bile agar fortified with glucose. MPN =Most probable number. TNTC = Too numerous to count.
b A and B = Duplicate test portions.
Table 6. Enterobacteriaceae log10 counts at control and low inoculation levels for flour by Petrifilm EB Count Plate,VRBG agar, and MPN methodsa
a Log10 Enterobacteriaceae count/g. PEB = Petrifilm Enterobacteriaceae Count Plate. VRBG = Violet red bile agar fortified with glucose. MPN =Most probable number.
b A and B = Duplicate test portions.
810 SILBERNAGEL & LINDBERG: JOURNAL OF AOAC INTERNATIONAL VOL. 86, NO. 4, 2003
Table 7. Enterobacteriaceae log10 counts at medium and high inoculation levels for flour by Petrifilm EB CountPlate, VRBG agar, and MPN methodsa
a Log10 Enterobacteriaceae count/g. PEB = Petrifilm Enterobacteriaceae Count Plate. VRBG = Violet red bile agar fortified with glucose. MPN =Most probable number. LA = Laboratory accident.
b A and B = Duplicate test portions.
Table 8. Enterobacteriaceae log10 counts at control and low inoculation levels for frozen meals by Petrifilm EBCount Plate, VRBG agar, and MPN methodsa
a Log10 Enterobacteriaceae count/g. PEB = Petrifilm Enterobacteriaceae Count Plate. VRBG = Violet red bile agar fortified with glucose. MPN =Most probable number. LA = Laboratory accident.
b A and B = Duplicate test portions.
SILBERNAGEL & LINDBERG: JOURNAL OF AOAC INTERNATIONAL VOL. 86, NO. 4, 2003 811
Table 9. Enterobacteriaceae log10 counts at medium and high inoculation levels for frozen meals by Petrifilm EBCount Plate, VRBG agar, and MPN methodsa
a Log10 Enterobacteriaceae count/g. PEB = Petrifilm Enterobacteriaceae Count Plate. VRBG = Violet red bile agar fortified with glucose. MPN =Most probable number.
b A and B = Duplicate test portions.
Table 10. Enterobacteriaceae log10 counts at control and low inoculation levels for frozen broccoli by Petrifilm EBCount Plate, VRBG agar, and MPN methodsa
a Log10 Enterobacteriaceae count/g. PEB = Petrifilm Enterobacteriaceae Count Plate. VRBG = Violet red bile agar fortified with glucose. MPN =Most probable number.
b A and B = Duplicate test portions.
812 SILBERNAGEL & LINDBERG: JOURNAL OF AOAC INTERNATIONAL VOL. 86, NO. 4, 2003
Table 11. Enterobacteriaceae log10 counts at medium and high inoculation levels for frozen broccoli by Petrifilm EBCount Plate, VRBG agar, and MPN methodsa
a Log10 Enterobacteriaceae count/g. PEB = Petrifilm Enterobacteriaceae Count Plate. VRBG = Violet red bile agar fortified with glucose. MPN =Most probable number. LA = Laboratory accident.
b A and B = Duplicate test portions.
Table 12. Enterobacteriaceae log10 counts at control and low inoculation levels for nut pieces by Petrifilm EB CountPlate, VRBG agar, and MPN methodsa
a Log10 Enterobacteriaceae count/g. PEB = Petrifilm Enterobacteriaceae Count Plate. VRBG = Violet red bile agar fortified with glucose. MPN =Most probable number. — = Test portions did not arrive in time; laboratory did not participate.
b A and B = Duplicate test portions.
The mean log10 counts by the VRBG method were not sig-nificantly different from those by the Petrifilm plate procedurefor all levels of inoculation. The mean log10 counts by theMPN procedure were significantly different from those of thePetrifilm plate method for all levels of inoculation with p-val-ues of 0.04, 0.03, and 0.02, respectively.
The repeatability variance of the Petrifilm plate methodwas significantly better (p < 0.01) than for the VRBG methodat the high inoculation level and was not significantly differentfrom the VRBG method for the medium inoculation level.The repeatability variance of the VRBG method was signifi-cantly better (p < 0.01) than for the Petrifilm plate method forthe low level of inoculation. The repeatability variance of thePetrifilm plate method was significantly better (p < 0.05) thanfor the MPN procedure for the low level of inoculation. Forthe medium and high levels of inoculation, the repeatabilityvariance of the Petrifilm plate method was significantly better(p < 0.01) than for the MPN method.
Milk
At the low level of inoculation, the Petrifilm plate log10
counts from Laboratory 10 were considered to be outliers, i.e.,they did not fit well with the rest of the data and were removedfrom the calculations of mean log10 counts, repeatability stan-dard deviations, and reproducibility standard deviations. Boththe Petrifilm plate log10 counts and the VRBG method log10
counts at the high level of inoculation from Laboratory 9 wereoutliers and were removed before the mean log10 counts and therepeatability and reproducibility variances were calculated.
The mean log10 count of the Petrifilm plate method was notsignificantly different from that of the VRBG method at themedium level of inoculation. The mean log10 counts of thePetrifilm plate method were significantly different from thoseof the VRBG method and MPN procedure for all other levelsof inoculation. The Petrifilm plate mean log10 counts werehigher than those of the other methods.
The repeatability variance of the Petrifilm plate methodwas significantly better (p < 0.01) than for the VRBG methodfor the low and medium levels of inoculation and was signifi-cantly better (p < 0.05) for the high level of inoculation. Forthe low level of inoculation, the Petrifilm plate method’s re-peatability variance was significantly better (p < 0.05) than forthe MPN method. For the medium and high levels of inocula-tion, the repeatability variance of the Petrifilm plate methodwas significantly better (p < 0.01) than for the MPN method.
Flour
A statistical difference between the mean log10 counts fromthe Petrifilm plate procedure and those of VRBG method atthe low level of inoculation did not exist. There was no statisti-cal difference between the mean log10 counts from thePetrifilm plate procedure and those of the MPN method at thehigh level of inoculation. For the low and medium levels of in-oculation, the Petrifilm plate log10 counts were higher, on av-erage, than those of the MPN method. For the medium andhigh levels of inoculation, the VRBG log10 counts werehigher, on average, than those of the Petrifilm plate method.
SILBERNAGEL & LINDBERG: JOURNAL OF AOAC INTERNATIONAL VOL. 86, NO. 4, 2003 813
Table 13. Enterobacteriaceae log10 counts at medium and high inoculation levels for nut pieces by Petrifilm EBCount Plate, VRBG agar, and MPN methodsa
a Log10 Enterobacteriaceae count/g. PEB = Petrifilm Enterobacteriaceae Count Plate. VRBG = Violet red bile agar fortified with glucose. MPN =Most probable number. TNTC = Too numerous to count. — = Laboratory did not participate. LA = Laboratory accident.
b A and B = Duplicate test portions.
The repeatability variance of the Petrifilm method was sig-nificantly better (p < 0.05) than for the MPN procedure for theuninoculated and high levels of inoculation.
Prepared Meals
Outliers were found in the MPN method at the low level ofinoculation for Laboratories 1 and 7, in the Petrifilm platemethod at the medium level of inoculation for Laboratory 1, inthe Petrifilm plate method at the high level of inoculation forLaboratory 7, and in the MPN method for Laboratories 2 and 4.These values were removed before the mean log10 counts andthe repeatability and reproducibility variances were calculated.
The mean log10 counts by the Petrifilm plate procedure werenot significantly different from those of the VRBG method atthe low level of inoculation. The log10 counts of the Petrifilmplate procedure were higher than those of the VRBG method,on average, at the medium and high levels of inoculation. Themean log10 counts by the Petrifilm plate procedure were not sig-nificantly different from those of the MPN method at the me-dium and high levels of inoculation. The log10 counts of thePetrifilm plate method were higher, on average, than those ofthe MPN method at the low level of inoculation.
The repeatability variance of the Petrifilm plate methodwas significantly better (p < 0.05 and p < 0.01, respectively)than that of the VRBG method for the medium and high levelsof inoculation. The repeatability variance of the Petrifilm platemethod was significantly better (p < 0.01) than that of theMPN method for all levels of inoculation.
Frozen Broccoli
The log10 counts at the low level of inoculation from theVRBG method from Laboratory 1 were identified by theCochran and/or Grubbs test(s) as outliers and were eliminatedfrom the analysis.
On average, the log10 counts by the Petrifilm plate proce-dure were higher than those of the VRBG and MPN methodsat all levels of inoculation except the low level where therewas no statistical difference.
The repeatability variance of the Petrifilm plate methodwas significantly better (p < 0.05) than that of the VRBGmethod for the medium and high levels of inoculation and wassignificantly better (p < 0.01) than that of the MPN method forthe medium level of inoculation.
Nuts
The log10 counts at the low level of inoculation from theVRBG method from Laboratory 5 were identified by theCochran and/or Grubbs test(s) as outliers and were eliminatedfrom the analysis.
A statistical difference between the mean log10 counts ofthe Petrifilm plate method and those of the VRBG and MPNprocedures did not exist.
The repeatability variance of the Petrifilm plate methodwas significantly better (p < 0.05) than that of the MPN proce-dure for the low level of inoculation. It was significantly better(p < 0.01) than that of the MPN procedure for the high level oftest portions.
Recommendations
The mean log10 counts and the repeatability/reproducibilityprecision estimates of the Petrifilm EB Count plate methodwere similar to those for the VRBG method and better thanthose of the MPN method. Therefore, it is recommended thatthe Petrifilm EB Count plate method be adopted First Actionfor the enumeration of Enterobacteriaceae in cheddar cheese,pasteurized liquid milk, flour, frozen prepared meals, frozenbroccoli, and nut pieces.
Acknowledgments
We thank the following collaborators for their participa-tion:
Sandy Beatty, MAK-BEA Labs, Blue Earth, MNKristen Bell, Excel Product Development Center, Wichita,
Fayetteville, ARPatti Wilson, Health Protection Branch Canada,
Dartmouth, Nova Scotia, Canada
References
(1) Mossel, D.A.A., Corry, C.B., Struijk, C.B., & Baird, R.M.(1995) in Essentials of the Microbiology of Foods, JohnWiley and Sons, New York, NY, pp 268–341
(2) Hitchins, A.D., Hartman, P.A., & Todd, E.C.D. (1992) inCompendium of Methods for the Microbiological Examina-tion of Foods, 3rd Ed., American Public Health Association,Washington, DC, pp 325–369
(4) Christen, G.L., Davidson, P.M., McAllister, J.S., & Roth,L.A. (1992) in Standard Methods for the Examination ofDairy Products, 16th Ed., American Public Health Associa-tion, Washington, DC, pp 247–269
(5) Anonymous (1991) General Guidance for the Enumerationof Enterobacteriaceae without Resuscitation—MPN Tech-nique and Colony Count Technique, ISO 7402, InternationalOrganization for Standardization, Geneva, Switzerland
(6) Youden, W.J., & Steiner, E.H. (1975) Statistical Manual ofthe Association of Official Analytical Chemists, AOAC,Arlington, VA
(7) Snedecor, G.W., & Cochran, W.G. (1980) StatisticalMethods, Iowa State University Press, Ames, IA
814 SILBERNAGEL & LINDBERG: JOURNAL OF AOAC INTERNATIONAL VOL. 86, NO. 4, 2003