tions, rotor/thetoring of rotatithe position of ng at Siemens D
Kocur directed neering and tesuct lines. He hAmoco Corpora
Dr. Kocur rece. (1991) from
1) from Tulaneinstability and
ings, has sat asmember of ASM17 chair, 684hanical Equipm
uction, refinings at Mobil, he wral offshore gasng as reliability
Dr. Cloud rec) and Ph.D. ) from the Un
P ROTORDY
Dr. John A. KnMobil Researc5 Gallows RoadFairfax, VA 22
(703) 846n.a.kocur@exx
John A. KEngineer Division aEngineerihas workefor 30 yeahe provideupstream within Exx
ermo dynamicsing equipment.
f Manager of PrDemag Delavathe developme
sting of the comhas also held poation.
eived his BSMEm the Universi
e University. d bearing dynas a committee c
ME. Currently,4 chair and mment (SOME).
C. Hunter ClMachinery CCharlottesvilproviding a dmachinery tehis career wiDevelopmentNJ, as a turbresponsible fcommissionin
g and chemicalworked on nums injection platfty manager at aceived his B.S
(Mechanical University of V
Copyright
YNAMIC TES
Kocur, Jr. ch & Engineerid, Rm 2A-0602037-0001
6-2275 xonmobil.com
Kocur, Jr. is a Min the Equipme
at ExxonMobil ng in Fairfax,
ed in the turbomars. In his curres support to thand chemical bxonMobil with s, failure analy Prior to joiniroduct Engineeal Turbomachinent, research, dmpressor and sositions with P
ME (1978), MSMity of Virginia
He has authoamics, lecturedchairman for N he holds posit
member of Su
loud is PresideConsulting, LLClle, Virginia, a diverse range oechnical serviceith Mobil Reseat Corporation i
bomachinery spfor application ng, and troublel facilities. Dur
merous projectstforms in Nigera large US refiS. (Mechanicaand Aerospac
nderstanding thermining the rher examining urbine, motor need to accuratrial specificatiacy of roturement is imtrial setting. Tbehavior providence that the d
otordynamic shroject during acns include meg as well as nse and stabili
ntages; the mction disruptiotest option has
lateral vibrstanding theseassociated with
pplying best trial (API) tesmum benefit o
involve the tical methods mation. Whethore complex sg, ensuring odology is follotordynamic moale behind tstanding of wct application to
dle East TurbFebruary 20
Texas A&M En
NEFITS AND
Dr. C. HunteG Machinery Co
703 HighlandCharlottesville,
(434) 293-cloud@brgmac
n Institute, thedvisory commmposium.
he lateral rotoreliability/opera centrifugal por generator, r
ately predict anions determinitordynamic
mpractical or Testing to conides both thedesign will me
hop testing hacceptance tests
echanical run, verification te
ity predictionsmost importanons involved s associated cosbration chare factors is vith the purchased
practices andst requirement
of each test optest procedurused to pos
her performingstability verificthat a logicowed producesodel and laterathe API test why that test o the dynamic
bomachinery015 | Doha,
ngineering Exp
D PRACTICES
er Cloud onsulting LLC
d Avenue VA 22903
-9926 chinery.com
e API 684 rotomittee for the
ordynamic behaability of rotat
pump or comprrotating machi
nd measure dyning fit for purppredictions otherwise imp
nfirm rotordynae purchaser anet project expe
s several optios at the vendorstring and fu
esting to valids. Such testingnt being the with testing asts as well as lracteristics atal to efficientd equipment.
d an understats are needed
ption. The besre but also st process theg a simple mechcation during al, repeatables reliable evideal vibration per
requirementsis being perfbehavior.
y SymposiumQatar | met
periment Station
S
C
ordynamics tase Texas A&M
avior is criticating equipmentressor, steam oinery share thnamic behaviorpose rely on thwhere direcpossible in anamic predictionnd vendor thectations.
ons available tr’s shop. Thes
ull load/Type date unbalanc
g has numerouavoidance o
at the job sitelimitations as tare revealedtly mitigate th
anding of thd to derive thst practices nothe associated
e measuremenhanical run tesASME Type
e and provenence to confirmrformance. Ths provides anformed and it
Test options can be separated into two categories; tests that reveal portions of the dynamic behavior of the equipment to specific operating conditions and those used to verify the analytical predictions of that behavior. API mechanical, string and Type I (or full load) tests reveal the rotordynamic behavior of the equipment to a given set of conditions. These are used specifically to determine acceptability of the design. Unbalance and stability verification testing is used to confirm (or provide confidence in) the rotordynamic model. Confidence in the model permits extrapolation of the design (vendor) and operation (purchaser) beyond the machine’s as-built and specific shop test conditions.
INTRODUCTION
Demands on turbomachinery continue to push designs beyond experience limits in terms of speed, power, size, pressure development and flow rate all the while demanding higher reliability and operability. To meet the stringent objectives of the application, almost absolute knowledge of the behavior of the machine is necessary. To aide in this understanding, advanced analytical methods have been developed in parallel with rigorous testing practices.
Shop acceptance testing has long been used as the “final” check of the turbomachinery design and is required for all special purpose equipment. With the advancement of computational methods, failure rates during testing have been greatly reduced. However, experience has taught us analytical methods alone are insufficient to guarantee the “right the first time” philosophy that many reliability systems employ. Whether used to provide data to baseline prototype equipment, to benchmark extensions of current experience limits, or for verification of proven practices, testing remains an integral part of all reliability systems.
Understanding the dynamic behavior is critical in determining the reliability/operability of rotating equipment. Whether designing a pump, compressor, turbine, motor or generator, all rotating machinery share the same need to accurately predict and measure dynamic behavior. Literature is swamped with failures that resulted from both inadequate design and testing methodologies. While the potential for failure originates at the design stage, testing represents the final step to identify that potential. The importance of efficiently employing both cannot be understated [1].
Turbomachinery is dominated by two classes of dynamic behavior; rotordynamics and fluid dynamics. As their names imply, each focuses on a specific dynamic behavior; rotordynamics on the rotating system’s vibration and fluid dynamics on the mechanical interaction with the working fluid. As our depth of understanding increases, the more interrelated these behaviors become. Decisions made in the design of one can impact the other with sometimes disastrous effects. Nowhere is this more evident than centrifugal equipment, especially compression. For this reason, this tutorial will focus on testing the rotordynamic behavior of centrifugal compressors. However, most of the principles and practices are applicable across all types of turbomachinery.
Rotordynamic behavior testing involves both direct
measurement and inference. Direct measurement of the vibration is typically made at the journal locations. Internal vibration levels at other critical locations can only be inferred from these measurements using the rotordynamic predictions. Thus, industrial specifications determining fit for purpose rely on the accuracy of rotordynamic predictions where direct measurement is impractical or otherwise impossible in an industrial setting. Testing to confirm rotordynamic prediction and behavior provides both the purchaser and vendor the confidence that the design will meet project expectations.
Rotordynamic shop testing has several options available to the project during acceptance tests at the vendor’s shop. These options include tests to demonstrate operating behavior at a specific condition (mechanical run, string and full load/Type 1 testing) and verification testing to validate unbalance response and stability predictions. Such testing has numerous advantages; the most important being the avoidance of production disruptions at the job site. Each test option has associated costs as well as limitations as to what lateral vibration characteristics are revealed. Understanding these factors is vital to efficiently mitigate the risks associated with the purchased equipment.
Application of best practices and an understanding of the industrial (API) test requirements are needed to derive the maximum benefit of each test option. The best practice not only involves the test procedure but also the associated analytical methods used to post process the measurement information. Whether performing a simple mechanical run test or more complex stability verification during ASME Type I testing, ensuring that a logical, repeatable and proven methodology is followed produces reliable evidence to confirm the rotordynamic model and lateral vibration performance.
Test options can be separated into two categories; tests that reveal portions of the dynamic behavior of the equipment to specific operating conditions (Vibration Demonstration Tests) and those used to verify the analytical predictions of that behavior (Design Verification Tests). API mechanical run, string and Type I (or full load/full pressure) tests reveal the rotordynamic behavior of the equipment for a given set of conditions. These are used specifically to determine acceptability of the design in a pass/fail mode. Unbalance response and stability verification testing is used to confirm (or provide confidence in) the rotordynamic model and analysis. Confidence in the model permits extrapolation of the design (vendor) and operation (purchaser) beyond the machine’s as-built and specific shop test conditions.
The tutorial will cover the following aspects of rotordynamic testing:
Decision to test: Why and on What Basis?
Rotordynamic Testing
o Options
o Objectives
o Preparation
o Information / Knowledge Gain
DEC
Thobjecaccurbeforand wrelate
Thand stestinanalyperfothe tetest dsense
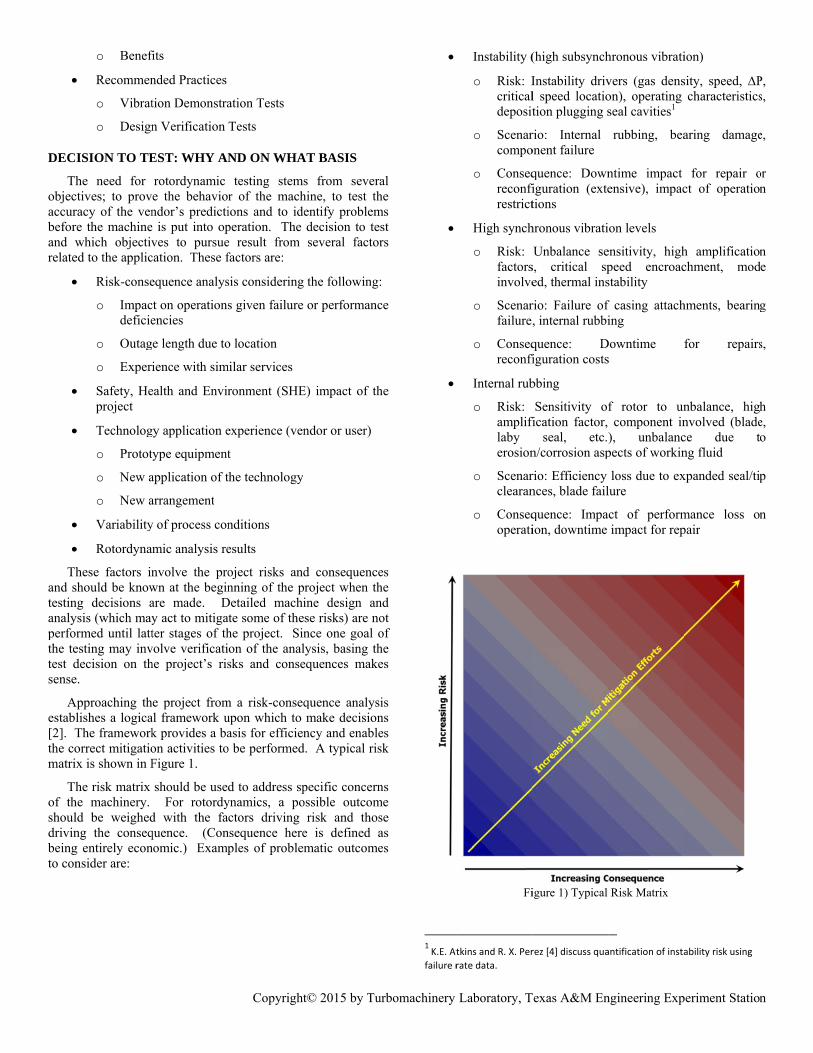
Aestabl[2]. Tthe comatri
Thof thshouldrivinbeingto con
o Benefi
Recommen
o Vibrat
o Design
ISION TO TE
he need for ctives; to provracy of the venre the machinewhich objectived to the applic
Risk-conse
o Impacdeficie
o Outag
o Experi
Safety, Heproject
Technolog
o Protot
o New a
o New a
Variability
Rotordyna
hese factors inshould be knowng decisions aysis (which mayrmed until latt
esting may invdecision on the.
Approaching thlishes a logicaThe frameworkorrect mitigatiox is shown in F
he risk matrix he machinery. ld be weighedng the conseqg entirely econnsider are:
fits
nded Practices
tion Demonstra
n Verification
EST: WHY AN
rotordynamic e the behaviondor’s predicti
e is put into opves to pursue
cation. These f
equence analys
ct on operationsencies
e length due to
ience with sim
ealth and Envir
gy application e
type equipment
application of t
arrangement
y of process con
mic analysis re
nvolve the prown at the beginare made. Dy act to mitigater stages of th
volve verificatihe project’s ris
he project fromal framework uk provides a baon activities toFigure 1.
should be use For rotordy
d with the faquence. (Connomic.) Examp
Copyright
ation Tests
Tests
ND ON WHA
testing stemsr of the machions and to ideperation. The e result from factors are:
sis considering
s given failure
o location
milar services
ronment (SHE
experience (ven
t
the technology
nditions
esults
oject risks andnning of the p
Detailed machiate some of thehe project. Sinon of the analsks and conse
The user must also consider the safety, health and environmental impact of possible failures that can be attributed to the machinery in question. The impacts can result in the release of gas from component failure due to high vibrations, failure to meet regulatory requirements due to unplanned outage or injury due to parts release during failure. The risks of each can be determined through a failure mode analysis [3] that incorporates the rotordynamic contributions to the identified failure modes.
Experience plays an important role in determining the extent of testing to perform. Experience in this case relates to both the vendor and user. Obviously, prototype machinery or equipment that extends the experience limits of the vendor should be tested thoroughly. What may be overlooked is the experience of the user with that equipment. First application of technology within a user company may benefit from additional testing at the vendor’s shop. The testing can be used to better understand the dynamics and what conditions or operating nuances may affect the rotordynamic behavior. Finally, prototype components within the machinery may require additional component testing to determine their impact on the rotordynamic behavior of the machinery.
Finally, the results of the rotordynamics analysis should be used to weigh the decision to test and which test to select. Machines shown sensitive to destabilizing forces or those predicted to have low stability levels may benefit from stability verification tests. Similarly, a rotor with high amplification factors may influence the decision to perform unbalance response verification testing. Verification testing, as noted earlier, is intended to prove the accuracy of the predictive tools used to model the rotor behavior and thus assess the acceptability of the design. The use of a proven rotordynamic analysis is an effective and efficient mitigation strategy towards reducing risk.
ROTORDYNAMIC TESTING
Options
Fundamentally, there are two types of testing options available for lateral rotordynamic assessment. The first type, referred to as vibration demonstration tests, demonstrates the behavior of the as-built machine and/or train for a specific set of operating conditions. Generally, only the site specific instrumentation is used to measure lateral vibration behavior. The tests do not address the accuracy of the model or tools used to predict the rotordynamic behavior, nor do they attempt to estimate or determine the robustness of the design. Those that fall into this category are:
Mechanical Run – an example is the API required mechanical test [5]
String – API 617 refers to this as a complete unit test [6]
Full load/Full pressure – Referred to as a Type I test by ASME [7]
Many important aspects of the rotordynamic behavior cannot be practically measured (i.e. internal vibration levels, separation margin to modes above operating speed) nor can
every possible operating condition or combination of assembly /machining tolerances be tested. To fully understand the acceptability of the design and the rotordynamic behavior, we must rely on the accuracy of the rotordynamic analysis. Consequently, tests to determine the accuracy of those predictions were developed. These additional tests were developed to provide more than a pass/fail test, which is essentially what the vibration demonstration tests are. They were implemented to determine the robustness of the design. This is particularly useful when operating conditions are widely variable or when design experience limits are exceeded. The second type of testing option is referred to as design verification tests with the two most prevalent being:
Unbalance response – This test would include the more invasive testing required by API [8]
Stability – Not currently specified by API standards.
Verification testing also has the options of where these tests can be performed. In either case, the tests may be performed in a high speed balance bunker, during the mechanical test or during the full load testing. Each option adds additional considerations in what can be measured, dynamic effects included in the test and what portion of the dynamic behavior is analyzed.
Test Preparation
Following the decision to perform a rotordynamic test, the user should decide which specifications to apply to the test. The specification should describe the objectives and requirements of the test. For several of the test options described above, API standards have described a specific test procedure to be followed. The API standard details the procedure, objective and requirements for the test. For the more specialized testing, the user will need to develop their own test specification. This can be done with the assistance of the vendor or by consulting industry specialists.
Test Objectives
The objectives of the tests performed should be discussed at the initial stages of the project. Agreement on the test objectives will assist in the determination of what equipment is needed, measurements to be taken, and conditions to be run. Generally speaking, the objectives of each test are listed below. Other specialty objectives can be added, but the ones listed below would form the basis for each test.
Vibration Demonstration Tests
Mechanical Run Test
The mechanical run test as required by API is primarily a vibration level check. Measured at the probes located at the journal location, vibration levels are checked against the specified limit for both overall and non-synchronous components. General mechanical performance is also examined including bearing temperatures, close clearance rubbing and seal performance typically up to maximum continuous speed (MCS). Supercritical behavior is examined by determination of the amplification factor and separation margin of typically the 1st critical speed. (Obviously, the behavior of modes above MCS remains undetermined.)
The string test is not much different than the mechanical test mentioned previously. As the name implies, the string test is performed with all or a major portion of the machinery train connected (typically everything but the driver.) The objectives of this test are also similar to the mechanical test of a single body in that vibration levels are checked against limits, mechanical performance is examined, and supercritical behavior is analyzed. However, in this case, these are determined for the coupled train configuration. The string test is run to measure the coupled body dynamic behavior (when rigid couplings are used in the train) or the coupling spacer dynamics (for couplings with unusually long or heavy spacer tubes.)
Full Load / Full Pressure Test
Full load / full pressure tests are rarely performed based on rotordynamic justifications only, mainly due to the costs involved. However, the Type I test does permit vibration level checks at operating conditions, stall determination, impact of internal loading and deflections on dynamic behavior of individual components (seals and bearings) and a binary check for stability (yes or no). Range testing is rarely done during the Type I test. Typically gas properties are held constant, clearances are left at as-built values and alternate configurations are not considered. Thus, while some aspects of rotordynamic behavior are tested, margins and robustness are left unchecked. The machines undergoing these tests leave those factors to analytical studies whose accuracy may remain unchecked. Keep in mind, to predict the stability (stable vs. unstable) of any machine is the first step in developing a good predictive tool. However, it is not the only step. As designs extend the operating or design experience, it becomes necessary to predict the stability threshold, separation margins and overall optimization of the design correctly, thus the need for verification testing.
Design Verification Tests
Unbalance Response
The likely first attempt to publish a verification test in an industry standard was the unbalance response verification test published by API 617. The objective was simply to verify the unbalance response prediction accuracy of the vendor’s rotordynamic analysis with regards to the machine’s unbalance sensitivity within the operating speed range and the location of the critical speeds (below trip speed.) The verification test analyzes both the predictor tool and model employed. A methodology was refined over several editions of API 617 within the limitations of the mechanical shop test. Alternatively, performing this test in the balance bunker has gained acceptance with the increase in at-speed balancing of rotors and the freedom it permits in terms of weight placement and additional measurement points.
Stability
Several methods have been developed analogous to the API unbalance response verification test with the objective to verify the stability predictions of centrifugal compressors. As with the unbalance response, the intent is to measure more than just
“is the compressor stable” but “how stable is it.” The measurements are then compared against the analytical predictions to determine accuracy. Pettinato et al. [9] presented a methodology employing this test during mechanical and performance testing (as required by API 617).
Test Information / Knowledge Gain
To determine the extent of testing to perform, one needs to understand the information or knowledge gained of the rotordynamic behavior of the body or train. While similar information can be obtained from several of the tests, the costs associated with each determine the overall efficiency of obtaining the necessary information to mitigate risks identified in the risk matrix. As before, the tests are separated into vibration demonstration and verification testing. Vibration demonstration testing confirms the machinery can meet project specifications for a given operating and as-built condition. No attempt is made to confirm the accuracy of the analytical prediction beyond confirmation that the specification has been met. Since the accuracy of the analytical prediction remains largely in question, inferred information from the analytical method should also be questioned.
Vibration Demonstration tests
Mechanical Run
Mechanical testing provides information related to the critical speed location and some indication of that modes behavior. The modal information is limited to only those modes located below the maximum test speed achieved (trip speed in most cases.) Typically, this is only the 1st critical speed. The modal behavior information is restricted to the amplification factor which is sketchy at best. The amplification factor can be highly sensitive to the acceleration/deceleration rate and whose magnitude is not restricted by API. The test also validates the balance procedure’s effectiveness in meeting the project vibration limit specification.
For certain low risk applications, this amount of information is sufficient. What isn’t tested however can be significant. For example, subcritical motor applications (incorrectly termed stiff shaft) operate below the 1st critical. This critical speed can have high amplification factors and can be damaging if the separation margin is lost. Performing only a mechanical test will tell the user whether the mode is on or below the operating speed. The amount of separation remains untested and can only be inferred from the unverified analytical predictions. Thus, the impact of support stiffness loss on the location of the mode in the field (due to structural or bearing clearance changes) can have significant risk associated with it.
String Test
String testing will provide the same type of rotordynamic information as obtained with the mechanical testing but at the higher costs of assembling the entire (or high speed portion) of the train. Information again limited to the critical speed location and some indication of the modal behavior. Ignoring other reasons to perform string testing (e.g. fit checks for trains being sent to remote portions of the globe), rotordynamic justification for the test should be limited to the information supplied by the test, namely, dynamic behavior of the coupling
spacer(s) and rigid coupling effects on the dynamic behavior of individual bodies. As noted in API 684 [10], a train lateral analysis should be requested for unusually long or heavy coupling spacers or when rigid couplings are used. In this case, the correct boundary conditions at the shaft ends are obtained when the train is modeled (train in this case refers to the bodies on either side of the coupling(s) in question.)
Testing of this train configuration should mimic the analytical model to verify the behavior in question. With a rigid coupling, the rotordynamic behavior of the bodies rigidly coupled will be affected. For unusually long or heavy coupling spacers, the dynamics of the spacer can only be accurately modeled/tested with the hubs attached to the shafts.
Full Load / Full Pressure (FLFP) Test
Type I tests provide a stable vs. unstable behavior indication of the rotor to specific test conditions. The test also reveals the change in lateral behavior of the measured modes (typically the 1st critical speed as with the mechanical test) due to internal loading of the compressor and application of gas pressures and densities close to the design values at the seals. The latter introduces seal dynamics into the testing that is only achieved during the FLFP test. This is important for both stability and synchronous behavior especially for machines incorporating hole pattern or honeycomb seals. The presence of subsynchronous vibration due to phenomena such as stall, surge or whirl may also be revealed during the FLFP test.
Design Verification Tests
Unbalance Response
The unbalance response verification test (URVT) provides a measurement of how well the analytical predictions match the vibration produced from a known unbalance. This in turn adds confidence to the internal deflection, separation margin and unbalance sensitivity calculations made from that analysis. On the shop floor, the unbalance weight addition is typically limited to the coupling. Some turbines and overhung machines have the ability to add internal weights or weights to the overhung impeller. Optionally, the test can be performed in the vendor’s balance bunker. The bunker permits more freedom in terms of weight placement and measurement of shaft deflection at points other than the job’s proximity probe location (mid-span, for example.) Of course, the analytical model needs to reflect the setup in the bunker; bunker bearings if used and support stiffness of the bunker pedestals. Since the intent is verify the accuracy of the analytical predictions, these differences in configuration should not affect reaching that conclusion.
Stability
The stability verification (SVT) test provides confidence in the analytical predictions regarding the stability level and position relative to the stability threshold. As with the unbalance response verification, options are available regarding the platform or test configuration to perform this test. The results of each platform can be summarized below regarding the accuracy of the analytic method to predict:
Balance bunker – Rotor, bearings, and pedestal support impact on stability (bunker bearings if used) at various speeds.
Mechanical test (Vacuum) – Rotor, job bearings and casing support impact on “baseline” stability (or basic log decrement reflecting the bearings and rotor only) at various speeds.
Performance test – Rotor, job bearings, casing support and reduced aerodynamic and seal behavior impact on stability for a limited speed range.
Type I test – Stability level and margin at nearly the same operating conditions as expected in the field. The range of gas conditions, inlet and discharge pressures and flow rates may be limited as a result of the test setup.
Test Benefits
The benefits derived from the rotordynamic testing can be identified for the two groups of testing. Vibration demonstration testing provides the purchaser the following:
Demonstration that vibration levels and critical speed separation margins (for those under the maximum test speed) specifications have been met – All tests
A stable vs. unstable check is made for a specific test condition – Type I test
Proof of effectiveness of the balance procedure in meeting vibration level specifications – All Tests
Non-synchronous vibration levels examined – Type I test, to some degree all tests
Design verification extends those benefits to:
Determining accuracy of unbalance response calculation with regards to the unbalance sensitivity – Unbalance verification (shop floor)
Determining predictive accuracy for mid-span unbalances and deflections – Unbalance verification (at-speed balance bunker)
Reassurance that mid-span deflections are within operating clearances for close clearance locations – Unbalance verification (higher for at-speed balance bunker)
Verification of stability level prediction for system with no excitations (baseline stability) – Stability verification (at-speed balance bunker and during the mechanical run test)
Reassurance that rotordynamic model of shaft and bearings is accurate – URVT and SVT
Robustness and optimization of machinery design – URVT and SVT
Correctness of the stability model of impellers, annular seals and other destabilizing mechanisms as well as the effectiveness of any components which are intended to reduce the destabilizing effects (shunt bypass, swirl brakes, damper seals) – Stability verification (PTC Type I and Type II testing)
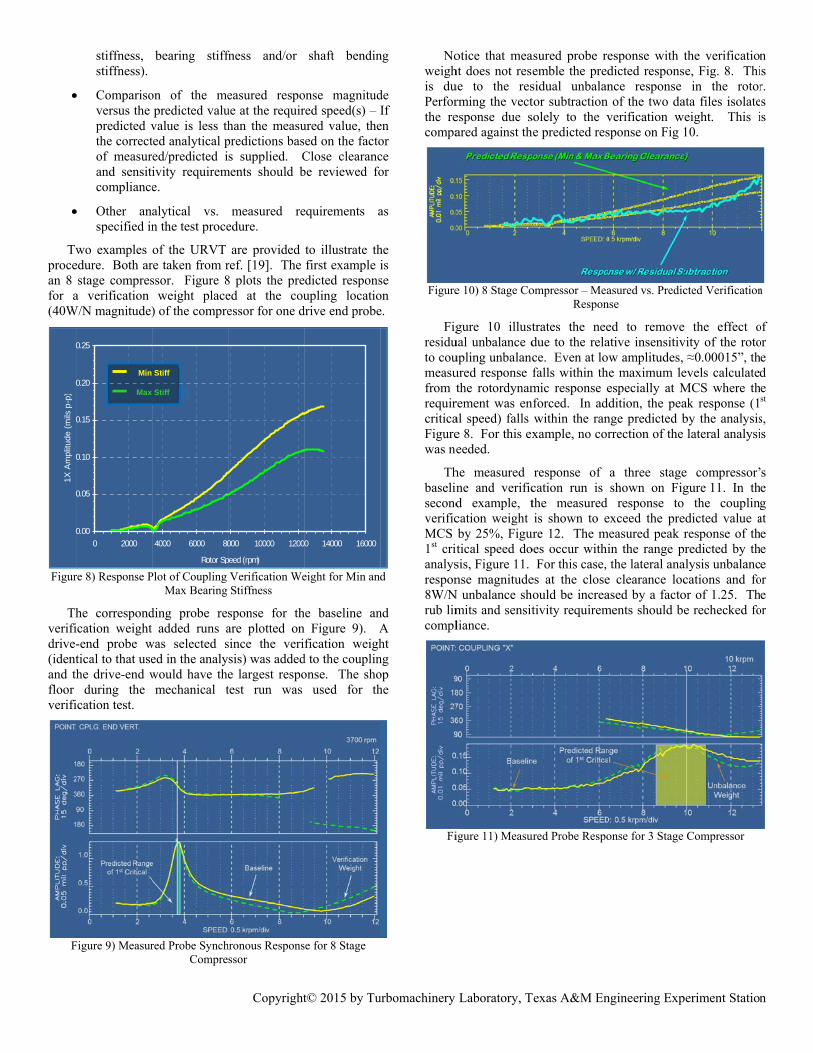
The at-speed balance bunker can extend the benefits of the URVT by permitting weight placement at and measurement of locations that are more sensitive to unbalance and the negative effects of high vibrations. For between bearing machinery, critical close clearance locations that impact performance are located at or near the mid-span where the first critical speed has its peak deflection. In addition, unbalance creation is more likely to occur at the mid-span due to deposits, erosion or corrosion and is more likely to excite the 1st critical speed. Unbalance placement at the coupling (typically the only readily accessible location during the mechanical shop test) does not excite the 1st critical speed significantly and provides minimal information or assessment of the prediction accuracy of this mode.
Typically, URVT on the shop floor is limited to the coupling location. Journal probe vibration levels produced by adding a 40W/N weight to the coupling is less than 0.00025” at MCS. Performing the verification test in the bunker can permit measurement of the mid-span and journal locations to a variety of applied unbalances. Direct measurement of the relative displacements along the rotor allows for closer scrutiny of the predicted shaft and bearing dynamics as they relate to the amount of modal bending and damping at the critical speed. It should be noted that the intent of the test is to determine the vendor’s ability to predict the unbalance response behavior of a model containing a shaft, bearings and support structure. The results may not be indicative of the actual behavior of the job machine and relies on accurate modeling of the bunker pedestal dynamics. However, the assurance gained from verification of the predictive method in the bunker should carry over to the job rotordynamic predictions.
Vibration demonstration tests can reveal the presence of instabilities. However, even if no problematic nonsynchronous vibrations are observed, the machine’s actual stability could be very small (say less than the API design minimum requirement of log decrement of 0.1) and close to the stability threshold. This state of blindness with respect to the machine’s actual stability, as well as the significant uncertainties remaining in current modeling tools for stability prediction [11], can only be mitigated by directly measuring the machine’s log decrement through a SVT.
Unlike the URVT, a SVT requires additional hardware in the form on a temporarily, mounted shaker. While this is an added complication, a SVT is often a cost and technically effective alternative to the very expensive Type I test. Such Type 1 testing is unlikely to receive project approval unless it is specified very early on during FEED. SVT can provide a valuable stability assessment of the machine during the other operations/tests that are often typically specified, namely, at-speed balancing, MRT or PTC 10 Type II performance tests.
When done in conjunction with high speed balance or the
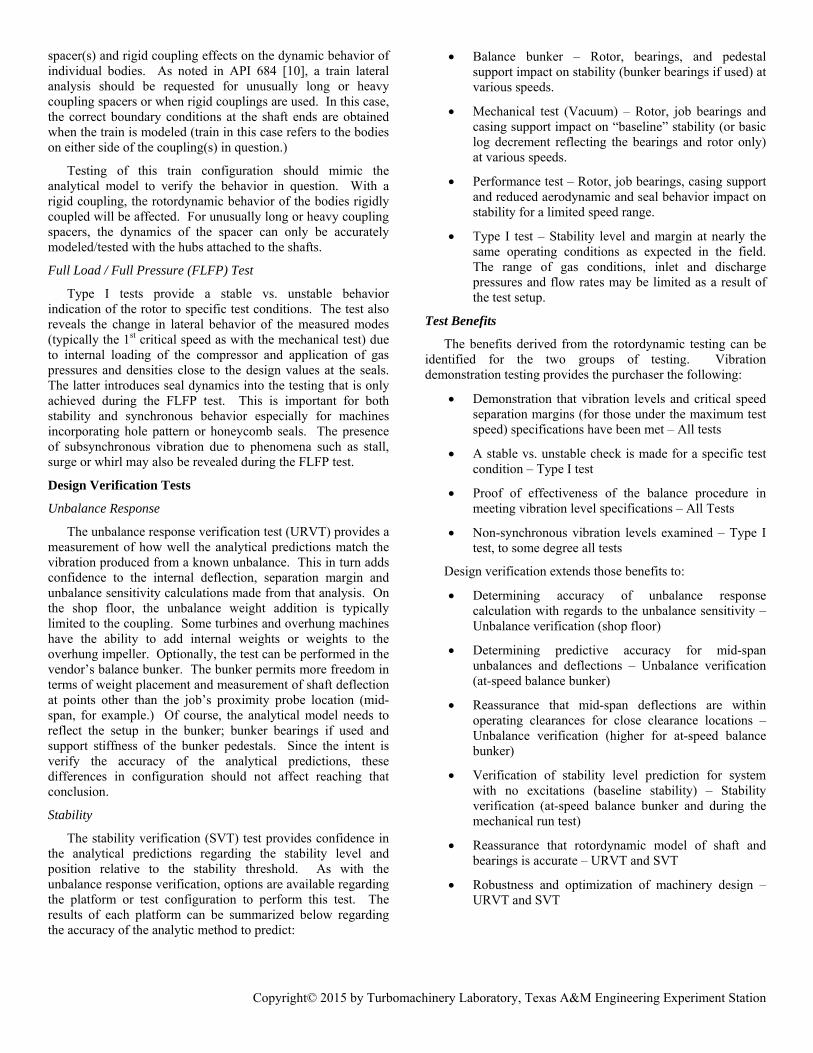
MRT, an SVT can measure the machine’s basic log decrement. Figure 2 shows the results of such testing versus speed for a particular test rig mounted on tilting pad journal bearings [12]. Measurement of the basic log decrement provides evidence as to whether or not the machine’s rotor/bearing/support system has the robustness to counteract the destabilizing mechanisms that it will experience in the field. As shown in Figure 2, such basic log decrement testing also provides the opportunity to assess competing tilting pad journal bearing models, a topic of much debate in the industry [11, 12].
Figure 2) Base stability measurements versus speed
RECOMMENDED PRACTICES OF ROTORDYNAMIC TESTING
This section will focus on the rotordynamic testing of centrifugal compressors due to the complex dynamic behavior of this class of turbomachinery. Concepts developed in this section can be applied to all types of machinery as they all share certain aspects of rotating behavior. In addition, this section will focus on rotordynamics only. The tests listed below, especially the non-verification testing, are also used to prove other aspects of the machine’s acceptability. These aspects will not be discussed.
Vibration Demonstration Tests
Mechanical Run Test
Mechanical run test of the rotating equipment should be viewed as a minimal test to determine the rotordynamic acceptability and should be considered for equipment that is designed-for-purpose in contrast to equipment selected from a catalog.
usions zones uencies. Followfied for 15 miat maximum cws the 4 hour r
he warm up poare given tim
ing unintendeddamage. The wotor behavior be detected at/stator damagensure that vibptable at this sphermal conditiotion levels aree levels of eac If any param
ease or decreass are achievewing the 4 hrmed. The coa
hronous behavalso be used rmed.
Operation at trirtant for seveases centrifugference fits andmay alter the bspeed is neceenient to reachntial problemsify any criticanuous speed th
d.
Additional shutd at the beginnst the coastdient behavior ges to the balanprove useful
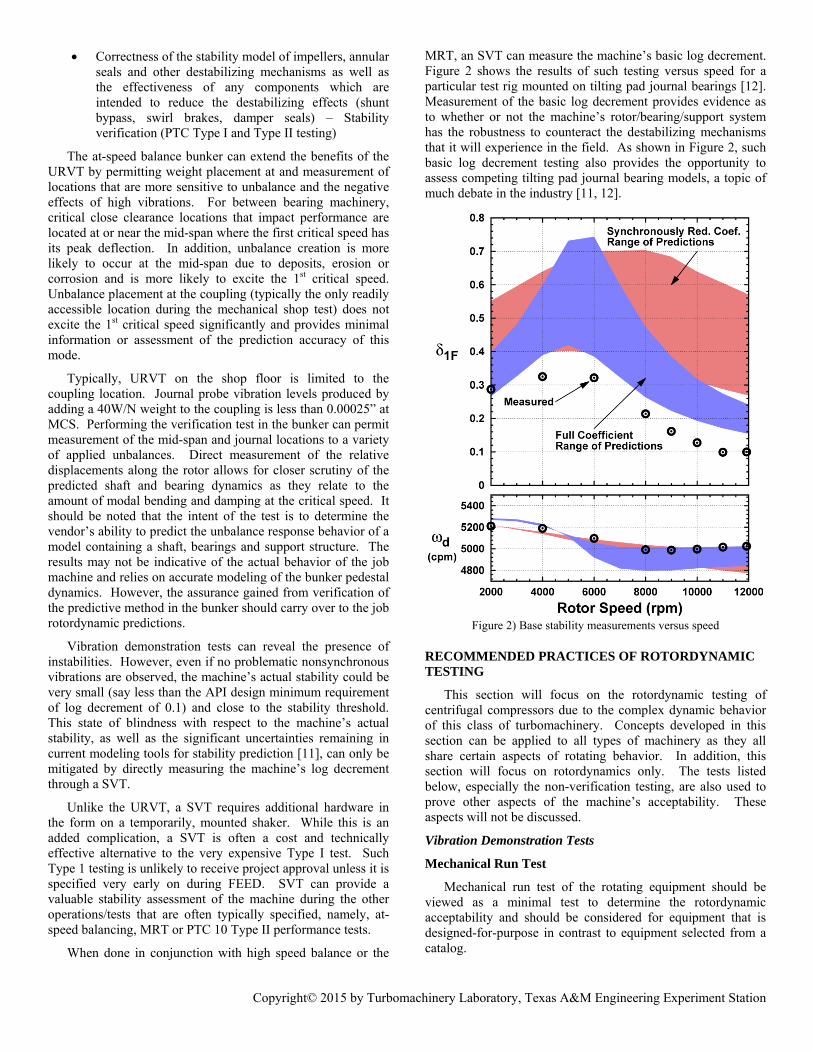
of equipment, Aw during a mehe rotordynam
ds/duration
parameters (
port configurati
on
he compressorwarm up porti10 minute in
of critical wing the warminutes followedcontinuous sperun.
ortion is includme to thermalld interferenceswarm up portio
at increasing t less energetie and project dbration levels peed. The 4 hons of the systee important facch parameter nmeter shows sse), the test sh
ed. If not, thour run, a coastdown is use
vior of the rotoas the baselin
ip speed durineral reasons. gal forces on d permit the rbalance state o
essary for triph these speeds . Finally, trial speeds occhat would othe
tdown/startup nning of the 4down followin
of the rotor nce state of thein diagnosing
Copyright
API standards echanical test.
mic behavior of
(temperature,
ion
r during the mion where thentervals carespeeds and
m up, operationd by a non-inteed. A coastd
ded to ensure thly expand grads between the on also permitsspeed intervalc stages poten
delays. Trip sp(and overall
hour run portioem. Bearing tectors to watch need to be reacsigns of continhould be extenthe test shouloastdown fromd to determineor/support systne for verifica
For the FLFP test, the procedure should be developed in concert with the rotordynamic analysis. The FLFP test is intended to study the stability of the centrifugal pressure under similar conditions to the field. By applying load and pressure, destabilizing forces of the seals and impeller/shroud interactions are introduced including seal clearance changes due to internal deflections as a result of reaching full pressure. Operating points during the FLFP test should be determined, in part, by the rotordynamic analysis and reflect operating points of minimum stability. These could represent operation at MCS near surge (highest differential pressure) or, in some cases, partial speed towards stonewall. Since this test as normally carried out is a “pass/fail” (e.g. the rotor is stable or not), test conditions should match as close as possible to the field conditions. The parameters of importance include gas MW, power, suction and discharge pressure and temperature, speed and mass flow. If the exact gas composition cannot be tested, some of these parameters will have to be compromised. The rotordynamic model should be used to determine an appropriate combination of factors to produce the maximum instability drivers or minimum log decrement. Miranda and de Noronha [17] propose modifications to the FLFP ASME Type I test to better assess the stability of centrifugal compression equipment. The modifications were intended to create conditions to submit the rotor to instability mechanisms as near as possible to the design conditions rather than reproduce similarity for performance evaluation. The conditions were developed with the aid of the rotordynamic stability predictions.
As with the Mechanical Test, the FLFP test should consist of a warm up portion where the speed is increased gradually to permit stabilization and examination of the behavior at lower speeds. This is followed by an extended run at MCS to ensure thermal equilibrium of the entire machine is achieved. During this test phase, it is recommended that the operating curve at MCS is explored from the surge control line to the end of curve (stonewall.) This operation may include four to five operating points and may include other speeds as highlighted by the rotordynamic analysis. (Note: Other factors may dictate operation at other points as required, i.e. defining the surge line vs. speed, rated point defined at partial speed.)
Factors such as lube oil conditions and rotor assembly are expected to meet the field configuration and specified operating ranges. When practical, the lube oil operating range should be explored during the FLFP test. Lube oil inlet conditions impact the dynamic behavior of bearings. As a critical factor in determining the rotordynamic behavior, it is important to vary these factors over the allowable ranges during testing.
Test Requirements
Test requirements for the FLFP test are defined by agreement between the vendor and purchaser prior to the test and should be done at the contract stage. Holding the overall vibration limit to the level specified for the mechanical run test is impractical due to the additional rotor forces present during the FLFP test. These include aerodynamic forces of the impellers, stator-rotor interactions, seals forces and power transmission forces. However, raising the limit to the vendor
recommended trip setting does not leave margin for off-design operation in the field nor deterioration of the balance state from erosion or deposits. An agreed level should take into account both factors and fall somewhere in between.
Other requirements for the rotor and case vibration may include:
Components of non-synchronous vibration to be less than 20% of the vibration limit or 0.2 mils p-p, whichever is less
No stall related vibration components
No instability related vibration (associated with re-excitation of the 1st natural frequency)
Deliverables are similar to the mechanical run test and should include data for all purchased components tested (as with the string test.) Increased emphasis is placed on the FFT plots of shaft vibration during the test as this is the best indicator of instability, stall, whirl and other phenomena that produce non-synchronous vibrations. Performance data should be recorded during the test to confirm the input used to predict the seal and impeller dynamic behavior and aide further stability analysis if needed.
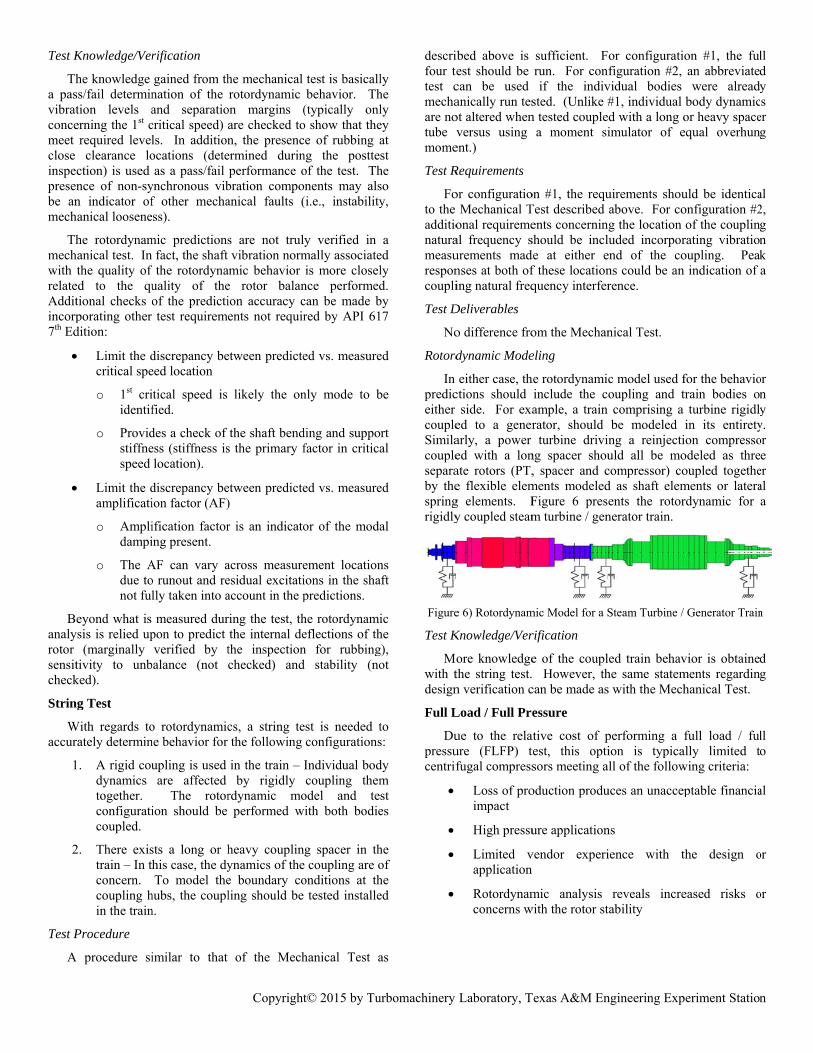
Rotordynamic Modeling
When FLFP testing is selected, the rotordynamic model should be expanded as necessary to conform to the Level II stability analysis requirements of API 617 [18]. Given the cost, effort and reasons to perform FLFP testing, a Level I stability analysis is insufficient to predict the behavior accurately. The Level II model will reflect changes in the stability level to MW, gas pressures and temperatures, seal clearances and rotor speed to the best of the vendor’s or purchaser’s analytic capabilities. The Level I model uses an empirical relationship that either estimates these effects or doesn’t take them into account at all when calculating the destabilizing forces present in the machine.
Test Knowledge / Verification
The FLFP test will reveal the presence of instability, stall or whirl for a prescribed set of operating conditions for the specific machine’s as-built conditions. The test is pass/fail as no measurement of the stability level or margin is included in the test as described. Rotor stability at different gas compositions, other clearances within the tolerance range or other operating points is determined by rotordynamic predictions. The ability to operate successfully at these alternate points, which cannot be tested under all combinations, depends on the stability margin (not measured by FLFP test) of the machine.
Such verification testing should be considered for the following types of equipment:
Special purpose (as defined by API)
Loss of production produces an unacceptable financial impact
Services or applications with a history of bad actors (vibration related)
Critical service (as defined by the user)
In addition, verification testing of either the unbalance response or stability should be considered when the rotordynamic analysis demonstrates concerns or higher risks associated with the application. The verification testing can be used to mitigate those risks when applied correctly.
Unbalance Response Verification Test (URVT)
Test Procedure
The URVT test is basically a comparison of measured versus predicted vibration levels for the application of a known unbalance. The test is routinely performed following the four hour mechanical run test. For compressors, the verification weight is applied to the coupling flange. This is the only practical location available. For other machinery (e.g., steam turbines, overhung single stage compressors), other locations may be available. Steam turbines may have field accessible balance planes and overhung compressors an impeller checknut with a balance weight placement provision. The measured response of the machine with the verification weight is compared against the analytical prediction using the same weight and location. While this is not a complete check of the analytic unbalance response accuracy, as it only compares the model’s prediction at the probe locations for one weight placement, it is an important first step in ensuring the accuracy of the model.
It was recognized early on that an important aspect of the URVT test was to compensate for the residual unbalance in the machine. This residual unbalance creates the synchronous vibration witnessed during the mechanical test run and is present before and after the verification weight is applied to the rotor. The residual unbalance left in a rotor after balancing (either low or at-speed balancing) is uncharacterized and, therefore, cannot be modeled. Thus, the analytical model will have only the verification weight as an excitation source for the response.
The initial attempt by API 617 6th Edition to compensate for the residual unbalance was to apply a significant verification weight to the coupling to raise the response to the vibration limit. The implication was that the majority of the response would be due to the verification weight placement. This had two important drawbacks (besides being analytically incorrect): First, the amount of unbalance weight at the coupling needed to raise the response to the vibration limit could reach unsafe levels. Coupling flanges are not designed with the intent of adding unbalance weight. Large rotating forces applied to the coupling had a chance of failing the flange or, more probably,
failing the mechanism used to hold the weight in place. Second, the method relied on larger vibration limits <0.002” p-p versus the current <0.001” p-p and good balance correction practices to limit synchronous response on the test stand below 0.0005” p-p. For this situation, 75% of the response would be attributable to the verification weight. At the time, this was better than no test at all.
In 1997, Nicholas et al. [19] defined an improved procedure to better correlate test stand vibrations to the analytic predictions. This methodology was subsequently adopted by API 617 7th Edition and is explained in API 684 [20]. Their method took advantage of vibration diagnostic equipment that permitted vector subtraction of recorded databases. The procedure can be summarized as:
1. Record the probe synchronous readings during coastdown from trip speed following the four hour mechanical run test – This represents the baseline vibration of the rotor
2. Add the verification weight to the rotor – The method is general enough to accommodate weight placement anywhere on the rotor
3. Bring the rotor back to MCS and achieve steady state conditions (i.e. constant bearing temperature, vibration magnitude and phase) – Attempt to reproduce the operating condition of the machine at the conclusion of the four hour test in step #1. The sampling frequency and speed increment should be identical to that used in Step #1.
4. Record the probe synchronous readings during coastdown from trip speed following Step #3 – This represents the combined vibration of the rotor (verification weight and residual unbalance)
5. Vectorially subtract the synchronous vibration database taken in Step #1 from that recorded in Step #4 – The resulting data represents the response due to the verification weight placement
6. Compare the resultant data in Step #5 to the analytical predictions (incorporating the range of bearing clearances and oil inlet temperatures) – This is the test for accuracy of the unbalance response predictions
Graphically (and using vector math) the method can be described as:
A baseline response reading, , (known) is taken at one speed and one probe and is attributed to the residual unbalance, , in the rotor (unknown).
The subsequent response, , (known) taken after the addition of the verification weight, , (known) to the rotor is recorded. The net unbalance present in the rotor at this stage can be described as .
This i
Figure
Arequirtempe
Opera
Aspeedspeedthe terotor balanweighand abunkepredicfor m
Performingfrom the The accomstate of demonstratonly to the
is shown on Fi
e 7) Determinati
All other aspecrements of theeratures, speed
ating Speed Ba
An option existsd balance bund balance bunkest floor. The that running in
nce bunker perht (i.e. mid-spadditional shafter permits adctions, i.e. mid
mid-span and qu
here is one rming the URort stiffness in hine. Often thical to the job
pad arc length the stiffness
ness of the pedhine. Bunker puate velocity m
ware. The sturate represeneen prediction
neous conclusiog bunker beariname inaccuracyn for URVT.
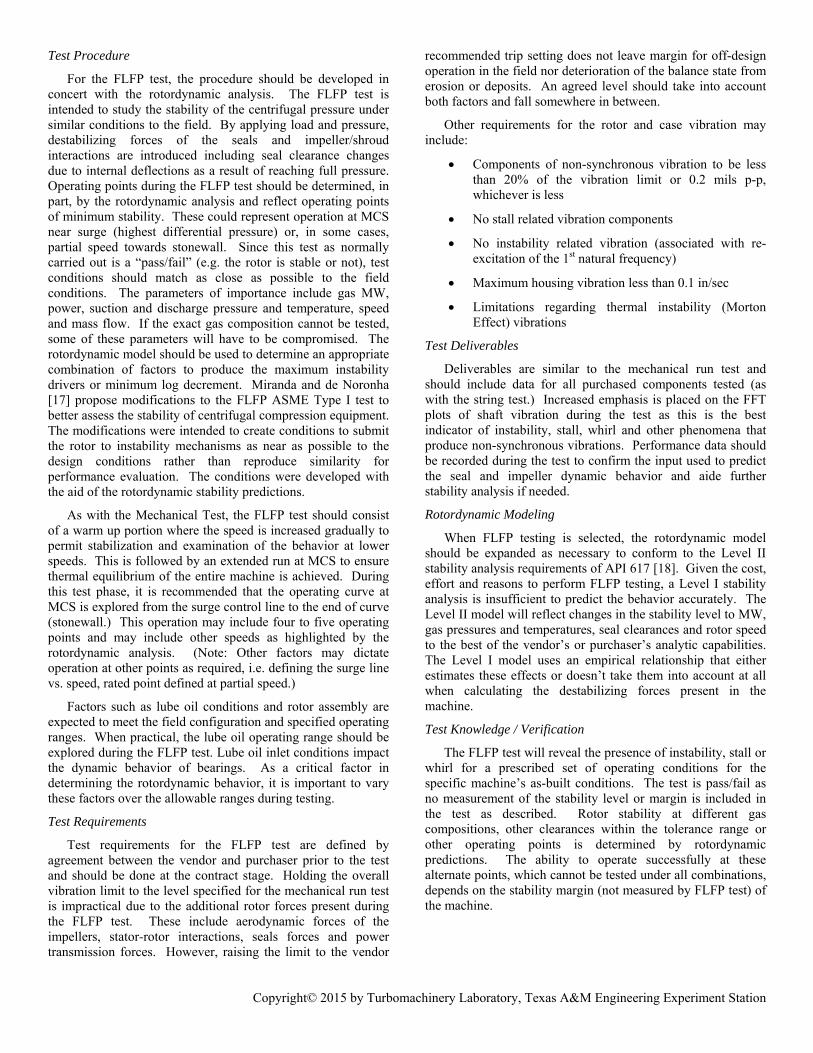
g the vector ssecond yields
mpanying vectthe rotor, tes that the r
e verification w
igure 7.
ion of Rotor Res
cts of the URe mechanical
ds and rotor sup
alance Bunker
s of where to pkers (also refkers) can be uadvantages aren the bunker prmits alternate pan, quarter-spt vibration readdditional verifd-span responsuarter-span wei
important coRVT test in th
the bunker wihe bunker beab bearings. Dand the existenand damping
destals will aledestals are int
measurements utiffness is a
ntation will prs and measureon that the modngs and pedesty. Table 1 pr
Copyright
subtraction of s the responsetor math with
esultant respoweight added to
sponse due to Ve
RVT should crun test in terpport.
Option
perform the URferred to as atused and has ae associated wipresents. The
locations for pan), use of mdings. The accfication of these relative to joight placement
omplexity whhe balance buill be differentarings, while sifferent clearance of a levitatg coefficients. lso be differentended to be flused in most b
function of roduce significements. This del of the job ctal stiffness) alesents the adv
what techniqueome techniqueg they are nonts are typicallmachine. Othe
a static structuror self-adjoinnot appropriat
hine create non
the fact that thts of significanjust solely th
ry close naturafy through thmodal densitster modes, onoften in clos
cs.
ximity of thesgram. Figure 1age centrifuga
chines, the firspeed increasetly less than th
e more and morer influence ose sisters. Thtropy is highlracteristics. Foor, the first sisteery sensitive tong gyroscopi
urbomachinery
on
he al e,
le
ic ng
es es ot ly er re
nt. te n-
he nt he al he ty ne se
se 13 al st s,
he re of he ly or er to ic
Tothe asforwarundersby thepeak nonsydirectiwhirlidampiphase and sspecia
Unappliesister the Sbehavmodescirculapeak imodesand, imode.
Laboratory, T
Figure
o date, many psumption that rd mode, is pstand why thise industry. Fir
in the frequynchronous excion with the ing mode. Anding estimationslope or mec
simple formulalist.
nfortunately, eed and only onbackward mod
SDOF dampinvior for a sims’ response canar excitation isis measured, ths are respondinin this case, b.
Texas A&M En
13) Example Ca
previous SVT only the mode
participating ins assumption rst, the measuruency responcitation was apintent of only
d finally, singln techniques, schanical log delas that are
even when fone peak is presde can be excing estimators.
mulated rotor sn be distinguishs being appliehe backward mng, instead of jbroadened, fro
ngineering Exp
ampbell Diagram
investigators e of interest, tyn the responsehas historicallrements often nse functions.pplied in the foy exciting thele degree of fresuch as ampliecrement, invofamiliar to e
orward circulasent in the meaited, reducing t Figure 14 system where hed. Even thou
ed and only a smode is excitedjust one, the p
om that due to
periment Station
m
have relied onypically the firse. It is easy toly been appliedonly show on. Second, thforward circulae first forwareedom (SDOFification factorolve convenienevery vibration
ar excitation iasurements, ththe accuracy oillustrates thithe individua
ugh the forwarsingle responsd. Because twoeak is distorteo just a singl
n
n st o d e e
ar d
F) r, nt n
is e
of is al d e o d e
Fi
Westimconsicomm
Badoptwill iown tto enrotordtestin
gure 14) Modal
While the methmation are stil
dered good munity, that hav
Multiple provide thdamping rabout a characteristechniquesfor stabilibackward measuremefrequency
To resolveMDOF teoutput (Mmultiple lo
Any candvalidated measuremefor shop tesystem whThis validasymmetrystability. Wsuch validthe model
ecause of the tion of estimaindependently trusted methodnd-users’ indedynamic pred
ng.
Participation froCircular Excit
hodologies assll evolving, th
practice in ve emerged as
degree of frhe most reliratio without
particular stics. To dats which have dity verificatioautoregression
ents, and the response funct
e the closely sechniques sho
MO) data sets ocations along t
didate estimausing sim
ents that folloesting but are
here the eigenvdation shouldy in the bearingWhile a simpledation, the mosof the machine
variability anation technique
verify the SVdologies. This ependent veridictions and
Copyright
om Nonsynchrontation [23]
ociated with Shere are seve
the systemrecommended
reedom (MDOiably accuraterelying on an
machine’s te, there are
demonstrated reon testing: mn for time doprediction err
tion measurem
spaced sister muld be applieconsisting of the rotor.
ation techniqumulated excow the method
taken from a values and stabd assess the g system and ve rotor system st preferable ce to be tested.
nd evolving naes, some end-uVT measuremepractice is dir
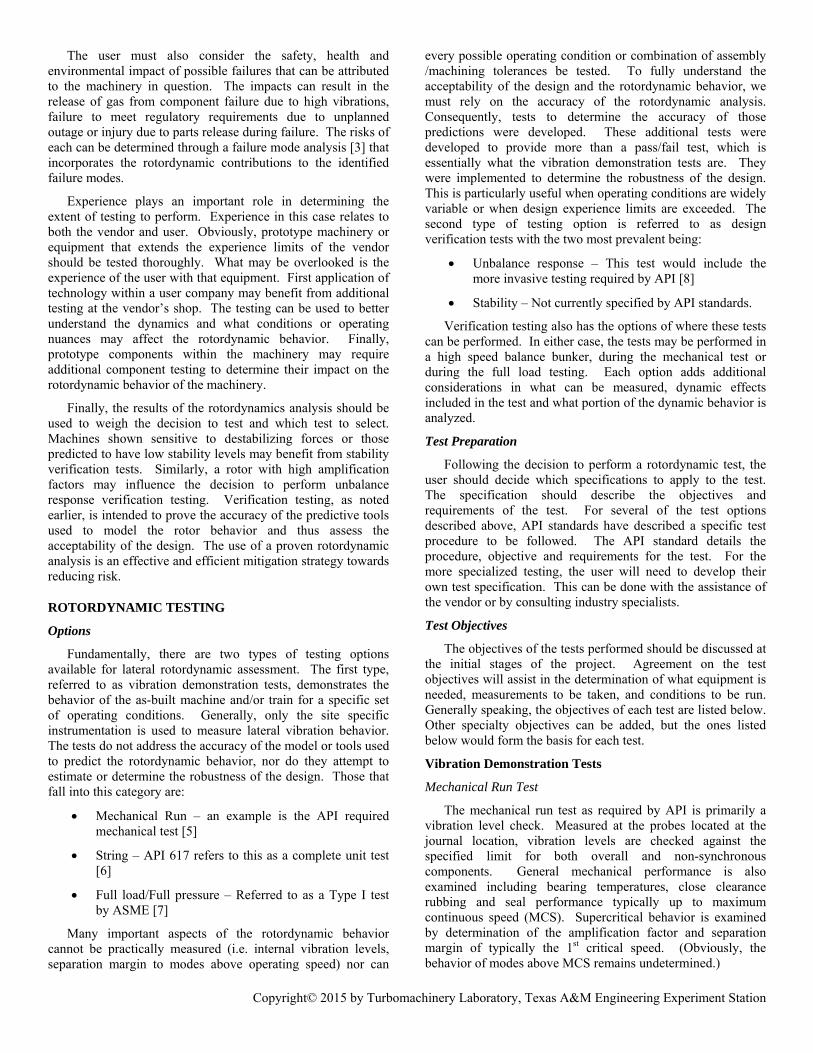
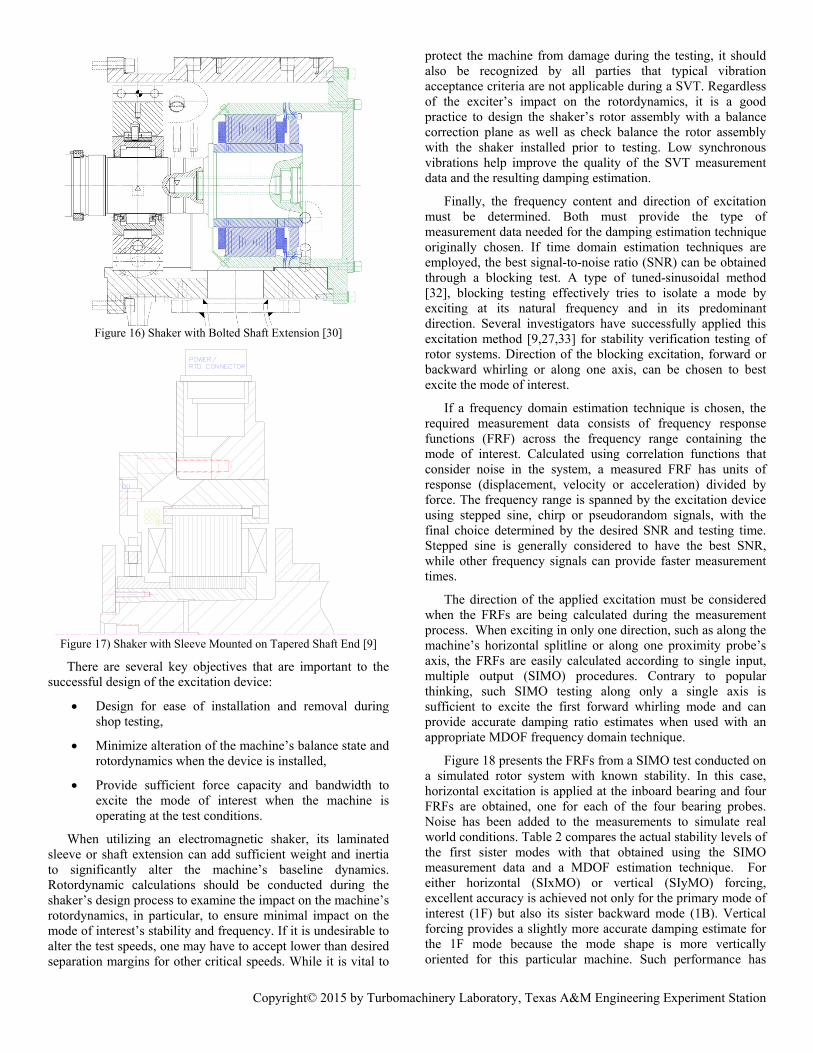
Figure 16) Shaker with Bolted Shaft Extension [30]
Figure 17) Shaker with Sleeve Mounted on Tapered Shaft End [9]
There are several key objectives that are important to the successful design of the excitation device:
Design for ease of installation and removal during shop testing,
Minimize alteration of the machine’s balance state and rotordynamics when the device is installed,
Provide sufficient force capacity and bandwidth to excite the mode of interest when the machine is operating at the test conditions.
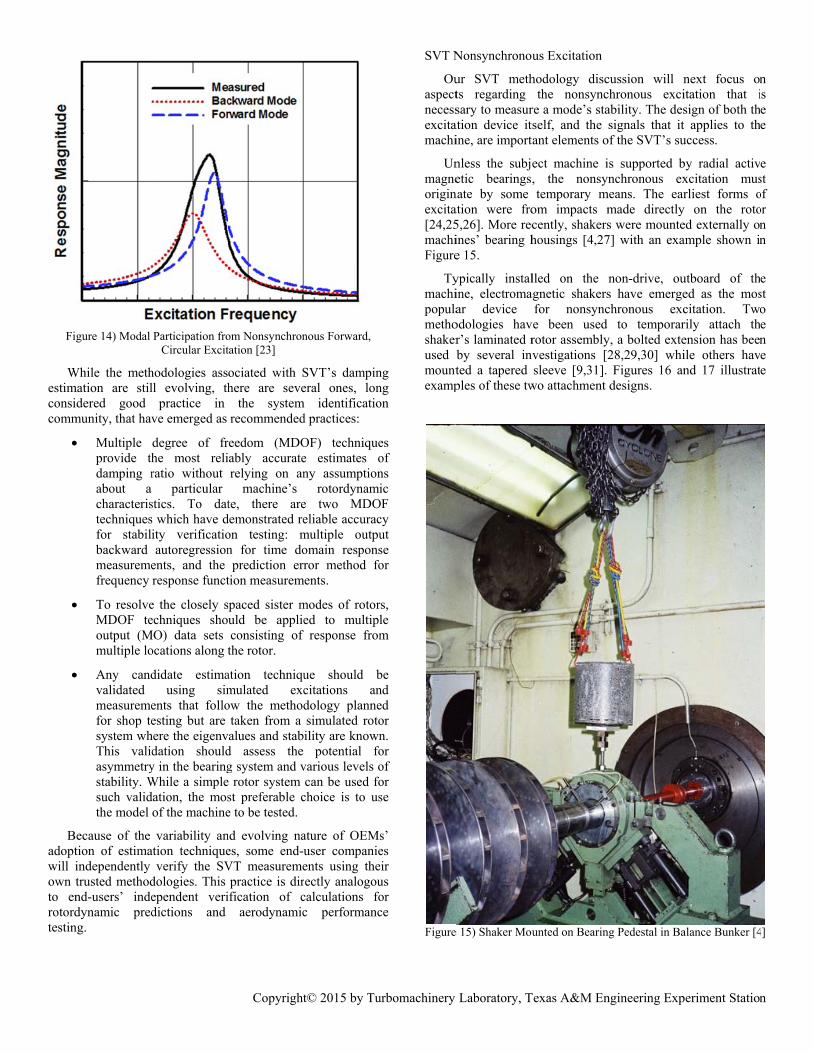
When utilizing an electromagnetic shaker, its laminated sleeve or shaft extension can add sufficient weight and inertia to significantly alter the machine’s baseline dynamics. Rotordynamic calculations should be conducted during the shaker’s design process to examine the impact on the machine’s rotordynamics, in particular, to ensure minimal impact on the mode of interest’s stability and frequency. If it is undesirable to alter the test speeds, one may have to accept lower than desired separation margins for other critical speeds. While it is vital to
protect the machine from damage during the testing, it should also be recognized by all parties that typical vibration acceptance criteria are not applicable during a SVT. Regardless of the exciter’s impact on the rotordynamics, it is a good practice to design the shaker’s rotor assembly with a balance correction plane as well as check balance the rotor assembly with the shaker installed prior to testing. Low synchronous vibrations help improve the quality of the SVT measurement data and the resulting damping estimation.
Finally, the frequency content and direction of excitation must be determined. Both must provide the type of measurement data needed for the damping estimation technique originally chosen. If time domain estimation techniques are employed, the best signal-to-noise ratio (SNR) can be obtained through a blocking test. A type of tuned-sinusoidal method [32], blocking testing effectively tries to isolate a mode by exciting at its natural frequency and in its predominant direction. Several investigators have successfully applied this excitation method [9,27,33] for stability verification testing of rotor systems. Direction of the blocking excitation, forward or backward whirling or along one axis, can be chosen to best excite the mode of interest.
If a frequency domain estimation technique is chosen, the required measurement data consists of frequency response functions (FRF) across the frequency range containing the mode of interest. Calculated using correlation functions that consider noise in the system, a measured FRF has units of response (displacement, velocity or acceleration) divided by force. The frequency range is spanned by the excitation device using stepped sine, chirp or pseudorandom signals, with the final choice determined by the desired SNR and testing time. Stepped sine is generally considered to have the best SNR, while other frequency signals can provide faster measurement times.
The direction of the applied excitation must be considered when the FRFs are being calculated during the measurement process. When exciting in only one direction, such as along the machine’s horizontal splitline or along one proximity probe’s axis, the FRFs are easily calculated according to single input, multiple output (SIMO) procedures. Contrary to popular thinking, such SIMO testing along only a single axis is sufficient to excite the first forward whirling mode and can provide accurate damping ratio estimates when used with an appropriate MDOF frequency domain technique.
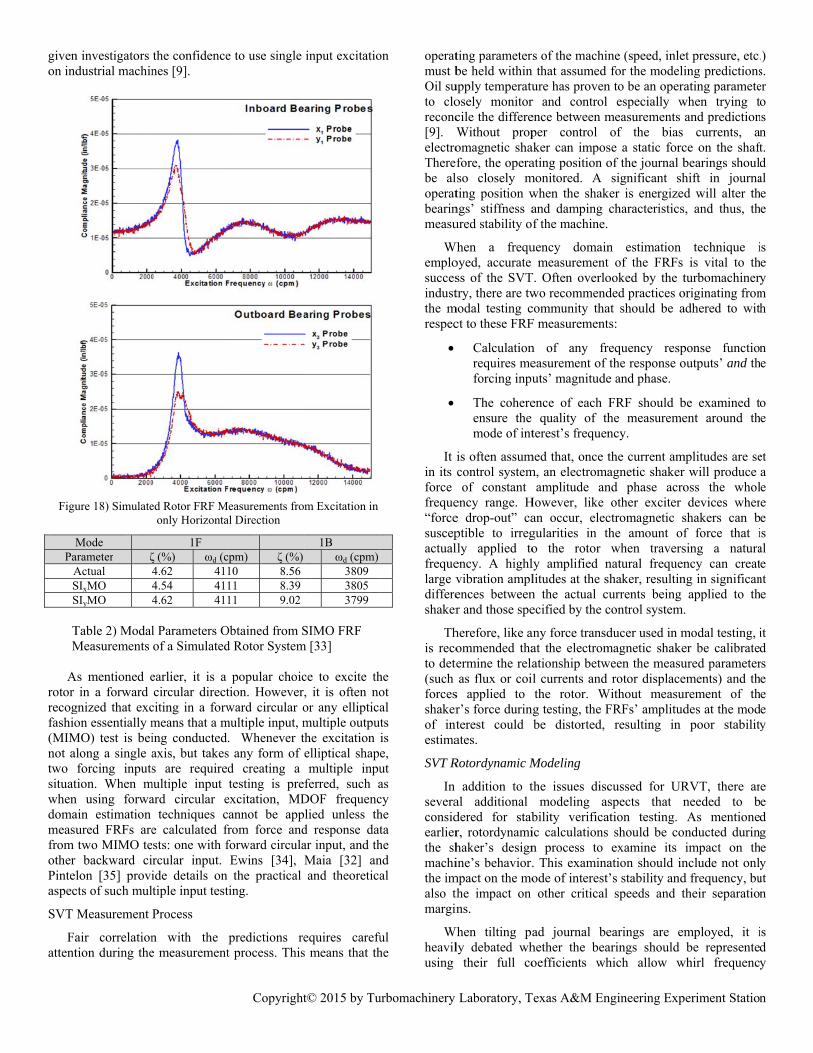
Figure 18 presents the FRFs from a SIMO test conducted on a simulated rotor system with known stability. In this case, horizontal excitation is applied at the inboard bearing and four FRFs are obtained, one for each of the four bearing probes. Noise has been added to the measurements to simulate real world conditions. Table 2 compares the actual stability levels of the first sister modes with that obtained using the SIMO measurement data and a MDOF estimation technique. For either horizontal (SIxMO) or vertical (SIyMO) forcing, excellent accuracy is achieved not only for the primary mode of interest (1F) but also its sister backward mode (1B). Vertical forcing provides a slightly more accurate damping estimate for the 1F mode because the mode shape is more vertically oriented for this particular machine. Such performance has
givenon ind
Figu
MPa
ASS TM
Arotor recogfashio(MIMnot altwo situatwhendomameasufrom other Pintelaspec
SVT
Faattent
n investigators dustrial machin
ure 18) Simulate
Mode arameter ζActual SIxMO SIyMO
Table 2) ModalMeasurements
As mentioned ein a forward
gnized that excon essentially m
MO) test is beilong a single aforcing inputs
tion. When mn using forwaain estimation ured FRFs aretwo MIMO tebackward ci
lon [35] provicts of such mul
Measurement
air correlationtion during the
the confidencenes [9].
ed Rotor FRF Monly Horizonta
1F ζ (%) ωd (c4.62 4114.54 4114.62 411
l Parameters Oof a Simulated
earlier, it is a circular direct
citing in a forwmeans that a ming conducted.axis, but takess are required
multiple input ard circular e
techniques ce calculated fr
ests: one with frcular input. ide details on tiple input test
Process
n with the e measurement
Copyright
e to use single
easurements froal Direction
cpm) ζ (%) 10 8.56 11 8.39 11 9.02
Obtained from Sd Rotor System
popular choiction. Howeverward circular o
multiple input, m. Whenever ts any form of d creating a testing is pre
excitation, MDannot be app
from force andforward circulaEwins [34], the practical
dependent stiffness and damping characteristics, or using the traditional, whirl frequency independent model of synchronously reduced coefficients [11,12]. Current API standards require the use of synchronously reduced coefficients for predictions. However, it is recommended that measurements should be correlated with predictions using both representations to help shed light on this ongoing debate. Comparing the correlations of the two representations is especially important for base stability testing when using bearings with center pivots and low (<0.4) pad preloads.
If an SVT is conducted as part of a performance test (e.g. PTC 10 type I or II), the measurements should be correlated with API Level II stability predictions that include the dynamics created by the machine’s internal seals and other components. Each manufacturer has its own methodology for how these internal dynamics are modeled and analyzed. As required by API Level II stability analysis procedures, this methodology should be explained and documented by the manufacturer.
SVT Deliverables
For each test condition, the predicted range of stability (log decrement and damped natural frequency) for the machine with, and without, the presence of the shaker device.
Description of the damping ratio estimation technique employed
Measured operating data for each stability test condition, such as:
o Speed
o Inlet and discharge pressure and temperatures
o Molecular weight
o Oil supply pressure, temperature, and flow rate
When stability estimates are obtained from outputs’ time transient data,
o Sampling frequency
o Number of transients events recorded
o For each output location and operating condition, plot showing the measured time transient data
When stability estimates are obtained from frequency response functions,
o Description and records of the calibration of the input force measurement
o Number of averages taken, window type and overlap percentage
o Frequency resolution
o For each input/output location and operating condition,
Plot showing the final measured FRF (magnitude and phase) and the identified FRF from the estimation technique
Plot showing the final measured coherence associated with the measured FRF
Comparison of the measured stability (log decrement and damped natural frequency) versus the predicted range for each tested operating condition
Depending on the specifics of the acceptance criteria, the resulting stability predictions from the corrected analytical model should presented to determine acceptability of the design.
SVT Requirements
Currently, there are no industrial standards in place for guidance on what acceptance criteria should be applied for this type of design verification testing. Individual OEMs and end-users are developing their own acceptance criteria in the meantime. It is recommended that the criteria should have a similar two-step evaluation process as that standardized for the URVT:
1. How well does the original rotordynamic model and analysis predict the measured stability results?
2. If the model has poor accuracy with respect to the measured stability results, does the machine still have acceptable rotordynamic performance over the full range of design/operation after its model has been corrected based on the test results?
When assessing the accuracy the stability measurements and predictions, there is a key difference with the correlations done during an URVT: the measured vibrational response should not be under-predicted for the URVT, while the measured log decrement should not be over-predicted in the SVT.
The exact methodology used to correct the model should be agreed upon, prior to testing, by the purchaser and OEM. Once again, this is another area where manufacturers and end-users are developing their own methodologies. Pettinato et al. [9] applied two methods to correct the model and determine acceptability of a particular centrifugal compressor design. One method applied a bias shift using the base stability measurements, while the second method applied a slope correction based on measurements that included aerodynamic excitations within the machine.
SVT Knowledge / Verification
Analogous to the knowledge obtained from the URVT, the stability verification test assesses the rotordynamic predictions’ accuracy to help verify a design’s stability characteristics beyond the pass/fail nature of the vibration demonstration tests. No nonsynchronous vibrations may be observed during a full load, full pressure test. However, the machine’s stability level (log decrement) and margin away from instability remain in question. For the selected test conditions, the SVT yields some insights by providing a measurement of the stability level and, using this measurement in conjunction with the predictions, an estimate of the machine’s stability threshold.
Since we cannot test every situation, we must rely on the accuracy of the model to design for these other situations. The SVT provides at least some verification concerning the reliability of the model’s stability predictions.
CONCLUSIONS
Rotordynamic testing is an effective and efficient tool, when applied appropriately, to mitigate machinery risks. The tutorial presented the basis for determining the machinery application risks. Test options available to address those risks, test procedures, preparation for the test, knowledge gained from each test and the testing benefits were discussed. The difference between vibration demonstration and design verification testing was highlighted. The principle difference being that vibration demonstration tests assess the acceptability of rotordynamic behavior in a pass/fail mode while design verification testing is used to confirm the rotordynamic predictions. This verification provides confidence in extrapolating the design (by the vendor) and operation (by the purchaser) beyond the machine’s as-built and specific shop test conditions. The recommended practices of performing the test options for vibration demonstration and verification testing concluded the tutorial.
REFERENCES
1. C. Jackson, “Shop Testing – Is It Worth It?,” Orbit Magazine, June 1998, pp. 10-15.
2. J. Heagney, “Fundamentals of Project Management,” AMACON, 2011.
3. C. Carlson, “Effective FMEA’s: Achieving Safe, Reliable, and Economical Products and Processes Using Failure Mode and Effects Analysis,” John Wiley & Sons, Inc., 2012.
4. K. E. Atkins and R. X. Perez, “Assessing Rotor Stability Using Practical Test Procedures,” Proceedings of the Twenty-First Turbomachinery Symposium, Texas A&M University, pp. 151-158, 1992.
5. “Axial and Centrifugal Compressors and Expander-Compressors for Petroleum, Chemical and gas Industry Services,” API Standard 617 7th Edition, July 2002, Chapter 2, Paragraph 4.3.1.
6. “Axial and Centrifugal Compressors and Expander-Compressors for Petroleum, Chemical and gas Industry Services,” API Standard 617 7th Edition, July 2002, Chapter 2, Paragraph 4.3.3.2.
7. “Performance Test Code on Compressors and Expanders,” ASME, PTC 10-1997, Paragraph 3.2.1, p. 11.
8. “Axial and Centrifugal Compressors and Expander-Compressors for Petroleum, Chemical and gas Industry Services,” API Standard 617 7th Edition, July 2002, Chapter 1, Paragraphs 2.6.3 & 2.6.4.
9. B. C. Pettinato, C. H. Cloud and R. S. Campos, “Shop Acceptance Testing of Compressor Rotordynamic Stability and Theoretical Correlation,” Proceedings of the 39th Turbomachinery Symposium, 2010, pp. 31-42.
10. “API Standard Paragraphs Rotordynamic Tutorial: Lateral Critical Speeds, Unbalance Response, Stability, Train Torsionals and Rotor Balancing,” API Recommended Practice 684 2nd Edition, August 2005, Paragraph 2.3.8.
11. J. A. Kocur, J. C. Nicholas and C. C. Lee, “Surveying Tilting Pad Journal Bearing and Gas Labyrinth Seal Coefficients and Their Effects on Rotor Stability,” Proceedings of the Thirty-Sixth Turbomachinery Symposium, Texas A&M University, pp. 1-10, 2007.
12. C. H. Cloud, E. H. Maslen and L. E. Barrett, “Rotor Stability Estimation with Competing Tilting Pad Bearing Models,” Mechanical Systems and Signal Processing, Vol. 29, pp. 90-106, May 2012.
13. “Axial and Centrifugal Compressors and Expander-Compressors for Petroleum, Chemical and gas Industry Services,” API Standard 617 7th Edition, July 2002, Chapter 1, Paragraph 2.6.8.8.
14. “API Standard Paragraphs Rotordynamic Tutorial: Lateral Critical Speeds, Unbalance Response, Stability, Train Torsionals and Rotor Balancing,” API Recommended Practice 684 2nd Edition, August 2005, Sec 2.7.3, pp. 2-63 to 2-68 and Sec. 3.5.2, pp. 3-38 to 3-43.
15. “Axial and Centrifugal Compressors and Expander-Compressors for Petroleum, Chemical and gas Industry Services,” API Standard 617 7th Edition, July 2002, Chapter 1, Paragraph 2.6.2.10.
16. “Axial and Centrifugal Compressors and Expander-Compressors for Petroleum, Chemical and gas Industry Services,” API Standard 617 7th Edition, July 2002, Chapter 1, Paragraph 2.6.2.11.
17. M. A. Miranda and R. F. de Noronha, “ASME PTC 10 Modified Test for Mechanical Assessment of Centrifugal Compressors,” Proceedings of the Thirty-Sixth Turbomachinery Symposium, Texas A&M University, 2007, pp. 87-93.
18. “Axial and Centrifugal Compressors and Expander-Compressors for Petroleum, Chemical and gas Industry Services,” API Standard 617 7th Edition, July 2002, Chapter 1, Paragraph 2.6.2.11.
19. J. C. Nicholas, S. L. Edney, J. A. Kocur and J. F. Hustak, “Subtracting Residual Unbalance for Improved Test Stand Vibration Correlation,” Proceedings of the Twenty-Sixth Turbomachinery Symposium, Texas A&M University, 1997, pp. 7-18.
20. “API Standard Paragraphs Rotordynamic Tutorial: Lateral Critical Speeds, Unbalance Response, Stability, Train Torsionals and Rotor Balancing,” API Recommended Practice 684 2nd Edition, August 2005, Sec 2.9, pp. 2-97 to 2-104.
21. Nordmann, R., 1982, “Modal parameter identification and sensitivity analysis in rotating machinery,” Proceedings of Conference on Rotordynamic Problems in Power Plants, IFToMM, pp. 95-102.
22. Nordmann, R., 1984, “Identification of modal parameters of an elastic rotor with oil film bearings,” ASME Journal of Vibration, Acoustics, Stress , and Reliability in Design, Vol. 106, pp. 107-112.
23. Cloud, C. H., Maslen, E. H., and Barrett, L. E., 2009, “Damping ratio estimation techniques for rotordynamic stability measurements,” ASME Journal of Engineering for Gas Turbines and Power, Vol. 131, No. 1, January, pp. 012504.
24. Newkirk, B. L., 1924, “Shaft Whipping,” General Electric Review, Vol. 27, March, pp. 169-178.
25. Newkirk, B. L. and Lewis, J. F., 1956, “Oil film whirl—An investigation of disturbances due to oil films in journal bearings,” Transactions of the ASME, Vol. 78, pp. 21-27.
26. Hagg, A. C., 1946, “The influence of oil-film journal bearings on the stability of rotating machines,” ASME Transactions, Journal of Applied Mechanics, Vol. 68, pp. A211-A220.
27. Kanki, H., Fujii, H., Hizume, A., Ichimura, T., and Yamamoto, T., 1986, “Solving nonsynchronous vibration problems of large rotating machineries by exciting test in actual operating condition,” Proceedings of the International Conference on Rotordynamics, IFToMM, pp. 221-225.
28. Baumann, U., 1999, “Rotordynamic stability tests on high-pressure radial compressors,” Proceedings of the Twenty-Eighth Turbomachinery Symposium, Texas A&M University, pp. 115-122.
29. Moore, J. J., Walker, S. T., and Kuzdzal, M. J., 2002, “Rotordynamic stability measurement during full-load full-pressure testing of a 6000 psi re-injection centrifugal compressor,” Proceedings of the Thirty-First Turbomachinery Symposium, Texas A&M University, pp. 29-38.
30. Bidaut, Y., Baumann, U., and Al-Harthy, S. M. H., 2009, “Rotordynamic stability of a 9500 psi reinjection centrifugal compressor equipped with a hole pattern seal—measurement versus prediction taking into account the operational boundary conditions,” Proceedings of the Thirty-Eighth Turbomachinery Symposium, Texas A&M University, pp. 251-259.
31. Takahashi, N., Magara, Y., Narita, M., and Miura, H., 2012, “Rotordynamic evaluation of centrifugal compressor using electromagnetic exciter,” ASME Journal of Engineering for Gas Turbines and Power, Vol. 134, pp. 032505.
32. Maia, N. M. M. and Silva, J. M. M., eds., 1997, Theoretical and Experimental Modal Analysis, Research Studies Press Ltd..
33. Cloud, C. H., 2007, Stability of Rotors Supported by Tilting Pad Journal Bearings, PhD dissertation, University of Virginia.
34. Ewins, D. J., 2000, Modal Testing: Theory, Practice and Application, Research Studies Press Ltd., 2nd Edition.
35. Pintelon, R. and Schoukens, J., 2001, System Identification: A Frequency Domain Approach, IEEE Press.
ACKNOWLEDGEMENTS
The authors wish to thank ExxonMobil for its’ support and Jim Byrne, Minhui He, Eric Maslen and José Vázquez from BRG for their helpful suggestions.