56
3 rd Regional Competitiveness Committees Meeting Best Western Hotel Cebu City 1
3rd Regional Competitiveness Committees Meeting
Best Western HotelCebu City
1

WORLD ECONOMIC FORUM:GLOBAL COMPETITIVENESS REPORT2014 -‐2015
2

90
100Percentile Rank
Upper 1/3
Middle 1/3
Bottom 1/3
2016
GLOBAL COMPETITIVENESS REPORT1994 -‐ 2015
3

GLOBAL COMPETITIVENESS REPORT CARD
***As of September 2014
REPORT 2015 RANK
2014RANK
2013RANK CHANGE ASEAN
RANK TOP 1/3
WEF -Global Competitiveness Report 47/140 52/144 59/148 ↑ 5 5 of 9 47
IFC- Ease of Doing Business Oct 2015 95/189* 108/189** ↑ 13 5 of 10 63TI - Corruption Perception Index Dec 2015 85/175 94/177 ↑ 9 3 of 9 58HF - Economic Freedom Index 76/178 89/178 97/177 ↑ 13 5 of 9 59WEF- Global Information Technology Report 76/143 78/148 86/144 ↑ 2 5 of 9 48
WEF - Travel and Tourism Report 74/141 n/a 82/140 ↑ 8 5 of 7 46WEF - Global Enabling Trade Index Mar 2015 64/138 n/a ↑ 8 6 of 10 46
IMD -World Competitiveness Report 41/60 42/60 38/60 ↑ 1 4 of 5 20
WIPO - Global Innovation Index 83/141 100/143 90/142 ↑ 17 6 of 8 47WB - Logistics Performance Index Mar 2015 57/160 n/a ↓ 5 6 of 9 53FFP - Fragile States Index *** 48/178 52/178 59/178 ↓ 4 8 of 10 118WEF - Global Gender Gap Report Oct 2015 9/142 5/136 ↓ 4 1 of 9 47*Ranking based on the 2015 Doing Business Report**Ranking based on the 2014 Doing Business Report***Reverse ranking (1 as worst) – Fragile States Index
4

Country/Economy 2015 (out of 140)
2014 (out of 144)
2013 (out of 148)
2012 (out of 144)
2011 (out of 142)
2010(Out of 139)
Change 2014-‐2015
Change in 4 Years
2010-‐2015
Singapore 2 2 2 2 2 3 0 1
Malaysia 18 20 24 25 21 26 2 8
Thailand 32 31 37 38 39 38 -‐1 6
Indonesia 37 34 38 50 46 44 -‐3 7
Philippines 47 52 59 65 75 85 5 38
Vietnam 56 68 70 75 65 59 12 3
Lao PDR 83 93 81 n/a n/a n/a 10 n/a
Cambodia 90 95 88 85 97 109 5 19
Myanmar 131 134 139 n/a n/a n/a 3 n/a
Brunei Darussalam n/a n/a 26 28 28 28 n/a n/a
GLOBAL COMPETITIVENESS REPORTPHILIPPINES and ASEAN
*Brunei Darussalam is not included in the 2015 Ranking5

RED – bottom 20% PURPLE – bottom 40-‐21% GREEN– bottom 50 – 41% BLACK – 49% or higher
PHILIPPINE RANKINGS PILLARS (2010-‐2015)
INDICATORS (2015) 0F 140
(2014) 0F 144
(2013) 0F 148
(2012) 0F 144
(2011) 0F 142
(2010) OF 139
CHANGE 2014-‐2015
CHANGE 2010-‐2015
OVER-‐ALL RANKING 47 52 59 65 75 85 ↑ 5 381st pillar: Institutions 77 67 79 94 117 125 ↓ 10 482nd pillar: Infrastructure 90 91 96 98 105 104 ↑ 1 143rd pillar: Macroeconomic environment 24 26 40 36 54 68 ↑ 2 444th pillar: Health and primary education 86 92 96 98 92 90 ↑ 6 45th pillar: Higher education and training 63 64 67 64 71 73 ↑ 1 10
6th pillar: Goods market efficiency 80 70 82 86 88 97 ↓ 10 17
7th pillar: Labor market efficiency 82 91 100 103 113 111 ↑ 9 29
8th pillar: Financial market development 48 49 48 58 71 75 ↑ 1 279th pillar: Technological readiness 68 69 77 79 83 95 ↑ 1 2710th pillar: Market size 30 35 33 35 36 37 ↑ 5 711th pillar: Business sophistication 42 46 49 49 57 60 ↑ 4 1812th pillar: Innovation 48 52 69 94 108 111 ↑ 4 63
6

PHILIPPINE ECONOMIC PROFILEMOST PROBLEMATIC FACTORS FOR DOING BUSINESS
WEF-‐GCI 2015 REPORT
2014 2015
7
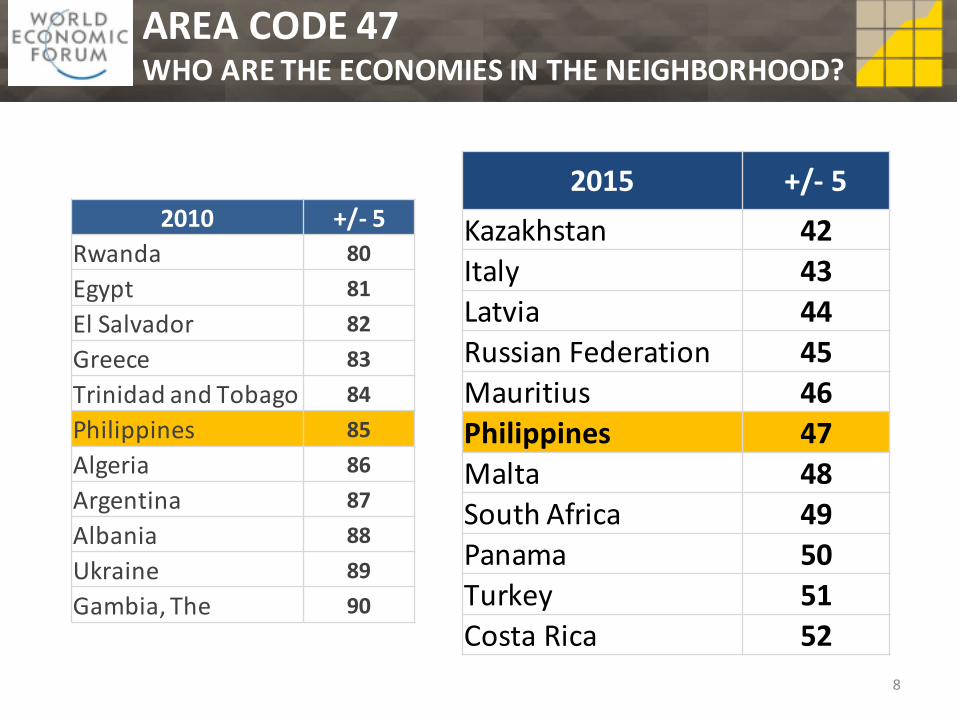
AREA CODE 47WHO ARE THE ECONOMIES IN THE NEIGHBORHOOD?
2015 +/-‐ 5Kazakhstan 42Italy 43Latvia 44Russian Federation 45Mauritius 46Philippines 47Malta 48South Africa 49Panama 50Turkey 51Costa Rica 52
2010 +/-‐ 5Rwanda 80Egypt 81El Salvador 82Greece 83Trinidad and Tobago 84Philippines 85Algeria 86Argentina 87Albania 88Ukraine 89Gambia, The 90
8

Cities and Municipalities Competitiveness Index
9

ABOUT THE RCCs
10

ABOUT THE RCCs
11

ABOUT THE CMCI
12

ABOUT THE CMCI
USES OF THE INDEX
13

ABOUT THE CMCI
FRAMEWORK
14
CMCI 2015
15

16

RANKING CATEGORIES

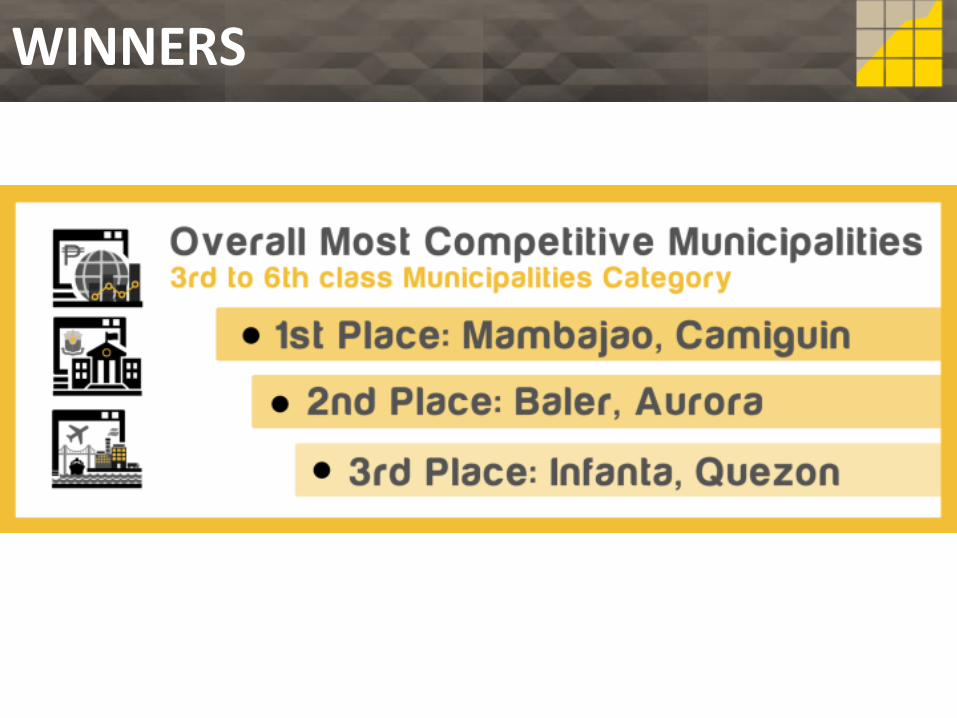
WINNERS

WINNERS
HIGHLIGHTS OF THE SUMMITWINNERS

HIGHLIGHTS OF THE SUMMITHIGHLIGHTS OF THE SUMMITWINNERS

HIGHLIGHTS OF THE SUMMITWINNERS
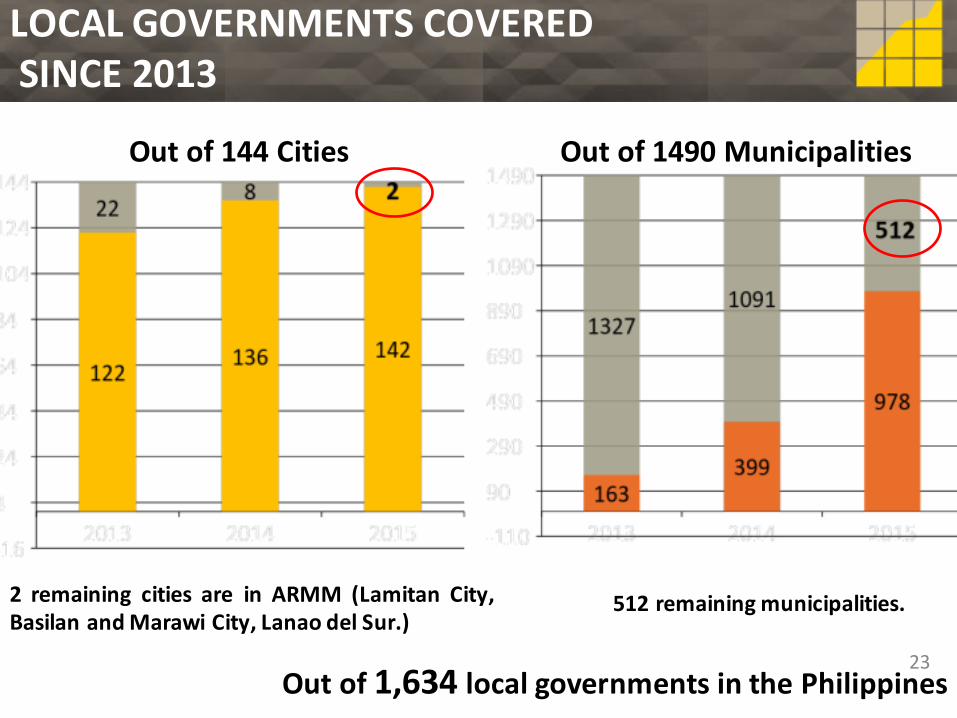
LOCAL GOVERNMENTS COVEREDSINCE 2013
Out of 1,634 local governments in the Philippines
Out of 144 Cities Out of 1490 Municipalities
2 remaining cities are in ARMM (Lamitan City,Basilan andMarawi City, Lanao del Sur.)
512 remaining municipalities.
23

is the total number of data points filled over thetotal number of data points required.
2015 TARGETS VS TOTAL LGUS COVERED
24

is the total number of data points filled over thetotal number of data points required.
TOTAL LGUS COVERED
25

is the total number of data points filled over thetotal number of data points required.
PILLARSINDICATORS SUB-INDICATORS TOTAL NUMBER OF INPUTS
2013 2014 2015 2013 2014 2015 2013 2014 2015
1 Economic Dynamism 9 8 8 21 33 33 46 107 107
2 Government Efficiency 8 10 10 33 43 43 45 104 104
3 Infrastructure 10 10 10 18 61 61 18 137 137
TOTAL 27 28 28 72 137 137 109 348 348
TOTAL NUMBER OF INPUTS REQUIRED FOR 2013, 2014, and 2015
Inputs-‐ refer to the number of data points/ cells required to be filled under each pillar.Example for Economic Dynamism:Indicator : (Total Annual Business Registrations)Sub-‐indicators : (# of new business registrations, # of renewals)Inputs : (Total annual count : 2011, 2012, 2013, Jan-‐March 2013, Jan-‐March 2014)
26
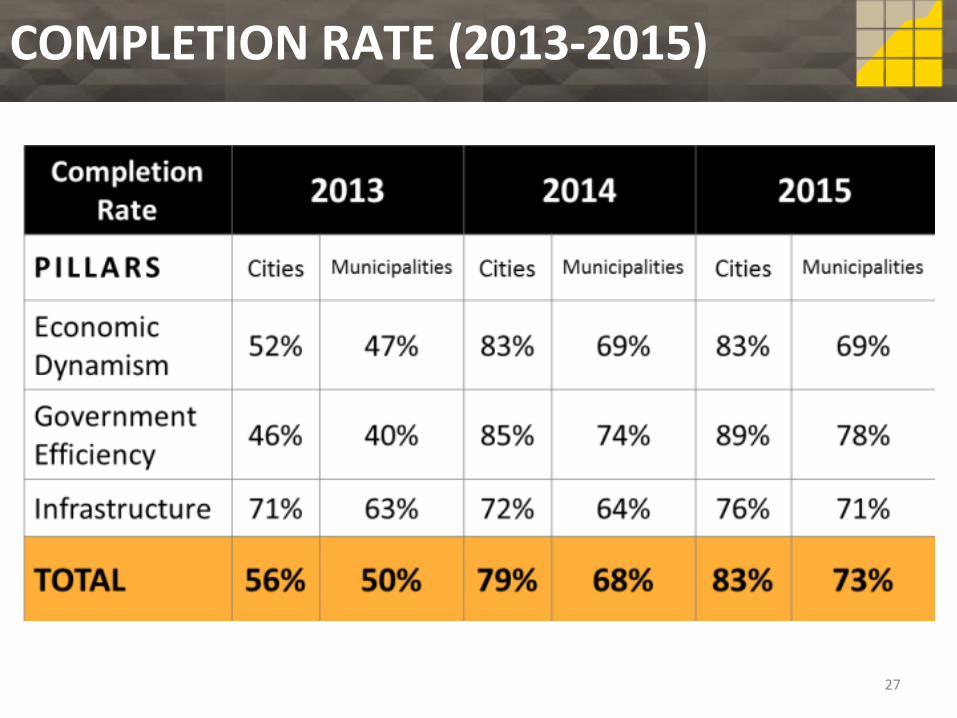
COMPLETION RATE (2013-‐2015)
27

COMPLETION RATE (2013-‐2015)
28

COMPLETION RATE: ECONOMIC DYNAMISM
29

COMPLETION RATE: GOVERNMENT EFFICIENCY
30

COMPLETION RATE: INFRASTRUCTURE
31

is the total number of data points filled over thetotal number of data points required.
COMPLETION RATE: REGIONAL AVERAGE
32
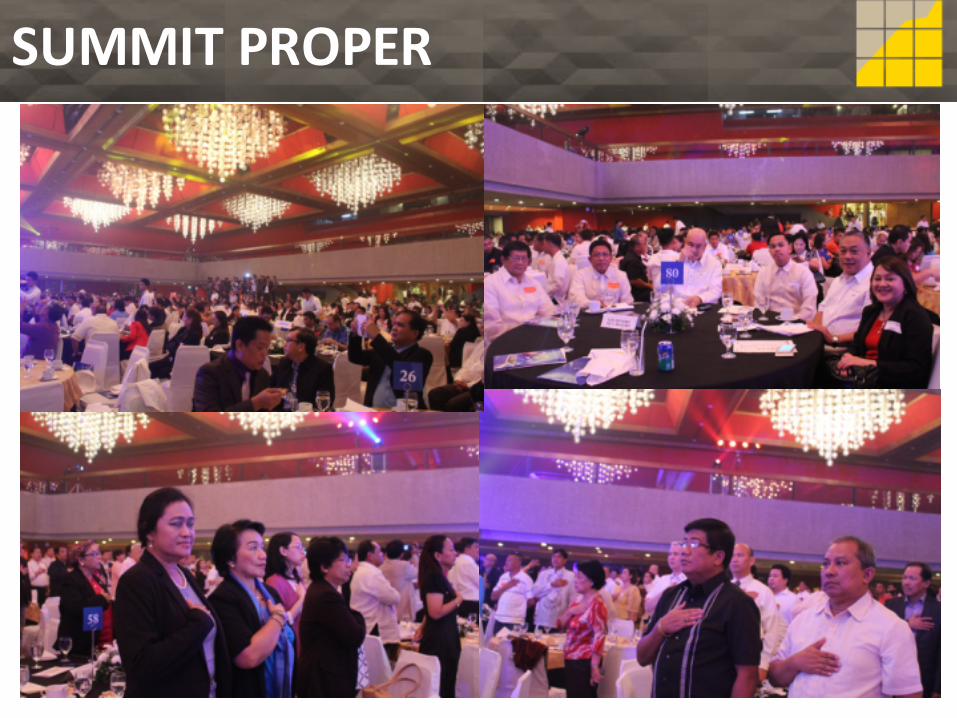
HIGHLIGHTS OF THE SUMMITSUMMIT PROPER
HIGHLIGHTS OF THE SUMMITSUMMIT PROPER
34

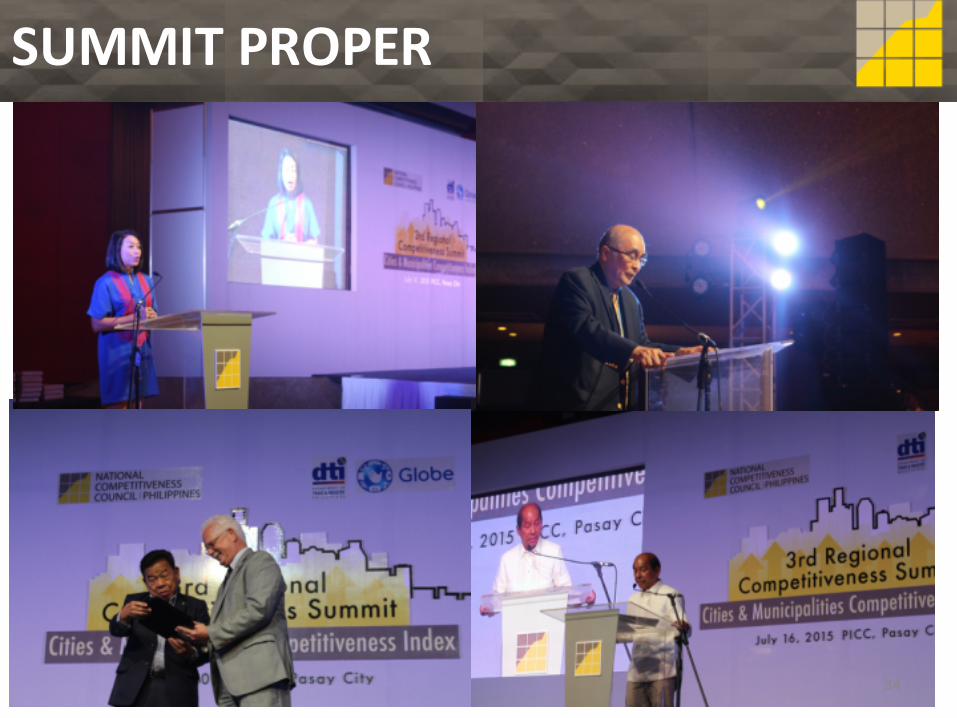
SUMMIT PROPER
35

SUMMIT PROPER
36

MEDIA PICK-‐UPS
37

MEDIA PICK-‐UPS
AND MANY MORE! 38
MEDIA PICK-‐UPS
FACEBOOK Insights(July)3951 Engaged users54481 Total Reach
NCC Site (July)48,794 pageviews
39

CMCI 2016
40

DATA CAPTURE SHEET
41
Refer to the Local Data Capture Sheet for the list of CMCI Indicators
REVIEW OF INDICATORS
42

REVIEW OF INDICATORS• New Indicators to replace LGPMS scores onTransparency and Economic Governance.
1. Compliance to BPLS Standards (Yes and Noper Standard -‐ Steps, Days, Signatories,Form)
2. Seal of Good Local Governance
3. Number of Social Welfare Developmentand Environmental Protection RelatedPrograms. (Sponsored by the LGU,Sponsored by Private Institutions.) 43

REVIEW OF INDICATORS
• New Indicators to replace LGPMS scores onTransparency and Economic Governance.
4. Number of EGov services offered
5. Compliance to COA Rules
6. Number of Annual Local DirectivesImplemented
44
ISSUES
•Review of validation guidelines forRCCs/Academe and NCC Validators.
1. Allowing the use of N/A for data inputswhich are not applicable to the LGU.
(ex. Number of passenger bancas are not applicable toland-‐locked areas.)
2. Differentiate Zero from NDA?(ex. For Cost of water Zero means free, so all Zeros needto be validated if its free or it means that there is no dataavailable (NDA) )
45

ISSUES
• Need for updated data from differentgovernment agencies. (BSP-‐Banks andFinancial institutions, NSCB-‐Population, DOF-‐BLGF, DILG-‐LGPMS data.)
• 2014 BLGS data on tax collections and LGUrevenues and 2013 LGPMS data are notuploaded on the website .
46

ISSUES
Inclusion of scores of Big Cities in the processing of Provincial Scores. -‐-‐ Big Cities are not politically attached to the provinces (ex. Iloilo City, Cagayan de Oro City, Cebu City and Davao City.)
47

ISSUES
• Negros Island Region a New region?–Declaration of the new region (May 29, 2015) falls beyond the data collection period (February to April, 2015).
• Inclusion of DILG representatives in the RCC.•RCC Summit schedule for 2016 – Pre or Post Election
48
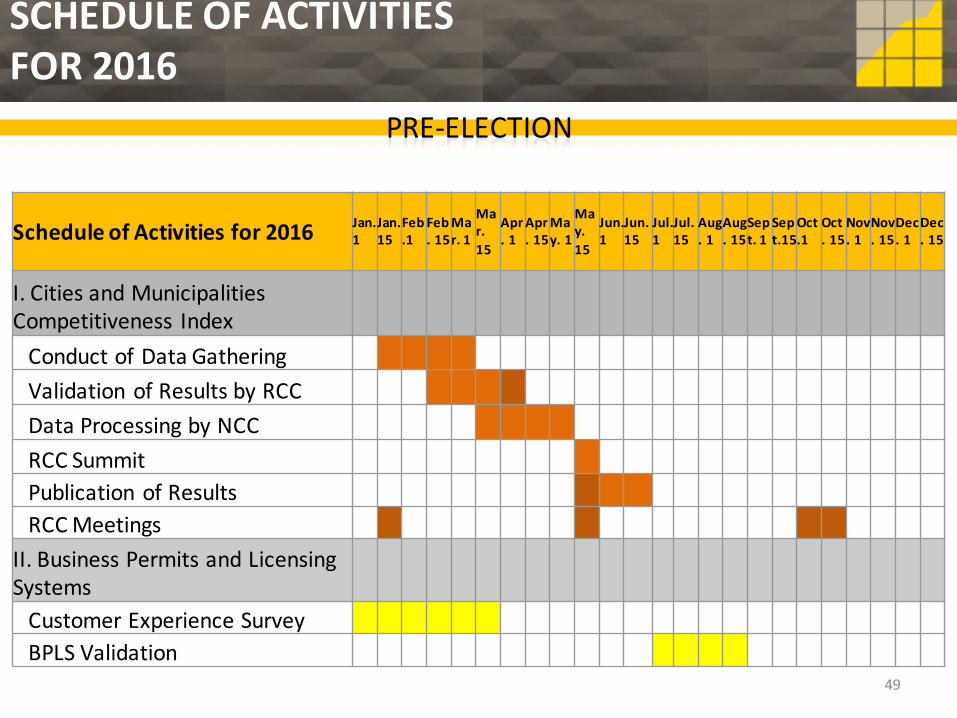
SCHEDULE OF ACTIVITIES FOR 2016
PRE-‐ELECTION
Schedule of Activities for 2016 Jan. 1
Jan. 15
Feb.1
Feb. 15
Mar. 1
Mar. 15
Apr. 1
Apr. 15
May. 1
May. 15
Jun.1
Jun. 15
Jul. 1
Jul. 15
Aug. 1
Aug. 15
Sept. 1
Sept.15
Oct.1
Oct. 15
Nov. 1
Nov. 15
Dec. 1
Dec. 15
I. Cities and Municipalities Competitiveness IndexConduct of Data GatheringValidation of Results by RCCData Processing by NCCRCC SummitPublication of ResultsRCC Meetings
II. Business Permits and Licensing SystemsCustomer Experience SurveyBPLS Validation
49

SCHEDULE OF ACTIVITIES FOR 2016
POST ELECTION
Schedule of Activities for 2016 Jan. 1
Jan. 15
Feb.1
Feb. 15
Mar. 1
Mar. 15
Apr. 1
Apr. 15
May. 1
May. 15
Jun.1
Jun. 15
Jul. 1
Jul. 15
Aug. 1
Aug. 15
Sept. 1
Sept.15
Oct.1
Oct. 15
Nov. 1
Nov. 15
Dec. 1
Dec. 15
I. Cities and Municipalities Competitiveness IndexConduct of Data GatheringValidation of Results by RCCData Processing by NCCRCC SummitPublication of ResultsRCC Meetings
II. Business Permits and Licensing SystemsCustomer Experience SurveyBPLS Validation
Same as last year50
• Standard Look for Certificates / Plaques • Limit on the number of LGUs to be recognized?
RCCs to share what happened during their respective regional
awarding ceremonies (e.g. Reg. 1, Reg. 4B and Reg. 12).
ISSUES
REGIONAL AWARDING
51

OTHER MATTERS
52

• Submission of Fund Utilization Report•Post-‐terminal Report on the CMCI (c/o Academe)• Submission of updated RCC directory
OTHER MATTERS
53

NEXT RCC MEETING:
• Location?•Regional Host?•Date?
MOVING FORWARD
54
RCC TOUR, October 15, 2015Assembly Time 7:30am, Hotel LobbyPlaces to Visit:• Cebu Metropolitan Cathedral• Basilica Minoredele Sto. Niño•Magellan’s Cross• Plaza Independencia• Fort San Pedro• South Road Properties (Desalination Plant)
MOVING FORWARD
55


