Page 1
1
Title: Resection of the large bowel suppresses hunger, food intake and modulates
gastrointestinal fermentation
Priyadarshika Hettiarachchi1*
, A. Rajitha Wickremasinghe2, Gary S. Frost
3, Kemal I.
Deen4, Ajith A. Pathirana
5, Kevin G. Murphy
6, SriLal D. Jayaratne
7.
1Department of Physiology, Faculty of Medical Sciences, University of Sri Jayewardenepura,
Sri Lanka*.
2Department of Public Health, Faculty of Medicine, University of Kelaniya, Sri Lanka.
3Nutrition and Dietetic Research Group, Department of Medicine, Imperial College, London
UK.
4Department of Surgery, Faculty of Medicine, University of Kelaniya, Sri Lanka.
5Department of Surgery, Faculty of Medical Sciences, University of Sri Jayewardenepura, Sri
Lanka.
6Section of Investigative Medicine, Department of Medicine, Imperial College London,UK.
7Department of Medicine, Faculty of Medical Sciences, University of Sri Jayewardenepura,
Sri Lanka.
Key terms: Large bowel, PYY, GLP1, colectomy, hunger, fermentation
Abbreviated Title: Colectomy on appetite regulation
Word count: 2,527.
Contact information:
Priyadarshika Hettiarachchi, Department of Physiology, Faculty of Medical Sciences,
University of Sri Jayewardenepura, Gangodawila, Nugegoda,Sri Lanka.
Telephone: +94-11-2837317.
Page 2
2
Fax: +94-11-2801604.Email: priyadarshikahett@gmail.
Funding: This study was supported by a grant from the University of Sri Jayewardenepura,
Sri Lanka (FMS/USJP/: Asp/6/Re/2003/11), and the Commonwealth Commission, UK
(Ref:LKCN-2002-93).
Disclosure Statement: The authors have nothing to disclose.
What is already known about this subject?
Fermentation in the large intestine may result in the release of gut hormones which
suppress appetite, including. glucagon-like peptide-1 (GLP-1) and peptide YY (PYY).
The source of these circulating hormones is unclear, and the effect of partial or total
resection of the large bowel on their levels has only previously been investigated in small
cohorts.
The primary roles of the large bowel have long been thought to be the absorption of water
and electrolytes and its role in appetite and energy homeostasis is little known.
What does your study add?
Our studies demonstrate in a relatively large cohort that partial or total resection of the
large bowel reduces feelings of hunger and suppresses energy intake in humans.
In addition, these operations modulate fermentation within the gut in ways that may
alter the release of anorectic gut hormones, and which may drive the observed
changes in appetite.
These findings suggest that the large bowel plays a role in energy homeostasis.
Page 3
3
Abstract
Objective.To asses appetite and gut hormone levels in patients following partial (PR) or total
resection (TR) of the large bowel.
Method: A comparative cross sectional study was carried out with healthy controls (n=99),
and patients who had undergone PR (n=64) or TR (n=12) of the large bowel. Participants
consumed a standard (720 kcal) breakfast meal at 0830 (t=0) hours followed by lactulose
(15g) and a buffet lunch (t=210 min). Participants rated the subjective feelings of hunger at t=
-30, 0, 30, 60,120,180 min. Breath hydrogen (BH) concentrations were also evaluated. In a
matched subset (11 controls, 11 PR and 9 TR patients) PYY and GLP-1 concentrations were
measured following breakfast. The primary outcome measure was appetite, as measured
using visual analogue scales and the buffet lunch. The secondary outcome was BH
concentrations following a test meal.
Results. PR and TR participants had lower hunger and energy intake at the buffet lunch meal
compared to controls. PR subjects had higher BH concentrations compared to controls and
TR subjects. BH levels correlated with circulating GLP-1 levels at specific time points.
Conclusions: PR or TR of the large bowel reduced feelings of hunger and energy intake, and
PR increased gastrointestinal fermentation.
Page 4
4
Introduction
Obesity is a major international health issue (1). Understanding how food intake is regulated
is important to facilitate dietary, pharmacological and behavioral interventions to reduce
weight gain or promote weight loss. Appetite is regulated by a complex system of central
neuronal circuits which modulates energy homeostasis in response to neural and endocrine
signals from the periphery (2). Specific hormones released from the gastrointestinal tract are
known to play a role in appetite regulation (3). The peptide hormones peptide YY (PYY) and
glucagon-like peptide-1 (GLP-1) are released from the L cells of the gastrointestinal tract
following a meal, and are thought to act as signals of satiety and satiation (4). The density of
L cells increases distally in the gastrointestinal tract, with increased density in the ileum
compared to the proximal small intestine, and the largest concentration is found in the large
bowel (5). The L-cell expresses a large number of G protein coupled nutrient receptors, and
studies suggest that specific macronutrients can modulate the release of PYY and GLP-1 (6,
7). Animal and human studies have suggested a causal relationship between products of
fermentation in the gut and circulating gut hormone levels. Gut micro-organisms are thought
to ferment complex carbohydrates entering the colon to generate short chain fatty acids
(SCFA), which can stimulate PYY and GLP-1 release (8, 9).
The post prandial signaling that stimulates the release of anorectic gut hormones is complex.
PYY and GLP-1 are released within 30 minutes of consuming a meal, before nutrients reach
the regions of the gut with the highest levels of PYY and GLP-1 expression. Hormonal or
neuronal factors may signal from the upper gastrointestinal tract to L cells lower down the
gut to stimulate the release of GLP-1 and PYY. It is also possible that the low levels of GLP-
1 present in the upper intestine are the source of the early post prandial increase in circulating
GLP-1 levels (10).
Page 5
5
Understanding how L cell function is regulated may allow such systems to be exploited to
prevent or treat obesity. Investigating appetite and gut hormone release in patients who have
had portions of their gastrointestinal tract removed may provide useful information regarding
the factors regulating hunger and satiety, and the source of circulating gut hormones. We
hypothesized that appetite, gut fermentation and gut hormone levels would be altered in
patients who had undergone partial or total removal of the large bowel compared to healthy
controls.
Methods
Ethical approval was obtained from the Ethical Review Committee of the Faculty of Medical
Sciences, University of Sri Jayewardenepura Sri Lanka (Application NO:A128). All
volunteers gave written informed consent.
Subjects
Ninety nine healthy controls (55 male, 44 female) and 76 subjects (36 male, 40 female) who
had undergone large bowel resection were recruited from surgical units of the Colombo
North Teaching Hospitals and the Colombo South Teaching Hospital in Sri Lanka. Those
with a history of intestinal surgery or disorders of the intestinal tract (colitis, irritable bowel)
were excluded from being controls. Subjects who underwent surgery for large bowel cancer
were free of cancer based on clinical (normal performance status according to WHO
criteria), biochemical (basic blood parameters, stools for occult blood, carcinoembryonic
antigen within normal limits) and radiological assessment (chest X-ray, US scan abdomen
and colonoscopy normal) at the time of recruitment to the study (11). Those with chronic
illness (e.g. diabetes mellitus, Parkinson’s disease), those who had undergone irradiation, and
subjects on long term medication since resection were excluded from the study (12, 13).
Page 6
6
Those who had undergone large bowel resection were classed as either Partial Resection (PR)
(64 subjects, 33 males, 31 females) for those who had undergone subtotal/hemi-colectomy,
abdomino-perineal resection (APR), low anterior resection (LAR), high anterior resection
(HAR) or anterior resection (AR), or as total resection (TR) (12 subjects, 3 males, 9 females)
for those who had undergone total resection of the large bowel, including both the colon and
the rectum.
Study protocol
Subjects who had undergone large bowel resection attended the skills laboratories of the
professorial surgical units at the Colombo South Teaching Hospital and the Colombo North
Teaching Hospital. Controls attended the Department of Physiology, University of Sri
Jayewardenepura.
The study commenced at 0800h following a 10 hour overnight fast, during which only water
was permitted to be consumed. Subjects were asked to refrain from smoking, alcohol
consumption and exercise during the preceding 24 hours. On arrival, a cannula was placed in
a subset of 31 participants’ forearms to allow blood samples to be taken.
Meal test
All participants consumed a standard 720 Kcal breakfast meal containing 50g fat and 50 g
carbohydrate, 32.9g protein and consisting of bread (70 g), butter (30 g) and curry, and a cup
of tea with 12 g sugar without milk at 0830 hours. Lactulose (15g) was given immediately
after the standard breakfast. At 210 minutes after breakfast, all participants were given a
buffet lunch in excess. Lunch comprised of rice, lentils, tuna fish, eggplant and a salad, whilst
dessert was a standard 80g cup of vanilla ice cream. All participants were asked to eat until
they were comfortably full. Each component of the lunch meal was weighed before and after
eating and the energy intake calculated using the diet plan 5 (dietary analysis software-
Page 7
7
Forestfield software Ltd. West Sussex.UK) which is based on McCance and Widdowson’s
composition of food (14).
Appetite assessment
Participants rated subjective feelings of hunger (‘How hungry do you feel right now?’),
pleasantness to eat (‘How pleasant would it be to eat right now?’), prospective food intake
(‘How much could you eat right now?’), fullness (‘How full do you feel right now?’) and
sickness (‘How sick do you feel right now?’) using 100 mm horizontal visual analogue scales
(VAS) at -30, 0, 30, 60,120,180 min following the breakfast (15).
Breath hydrogen
Breath hydrogen (BH) concentrations were evaluated as a measure of colonic fermentation
before breakfast (-30min), and at 60 min intervals up to 180 min after breakfast, using a
portable breath hydrogen monitor (Bedfont EC60 Gastrolizer BSEN ISO9001, Rochester,
Kent, UK ) with a sensor sensitivity of 1 part per million (ppm). A breath hydrogen
concentration of more than 10 ppm was considered a positive result (16).
Gut hormone analysis
Plasma PYY and GLP-1 concentrations were measured at -30, 0, 60, 120 and180 minutes
after breakfast in a subset of 31 age, sex, and body mass index (BMI) matched subjects (11
controls, 11 PR, 9 TR) using in-house radioimmunoassay (17, 18). The detection limit for
PYY was 10 pmol/L and the intra- and inter-assay variation was 6.0% and 9.5%,
respectively. The detection limit for GLP-1 was 2 pmol/L and the intra- and inter-assay
variation was 8.7% and 8.0%, respectively.
Page 8
8
Statistical analysis
Variables of control, PR and TR participants were compared using regression analysis
followed by post hoc analysis using the Dunnett’s test. Hunger, pleasantness to eat,
prospective food intake, fullness, sickness, PYY and GLP-1 concentrations, and breath
hydrogen concentration, changes in hunger levels compared to -30min (baseline) between
groups at different time points were compared by regression analysis followed by post hoc
analysis using the Dunnett’s test. Pearson correlation coefficients were used to assess
associations between other parameters, PYY and GLP1 concentrations and incremental area
under the curves (IAUC) for the PYY and GLP1 responses. Tastiness pleasantness, and
palatability of the breakfast was assessed immediately after breakfast and lunch. All analyses
were performed using SPSS software (version 16). Significance was assigned to a p-value of
<0.05.
Results
Demographic and Anthropometric assessment:
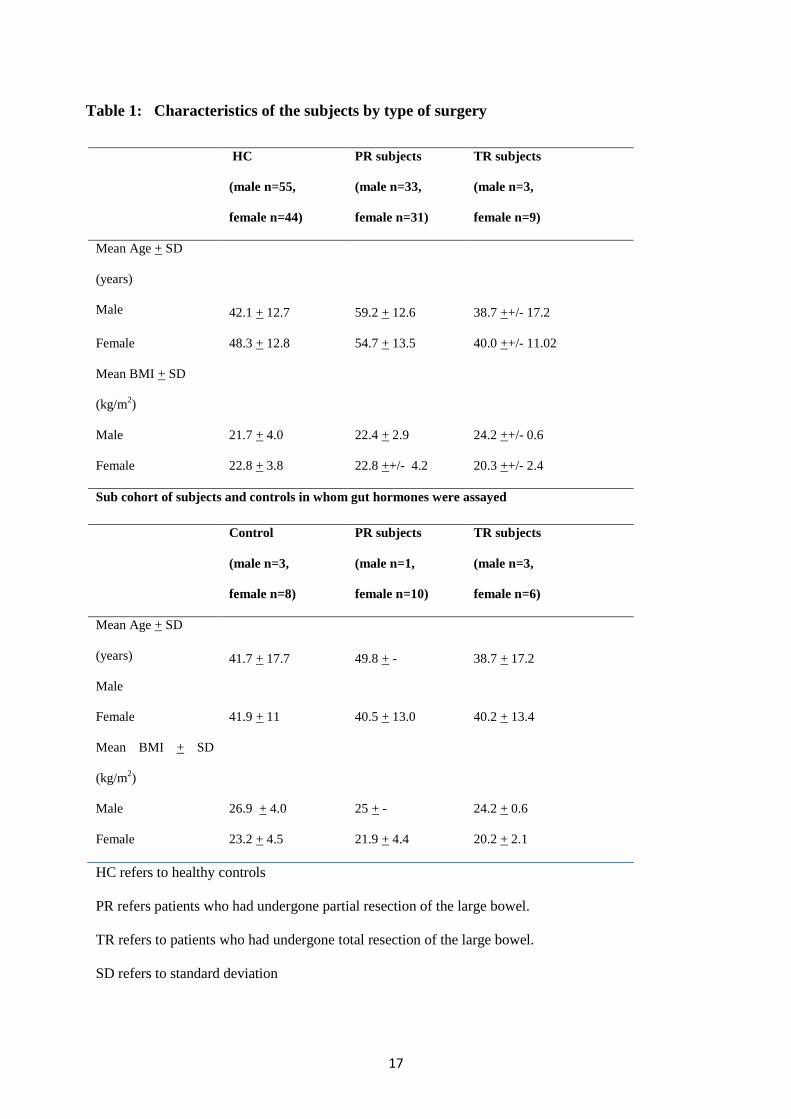
The age and BMI of the three participant groups are shown in Table 1. There were no
significant differences in age or BMI between any of the groups examined. The type of
surgical procedure, diagnosis and the average time since surgery when investigated for the
PR and TR groups are shown in Table 2.
Visual analogue assessment of appetite
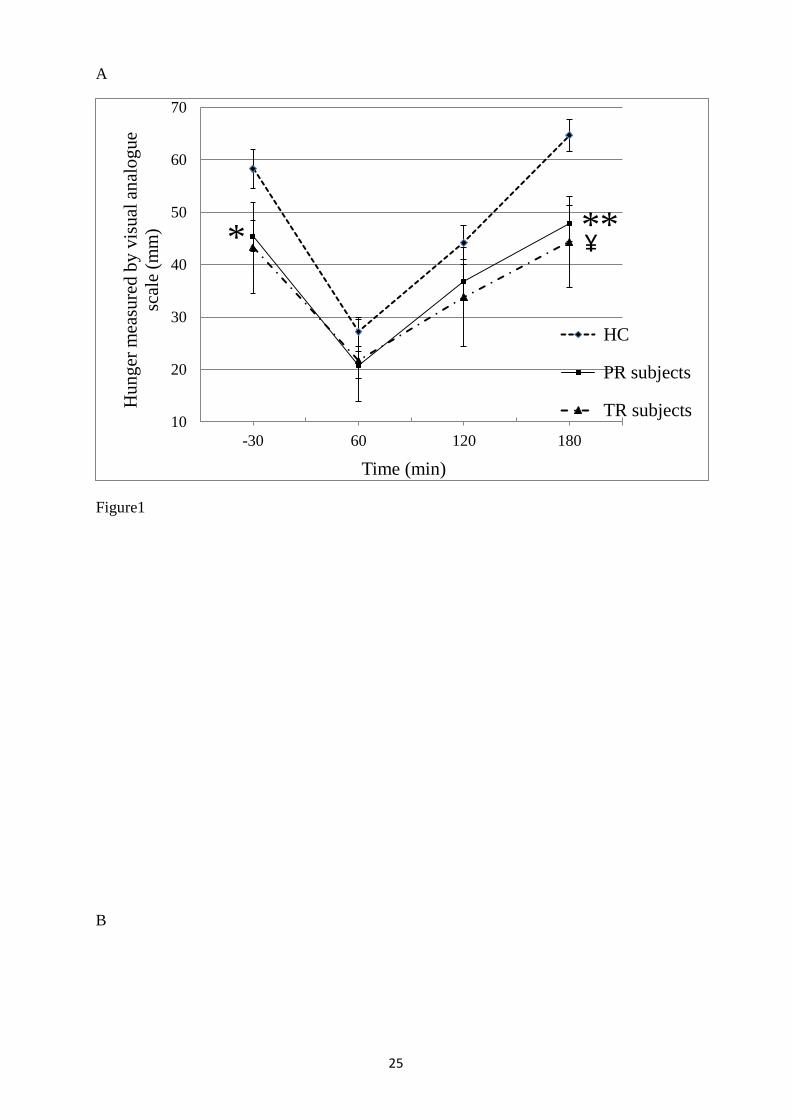
The subjective feeling of hunger was significantly lower (p<0.05) in PR subjects at baseline
(time point - 30min), and in both PR (p=0.001) and in TR (p<0.05) subjects at 180 min,
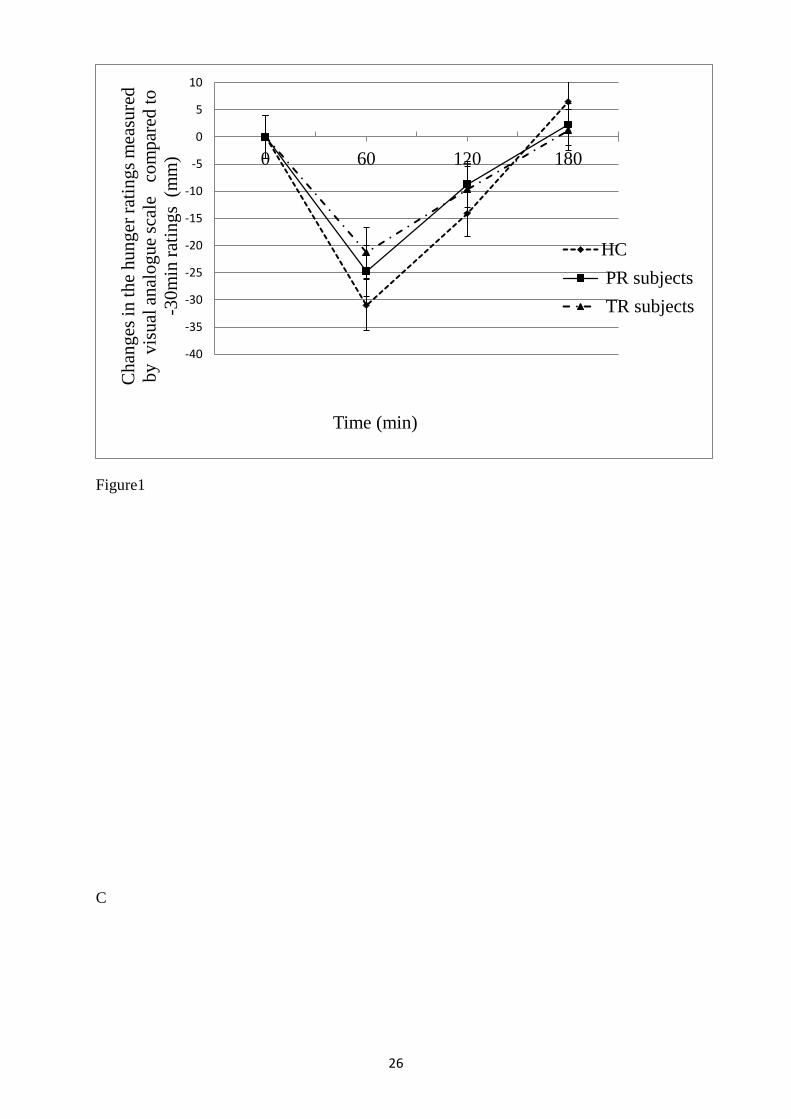
compared to controls (Figure 1 A).There was no significant difference amongst the groups
regarding the change in the subjective feeling of hunger ratings compared to base line(-
30min) following the breakfast(Figure 1 B).
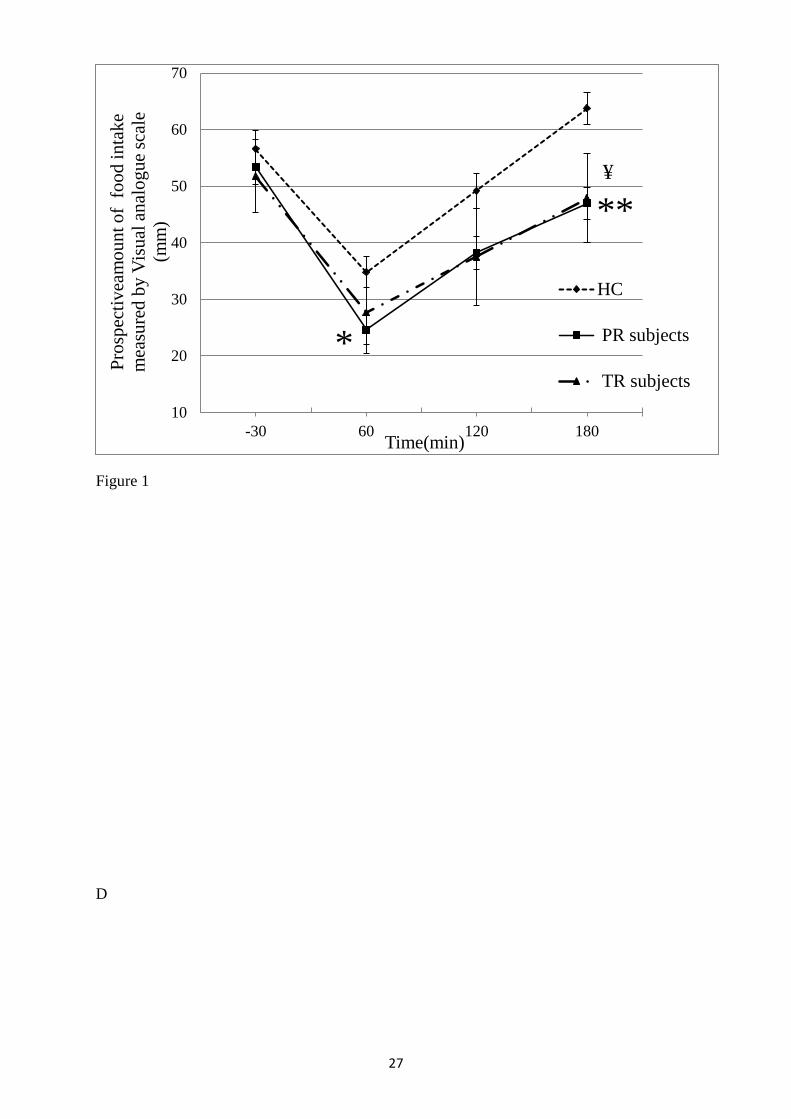
There was a significant reduction in the estimate of prospective food intake in PR subjects
(p<0.05) at 60 min and in PR (p= 0.001) and TR (p<0.05) subjects at 180 min (Figure 1 C).
Page 9
9
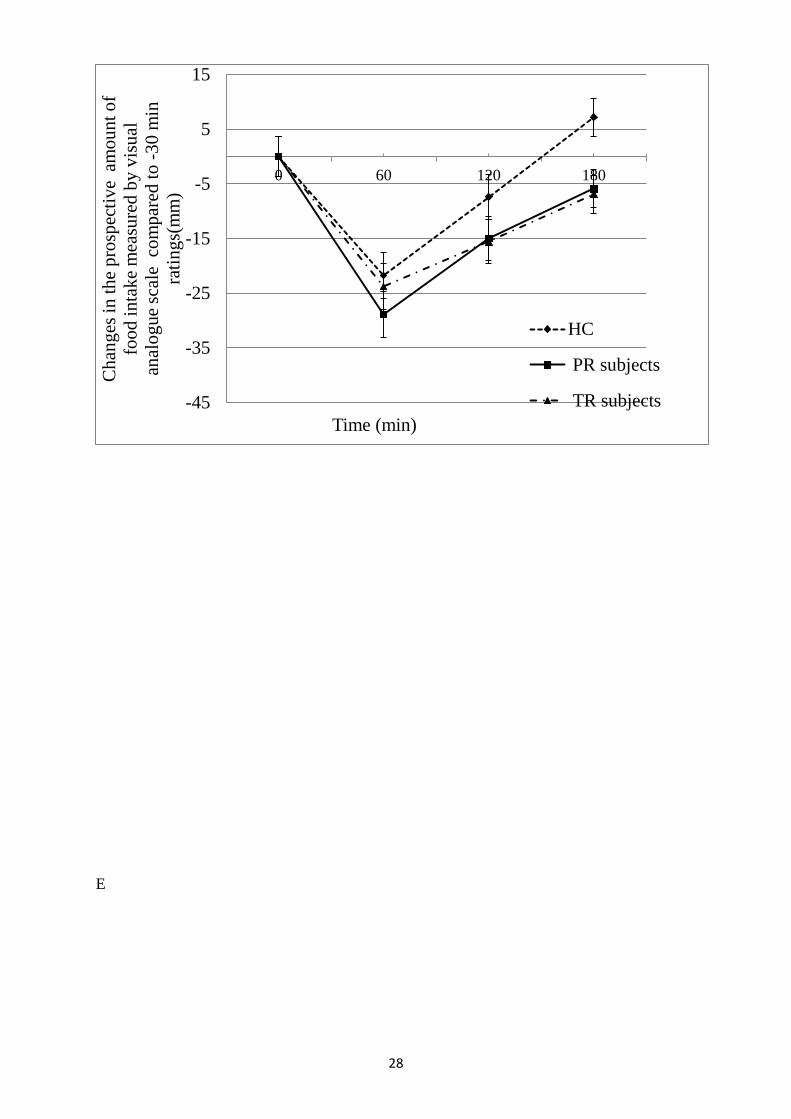
There was no significant difference amongst the groups regarding the change in the estimate
of prospective food intake compared to base line(-30min) following the breakfast(Figure 1
D).
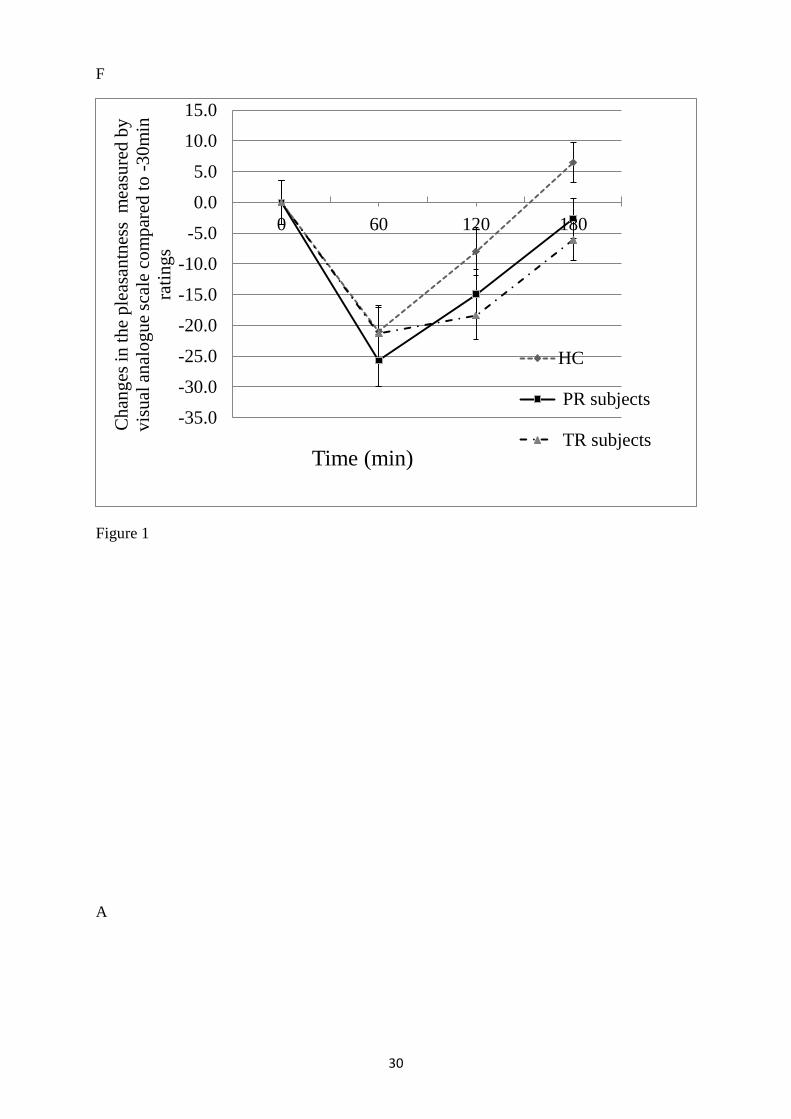
PR (p=0.016) and TR subjects (p=0.031) had a significantly lower feeling of pleasantness to
eat at 180 min (Figure 1 E). There was no significant difference amongst the groups
regarding the change in the feeling of pleasantness to eat compared to base line
(-30min) following the breakfast(Figure 1 F).
There was no significant difference in the subjective feelings of fullness or sickness between
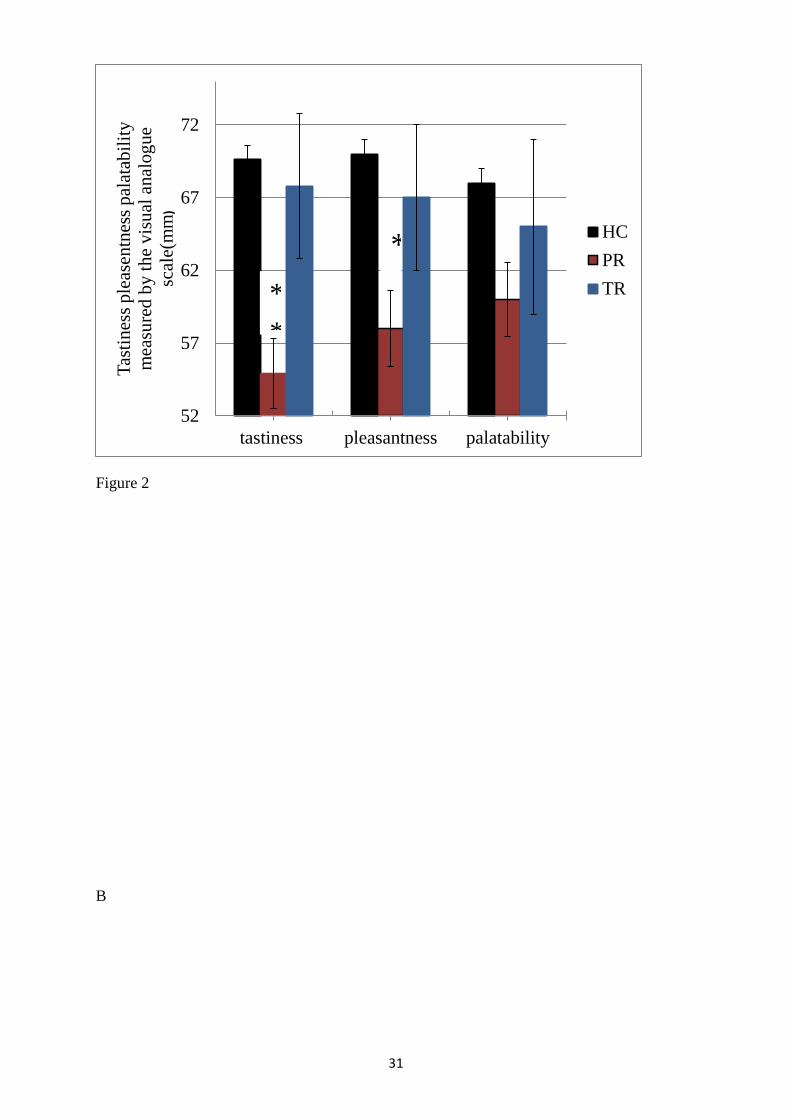
control, PR or TR participants at any time point (Table 3,). There was a significant reduction
in the perception of taste(p=0.001)pleasantness (p=0.005 ) of the breakfast in the PR subjects
compared to controls (Figure 2A). How ever there was no significant difference in the
perception of taste, pleasantness and palatability of the buffet meals between groups (Table
4).
Energy intake at a buffet meal
The energy intake (mean + SD (kcal) at the buffet lunch meal was significantly lower in
subjects who had undergone PR or TR compared to controls (Figure 2B) (Controls, 759.719
± 216.848; PR 581.063 ± 213.065, p<0.001; TR, 529.667 ± 151.693, p<0.005).
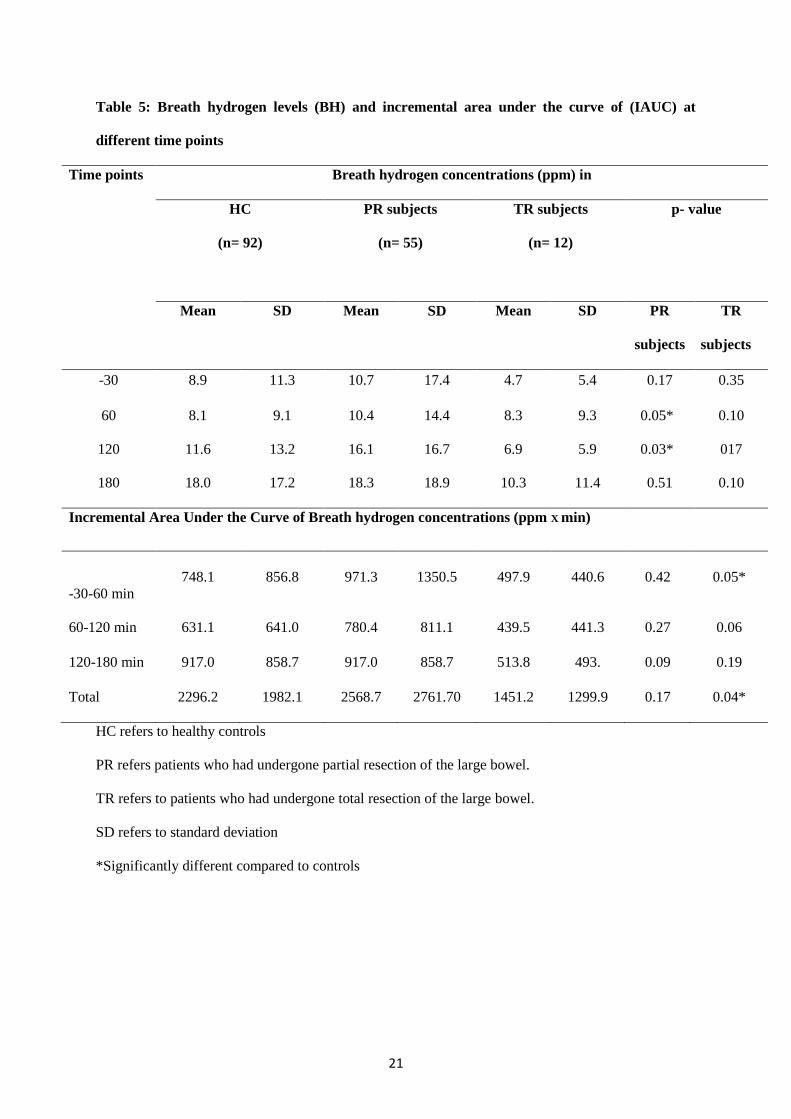
Breath hydrogen concentration levels
PR subjects had significantly higher BH levels than those of controls and TR subjects at 60
min (p<0.05) and at 120 min (p<0.05) (Table 5). TR subjects had a significantly lower post
prandial total breath hydrogen level (p<0.05) (Table 5).
Gut hormones
The demographic details of the sub cohort in which gut hormones were measured are
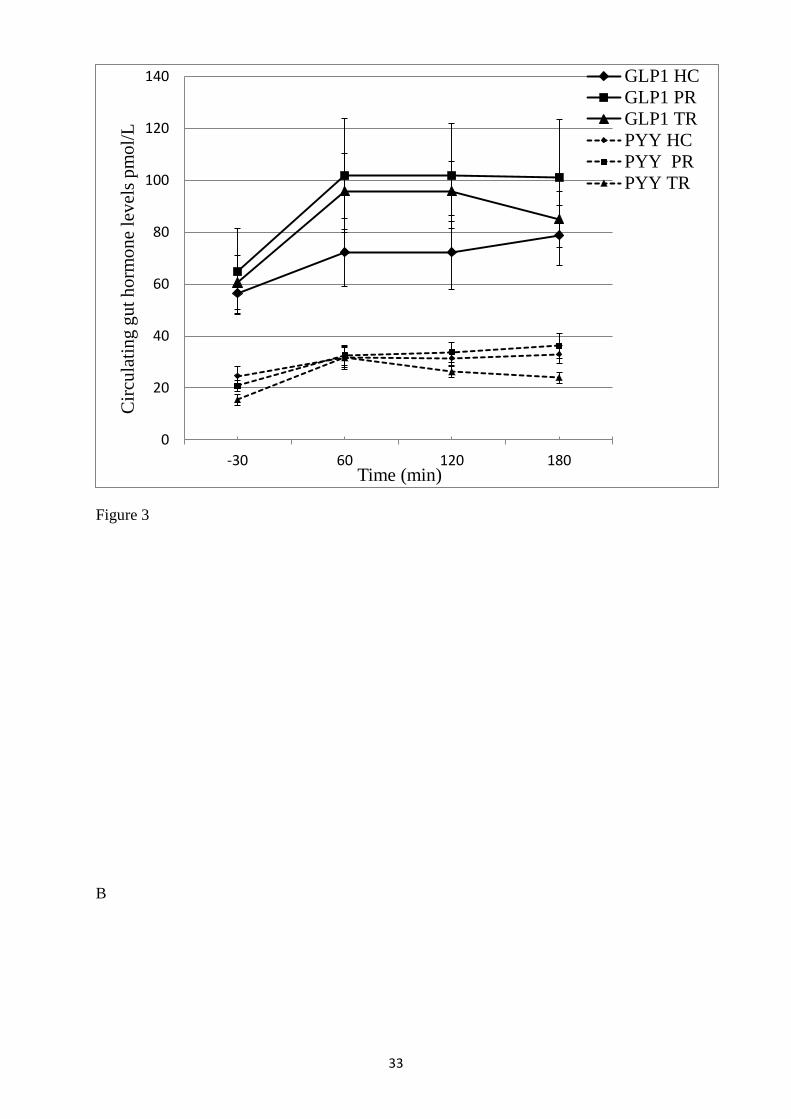
presented in Table 2. There was a trend for higher postprandial circulating GLP-1
concentrations in TR and particularly in PR subjects, though not statistically significant, and
a trend for lower PYY levels in the TR subjects (Figure 3A). The incremental area under the
Page 10
10
curve (IAUC) for PYY levels was significantly higher in TR subjects between-30-60 min
compared to controls (p<0.05) (Figure 3 B). There is no significant difference in the IAUC
for GLP1 concentration amongst the study group (Figure 3C).
In PR subjects, hunger levels at 180 min negatively correlated with PYY concentrations at -
30min (r= -0.783, p=0.004), at 60min (r= -0.667, p=0.024) and at 120 min(r= -
0.601,p=0.050) .
The incremental area under the curve (IAUC) for change in GLP 1 levels between -30-60
min correlated with breath hydrogen concentration levels at -30 min (r=0.785, p=0.004), at 60
min (r=0.677, p=0.022) and at 180 min (r=0.597, p=0.052) in PR subjects.
The BH concentration increase observed coincides with the increase in GLP1 concentration
at 60 min and at 120 min, and the fullness levels at 60 min correlate with the BH
concentrations at 60 min (r=0.715, p= 0.03), at 120 min (r=0.83, p=0.005) and at 180 min
(r=0.742, p=0.021) in PR subjects. In PR subjects, the palatability of the breakfast meal
negatively correlated with the GLP1 concentration at -30 min (r=-0.669, p=0.49).
Discussion
This study examined the effects of colectomy on appetite, energy intake and gut
fermentation, and investigated the relationship between gut fermentation, gut hormone
concentrations and appetite in subjects who underwent partial or total resection of the large
bowel compared to healthy controls. Compared to other studies examining appetite in such
patients (19-21), this study included a relatively large cohort of 64 PR and 12 TR subjects.
The PR and TR participants had significantly lower subjective feelings of hunger and
prospective food intake at specific time points, and ate less at a buffet lunch meal compared
to controls. BH levels of PR subjects were significantly higher compared to controls and TR
Page 11
11
subjects at specific time points, and the TR subjects had significantly lower post prandial BH
production.
Reduction or total absence of the large bowel was associated with a reduction in food intake.
This may be due to the absence of factors from the large bowel, or it may reflect changes to
other parts of the gut such as the small intestine secondary to this loss of large bowel. Altered
neuro-humoral mechanisms may be responsible for the altered appetite observed (22-24). It is
interesting that there was a trend for postprandial GLP-1 levels to be higher in PR and TR
subjects, but a similar pattern was not observed in PYY levels. The upper small intestine
expresses more GLP-1 than PYY, and has numerous cells that express GLP-1 but not PYY
(25). The areas of the gut responsible for the release of PYY and GLP-1 following a meal are
unclear, but these studies suggest that the gut is able to maintain its release of GLP-1
following the loss of part or the whole of the colon. Perhaps, the small intestine GLP-1
system is more elastic and able to respond to changes in the gut more readily than the PYY
system. The ileum also contains a number of GLP-1 and PYY expressing cells, and it may be
that the ileum increases its number and/or activity of L cells in response to the loss of the
colon (26, 27). This may represent a gut response to, for example, rapid small bowel transit
following colectomy. Though PYY levels in TR subjects showed a trend to be lower than
those in controls, it is interesting to note that they showed a relative greater post-prandial rise.
It is possible that changes in PYY levels rather than absolute levels are important in appetite
regulation; PYY levels and hunger ratings showed a negative association in PR subjects. The
changes in gut hormones observed may be partly responsible for the difficulty in weight
regain following colectomy.
Breath hydrogen is an indicator of bacterial fermentation in the GI tract. It is interesting to
note that although the TR subjects had the lowest BH levels, it is still detectable, suggesting
some fermentation is occurring, presumably in the small intestine. Subjects who had
undergone PR generally had higher levels of breath hydrogen than control and TR subjects,
Page 12
12
implying a higher bowel fermentation that may reflect the remaining large bowel tissue
responding to, and perhaps overcompensating for, the removal of the rest of the large bowel.
In PR subjects the IAUC for GLP-1 concentrations correlated with breath hydrogen excretion
at -30 min, 60 min and 180 mins. Recent animal and human studies have found fermentable
food to stimulate the secretion of GLP-1 secretion (28-30). It is known that short chain fatty
acids produced by fermentation of non-digestable carbohydrate in the colon can stimulate
GLP-1 and PYY release (9). In this study, a standard meal containing lactulose was used to
increase fermentation, in contrast to other studies in which a specific fermentable nutrient
such as oligofructosacharide or beta glucan were used. Further work is required to understand
the relationship between fermentation in the gut and the release of gut hormones. However, it
is interesting to speculate that manipulating gastrointestinal fermentation may be able to alter
appetite in the absence of surgery.
These data suggest that partial or total removal of the colon results may result in alterations to
the gut endocrine system, and that partial removal may be associated with greater
gastrointestinal fermentation than in controls. Further work is required to determine the
mechanisms which mediate the effects of partial or total resection of the colon on appetite
and food intake.
Acknowledgements
We are grateful to Mrs. Geethani Ratnayaka, enterostomal therapist, Department of Surgery,
Faculty of Medicine, University of Kelaniya, Sri Lanka, for the expert assistance given in
sample collection, and Dr. Mahendra Perera Consultant Oncologist National Cancer Institute,
Maharagama, Sri Lanka for the expert opinion given in identifying inclusion and exclusion
criteria in cancer patients. We also acknowledge the University of Sri Jayewardenepura, Sri
Page 13
13
Lanka (grant no: Asp/6/Re/2003/11) and the Commonwealth Commission, UK (grant no:
LKCN-2002-93) for providing financial support to carry out this study.
References
1. Haidar Y, Cosman B. Obesity epidemiology. Clin Colon Rectal Surg2011;24(4):205-
10.
2. Blundell J, Lawton C, Hill A. Mechanisms of appetite control and their abnormalities
in obese patients. Horm Res 1993;39(3):72-6.
3. Geiselman P. Control of food intake a physiologically complex motivated behavioral
system. Endocrin Metab Clin1996;25(815-29).
4. Beglinger C, Degen L. Gastrointestinal satiety signals in humans--physiologic roles
for GLP-1 and PYY?Physiol Behav 2006;89(4):460-4.
5. Ekblad E, Sundler F. Distribution of pancreatic polypeptide and peptide YY. Peptides
2002;23(2):251-61.
6. Rozengurt N, Wu S, Chen M, Huang C, Sternini C, Rozengurt E. Colocalization of
the α-subunit of gustducin with PYY and GLP-1 in L cells of human
colon.GastrointestLiverPhysiol ;291(5):G792-G802.
7. Spreckley E, Murphy KG. The L-Cell in Nutritional Sensing and the Regulation of
Appetite.Front Nutr 2015;23(2).
8. Chambers E, Viardot A, Psichas A, Morrison D, Murphy K, Zac-Varghese S, et al.
Effects of targeted delivery of propionate to the human colon on appetite regulation,
body weight maintenance and adiposity in overweight adults. Gut 2015;64(11):1744-
54.
9. Psichas A, MLSleeth, Murphy K, Brooks L, Bewick G, Hanyaloglu A, et al. The short
chain fatty acid propionate stimulates GLP-1 and PYY secretion via free fatty acid
receptor 2 in rodents. Int J Obe 2014;39(3):424-9.
Page 14
14
10. Steinert R, Meyer-Gerspach A, Beglinger C. The role of the stomach in the control of
appetite and the secretion of satiation peptides.Am J Physiol Endocrinol
Metab2012;302(6):E666-73.
11. (IARC) IAfRoC. Pathology and genetics of tumours of the digestive system.
Lyon,France: International Academy of Pathology (IAP); 2000.
12. Ruo MR, Allis S. Radiotherapy-induced taste impairment.Cancer Treat Rev
2006;32(7):541-7.
13. Shore D, Rafal R, Parkinson J. Appetitive motivational deficits in individuals with
Parkinson's disease. Mov Disord2011;26(10.)
14. Agency FS. McCance and Widdowson's The Composition of Foods, Sixth summary
edition. Food Standards Agency (2002). Cambridge: Royal Society of Chemistry.
ISBN 0-85404-428-0. . 6 ed. London: Cambridge: Royal Society of Chemistry; 2002.
15. Flint A, Raben A, Blundell J, Astrup A. Reproducibility, power and validity of visual
analogue scales in assessment of appetite sensation in single test meal studies. Int J
Obes Relat Metab Disord 2000;24(1):38-48.
16. Santavirta J. Lactulose hydrogen and [14C] xylose breath tests in subjects with
ileoanal anastomosis. Int J Colorectal Dis 1991;6(4):208-11.
17. Adrian T, Ferri G, Bacarese-Hamilton A. Human distribution and release of a putative
new gut hormone, peptide YY. Gastroenterology 1985;89:1070-7.
18. Kreymann B, Williams G, Ghatei M, Bloom S. Glucagon-like peptide-1 7-36: a
physiological incretin in man. Lancet. 1987;2(8571): 1300-4.
19. Hopman W, Mollen. R, Kuijpers J, Jansen J. Peptide YY release after colectomy in
slow transit constipation. Scand J Gastroenterol. 2004;39(8):727-30.
20. Ternent C, Thorson A, Blatchford G, Christensen M, Thompson J, Lanspa S, et al.
Mouth to pouch transit after restorative proctocolectomy: hydrogen breath analysis
correlates with scintigraphy.Am J Gastroenterol2001;96(5):1460-3.
Page 15
15
21. Battum Pv, Hopman W, Salemans J, Kuijpers JH,Nagengast FM, Bansen J. Impaired
release of peptide YY in patients with proctocolectomy and ileal pouch-anal
anastomosis.Dis Colon Rectum1998;41(7):868-74.
22. Bharucha A, Camilleri M, Zinsmeister A, Hanson R. Adrenergic modulation of
human colonic motor and sensory function. Am J Physiol 1997;273:G997–1006.
23. Steadman C, Phillips S, Camilleri M, Talley N, Haddad A, Hanson R. Control of
muscle tone in the human colon. Gut. 1992;33(4):541-6.
24. Camilleri M, Ford M. Colonic sensorimotor physiology in health, and its alteration in
constipation and diarrhoeal disorders. Aliment Pharmacol Ther 1998;12(4):287-302.
25. Svendsen B, Pedersen J, Albrechtsen N, Hartmann B, Toräng S, Rehfeld J, et al. An
analysis of cosecretion and coexpression of gut hormones from male rat proximal and
distal small intestine. Endocrinology2014;156(3):847-57. .
26. Olesen M, Gudmand-Høyer E, Holst J, Jørgensen S. Importance of colonic bacterial
fermentation in short bowel patients: small intestinal malabsorption of easily
digestible carbohydrate. Dig Dis Sci 1999;44(9):1914-23.
27. Hallböök O, Adrian T, Permert J, Staab P. Role of peptide YY and enteroglucagon
after low anterior resection. Comparison between straight and colonic J-pouch
anastomosis. Dis Colon Rectum. 1996;39(10):1153-8.
28. Cani P, Dewever C, Delzenne N. Inulin-type fructans modulate gastrointestinal
peptides involved in appetite regulation (glucagon-like peptide-1 and ghrelin) in
rats.Br J Nutr 2004;92(3):521-6.
29. Delmée E, Cani P, Gual G, Knauf C, Burcelin R, Maton N, et al. Relation between
colonic proglucagon expression and metabolic response to oligofructose in high fat
diet-fed mice. Life Sci2006;79(10):1007-13.
30. Greenway F, O'Neil C, Stewart L, Rood J, Keenan M, Martin R. Fourteen weeks of
treatment with Viscofiber increased fasting levels of glucagon-like peptide-1 and
peptide-YY.J Med Food 2007;10(4):720-4.
Page 17
17
Table 1: Characteristics of the subjects by type of surgery
HC refers to healthy controls
PR refers patients who had undergone partial resection of the large bowel.
TR refers to patients who had undergone total resection of the large bowel.
SD refers to standard deviation
HC
(male n=55,
female n=44)
PR subjects
(male n=33,
female n=31)
TR subjects
(male n=3,
female n=9)
Mean Age + SD
(years)
Male
42.1 + 12.7
59.2 + 12.6
38.7 ++/- 17.2
Female 48.3 + 12.8 54.7 + 13.5 40.0 ++/- 11.02
Mean BMI + SD
(kg/m2)
Male 21.7 + 4.0 22.4 + 2.9 24.2 ++/- 0.6
Female 22.8 + 3.8 22.8 ++/- 4.2 20.3 ++/- 2.4
Sub cohort of subjects and controls in whom gut hormones were assayed
Control
(male n=3,
female n=8)
PR subjects
(male n=1,
female n=10)
TR subjects
(male n=3,
female n=6)
Mean Age + SD
(years)
Male
41.7 + 17.7
49.8 + -
38.7 + 17.2
Female 41.9 + 11 40.5 + 13.0 40.2 + 13.4
Mean BMI + SD
(kg/m2)
Male 26.9 + 4.0 25 + - 24.2 + 0.6
Female 23.2 + 4.5 21.9 + 4.4 20.2 + 2.1
Page 18
18
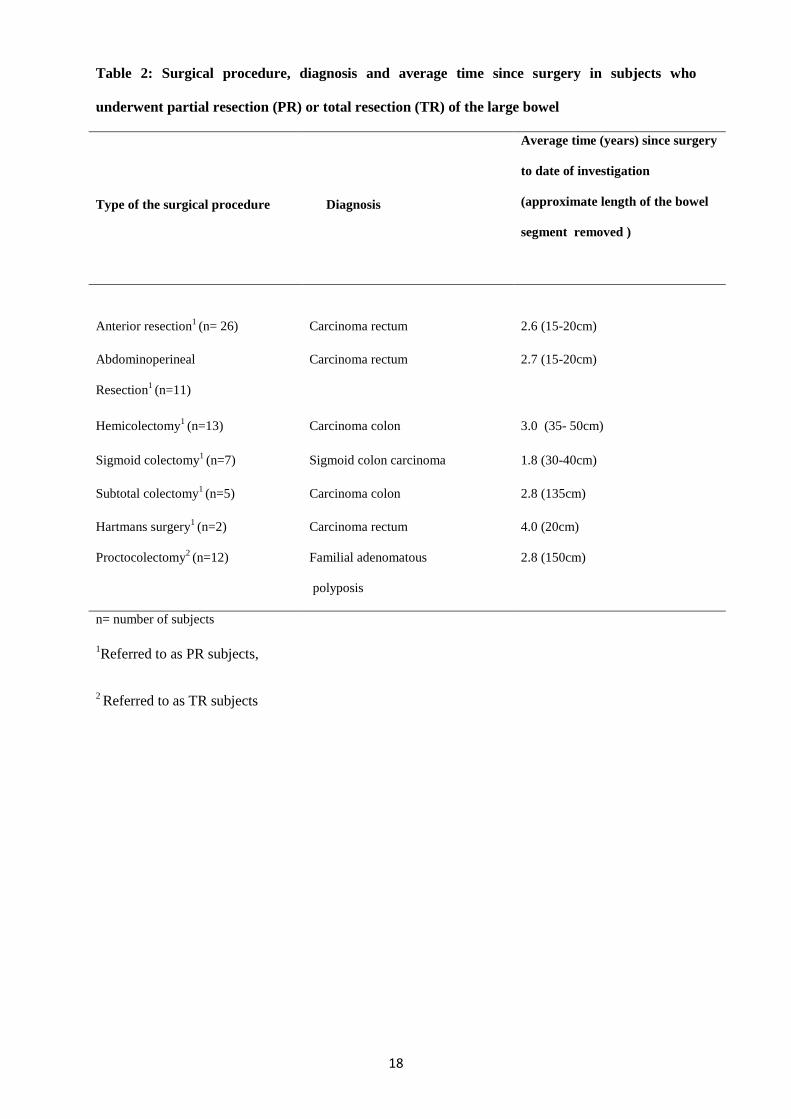
Table 2: Surgical procedure, diagnosis and average time since surgery in subjects who
underwent partial resection (PR) or total resection (TR) of the large bowel
Type of the surgical procedure
Diagnosis
Average time (years) since surgery
to date of investigation
(approximate length of the bowel
segment removed )
Anterior resection1 (n= 26) Carcinoma rectum 2.6 (15-20cm)
Abdominoperineal
Resection1 (n=11)
Carcinoma rectum 2.7 (15-20cm)
Hemicolectomy1 (n=13) Carcinoma colon 3.0 (35- 50cm)
Sigmoid colectomy1 (n=7) Sigmoid colon carcinoma 1.8 (30-40cm)
Subtotal colectomy1 (n=5) Carcinoma colon 2.8 (135cm)
Hartmans surgery1 (n=2) Carcinoma rectum 4.0 (20cm)
Proctocolectomy2 (n=12) Familial adenomatous
polyposis
2.8 (150cm)
n= number of subjects
1Referred to as PR subjects,
2 Referred to as TR subjects
Page 19
19
Table 3: Feeling of fullness and sickness measured by the visual analogue scale
Feeling of sickness (mm) in
Time points
(min)
HC
(n= 98)
PR subjects
(n= 64)
TR subjects
(n= 12)
Mean SD Mean SD Mean SD
-30 16.9 8.1 8.8 12.5 18.8 9.9
60 14.9 7.5 15.1 7.6 10.8 6.9
120 12.9 6.3 17.4 7.0 19.8 8.6
180 13.8 6.2 18.3 9.3 21.8 10.1
Feeling of fullness (mm) in
-30 17.2 11.3 24.6 17.2 23.8 16.2
60 56.0 28.5 57.1 25.9 51,7 29.7
120 42.0 26.9 45.3 22.0 36.7 32.1
180 30.9 28.4 35.9 25.0 44.2 30.7
HC refers to healthy controls
PR refers patients who had undergone partial resection of the large bowel.
TR refers to patients who had undergone total resection of the large bowel.
SD refers to standard deviation
Page 20
20
Table 4: Taste, pleasantness and palatability of the buffet meal measured on a visual analogue
scale (mm)
HC refers to healthy controls
PR refers patients who had undergone partial resection of the large bowel.
TR refers to patients who had undergone total resection of the large bowel.
SD refers to standard deviation
HC
(n= 95)
PR subjects
(n= 64)
TR subjects
(n= 12)
Mean SD Mean SD Mean SD
Taste (mm) 69.6 27.6 54.9 19.2 67.8 18.1
Pleasantness
(mm)
74.0 23.1 71.2 22.5 69.8 25.9
Palatability
(mm)
72.4 23.7 72.5 18.1 65.1 23.4
Page 21
21
Table 5: Breath hydrogen levels (BH) and incremental area under the curve of (IAUC) at
different time points
Time points
Breath hydrogen concentrations (ppm) in
HC
(n= 92)
PR subjects
(n= 55)
TR subjects
(n= 12)
p- value
Mean SD Mean SD Mean SD PR
subjects
TR
subjects
-30 8.9 11.3 10.7 17.4 4.7 5.4 0.17 0.35
60 8.1 9.1 10.4 14.4 8.3 9.3 0.05* 0.10
120 11.6 13.2 16.1 16.7 6.9 5.9 0.03* 017
180 18.0 17.2 18.3 18.9 10.3 11.4 0.51 0.10
Incremental Area Under the Curve of Breath hydrogen concentrations (ppm X min)
-30-60 min
748.1 856.8 971.3 1350.5 497.9 440.6 0.42 0.05*
60-120 min 631.1 641.0 780.4 811.1 439.5 441.3 0.27 0.06
120-180 min 917.0 858.7 917.0 858.7 513.8 493. 0.09 0.19
Total 2296.2 1982.1 2568.7 2761.70 1451.2 1299.9 0.17 0.04*
HC refers to healthy controls
PR refers patients who had undergone partial resection of the large bowel.
TR refers to patients who had undergone total resection of the large bowel.
SD refers to standard deviation
*Significantly different compared to controls
Page 22
22
Figure Legends
Figure 1
(A) Hunger measured by 100 mm horizontal visual analogue scale in healthy controls (HC,
n=99), those who had undergone subtotal/hemi-colectomy,abdomino-perineal resection, low
anterior resection, high anterior resection or anterior resection (PR, n=64), and who had
undergone total resection of the large bowel, including both colon and the rectum (TR, n=12).
The subjective feelings of hunger ratings were indicated at -30, 60,120 and 180 min
following the breakfast. *P<0.05, **P<0.001 for PR vs. HC; ¥
P<0.05 for TR vs. HC. All
data expressed as mean ± SEM.
(B) Changes in the subjective feelings of hunger ratings following the breakfast at
60min,120min and 180min with -30min are shown.. -30min is considered as basal value. Hunger
levels were measured by 100 mm horizontal visual analogue scale in healthy controls (HC,
n=99), those who had undergone subtotal/hemi-colectomy,abdomino-perineal resection, low
anterior resection, high anterior resection or anterior resection (PR, n=64), and who had
undergone total resection of the large bowel, including both colon and the rectum (TR, n=12).
All data expressed as mean ± SEM.
(c). Prospective amount of food intake measured by 100 mm horizontal visual analogue
scale in healthy controls (HC, n=99), those who had undergone subtotal/hemi-
colectomy,abdomino-perineal resection, low anterior resection, high anterior resection or
anterior resection (PR, n=64), and who had undergone total resection of the large bowel,
including both colon and the rectum (TR, n=12). The prospective food intake were indicated
at -30, 60,120 and 180 min following breakfast. *P<0.05, **P<0.001 for PR vs. HC; ¥
P<0.05 for TR vs. HC. All data expressed as mean ± SEM.
Page 23
23
(D) Changes in the prospective amount of food intake following the breakfast at 60min,120min
and 180min with -30min are shown. -30min is considered as basal value. Prospective amount of food
intake was measured by 100 mm horizontal visual analogue scale in healthy controls (HC,
n=99), those who had undergone subtotal/hemi-colectomy,abdomino-perineal resection, low
anterior resection, high anterior resection or anterior resection (PR, n=64), and who had
undergone total resection of the large bowel, including both colon and the rectum (TR, n=12).
All data expressed as mean ± SEM.
(E) Pleasantness to eat measured by 100 mm horizontal visual analogue scale in healthy
controls (HC, n=99), those who had undergone subtotal/hemi-colectomy,abdomino-perineal
resection, low anterior resection, high anterior resection or anterior resection (PR, n=64),
and who had undergone total resection of the large bowel, including both colon and the
rectum (TR, n=12). The pleasantness to eat were indicated at -30, 60,120 and 180 min
following breakfast. *P<0.05 for PR vs. HC; ¥
P<0.05 for TR vs. HC. All data expressed as
mean ± SEM
(F) Changes in the pleasantness to eat following the breakfast at 60min,120min and 180min
with -30min are shown. -30min is considered as basal value .Pleasantness eat was measured by 100
mm horizontal visual analogue scale in healthy controls (HC, n=99), those who had
undergone subtotal/hemi-colectomy,abdomino-perineal resection, low anterior resection,
high anterior resection or anterior resection (PR, n=64), and who had undergone total
resection of the large bowel, including both colon and the rectum (TR, n=12). All data
expressed as mean ± SEM.
Page 24
24
Figure 2
(A) Tastiness, pleasantness to eat,palatability immediately after the breakfast meal measured
by 100 mm horizontal visual analogue scale in healthy controls (HC, n=99), those who had
undergone subtotal/hemi-colectomy,abdomino-perineal resection, low anterior resection,
high anterior resection or anterior resection (PR, n=64), and who had undergone total
resection of the large bowel, including both colon and the rectum (TR, n=12). *P<0.05,
**P<0.001 for PR vs. HC.. All data expressed as mean ± SEM
(B)The energy intake of healthy controls (HC) (n=99), partial resection (PR) (n=64) and total
resection (TR) (n=12) subjects at a buffet lunch in excess. **P<0.01 for PR vs. HC; ¥P<0.05
for TR vs. HC. All data expressed as mean ± SEM.
Figure 3
(A). Plasma PYY and GLP-1 concentrations at -30, 60,120 and 180 min in healthy controls
(HC) (n=11), partial resection (PR) (n=11), and total resection (TR) (n=9) subjects following
a test breakfast. All data expressed as mean ± SEM.
(B). Incremental area under the curve values for changes in plasma PYY concentrations in
healthy controls (HC) (n=11), partial resection (PR) (n=11), and total resection (TR) (n=9)
subjects following a test breakfast meal. ¥
= P<0.05 for TR vs HC. All data expressed as mean
± SEM.
(C). Incremental area under the curve values for changes in plasma GLP1 concentrations in
healthy controls (HC) (n=11), partial resection (PR) (n=11), and total resection (TR) (n=9)
subjects following a test breakfast meal. All data expressed as mean ± SEM.
Page 25
25
A
Figure1
B
10
20
30
40
50
60
70
-30 60 120 180
Hu
ng
er m
easu
red
by v
isu
al a
nal
og
ue
scal
e (m
m)
Time (min)
HC
PR subjects
TR subjects
* ¥ **
Page 26
26
Figure1
C
-40
-35
-30
-25
-20
-15
-10
-5
0
5
10
0 60 120 180
Ch
ang
es i
n t
he
hu
ng
er r
atin
gs
mea
sure
d
by
vis
ual
an
alo
gue
scal
e co
mp
ared
to
-30
min
rat
ing
s (
mm
)
Time (min)
HC
PR subjects
TR subjects
Page 27
27
Figure 1
D
10
20
30
40
50
60
70
-30 60 120 180
Pro
spec
tiv
eam
ou
nt o
f f
oo
d i
nta
ke
mea
sure
d b
y V
isu
al a
nal
og
ue
scal
e
(mm
)
Time(min)
HC
PR subjects
TR subjects
*
¥
**
Page 28
28
E
-45
-35
-25
-15
-5
5
15
0 60 120 180
Ch
ang
es i
n t
he
pro
spec
tiv
e a
mo
un
t o
f
foo
d i
nta
ke
mea
sure
d b
y v
isu
al
anal
og
ue
scal
e c
om
par
ed t
o -
30
min
rati
ng
s(m
m)
Time (min)
HC
PR subjects
TR subjects
Page 29
29
Figure 1
20
40
60
80
100
120
140
160
180
-30 60 120 180
Ple
asan
tnes
s m
easu
red
by v
isu
al
anal
og
ue
scal
e (m
m)
Time (min)
TR subjects
PR subjects
HC
Page 30
30
F
Figure 1
A
-35.0
-30.0
-25.0
-20.0
-15.0
-10.0
-5.0
0.0
5.0
10.0
15.0
0 60 120 180
Ch
ang
es i
n t
he
ple
asan
tnes
s m
easu
red
by
vis
ual
an
alo
gue
scal
e co
mp
ared
to
-3
0m
in
rati
ng
s
Time (min)
HC
PR subjects
TR subjects
**
Page 31
31
Figure 2
B
52
57
62
67
72
tastiness pleasantness palatability
Tas
tin
ess
ple
asen
tnes
s p
alat
abil
ity
mea
sure
d b
y t
he
vis
ual
an
alog
ue
scal
e(m
m)
HC
PR
TR*
*
*
*
*
*
*
Page 32
32
Figure 2
A
0
100
200
300
400
500
600
700
800
900
HC PR TR
En
erg
y i
nta
ke
bu
ffet
mea
l (
kca
l)
¥ **
Page 33
33
Figure 3
B
0
20
40
60
80
100
120
140
-30 60 120 180
Cir
cula
tin
g g
ut
ho
rmo
ne
lev
els
pm
ol/
L
Time (min)
GLP1 HC
GLP1 PR
GLP1 TR
PYY HC
PYY PR
PYY TR
Page 34
34
Figure 3
C
0
500
1000
1500
2000
2500
30-60 60-120 120-180 Total
IAU
C f
or
PY
Y (
pm
ol/
L*
min
)
Time interval (min)
HC PR subjects
TR subjects
-
Page 35
35
Figure 3
0
1000
2000
3000
4000
5000
6000
7000
30-60 60-120 120-180 Total
Time interval (min)
HC
PR subjects
TR subjects
IAU
C fo
r G
LP
1(p
mo
l/L
*m
in)
- -
-