www.iaset.us [email protected]
SURFACE FRICTION IN OPEN CHANNEL
BIRENDRA KUMAR SINGH & ANAND KUMAR SINHA
Department of Civil Engineering, Birla Institute of Technology, Mesra, Ranchi, Jharkhand, India
ABSTRACT
Roughness depends upon size of the roughness material. Since D50 are more for 2.5 inch roughness bed as
compared to 2.0 inch roughness bed hence lesser value of
50D
d and
84D
dindicate more roughness. There is less size of
2.0 inch roughness bed which is not submerged as compared to 2.5 inch roughness bed and function of effective roughness
concentration depends upon wetted frontal cross sectional area i.e. wetted frontal cross sectional area is more for 2.0 inch
roughness bed hence function of effective roughness concentration is more for 2.0 inch roughness bed as compared to
2.5 inch roughness.
Subject Headings: Boulders, Channels, Drag, Flow resistance, Flumes
KEYWORDS: Friction Factor, Hydraulic Geometry, Roughness
INTRODUCTION
For large scale roughness
50D
d<2 and
84D
d <1.2 where d is the mean depth of flow and D50= the size of the
median axis which is bigger than or equal to 50% of median axis. Similarly D84 = The size of the median axis which is
bigger than or equal to 84% of median axis. Similarly for Intermediate Scale roughness 2<
50D
d <7.5 and 1.2 <
84D
d
<4. Hence both the roughness bed provide large scale roughness.
Experimental Set up and Procedures: Data were obtained for 2.0 inch and 2.5 inch roughness bed.
Flume: The flume is open and 1.168m wide and 9.54 m long. Each roughness bed was constructed by smearing
masonite boards with fiberglass resin. The boards were then screwed to the bed of the flume.
Experimental Procedure: For each bed, five to seven flows were measured for three different slopes
(2,5 and 8%). At each flow, depth was gaged at a single cross section, so that mean flow and channel properties could be
calculated. In flow with large- scale roughness, the cross- sectional area of flow is significantly affected by the projections
of the elements into the flow.
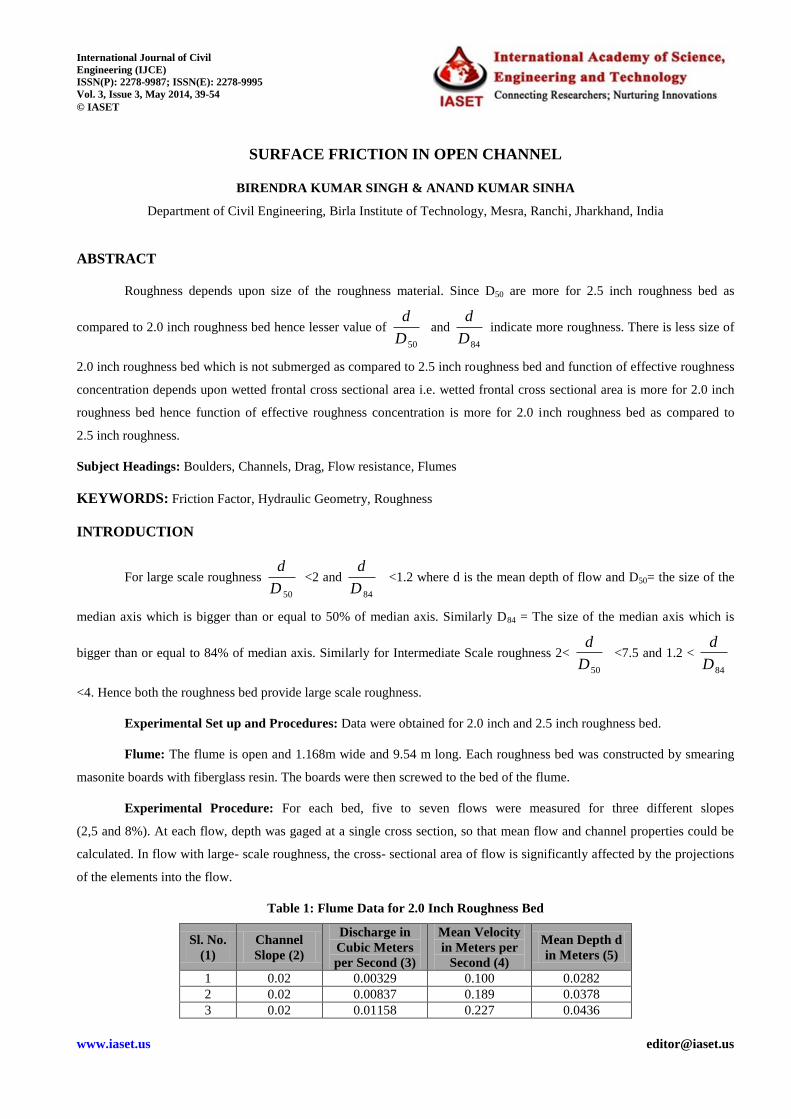
Table 1: Flume Data for 2.0 Inch Roughness Bed
Sl. No.
(1)
Channel
Slope (2)
Discharge in
Cubic Meters
per Second (3)
Mean Velocity
in Meters per
Second (4)
Mean Depth d
in Meters (5)
1 0.02 0.00329 0.100 0.0282
2 0.02 0.00837 0.189 0.0378
3 0.02 0.01158 0.227 0.0436
International Journal of Civil
Engineering (IJCE)
ISSN(P): 2278-9987; ISSN(E): 2278-9995
Vol. 3, Issue 3, May 2014, 39-54
© IASET
40 Birendra Kumar Singh & Anand Kumar Sinha
Impact Factor (JCC): 2.6676 Index Copernicus Value (ICV): 3.0
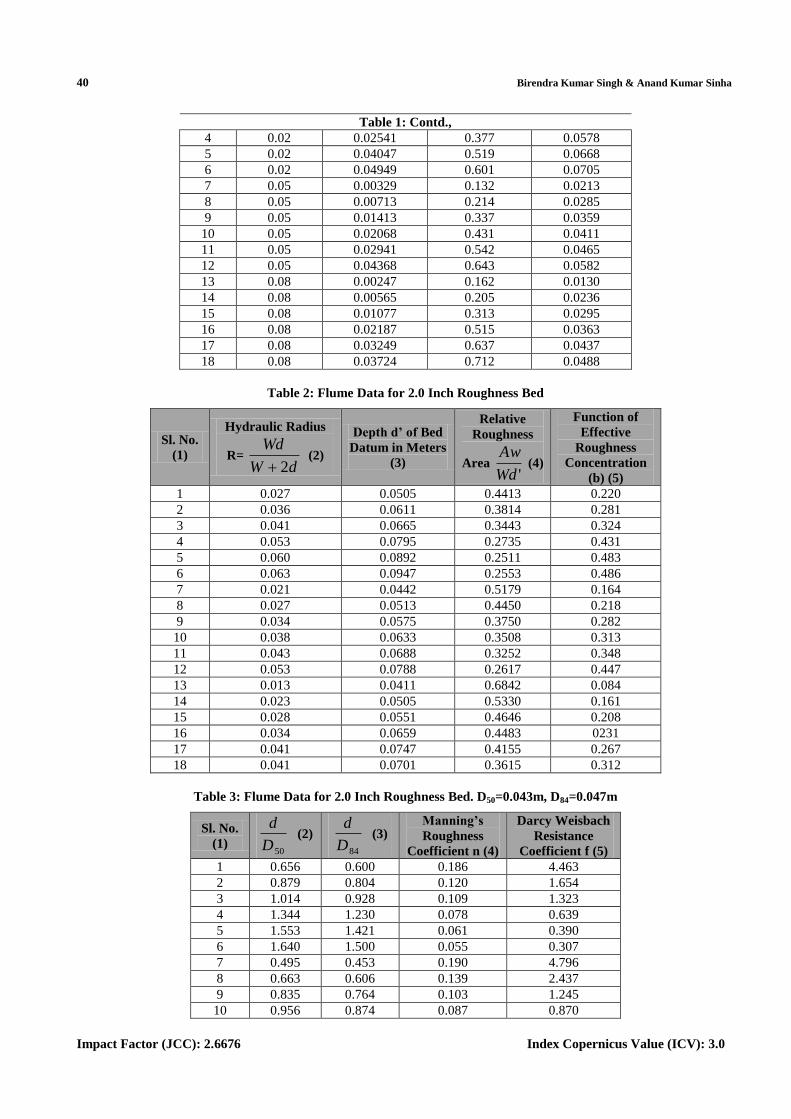
Table 1: Contd.,
4 0.02 0.02541 0.377 0.0578
5 0.02 0.04047 0.519 0.0668
6 0.02 0.04949 0.601 0.0705
7 0.05 0.00329 0.132 0.0213
8 0.05 0.00713 0.214 0.0285
9 0.05 0.01413 0.337 0.0359
10 0.05 0.02068 0.431 0.0411
11 0.05 0.02941 0.542 0.0465
12 0.05 0.04368 0.643 0.0582
13 0.08 0.00247 0.162 0.0130
14 0.08 0.00565 0.205 0.0236
15 0.08 0.01077 0.313 0.0295
16 0.08 0.02187 0.515 0.0363
17 0.08 0.03249 0.637 0.0437
18 0.08 0.03724 0.712 0.0488
Table 2: Flume Data for 2.0 Inch Roughness Bed
Sl. No.
(1)
Hydraulic Radius
R= dW
Wd
2(2)
Depth d’ of Bed
Datum in Meters
(3)
Relative
Roughness
Area 'Wd
Aw(4)
Function of
Effective
Roughness
Concentration
(b) (5)
1 0.027 0.0505 0.4413 0.220
2 0.036 0.0611 0.3814 0.281
3 0.041 0.0665 0.3443 0.324
4 0.053 0.0795 0.2735 0.431
5 0.060 0.0892 0.2511 0.483
6 0.063 0.0947 0.2553 0.486
7 0.021 0.0442 0.5179 0.164
8 0.027 0.0513 0.4450 0.218
9 0.034 0.0575 0.3750 0.282
10 0.038 0.0633 0.3508 0.313
11 0.043 0.0688 0.3252 0.348
12 0.053 0.0788 0.2617 0.447
13 0.013 0.0411 0.6842 0.084
14 0.023 0.0505 0.5330 0.161
15 0.028 0.0551 0.4646 0.208
16 0.034 0.0659 0.4483 0231
17 0.041 0.0747 0.4155 0.267
18 0.041 0.0701 0.3615 0.312
Table 3: Flume Data for 2.0 Inch Roughness Bed. D50=0.043m, D84=0.047m
Sl. No.
(1) 50D
d (2)
84D
d (3)
Manning’s
Roughness
Coefficient n (4)
Darcy Weisbach
Resistance
Coefficient f (5)
1 0.656 0.600 0.186 4.463
2 0.879 0.804 0.120 1.654
3 1.014 0.928 0.109 1.323
4 1.344 1.230 0.078 0.639
5 1.553 1.421 0.061 0.390
6 1.640 1.500 0.055 0.307
7 0.495 0.453 0.190 4.796
8 0.663 0.606 0.139 2.437
9 0.835 0.764 0.103 1.245
10 0.956 0.874 0.087 0.870
Surface Friction in Open Channel 41
www.iaset.us [email protected]
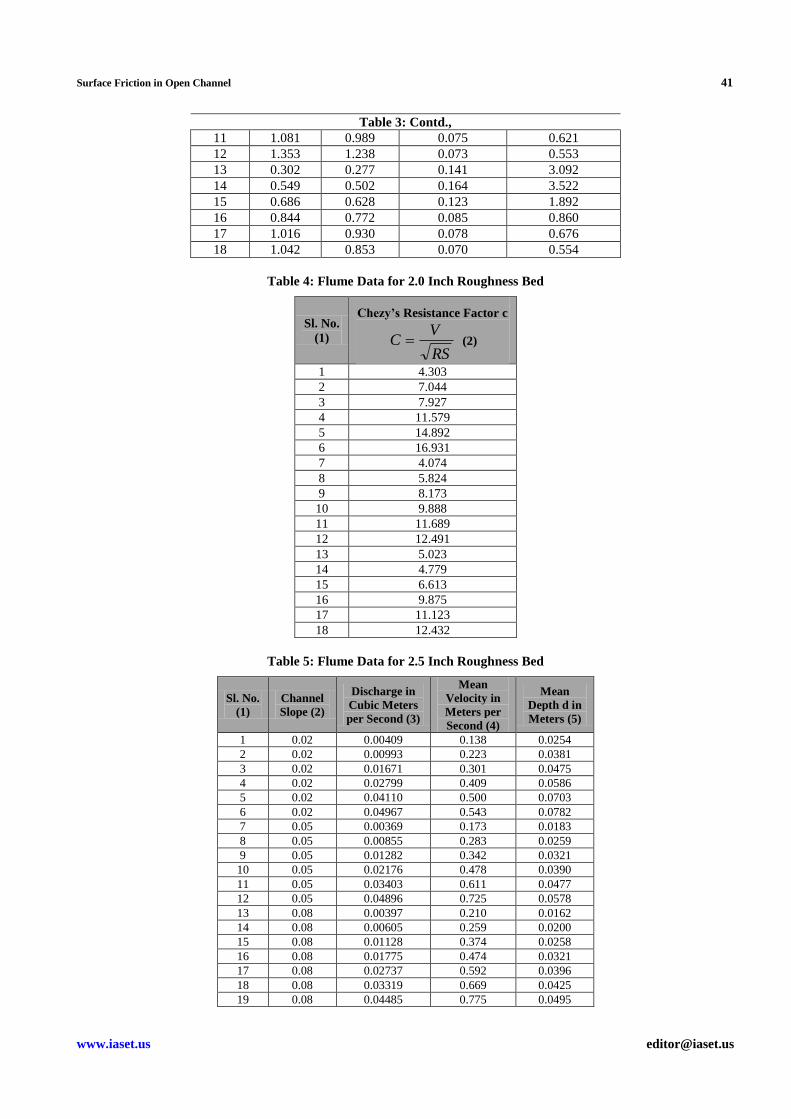
Table 3: Contd.,
11 1.081 0.989 0.075 0.621
12 1.353 1.238 0.073 0.553
13 0.302 0.277 0.141 3.092
14 0.549 0.502 0.164 3.522
15 0.686 0.628 0.123 1.892
16 0.844 0.772 0.085 0.860
17 1.016 0.930 0.078 0.676
18 1.042 0.853 0.070 0.554
Table 4: Flume Data for 2.0 Inch Roughness Bed
Sl. No.
(1)
Chezy’s Resistance Factor c
RS
VC (2)
1 4.303
2 7.044
3 7.927
4 11.579
5 14.892
6 16.931
7 4.074
8 5.824
9 8.173
10 9.888
11 11.689
12 12.491
13 5.023
14 4.779
15 6.613
16 9.875
17 11.123
18 12.432
Table 5: Flume Data for 2.5 Inch Roughness Bed
Sl. No.
(1)
Channel
Slope (2)
Discharge in
Cubic Meters
per Second (3)
Mean
Velocity in
Meters per
Second (4)
Mean
Depth d in
Meters (5)
1 0.02 0.00409 0.138 0.0254
2 0.02 0.00993 0.223 0.0381
3 0.02 0.01671 0.301 0.0475
4 0.02 0.02799 0.409 0.0586
5 0.02 0.04110 0.500 0.0703
6 0.02 0.04967 0.543 0.0782
7 0.05 0.00369 0.173 0.0183
8 0.05 0.00855 0.283 0.0259
9 0.05 0.01282 0.342 0.0321
10 0.05 0.02176 0.478 0.0390
11 0.05 0.03403 0.611 0.0477
12 0.05 0.04896 0.725 0.0578
13 0.08 0.00397 0.210 0.0162
14 0.08 0.00605 0.259 0.0200
15 0.08 0.01128 0.374 0.0258
16 0.08 0.01775 0.474 0.0321
17 0.08 0.02737 0.592 0.0396
18 0.08 0.03319 0.669 0.0425
19 0.08 0.04485 0.775 0.0495
42 Birendra Kumar Singh & Anand Kumar Sinha
Impact Factor (JCC): 2.6676 Index Copernicus Value (ICV): 3.0
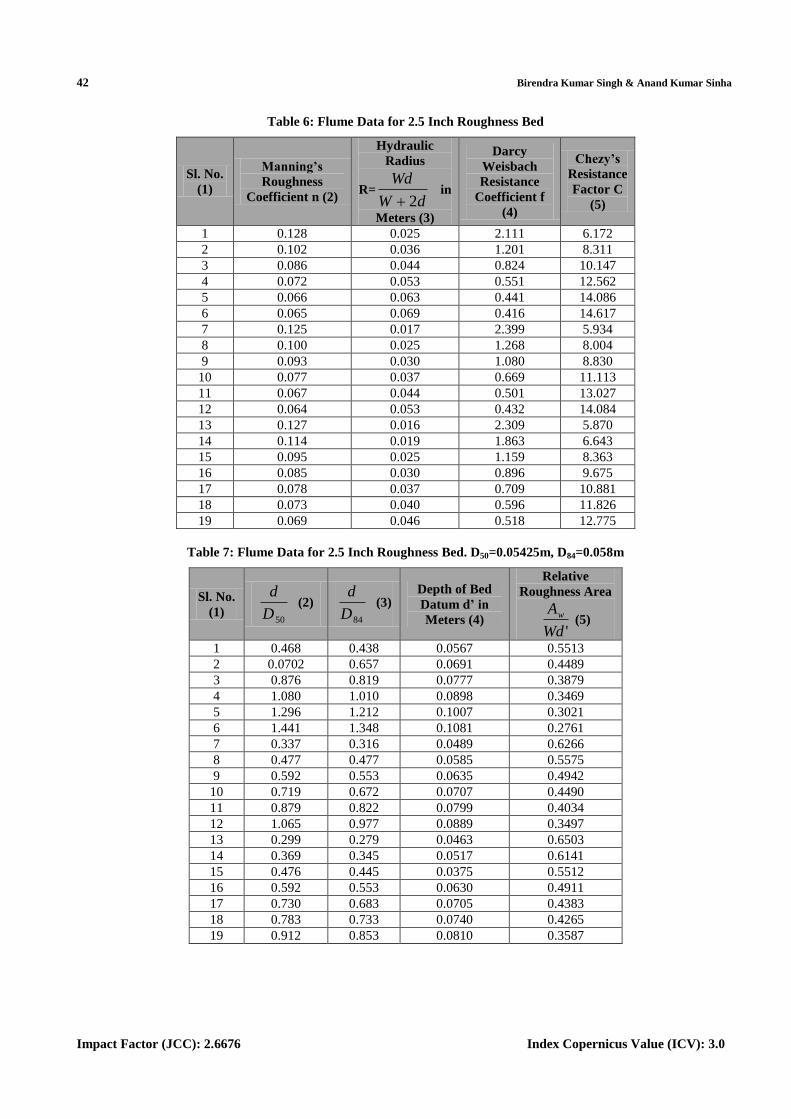
Table 6: Flume Data for 2.5 Inch Roughness Bed
Sl. No.
(1)
Manning’s
Roughness
Coefficient n (2)
Hydraulic
Radius
R=dW
Wd
2
in
Meters (3)
Darcy
Weisbach
Resistance
Coefficient f
(4)
Chezy’s
Resistance
Factor C
(5)
1 0.128 0.025 2.111 6.172
2 0.102 0.036 1.201 8.311
3 0.086 0.044 0.824 10.147
4 0.072 0.053 0.551 12.562
5 0.066 0.063 0.441 14.086
6 0.065 0.069 0.416 14.617
7 0.125 0.017 2.399 5.934
8 0.100 0.025 1.268 8.004
9 0.093 0.030 1.080 8.830
10 0.077 0.037 0.669 11.113
11 0.067 0.044 0.501 13.027
12 0.064 0.053 0.432 14.084
13 0.127 0.016 2.309 5.870
14 0.114 0.019 1.863 6.643
15 0.095 0.025 1.159 8.363
16 0.085 0.030 0.896 9.675
17 0.078 0.037 0.709 10.881
18 0.073 0.040 0.596 11.826
19 0.069 0.046 0.518 12.775
Table 7: Flume Data for 2.5 Inch Roughness Bed. D50=0.05425m, D84=0.058m
Sl. No.
(1) 50D
d (2)
84D
d (3)
Depth of Bed
Datum d’ in
Meters (4)
Relative
Roughness Area
'Wd
Aw(5)
1 0.468 0.438 0.0567 0.5513
2 0.0702 0.657 0.0691 0.4489
3 0.876 0.819 0.0777 0.3879
4 1.080 1.010 0.0898 0.3469
5 1.296 1.212 0.1007 0.3021
6 1.441 1.348 0.1081 0.2761
7 0.337 0.316 0.0489 0.6266
8 0.477 0.477 0.0585 0.5575
9 0.592 0.553 0.0635 0.4942
10 0.719 0.672 0.0707 0.4490
11 0.879 0.822 0.0799 0.4034
12 1.065 0.977 0.0889 0.3497
13 0.299 0.279 0.0463 0.6503
14 0.369 0.345 0.0517 0.6141
15 0.476 0.445 0.0375 0.5512
16 0.592 0.553 0.0630 0.4911
17 0.730 0.683 0.0705 0.4383
18 0.783 0.733 0.0740 0.4265
19 0.912 0.853 0.0810 0.3587
Surface Friction in Open Channel 43
www.iaset.us [email protected]
Table 8: Flume Data for 2.5 Inch Roughness Bed
Sl. No.
(1)
Function of Effective
Roughness
Concentration (b) (2)
1 0.156
2 0.234
3 0.295
4 0.354
5 0.426
6 0.476
7 0.112
8 0.154
9 0.196
10 0.236
11 0.284
12 0.349
13 0.101
14 0.120
15 0.156
16 0.198
17 0.244
18 0.257
19 0.299
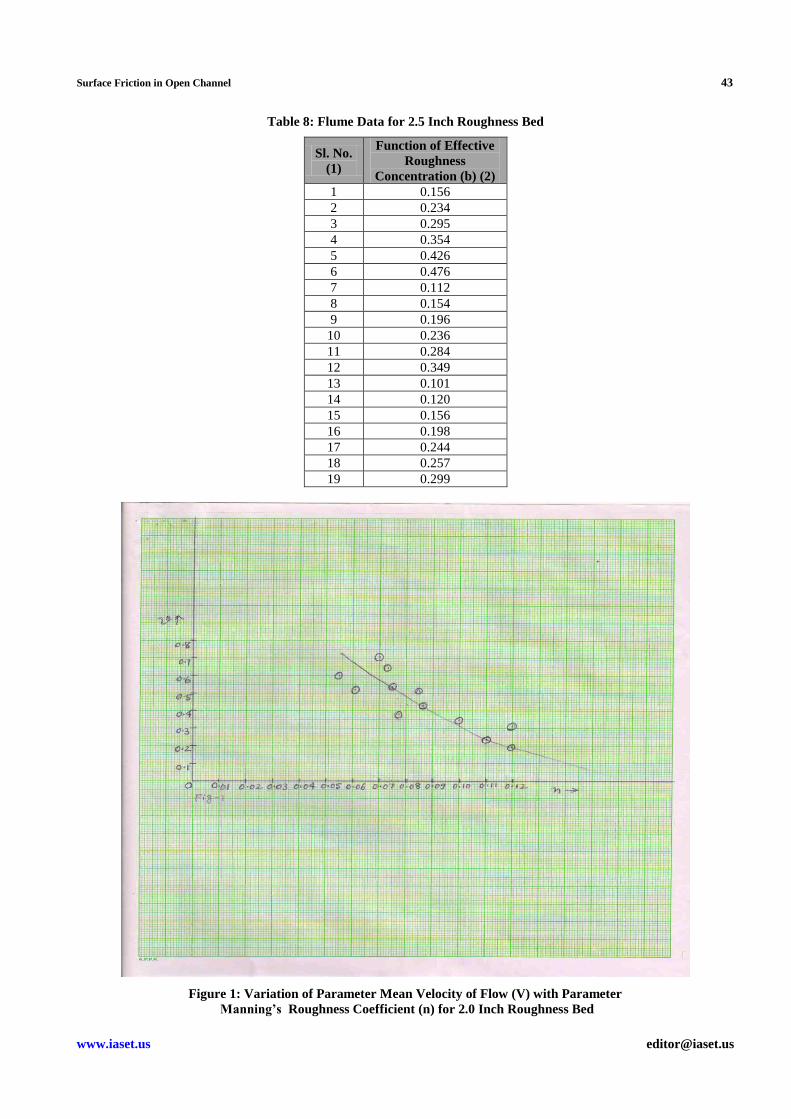
Figure 1: Variation of Parameter Mean Velocity of Flow (V) with Parameter
Manning’s Roughness Coefficient (n) for 2.0 Inch Roughness Bed
44 Birendra Kumar Singh & Anand Kumar Sinha
Impact Factor (JCC): 2.6676 Index Copernicus Value (ICV): 3.0
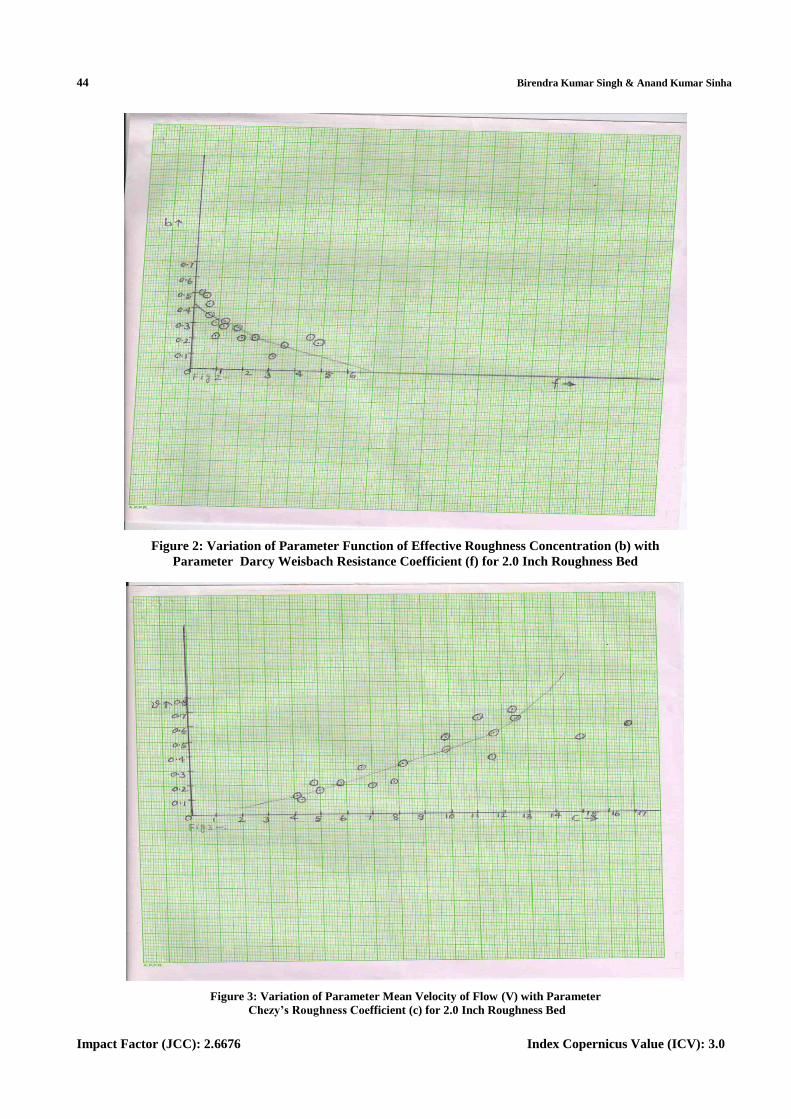
Figure 2: Variation of Parameter Function of Effective Roughness Concentration (b) with
Parameter Darcy Weisbach Resistance Coefficient (f) for 2.0 Inch Roughness Bed
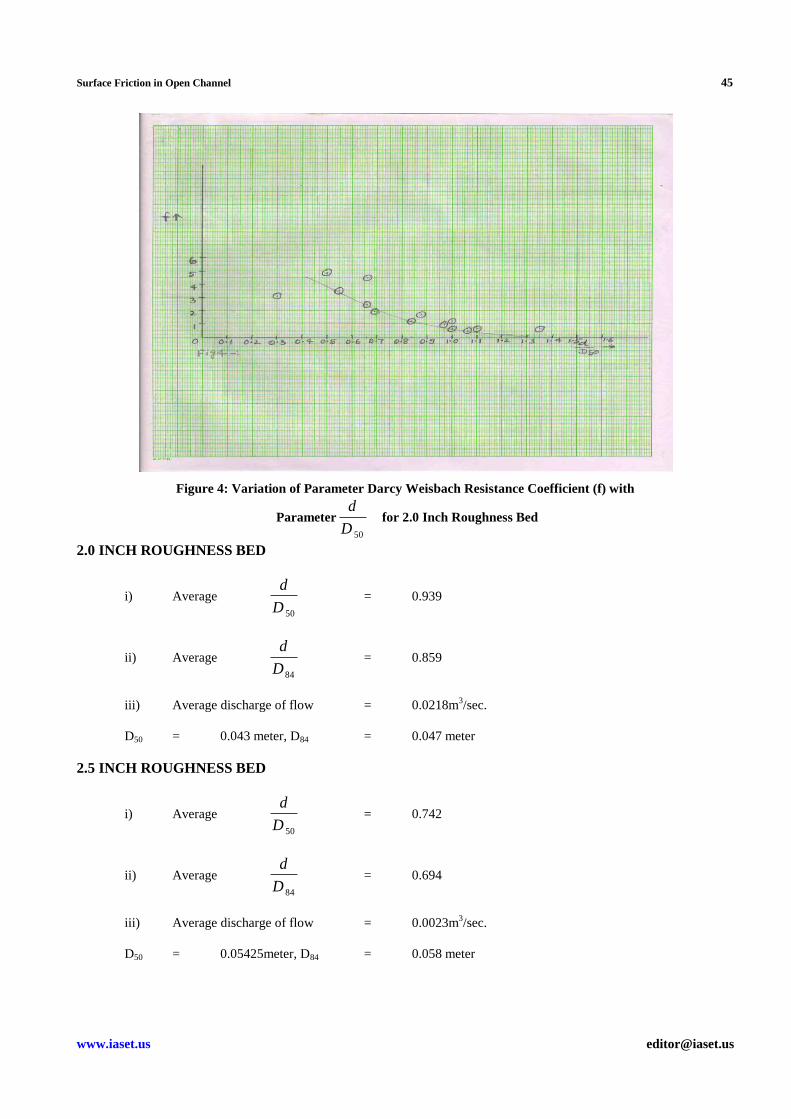
Figure 3: Variation of Parameter Mean Velocity of Flow (V) with Parameter
Chezy’s Roughness Coefficient (c) for 2.0 Inch Roughness Bed
Surface Friction in Open Channel 45
www.iaset.us [email protected]
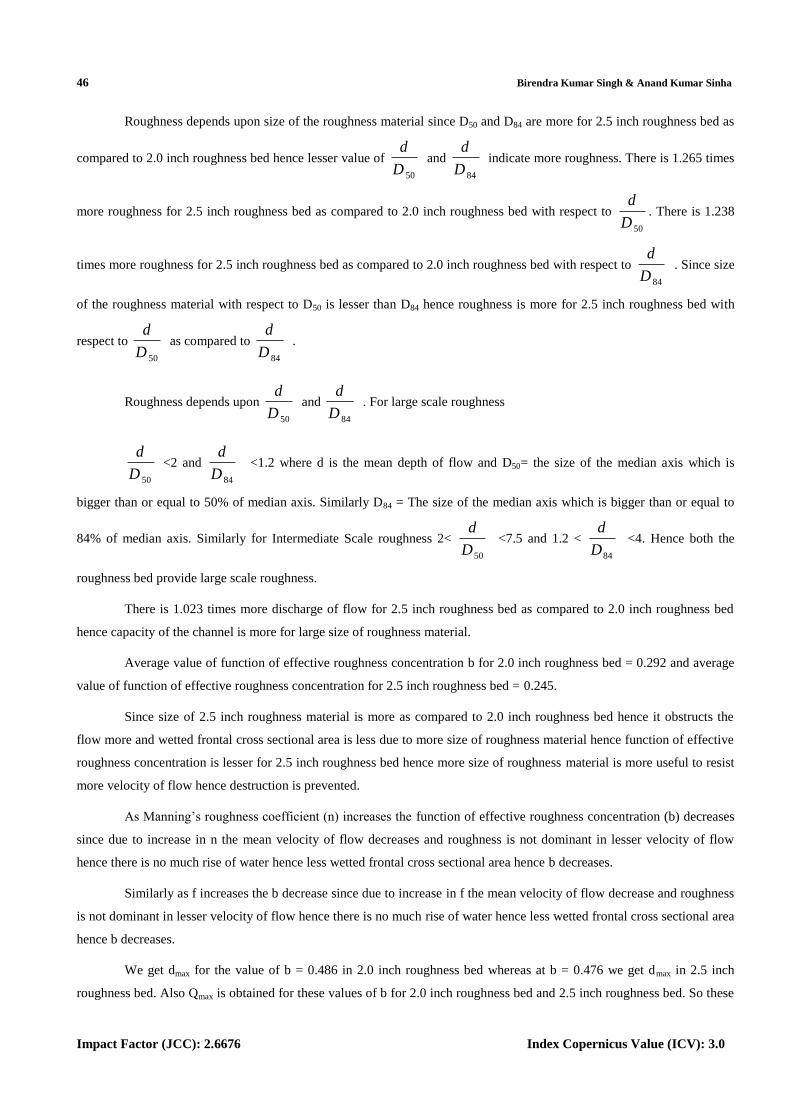
Figure 4: Variation of Parameter Darcy Weisbach Resistance Coefficient (f) with
Parameter
50D
d for 2.0 Inch Roughness Bed
2.0 INCH ROUGHNESS BED
i) Average
50D
d = 0.939
ii) Average
84D
d = 0.859
iii) Average discharge of flow = 0.0218m3/sec.
D50 = 0.043 meter, D84 = 0.047 meter
2.5 INCH ROUGHNESS BED
i) Average
50D
d = 0.742
ii) Average
84D
d = 0.694
iii) Average discharge of flow = 0.0023m3/sec.
D50 = 0.05425meter, D84 = 0.058 meter
46 Birendra Kumar Singh & Anand Kumar Sinha
Impact Factor (JCC): 2.6676 Index Copernicus Value (ICV): 3.0
Roughness depends upon size of the roughness material since D50 and D84 are more for 2.5 inch roughness bed as
compared to 2.0 inch roughness bed hence lesser value of
50D
dand
84D
dindicate more roughness. There is 1.265 times
more roughness for 2.5 inch roughness bed as compared to 2.0 inch roughness bed with respect to
50D
d. There is 1.238
times more roughness for 2.5 inch roughness bed as compared to 2.0 inch roughness bed with respect to
84D
d. Since size
of the roughness material with respect to D50 is lesser than D84 hence roughness is more for 2.5 inch roughness bed with
respect to
50D
das compared to
84D
d.
Roughness depends upon
50D
dand
84D
d. For large scale roughness
50D
d<2 and
84D
d <1.2 where d is the mean depth of flow and D50= the size of the median axis which is
bigger than or equal to 50% of median axis. Similarly D84 = The size of the median axis which is bigger than or equal to
84% of median axis. Similarly for Intermediate Scale roughness 2<
50D
d <7.5 and 1.2 <
84D
d <4. Hence both the
roughness bed provide large scale roughness.
There is 1.023 times more discharge of flow for 2.5 inch roughness bed as compared to 2.0 inch roughness bed
hence capacity of the channel is more for large size of roughness material.
Average value of function of effective roughness concentration b for 2.0 inch roughness bed = 0.292 and average
value of function of effective roughness concentration for 2.5 inch roughness bed = 0.245.
Since size of 2.5 inch roughness material is more as compared to 2.0 inch roughness bed hence it obstructs the
flow more and wetted frontal cross sectional area is less due to more size of roughness material hence function of effective
roughness concentration is lesser for 2.5 inch roughness bed hence more size of roughness material is more useful to resist
more velocity of flow hence destruction is prevented.
As Manning’s roughness coefficient (n) increases the function of effective roughness concentration (b) decreases
since due to increase in n the mean velocity of flow decreases and roughness is not dominant in lesser velocity of flow
hence there is no much rise of water hence less wetted frontal cross sectional area hence b decreases.
Similarly as f increases the b decrease since due to increase in f the mean velocity of flow decrease and roughness
is not dominant in lesser velocity of flow hence there is no much rise of water hence less wetted frontal cross sectional area
hence b decreases.
We get dmax for the value of b = 0.486 in 2.0 inch roughness bed whereas at b = 0.476 we get dmax in 2.5 inch
roughness bed. Also Qmax is obtained for these values of b for 2.0 inch roughness bed and 2.5 inch roughness bed. So these
Surface Friction in Open Channel 47
www.iaset.us [email protected]
are the specific values of b to get dmax & Qmax. At lesser value of b we get dmax & Qmax for 2.5 inch roughness bed that is
velocity of flow is much reduced due to larger size of roughness material and depth of flow is more and capacity of the
channel is increased. So b = 0.476 will be effective value since we get more depth of flow & more discharge of flow.
As chezy’s resistance factor increases it means velocity of flow increases because chezy’s resistance factor (c)
depends upon velocity of flow (V) since V = C RS . As V increases the roughness is more effective hence there is
increase in depth of flow hence more wetted frontal cross sectional area is obtained hence as C increases b increases.
As C increases V increases since C depends upon V. Since resistance factor is more effective in high velocity of
flow hence as C increases V increases.
Since mean depth of flow is more for 2.0 inch roughness bed as compared to its size with respect to 2.5 inch
roughness bed hence we get more wetted frontal cross sectional area for 2.0 inch roughness bed hence function of effective
roughness concentration is more for 2.0 inch roughness bed as compared to 2.5 inch roughness bed. There is 1.192 times
more function of effective roughness concentration for 2.0 inch roughness bed as compared to 2.5 inch roughness bed.
There is 0.023m size of roughness material which is not submerged for 2.5 inch roughness material whereas there is
0.0104m size which is not submerged for 2.0 inch roughness material hence we get more function of effective roughness
concentration for 2.0 inch roughness bed since 2.0 inch roughness material = 0.0508 m and mean depth of flow = 0.0404m
whereas the size for 2.5 inch roughness material = 0.0635m and mean depth of flow= 0.0402 meter.
Average value of b = 0.292 for 2.0 inch roughness bed.
Average value of b = 0.245 for 2.5 inch roughness bed.
There is 1.192 times more function of effective roughness concentration (b) for 2.0 inch roughness bed as
compared to 2.5 inch roughness be.
As
50D
dincreases it means roughness decreases since roughness
50D
ddepends upon size of the roughness
material i.e. upon D50 and D84. Due to increase in size of the roughness material i.e. due to increase in D50 & D84 roughness
increases hence lesser value of
50D
dindicates more roughness. Hence due to increase in
50D
dvalue it indicates lesser
roughness hence as
50D
dincreases the Darcy Weisbach resistance coefficient decreases.
2.0 INCH ROUGHNESS BED
Relationship between Qmax and b, n, f and c:-
Qmax = 1.110(C) 0.541
– 1.664(b)0.601
– 0.509(n)1.964
-0.185(f)5.410
+2.426Q (1)
Relationship between Q and b, f, n and c:-
Q = 0.228(C) 0.926
– 1.072(b)0.933
– 0.524(f)1.909
-0.806(n)1.241
+ 426.2
maxQ (2)
48 Birendra Kumar Singh & Anand Kumar Sinha
Impact Factor (JCC): 2.6676 Index Copernicus Value (ICV): 3.0
Relationship between d with b, f, n and c:
d = 0.228(C)0.926
– 1.072 (b)0.933
– 0.524(f)1.909
-0.806(n)1.241
+ 745.1
maxd (3)
Relationship for V with b, n, f and c:-
V = 0.902(C)0.385
– 1.476(b)0.677
–0.722(n)1.385
-0.385(f)2.599
+ 869.1
maxV (4)
Relationship for Vmin with b, f, n and c:
Vmin = 0.035(C)2.127
– 0.753(b)1.327
–2.687(f)0.372
-1.722(n)0.581
+ 120.7
maxV (5)
Relationship between Qmax with b, n and f:
Qmax = 0.051(f)5.410
–0.509(n)1.964
–1.664(b)0.601
+2.426Q (6)
Relationship between n and f:
n = 0.057(f)1.255
(7)
Relationship between b and n:-
b = 21.627(n)0.900
(8)
Relationship between b and c:
b = 0.016(c)1.299
(9)
We know,
Qmax = 1.110(c)0.541
-1.664(b)0.601
-0.509(n)1.964
-0.185(f)5.410
+ 2.426 Q (1)
and
Qmax = 0.051(f)5.410
-0.509(n)1.964
-1.664(b)0.601
+ 2.426 Q (2)
From 1 & 2,
1.110(c)0.541
-1.664(b)0.601
-0.509(n)1.964
-0.185(f)5.410
(3)
= 0.051(f)5.410
-0.509(n)1.964
-1.664(b)0.601
From (9),
(c)1.299
= 016.0
6 =
016.0
1 x b = 62.5b (4)
299.1
1
5.62 bC = (62.5b)0.770
C = 24.145b0.770
(5)
Surface Friction in Open Channel 49
www.iaset.us [email protected]
Now 1.110 [24.145b0.770
]0.541
1.110 [24.145(21.627(n)0.900
)0.770
]0.541
= 1.110 [24.145(10.665n0.7623
)]0.541
= 1.110 [5.600(3.599n0.412
)]
= 1.110[20.154n0.412
]
= 22.371n0.412
1.664(b)0.601
= 1.664[21.627(n)0.900
]
= 1.662[6.344(n)0.541
]
= 10.556n0.541
0.185(f)5.410
= 0.185[9.808n0.797
]5.410
= 0.185[231446.32n4.312
]
= 42817.57n4.312
0.051(f)5.410
= 0.051[9.809n0.797
]5.410
= 0.051[231446.32n
4.312]
= 11803.76n4.312
1.664(b)0.601
= 1.664[21.627(n)0.900
]0.601
= 1.664[6.344n0.541
]
= 1.556n0.541
Now,
22.371n0.412
-42817.57n4.312
= 11.803.76n4.312
22.371n0.412
= 11803.76n4.312
+42817.57n4.312
= 54621.33n4.312
1371.22
33.5421412.0
312.4
n
n
Or 2.42.34n4.312-0.412
= 1
Or n3.900
= 0041.034.242
1
n = 900.3
1
0041.0
50 Birendra Kumar Singh & Anand Kumar Sinha
Impact Factor (JCC): 2.6676 Index Copernicus Value (ICV): 3.0
= (0.0041)0.256
= 0.2450.108
Mathematical Formulation for Q
Qmax = 1.110(c)0.541
-1.664(b)0.601
-0.509(n)1.964
-0.185(f)5.410
+2.426 Q (1)
Q = 0.228(c)0.926
-1.072(b)0.933
-0.524(f)1.909
-0.806(n)1.241
+ 426.2
maxQ (2)
Substituting Qmax from 1 in 2
Q = 0.228(c)0.926
-1.072(b)0.933
-0.524(f)1.909
-0.806(n)1.241
+ 426.2
1 [1.110(c)
0.541-1.664(b)
0.601-0.509(n)
1.964-
0.185(f)5.410
+2.426 Q]
= 0.228[24.145(b)0.770
]0.926
-1.072(b)0.933
-0.524(f)1.909
-0.806[0.057(f)1.255
]1.241
+ 426.2
1 [1.110 (24.145
(b)0.770
)0.541
] -1.664 (b)0.601
-0.509 (0.057(f)1.255
)1.964
-0.185(f)5.410
+ 2.426 Q ]
Substituting the average value of b, f, and Q in the above equation we gat:
Q = 0.228[19.076(b)0.713
]-1.702x0.317-1.3804-0.806[0.0286(1.661)1.557
]+ 426.2
1 [1.110(5.599(0.292)
0.417)-
0.794-0.509(0.0036(1.661)2.465
)-2.880+2.426 Q ]
Q = 1.808-0.340-1.3804-0.0508+ 426.2
1 [3.720-0.794-0.0064-2.880+0.04949]
= 0.0728+ 426.2
1 [3.7695-3.6804]
= 0.0728+0.0367 = 0.110 0.04949
Mathematical formulation for V:
V = 0.902( C)0.385
-1.476(b)0.677
-0.722(n)1.385
-0.385(f)2.599
+ 869.1
maxV (1)
Vmin = 0.035(C)2.127
-0.753(b)1.327
-2.687(f)0.372
-1.722(n)0.581
+ 120.7
maxV (2)
From (2)
120.7
maxV=Vmin-0.035 (C)
2.127+0.753(b)
1.327+2.687(f)
0.372+1.722n)
0.581
Vmax = 7.120[Vmin-0.035(C)2.127
+0.753(b)1.327
+2.687(f)0.372
+1.722(n)0.581
]
= 7.120 Vmin-0.2492(C)2.127
+5.361(b)1.327
+19.131(f)0.372
+12.261(n)0.581
Surface Friction in Open Channel 51
www.iaset.us [email protected]
Substituting Vmax in (1) we get:
V = 0.902(C)0.385
-1.476(b)0.677
-0.722(n)1.385
-0.385(f)2.599
+869.1
1
[7.120Vmin-0.249(C)2.127
+5.361(b)1.327
+19.131(f)0.372
+12.261(n)0.581
]
Substituting the average values of c, b, n & f and Vmin we get:-
V = 0.902(9.153)0.385
-1.476(0.292)0.677
-0.722(0.108)1.385
-0.385(1.661)2.599
+ 869.1
1
[7.120x0.100-0.2492(9.153)2.127
+ 5.361(0.292)1.327
+19.131(1.661)0.372
+12.261(0.108)0.581
]
=2.115-0.641-0.033-1.438 +869.1
1 [0.712-27.656+1.047+23.105+3.365]
= 2.115-2.113 + 869.1
1 [28.229-27.656]
= 0.002+0.307 = 0.309m/sec 0.381m/sec
Hence this is the required mathematical formulation for V.
CONCLUSIONS
There is 1.265 times more roughness for 2.5 inch roughness bed as compared to 2.0 inch roughness bed with
respect to
50D
d . There is 1.238 times more roughness for 2.5 inch roughness bed as compared to 2.0 inch roughness bed
with respect to
84D
d . As Manning’s roughness coefficient (n) increases the function of effective roughness concentration
(b) decreases because due to increase in n velocity of flow decreases and roughness is not so effective in low velocity of
flow to raise more depth of flow. Hence wetted frontal cross sectional area is less hence function of effective roughness
concentration decreases due to increase in n. As V increases the roughness is more effective hence chezy’s resistance factor
C & function of effective roughness concentration b both increase.
REFERENCES
1. A Caroglu, E.R (1972) “Friction factors is solid material systems “J. Hydraulic Div. Am. SOC. Civ. Eng,
98 (HY 4), 681 – 699
2. Alam, A.M.Z. and Kennedy J.F (1969)” Friction factors for flow in sand bed channels “J Hydraulic Div. Am.
SOC Civ. Eng 95(HY 6), 1973 – 1992
3. Ben Chie Yen F. (January 1.2002) “Open channel flow resistance” Journal of the Hydraulic Engg. Vol 128,
No – 1 ASCE, PP, 20 – 39
52 Birendra Kumar Singh & Anand Kumar Sinha
Impact Factor (JCC): 2.6676 Index Copernicus Value (ICV): 3.0
4. Bray, D.I.(1979) “Estimating average velocity in gravel bed – rivers “J Hydraulic Div. Am. SOC Civ. Eng. 105
(HY 9), 1103 - 1122
5. Griffiths, G.A. (1981) “Flow resistance in course gravel bed rivers “J. Hydraulic Div. An soc. Civ. Eng. 107
(HY – 7), 899 – 918
6. Hey R.D (1979) “Flow resistance in gravel bed rivers “J Hydraulic Div Am SOC CIV Eng, 105 (HY – 4),
365 – 379.
7. James C. Batharst (December 1981) “Resistance Equation for Large Scale Ranghnen” Journal of the Hydraulics
Division, American Society of Civil Engineers, Vol. 107 NO HY 12, PP 1593-1613.
8. James C. Bathurst (December 1978) “ Flow resistance of large-scale roughness”
9. Journal of the Hydraulic Division Vol 104NO12PP1587-1603
10. Lovera, F. and kennedy J.F (1969) “Friction factors for flat – bed flows in sand channel” J Hydraulic Div, Am.
Soc. Civ Eng 95 (HY 4) 1227 – 1234.
11. Petryk, S. and shen, H.W (1971) “Direct measurement of sheer strem in a flume, “J Hydraulic Div. Am. SOC.
Civ. Eng. 97(HY – 6), 883 – 887
APPENDICES: NOTATION
The following symbols are used in this paper:
'Wd
Aw = Relative roughness area
Aw = Wetted cross sectional area
b = Function of effective roughness concentration
C = Chezy’s resistance factor
d = Mean depth of flow in meters
d’ = Depth of bed datum in meters.
D50 = The size of median axis which is bigger than or equal to 50% of median axis.
D84 = The size of median axis which is bigger than or equal to 84% of median axis.
f = Darcy Weisbach resistance coefficient
g = Acceleration due to gravity
n = Manning’s roughness coefficient
P = Wetted Perimeter
Q = Discharge in cubic meters per second
Surface Friction in Open Channel 53
www.iaset.us [email protected]
R = Hydraulic radius = p
A
A = Flow cross sectional area = Wd
P = Wetted Perimeter
S = Channel slope
V = Mean velocity of flow in meters per second.
W = Width of the channel = 1.168m
Formula Used
'Wd
Aw =
b
d
w
21
8
f=
21
)(gRS
V
Hydraulic radius R =dW
Wd
2
V = 21
3249.1
SRn
V = RSC
R = P
A=
dW
Wd
2
A+Aw = Wd’