Page 1
1
Decomposition of terrestrial resource subsidies in headwater streams: does consumer diversity 1
matter? 2
3
David Stoker,1† Amber J. Falkner,1 Kelly M. Murray,2 Ashley K. Lang,1,4 Thomas R. Barnum,1,5 4
Jeffrey Hepinstall-Cymerman,3 Michael J. Conroy,3 Robert J. Cooper,3 and Catherine M. 5
Pringle1 6
7
1Odum School of Ecology, University of Georgia, Athens, Georgia 30602 USA 8
2Department of Entomology, University of Georgia, Athens, Georgia 30602 USA 9
3Warnell School of Forestry and Natural Resources, University of Georgia, Athens, Georgia 10
30602 USA 11
12
4Present Address: Department of Biological Sciences, Dartmouth College, Hanover, New 13
Hampshire 03755 USA 14
5Present Address: Smithsonian Environmental Research Center, Edgewater, Maryland 21037 15
USA 16
17
† E-mail: [email protected] 18
19
Page 2
2
Abstract 20
Resource subsidies and biodiversity are essential for maintaining community structure 21
and ecosystem functioning, but the relative importance of consumer diversity and resource 22
characteristics to decomposition remains unclear. Forested headwater streams are detritus-based 23
systems, dependent on leaf litter inputs from adjacent riparian ecosystems, and decomposition of 24
these resources is an important ecosystem function. Here, we examined the effects of consumer 25
community diversity on leaf decomposition in a reciprocal transplant experiment. We asked: (1) 26
if stream consumer communities are adapted to local resources, and (2) how functional trait 27
diversity among communities affects the leaf decomposition process. We did not find evidence 28
that communities were adapted to locally-derived resource subsidies. Instead, we found that 29
consumer biomass, functional trait diversity, and resource characteristics were the primary biotic 30
drivers of decomposition. Consumer biomass was stimulated by specific resource subsidies, 31
leading to direct and indirect effects of resource subsidies on ecosystem functioning. Contrary to 32
current theory, we show that decomposition was higher with decreased detritivore functional 33
diversity, suggesting dominant traits encompassing a specific niche increased decomposition. We 34
also show that top-down, consumer diversity effects can be equal in magnitude to the bottom-up 35
effects of resource characteristics during the decomposition process. Our research illustrates the 36
importance of considering multiple biotic and abiotic drivers interacting via multiple pathways to 37
affect a crucial ecosystem function. 38
Key Words 39
Aquatic ecology; biodiversity and ecosystem functioning; Coweeta Hydrologic Laboratory, 40
North Carolina, USA; detritus; functional diversity; structural equation modeling; terrestrial-41
aquatic linkage. 42
Page 3
3
Introduction 43
Resource subsidies are pervasive across aquatic and terrestrial ecosystems (Polis et al. 44
1997, Marcarelli et al. 2011). These fluxes of energy and nutrients can structure food webs, 45
shape species interactions (Richardson and Sato 2015), and affect ecosystem functioning, such as 46
primary production and energy flow between trophic levels (Marcarelli et al. 2011). An 47
important ecosystem function in many systems is the decomposition of detrital resources. 48
Detritus is frequently transferred between terrestrial ecosystems and between terrestrial and 49
aquatic ecosystems (Polis et al. 1997), forming the base of many food webs (Cebrian 1999). 50
Detritus is also important for maintaining community stability and biodiversity (Moore et al. 51
2004), which can have cascading effects as biodiversity is essential for maintaining ecosystem 52
processes (Hooper et al. 2005). Extensive biodiversity and ecosystem functioning research 53
notwithstanding, the relative importance of different components of biodiversity for 54
decomposition remains unclear. 55
Decomposition is often more predictably affected by consumer diversity than detrital 56
diversity (Srivastava et al. 2009, Gessner et al. 2010). One measure of consumer diversity is 57
intraspecific variation within communities. Intraspecific variation can arise due to spatial 58
variation in environmental context and interspecific interactions (Thompson 2005), whereby 59
consumers adapt to local environmental conditions and energy sources. For example, resource 60
subsidies can differ in composition and characteristics, which can result in consumers receiving 61
and adapting to different resources depending on spatial location (Kominoski et al. 2011, Jackrel 62
and Wootton 2015b, Jackrel et al. 2016). Adaptation can occur through phenotypic or genotypic 63
shifts within populations and through changes in community composition (Jackrel and Wootton 64
2014). Evidence from terrestrial and aquatic systems suggests that consumers have adapted to 65
Page 4
4
local environments and resource subsidies, resulting in increased decomposition of locally-66
derived detritus by soil microbial communities (Ayres et al. 2009, Strickland et al. 2009) and by 67
stream microbial and invertebrate communities (Kominoski et al. 2011, Jackrel and Wootton 68
2014); however, evidence regarding the contribution of local adaptation to the decomposition 69
process compared to other biotic and abiotic drivers is limited. 70
Another measure of consumer diversity is interspecific variation among communities. 71
Interspecific variation can arise from biotic and abiotic filters acting on community assembly 72
(Poff 1997, Wisz et al. 2013). These filters can result in communities differing in composition 73
(Villéger et al. 2010, Hough-Snee et al. 2015) and in the presence and distribution of functional 74
traits (Villéger et al. 2010, Mouillot et al. 2013). Functional traits affect organismal performance 75
in relation to habitat and resource use, and can be used to link community functional diversity to 76
ecosystem processes (Hooper et al. 2005, Petchey and Gaston 2006). Understanding how species 77
and associated functional traits are distributed among communities is important because 78
ecosystem functioning can depend on trait richness and dissimilarity. Increased ecosystem 79
functioning can occur when the most productive species and traits (e.g. consumption rate, 80
foraging habit) are also the most abundant (Dangles and Malmqvist 2004, McKie et al. 2008, 81
Creed et al. 2009). Additionally, communities comprised of species with dissimilar traits, such as 82
foraging habit, habitat preference, and dietary breadth, can increase ecosystem functioning 83
through facilitation and niche complementarity (McKie et al. 2008, Frainer et al. 2014). 84
Headwater streams are a model system for evaluating how consumer diversity affects 85
decomposition of resources subsidies. Streams are linked to adjacent riparian ecosystems through 86
leaf litter subsidies (Wallace et al. 1997), which support stream communities across trophic 87
levels from bacteria and fungi to invertebrate detritivores and predators. Leaf decomposition is 88
Page 5
5
an important ecosystem function that is influenced by both biotic and abiotic variables: Stream 89
characteristics (e.g. water temperature, nutrients, and pH) can be important abiotic factors 90
(Lecerf et al. 2007), while detrital quality [e.g. carbon (C), nitrogen (N), and phosphorous (P) 91
content], microbial conditioning, and detritivore local adaptation, biomass, and functional 92
diversity can be important biotic factors (Hieber and Gessner 2002, Kominoski et al. 2011, 93
Frainer et al. 2014, Jackrel and Wootton 2014). 94
Here, we addressed two objectives to determine the drivers of leaf decomposition in 95
detritus-based streams using a reciprocal transplant experiment. First, we evaluated the relative 96
importance of local adaptation of invertebrate detritivore communities and detrital subsidy 97
characteristics to decomposition. We hypothesized that detritivore communities would be 98
adapted to subsidies representative of their adjacent riparian ecosystems, and we predicted that 99
leaf decomposition would increase when communities were provided locally-derived leaf 100
subsidies. Second, we investigated how detritivore functional trait diversity and other biotic and 101
abiotic factors affect leaf decomposition. We predicted that (1) detritivore biomass would be the 102
primary driver of decomposition, (2) decomposition would increase when communities were 103
composed of dominant traits or complementary traits, and (3) higher quality subsidies (i.e. higher 104
N and P content) would increase decomposition due to increased consumption by detritivores. 105
Methods 106
Site description 107
This experiment was conducted in two low-elevation and two high-elevation forested 108
headwater streams at the Coweeta Hydrologic Laboratory Long-Term Ecological Research site 109
in Otto, North Carolina, USA. The two low-elevation focal streams [Low-Elevation Stream 1 110
(LE1) and Low-Elevation Stream 2 (LE2)] were ~700 m above sea level, and the two high-111
Page 6
6
elevation focal streams [High-Elevation Stream 1 (HE1) and High-Elevation Stream 2 (HE2)] 112
were ~1400 m above sea level; the low- and high-elevation focal streams were separated by a 113
linear distance of 4.75 km. The low- and high-elevation streams drained into separate larger 114
streams: LE1 and LE2 drained into Coweeta Creek, and HE1 and HE2 drained into the Nantahala 115
River. Streams in Coweeta are characterized by low water nutrient concentrations [nitrate (NO3- 116
mg L-1) = mean ± SE = 0.174 ± 0.002, ammonium (NH4+ mg L-1) = 0.117 ± 0.003, phosphate 117
(PO43- mg L-1) = 0.0056 ± 0.0004; Swank and Crossley 1988]. Forest composition changes along 118
an elevational gradient (Swank and Crossley 1988): Low-elevation forests are typically 119
dominated by white oak (Quercus alba), while high-elevation forests are typically dominated by 120
red maple (Acer rubrum), red oak (Quercus rubra), and tulip poplar (Liriodendron tulipifera). 121
There was extensive loss of Eastern hemlock (Tsuga canadensis) throughout the forests 122
surrounding the high-elevation focal streams due to the hemlock woolly adelgid (Adelges 123
tsugae). All four focal streams were heavily shaded by a dense understory of Rhododendron 124
maximum. 125
Stream survey 126
Environmental characteristics were measured for each of the four focal streams. A 50-m 127
study reach was delineated and marked for each focal stream, with six transects spaced 10 m 128
apart along the study reach. At each transect, we measured wetted-width, depth, and canopy 129
cover. Canopy cover was estimated using a spherical densiometer. HOBO Data Loggers (Onset 130
Computer Corporation, Bourne, Massachusetts, USA) were deployed at the upstream end of each 131
study reach to record mean daily water temperature for each stream. Flow velocity was estimated 132
twice for each study reach at base flow. The focal streams were too shallow to permit use of a 133
flow meter, so flow velocity was estimated using a neutrally-buoyant, plastic ball and dividing 134
Page 7
7
the distance travelled by the time interval (Hauer and Lamberti 2007). Five replicate trials 135
following this method were taken and averaged for each flow velocity estimate. 136
Leaf litter collection 137
We quantified leaf litter inputs for the low- and high-elevation focal streams to construct 138
leaf packs representative of the riparian ecosystem for each elevation. Leaf litter was collected 139
from the forest floor of the riparian zone of each focal stream at three transects (10 m, 30 m, and 140
50 m) along the 50-m study reach in mid-May 2014 (approximately six months post-senescence). 141
For each transect, a 1-m2 square quadrat was placed 2 m up the stream bank; samples were 142
collected from both sides of the stream at each transect. All leaf litter within the quadrat was 143
collected and sorted by species; litter was only collected if it was likely to have fallen the 144
previous autumn (i.e. leaf litter was visually inspected for relative degree of decomposition). 145
Collected litter was oven-dried (60ºC for 48 h), and weighed to determine relative input by mass 146
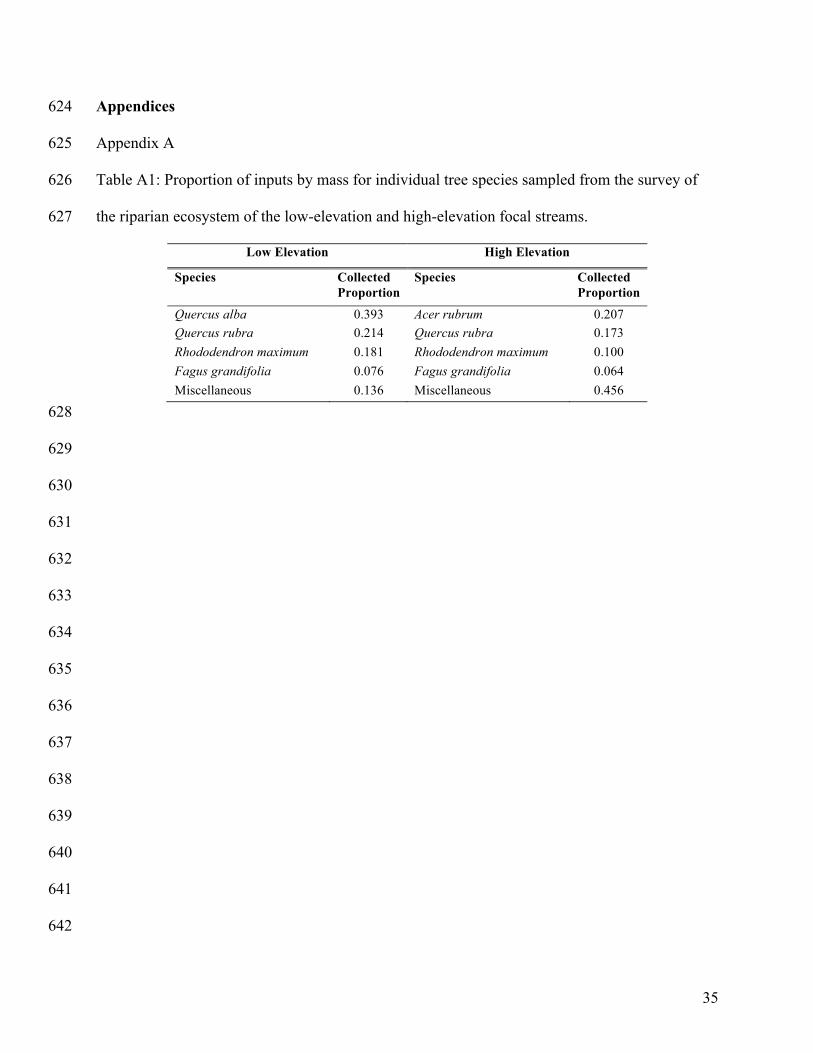
for each tree species. The four species of highest relative input by mass were identified for each 147
elevation (Appendix A: Table A1) and then standardized to make a low-elevation pack (LEP) 148
and a high-elevation pack (HEP). Inputs were standardized by dividing the relative proportion of 149
each of the four dominant species by the sum of the relative proportions of the four dominant 150
tree species for each elevation (Swan et al. 2009; Appendix A: Table A1). White oak and red 151
maple were present at each elevation but were not included in the HEPs and LEPs, respectively, 152
because the species were not considerable inputs by mass at both elevations. 153
Reciprocal transplant experiment 154
We used a full reciprocal transplant design in which representative packs for each 155
elevation were deployed in home sites (e.g. LEPs deployed in low-elevation streams) or away 156
sites (e.g. LEPs deployed in high-elevation streams). The leaf decomposition experiment was 157
Page 8
8
conducted during mid-summer (8 June-3 July 2014) to parallel previous studies (Kominoski et 158
al. 2011, Jackrel and Wootton 2014). Packs were incubated in LE1 and LE2 from 8 June-2 July 159
2014, and leaf packs were incubated in HE1 and HE2 from 9 June-3 July 2014. Representative 160
packs comprised ~6 g mixed-species leaf litter derived from the adjacent riparian forest for each 161
elevation immediately prior to the experiment (e.g. Kominoski et al. 2011), with four species 162
represented in standardized proportions by mass (Table 1); only leaves with minimal or no 163
visible damage were used. Leaf litter was placed into plastic 2.5-mm mesh bags (30 x 15 cm) 164
after determining initial dry mass. An additional 3 x 3-cm opening was cut in the center of each 165
mesh bag to allow for colonization by larger invertebrates (e.g. large caddisflies, crayfish). 166
Sixteen packs, eight LEPs and eight HEPs, were incubated in each of the four focal 167
streams, for a total of 64 packs. In each focal stream, packs were incubated across four run 168
habitats along a 75-m reach, with two LEPs and two HEPs incubated within each run. Similar 169
flow velocities for run habitats were selected among all four focal streams to minimize the 170
effects of abrasion on leaf decomposition. Eight additional packs per stream (four LEPs and four 171
HEPs) were transported back to the lab on the same day to measure handling loss (Hauer and 172
Lamberti 2007). Packs were incubated in each focal stream for a total of 24 days. After retrieval, 173
packs were placed into sealed bags on ice and processed in the laboratory within 24 h. Leaves 174
from each pack were rinsed over nested sieves (1 mm and 250 µm) to remove inorganic material 175
and invertebrates, and then oven-dried (60ºC for 48 h). Leaf decomposition was calculated as the 176
percentage of mass lost, after correction for handling loss. Leaf decomposition was calculated for 177
the whole pack because we were unable to identify all remaining leaf material to species with 178
reasonable confidence. 179
Leaf nutrient analysis 180
Page 9
9
Leaf packs were analyzed for total C, N, and P content to determine stoichiometric ratios 181
(C:N and C:P). All leaf material from each pack was ground using a Spex CertiPrep 8000-D 182
Mixer Mill (Spex, Metuchen, New Jersey, USA). Litter samples for total C and N were analyzed 183
with a Carlo Erba 1500N CHN Analyser (Carlo Erba, Milan, Italy). Litter samples for total P 184
analysis were prepared using the ash/acid extraction method and analyzed with a 185
spectrophotometer following the ascorbic acid method (Allen 1974). Nutrient analyses were 186
completed at the Stable Isotope Ecology Laboratory at the University of Georgia (Athens, 187
Georgia, USA). 188
Aquatic invertebrates 189
Invertebrates from all packs were preserved in 70% ethanol and stained with Rose Bengal 190
solution for sorting. Individuals from two size classes (250 µm-1 mm and >1 mm) were counted, 191
identified to the lowest possible taxonomic level (primarily genus), and assigned to functional 192
feeding groups (Merritt et al. 2008). Chironomidae (Order: Diptera) were identified as 193
Tanypodinae or non-Tanypodinae. Biomass was determined using established length-mass 194
regressions (Benke et al. 1999), and detritivore (shredders and collector-gatherers) biomass 195
estimates and density were standardized by leaf mass remaining for later statistical analyses. 196
Statistical analysis 197
Stream survey: For each environmental characteristic, we conducted a one-way analysis of 198
variance (ANOVA) to compare differences across the four focal streams. Parameters were 199
analyzed for normality using Shapiro-Wilkes tests, and transformations were used when 200
necessary. Wetted-width, flow velocity, and temperature were ln-transformed; untransformed 201
values of all environmental characteristics are reported in the results. Model assumptions (e.g. 202
Page 10
10
homoscedasticity, normal error distribution) were inspected graphically. Significance for the 203
stream survey was considered at P < 0.01 to account for multiple comparisons. 204
Leaf decomposition and stoichiometry: We used a two-way ANOVA to compare leaf 205
decomposition by leaf pack type (LEP and HEP) and deployment site (home and away). Leaf 206
pack type and deployment site were fitted as fixed effects, and stream was fitted as a random 207
effect; model assumptions were inspected graphically. Leaf decomposition was ln-transformed to 208
improve normality, and untransformed values are reported in the results. Comparing leaf 209
decomposition between home and away deployment site provides a measure of local adaptation 210
of stream communities: Higher decomposition in home deployment sites would suggest local 211
adaptation to leaf litter subsidies derived from the adjacent riparian ecosystem. Two LEPs 212
deployed in LE1 were lost during the experiment, resulting in a slightly unbalanced design (30 213
LEP samples vs. 32 HEP samples). Stoichiometric ratios were compared between LEPs and 214
HEPs using two-tailed Welch t-tests. 215
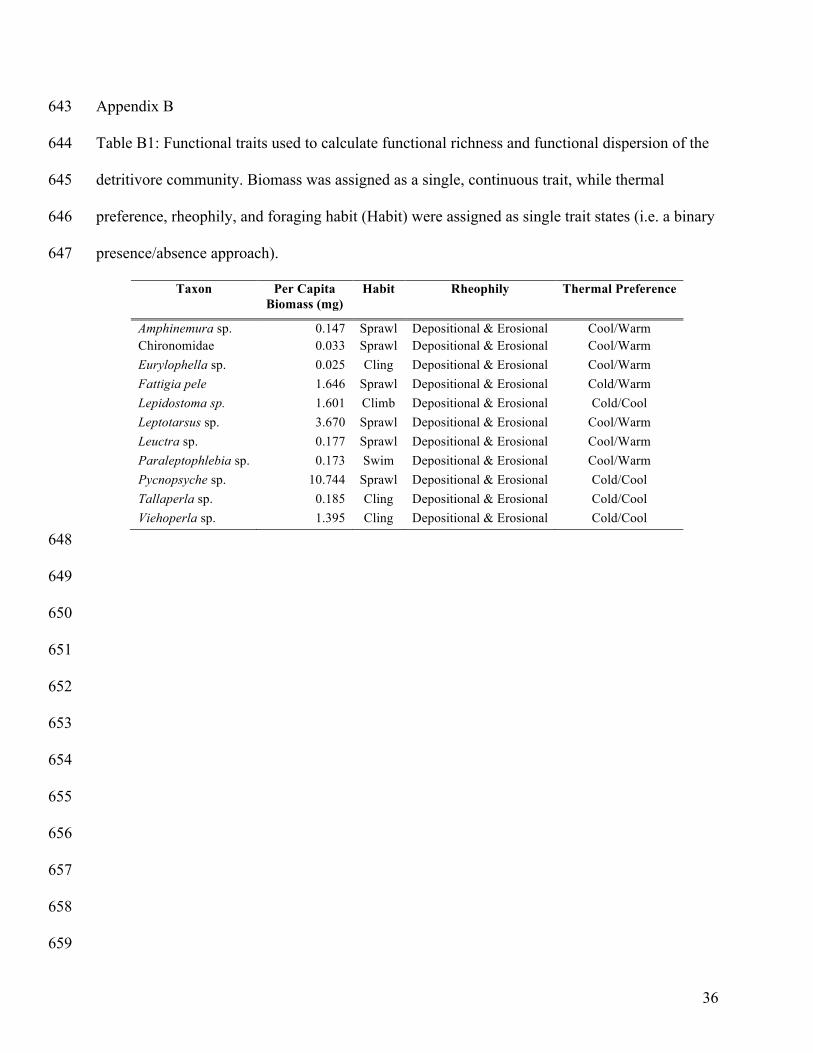
Functional diversity: Functional trait diversity was calculated for the detritivore community. 216
Four traits were selected to represent the capacity by which detritivores occupy available habitat 217
and affect decomposition: (1) mean per capita biomass, (2) foraging habit (e.g. burrow, sprawl), 218
(3) thermal preference (e.g. cold, warm, eurythermal), and (4) rheophily (e.g. erosional, 219
depositional). Selected functional traits were chosen for the following reasons: First, detritivore 220
biomass affects decomposition via metabolic requirements and feeding rates (Brown et al. 2004). 221
Second, foraging habits can alter feeding efficiency as well as competitive or facilitative 222
relationships and, in turn, affect detrital consumption (McKie et al. 2008, Patrick 2013). Lastly, 223
thermal and rheophilic preferences reflect the ability for taxa to occupy and persist in available 224
habitat and thereby affect ecosystem functions. Mean per capita biomass for each taxon was 225
Page 11
11
calculated from the individuals collected during the experiment; all remaining trait values were 226
modified from the Poff et al. (2006) trait matrix (Appendix B: Table B1). 227
Detritivore community trait diversity was calculated using two trait diversity metrics: (1) 228
functional richness (FRic) and (2) functional dispersion (FDis). FRic measures the amount of 229
trait space occupied by taxa within the community (Villéger et al. 2008). FDis is the mean 230
distance of individual taxa to the centroid of the community in trait space, and simultaneously 231
measures trait dissimilarity and evenness within the community (Laliberté and Legendre 2010). 232
Communities with high FDis are composed of evenly-distributed, dissimilar traits while 233
communities with low FDis are composed of unevenly-distributed, similar traits (i.e. FDis is a 234
measure of trait complementarity). FDis is weighted by abundances while FRic is not (Villéger 235
et al. 2008, Laliberté and Legendre 2010). FRic values were standardized to be constrained 236
between 0 and 1 (Laliberté et al. 2014). Detritivores comprising > 0.45% of macro-invertebrate 237
biomass or abundance were included in the diversity analyses (Appendix C: Table C1). This 238
criterion excluded rare and small taxa but not rare and large taxa from the diversity analyses. 239
Taxa included in the trait analyses comprised >70% and >80% of total invertebrate community 240
biomass and abundance, respectively (Appendix C: Table C1). 241
Detritivore community: We further analyzed differences in detritivore diversity between leaf 242
pack types and focal streams. To compare compositional differences between leaf pack types and 243
among focal streams, we used site-abundance matrices to calculate square-root transformed 244
Bray-Curtis dissimilarities. Bray-Curtis dissimilarities were compared using a permutational 245
multivariate analysis of variance (PERMANOVA) with 10,000 permutations (Oksanen et al. 246
2016), and results are illustrated using nonmetric multi-dimensional scaling (NMDS). We 247
compared FRic, FDis, and detritivore biomass and density by leaf pack type and focal stream 248
Page 12
12
using two-way ANOVAs, and model assumptions were inspected graphically. Significance for 249
the detritivore community was considered at P < 0.0125 to account for multiple comparisons. 250
Path analysis: Structural equation models (SEMs) were constructed to evaluate the causal 251
pathways through which biotic and abiotic drivers affect leaf decomposition (Appendix D: Fig. 252
D1). The robustness of a SEM is determined by the fit to the data, rather than significant 253
relationships within the SEM (Grace 2006). Model fit was assessed by comparing expected and 254
observed covariance between predictor and response variables using chi-square tests (Grace 255
2006). SEMs were considered consistent with the data when expected and observed covariance 256
was not significantly different. Plausible causal linkages between variables were added to 257
candidate SEMs to improve model fit based on single degree of freedom chi-square criteria 258
(Grace et al. 2010). Candidate SEMs were then compared using AICc (Burnham and Anderson 259
2002), with the SEM having the lowest AICc selected as the most parsimonious model. 260
We constructed four alternative SEMs (FRic and FDis for C:N and C:P, respectively) to 261
examine how functional diversity and other biotic and abiotic variables affect decomposition 262
(Appendix D: Fig. D1A and B). Alternative SEMs were constructed to test the importance of 263
different nutrients (N vs. P) and trait diversity metrics (FRic vs. FDis). Each SEM had 62 264
samples (30 LEPs and 32 HEPs) with six explanatory variables [stream, leaf pack type, 265
conditioned litter stoichiometry (C:N or C:P), and detritivore biomass, density, and functional 266
diversity (FRic or FDis)] and one response-only variable (leaf decomposition). Within each 267
SEM, stream and leaf pack type (i.e. LEP or HEP) were the exogenous variables (independent 268
variables that affect other variables but are not affected by other variables), while detritivore 269
biomass, density, and functional diversity and litter stoichiometry were the four endogenous 270
variables (variables affected by the exogenous variables and that can affect other endogenous 271
Page 13
13
variables). Leaf decomposition was fitted as a response-only endogenous variable that was 272
affected by all exogenous and endogenous variables. Stream identity was fitted to account for 273
extraneous sources of environmental variation, and leaf pack type was fitted to account for leaf 274
litter characteristics not explained by litter stoichiometry (e.g. lignin, tannin, phenols). Both 275
stream and leaf pack type were fitted as random exogenous variables with means, variances, and 276
covariances set as free parameters. All SEMs were estimated by Maximum Likelihood with 277
Satorra-Bentler scaled test statistics, which are robust to non-normality. Model results are 278
reported as standardized path coefficients, which show the direction and magnitude of the causal 279
relationship between variables and allow for the comparison of relationship strengths within the 280
SEM (Grace 2006). 281
All above analyses were conducted using R (version 3.3.0, R Core Team 2016) and the 282
FD (Laliberté et al. 2014), vegan (Oksanen et al. 2016), nlme (Pinheiro et al. 2016), and lavaan 283
(Rosseel 2012) packages, and significance was considered at P < 0.05. 284
Results 285
Stream survey 286
Stream characteristics (Table 2) differed by individual stream, although these differences 287
depended on the environmental characteristic. High-elevation streams were wider than the low-288
elevation streams (F3, 20 = 5.126, P = 0.009). Depth and canopy cover did not differ among the 289
focal streams (both P > 0.32). Flow velocity differed by stream (F3, 4 = 33.79, P = 0.003), with 290
highest velocity in HE1, intermediate velocity in LE1 and LE2, and lowest velocity in HE2 (Table 291
2). Mean daily water temperature differed among the focal streams (F3, 92 = 322.4, P < 0.001), 292
with warmer temperatures at low elevation and cooler temperatures at high elevation (Table 2). 293
Leaf decomposition and stoichiometry 294
Page 14
14
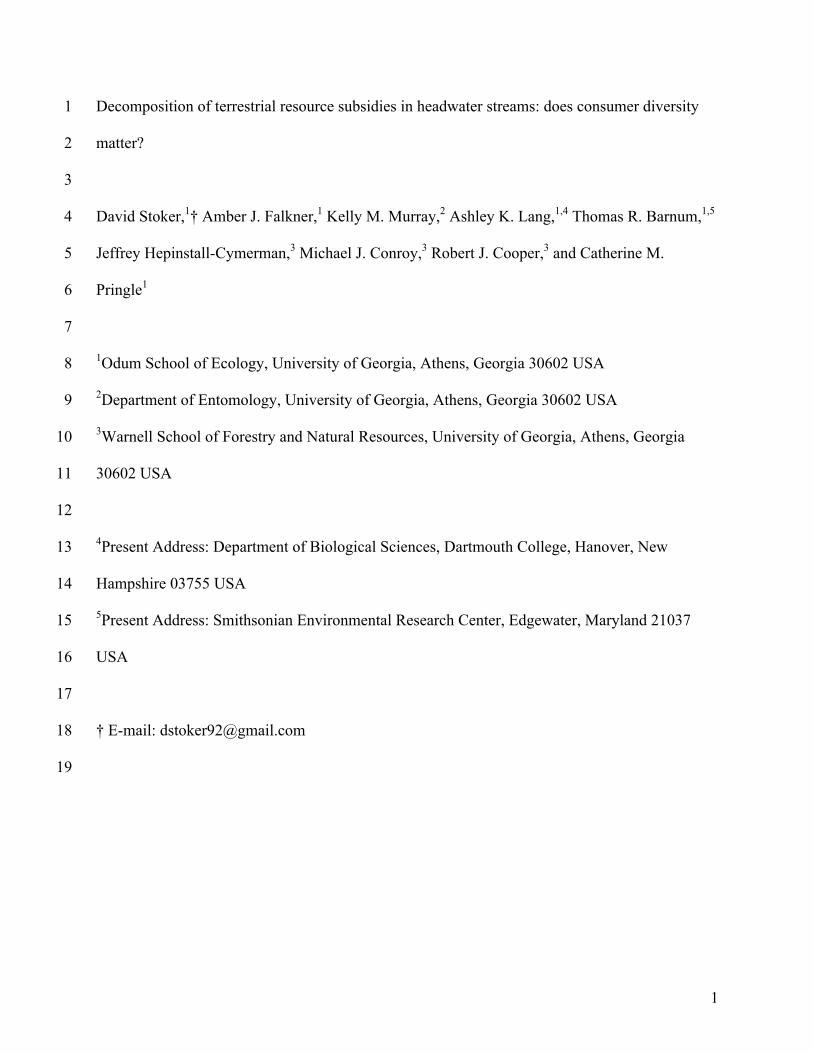
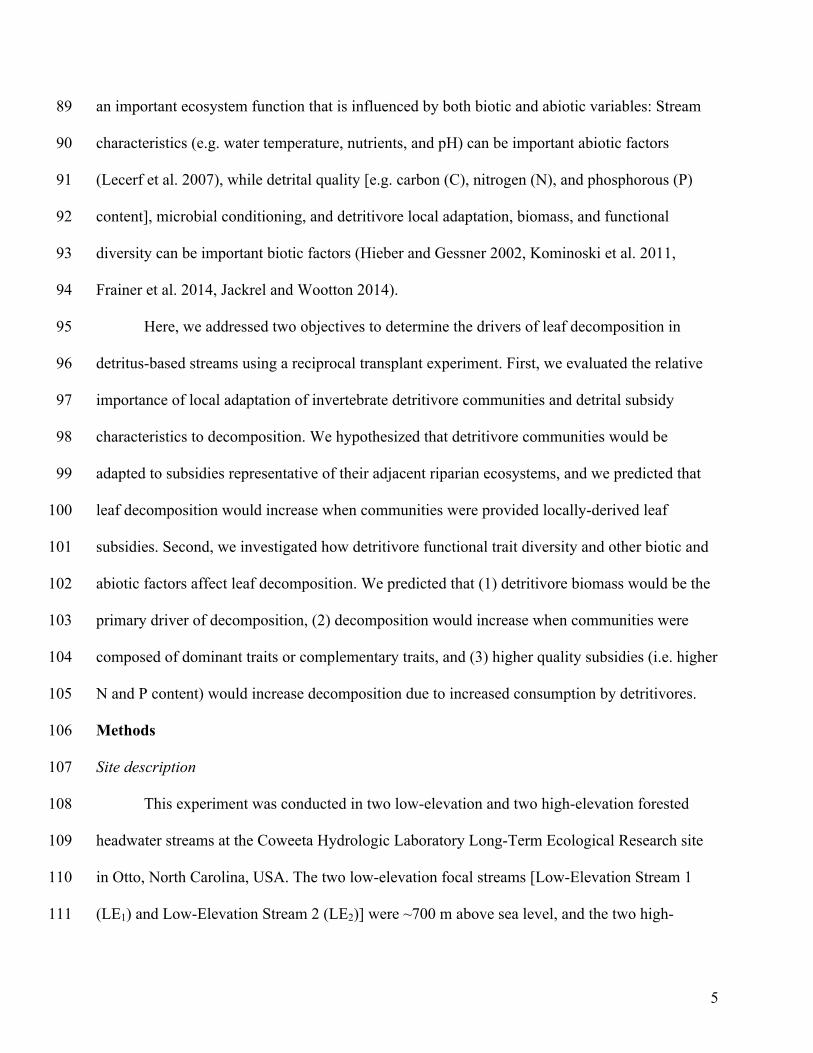
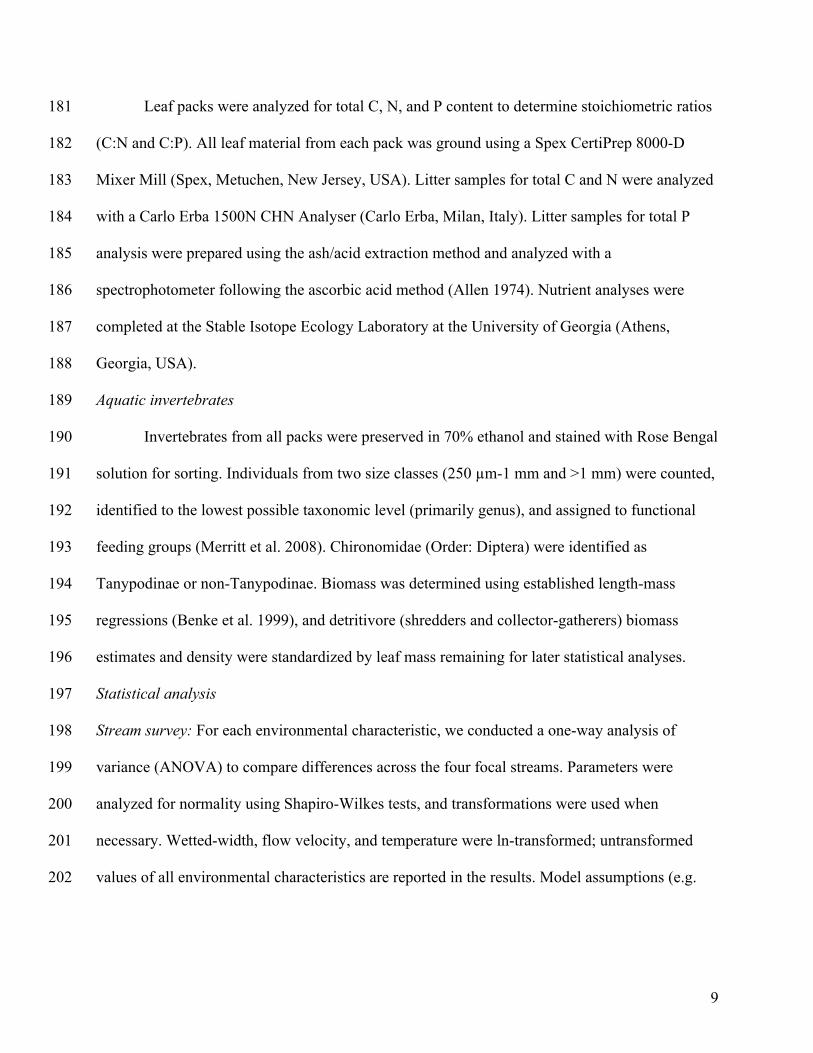
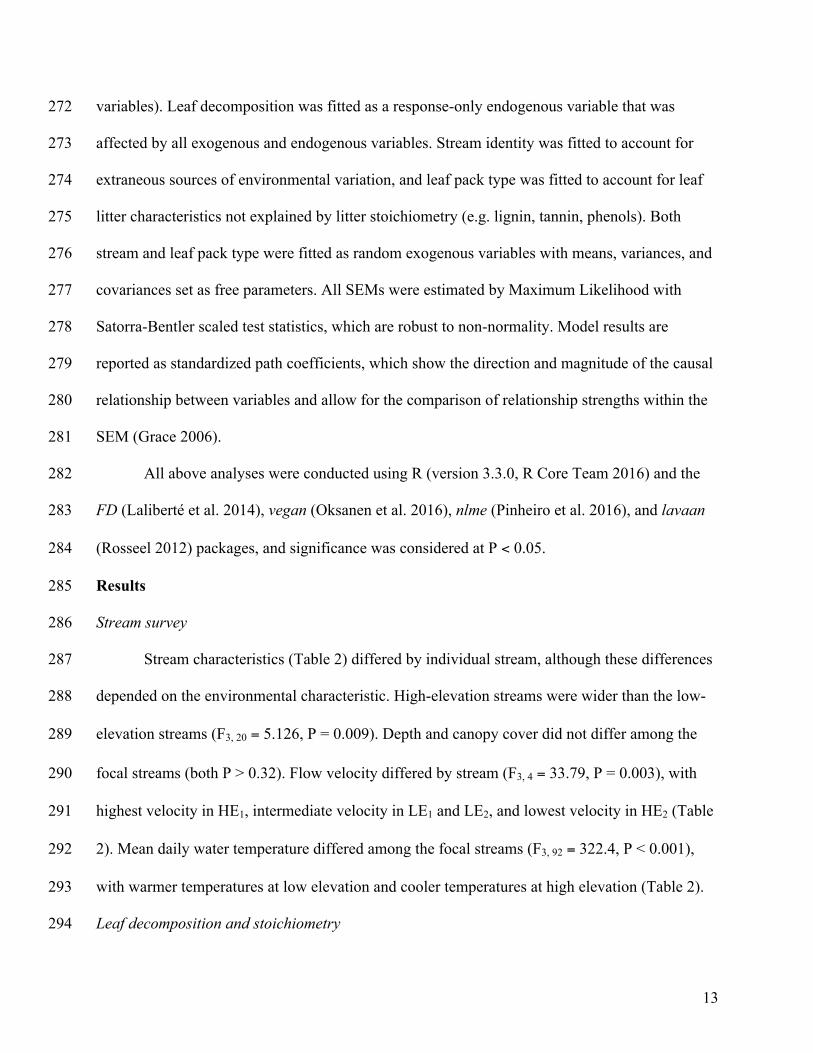
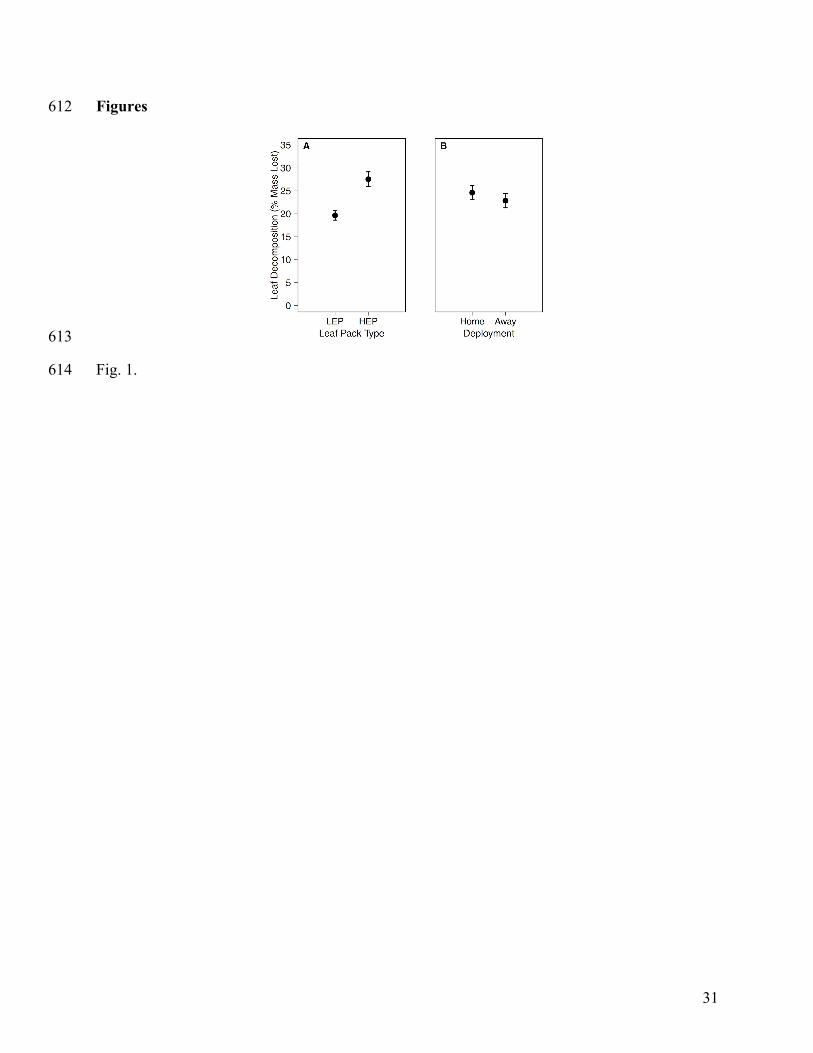
Leaf decomposition differed by leaf pack type (Fig. 1A) but not deployment site (Fig. 295
1B). Decomposition of HEPs (mean ± SE = 27.51% ± 1.61%) was higher than LEPs (19.80% ± 296
1.41%; F1, 56 = 14.533, P < 0.001, Fig. 1A), irrespective of deployment site. Decomposition was 297
not significantly higher in home sites (24.44% ± 1.40%) compared to away sites (22.87% ± 298
1.58%; F1, 56 = 1.547, P = 0.219, Fig. 1B). Because deployment site had no significant effect on 299
leaf decomposition, it was removed from all later analyses. There were differences in 300
stoichiometry between LEPs and HEPs (Appendix E: Table E1), with HEPs having significantly 301
lower C:N (LEP: 55.24 ± 0.86, HEP: 46.38 ± 0.88; t = 7.170, P < 0.001) and C:P (LEP: 2194.15 302
± 67.22, 1901.80 ± 67.15; t = 3.077, P = 0.003) ratios. 303
Detritivore community 304
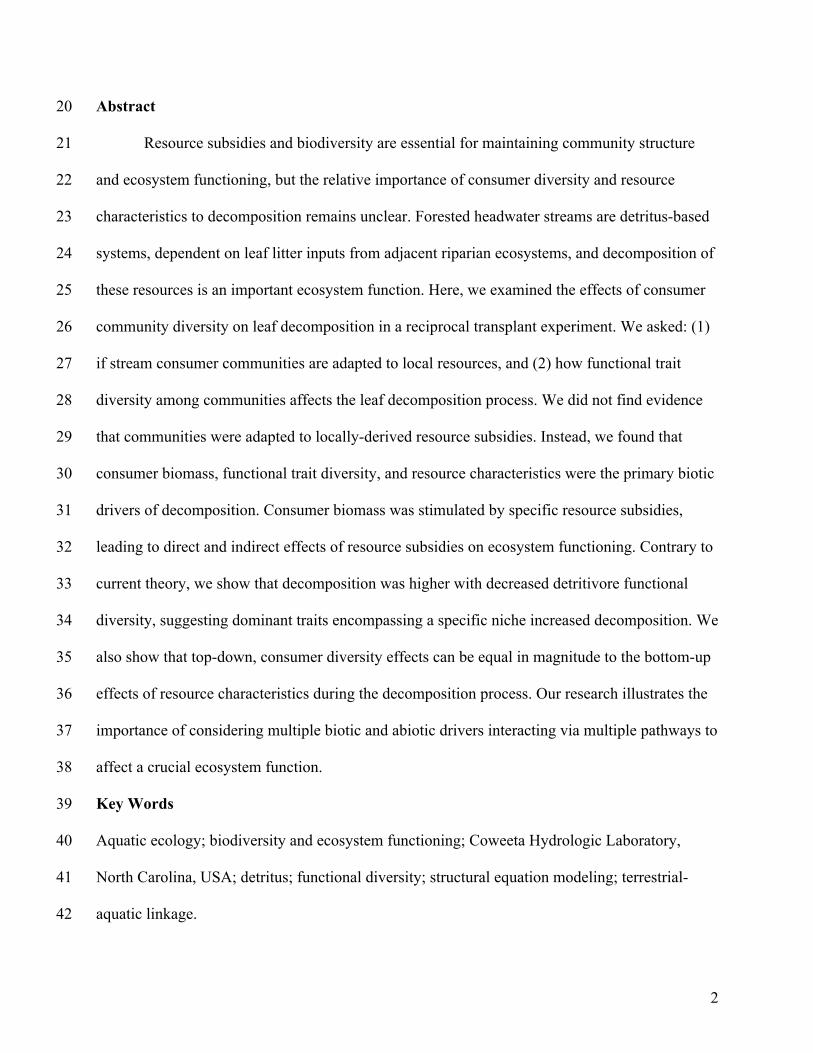
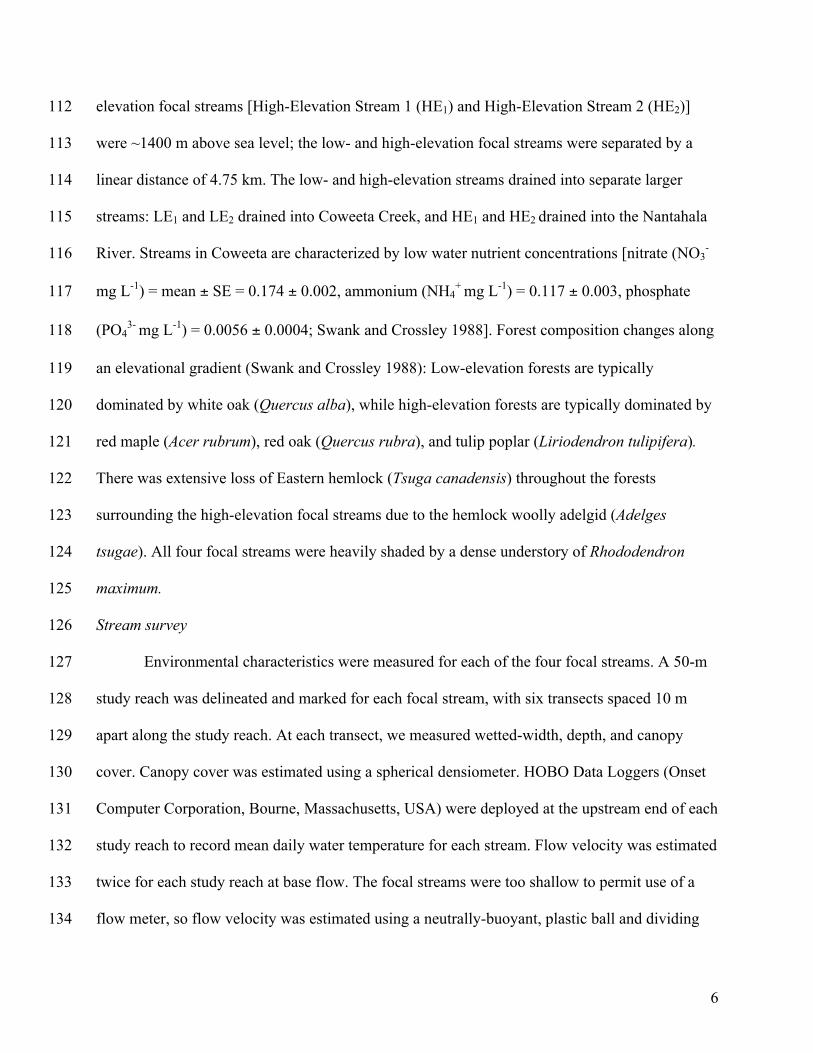
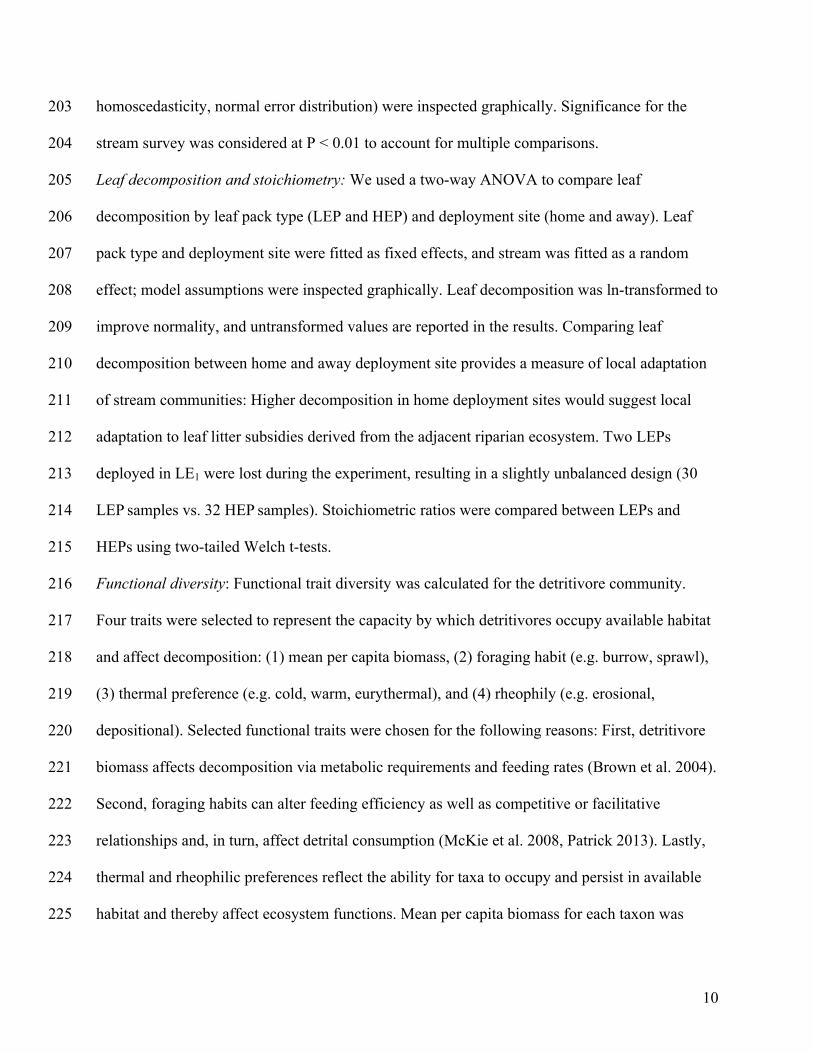
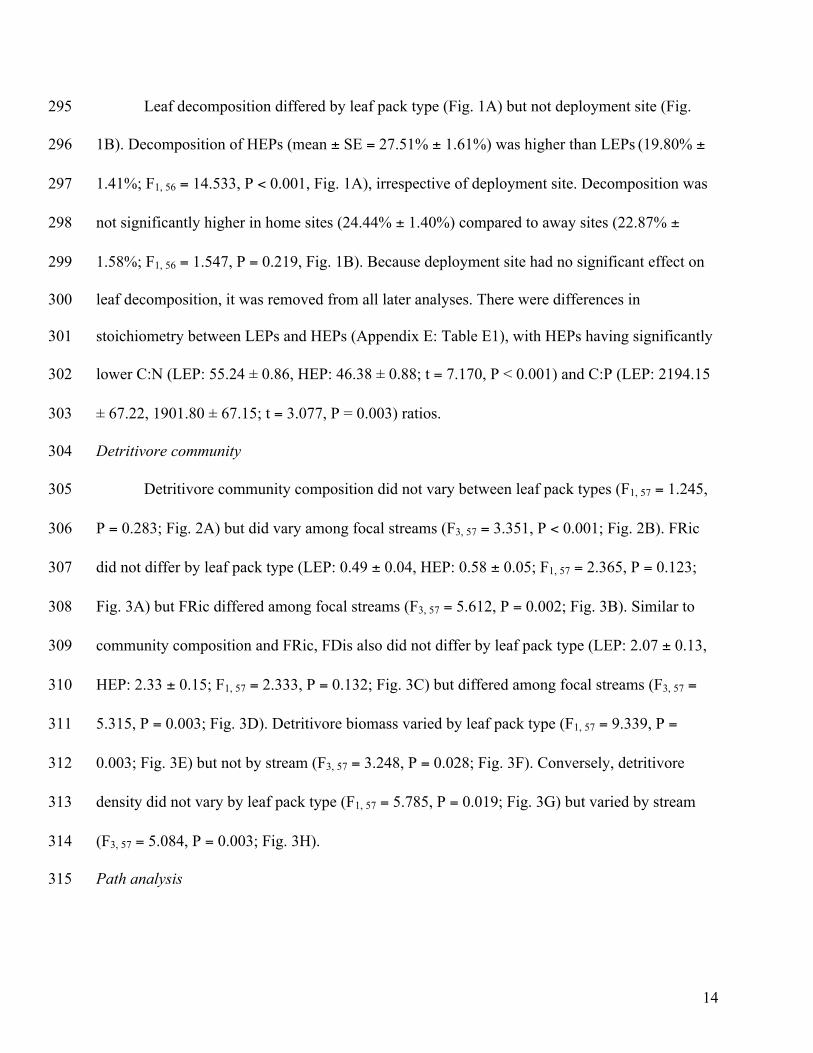
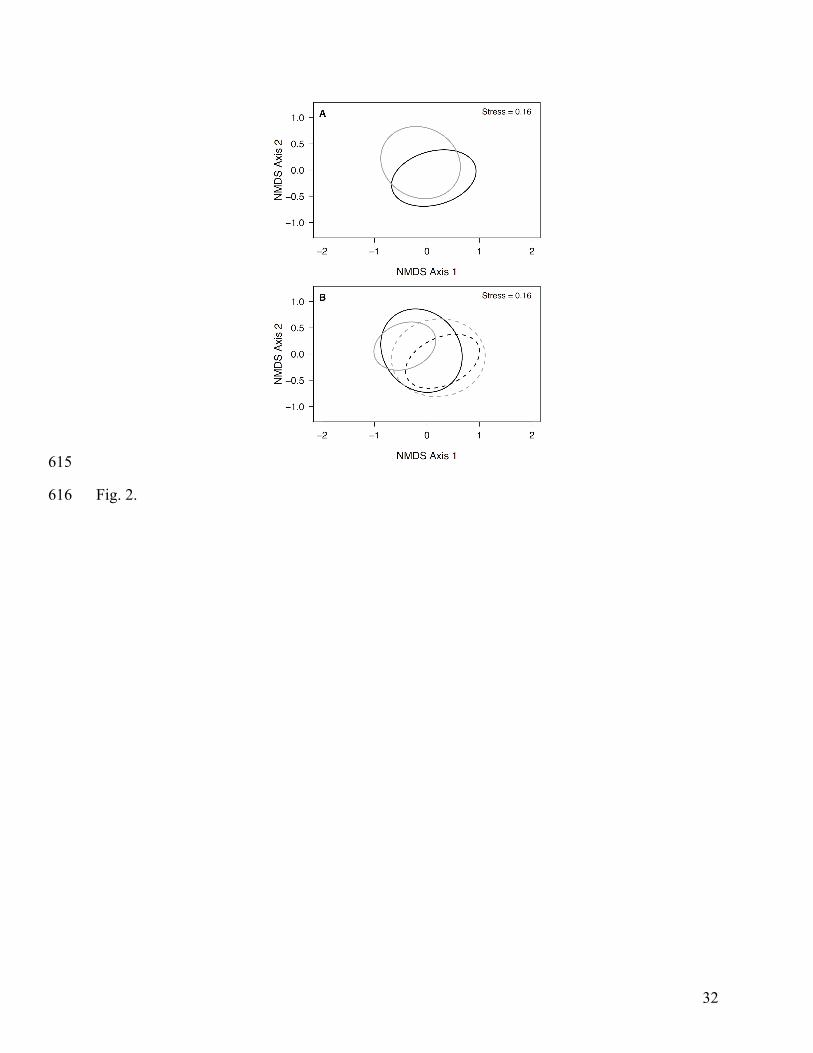
Detritivore community composition did not vary between leaf pack types (F1, 57 = 1.245, 305
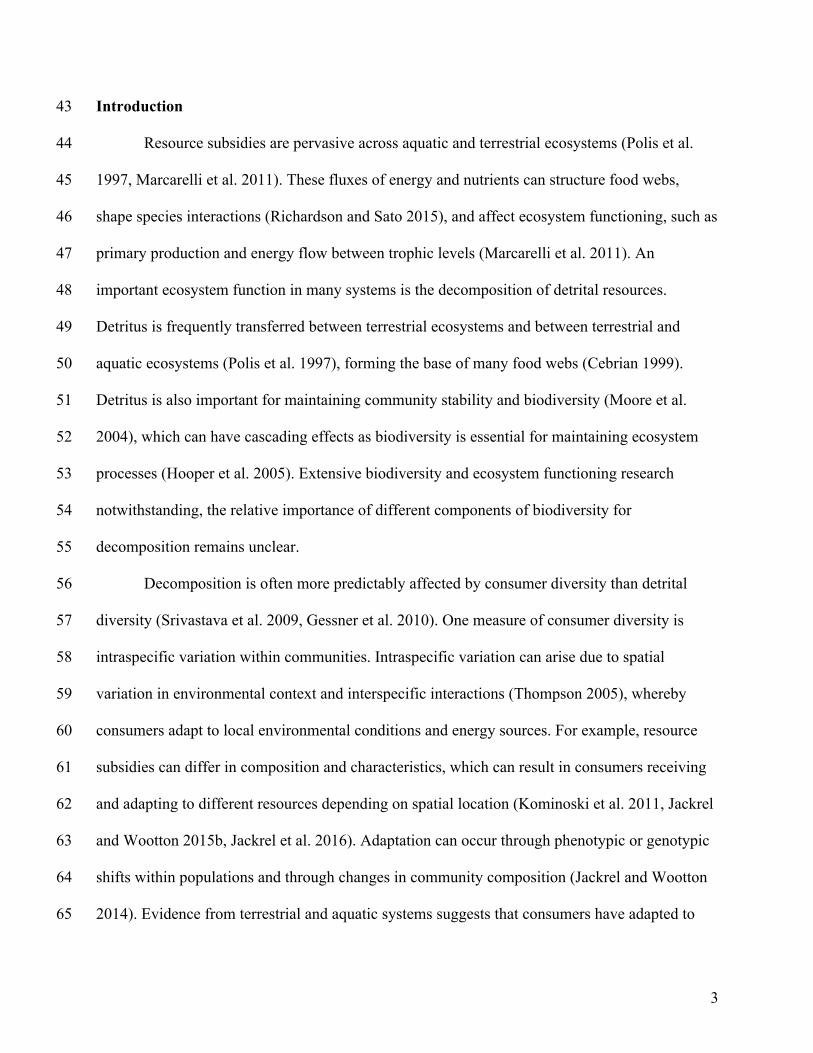
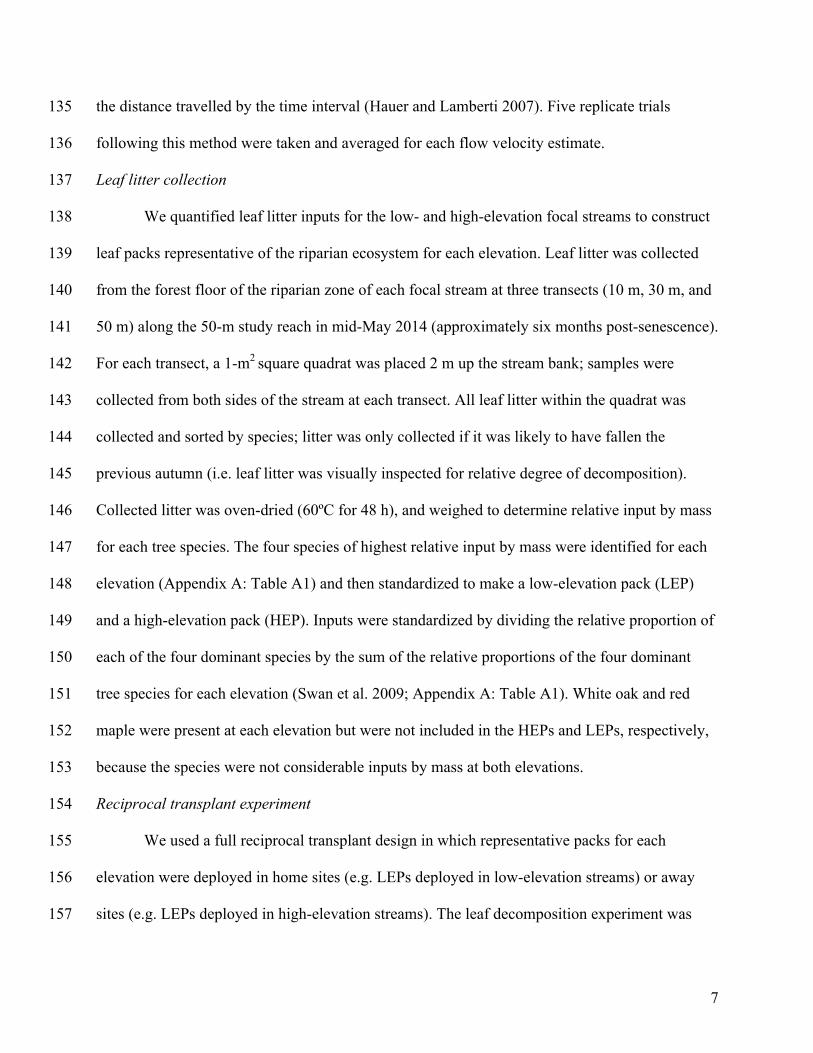
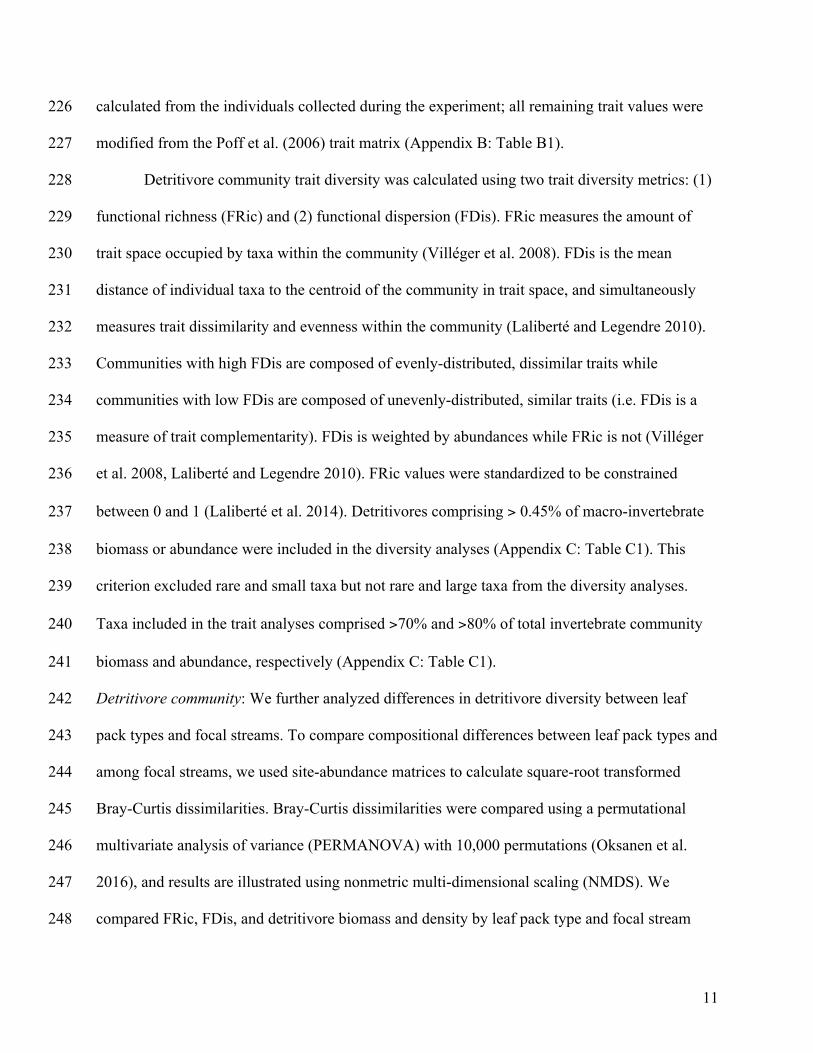
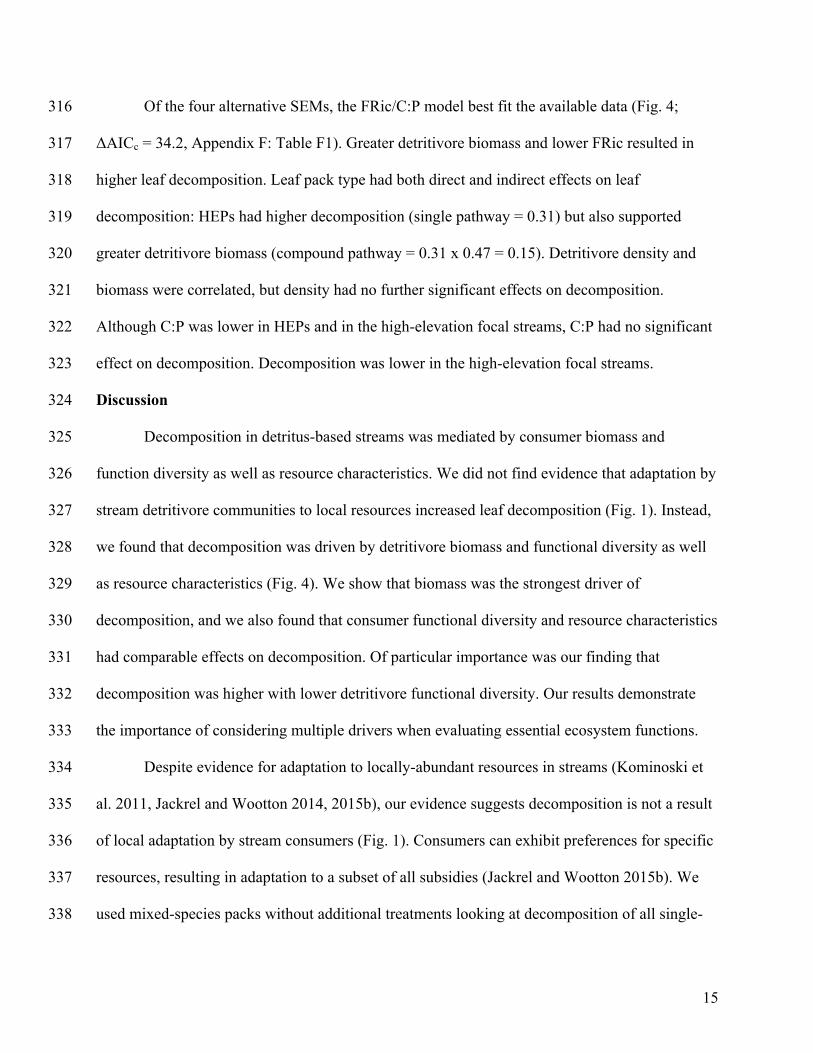
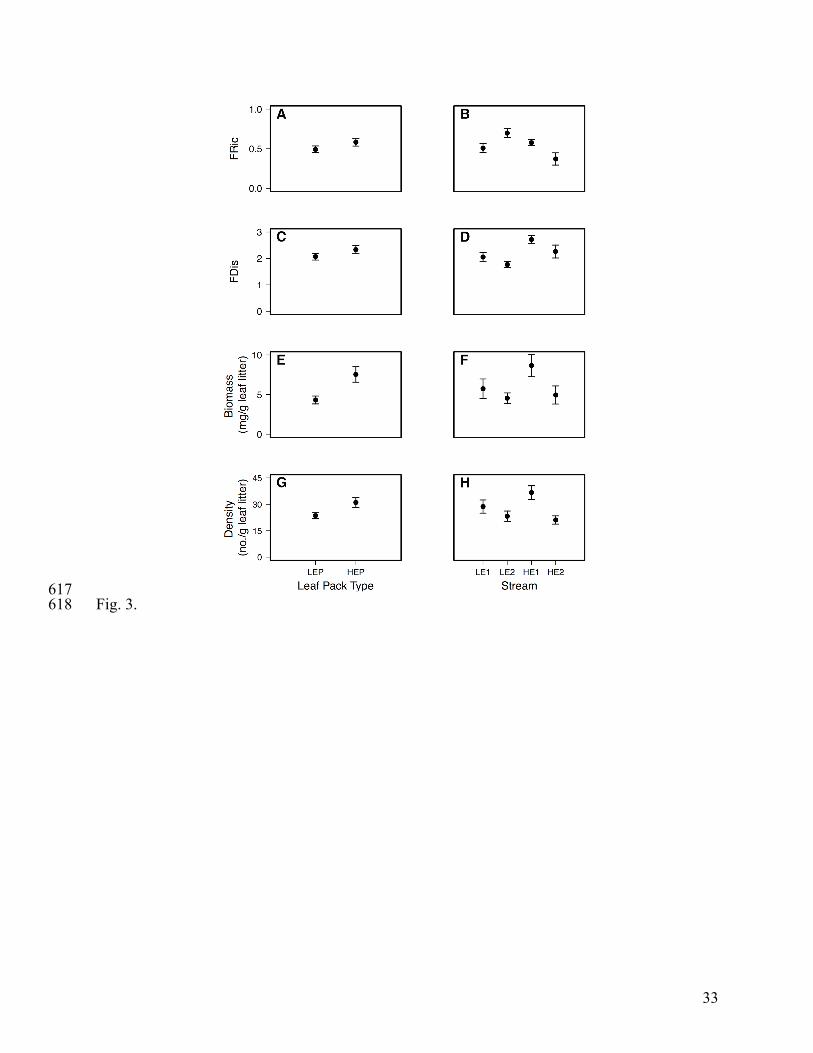
P = 0.283; Fig. 2A) but did vary among focal streams (F3, 57 = 3.351, P < 0.001; Fig. 2B). FRic 306
did not differ by leaf pack type (LEP: 0.49 ± 0.04, HEP: 0.58 ± 0.05; F1, 57 = 2.365, P = 0.123; 307
Fig. 3A) but FRic differed among focal streams (F3, 57 = 5.612, P = 0.002; Fig. 3B). Similar to 308
community composition and FRic, FDis also did not differ by leaf pack type (LEP: 2.07 ± 0.13, 309
HEP: 2.33 ± 0.15; F1, 57 = 2.333, P = 0.132; Fig. 3C) but differed among focal streams (F3, 57 = 310
5.315, P = 0.003; Fig. 3D). Detritivore biomass varied by leaf pack type (F1, 57 = 9.339, P = 311
0.003; Fig. 3E) but not by stream (F3, 57 = 3.248, P = 0.028; Fig. 3F). Conversely, detritivore 312
density did not vary by leaf pack type (F1, 57 = 5.785, P = 0.019; Fig. 3G) but varied by stream 313
(F3, 57 = 5.084, P = 0.003; Fig. 3H). 314
Path analysis 315
Page 15
15
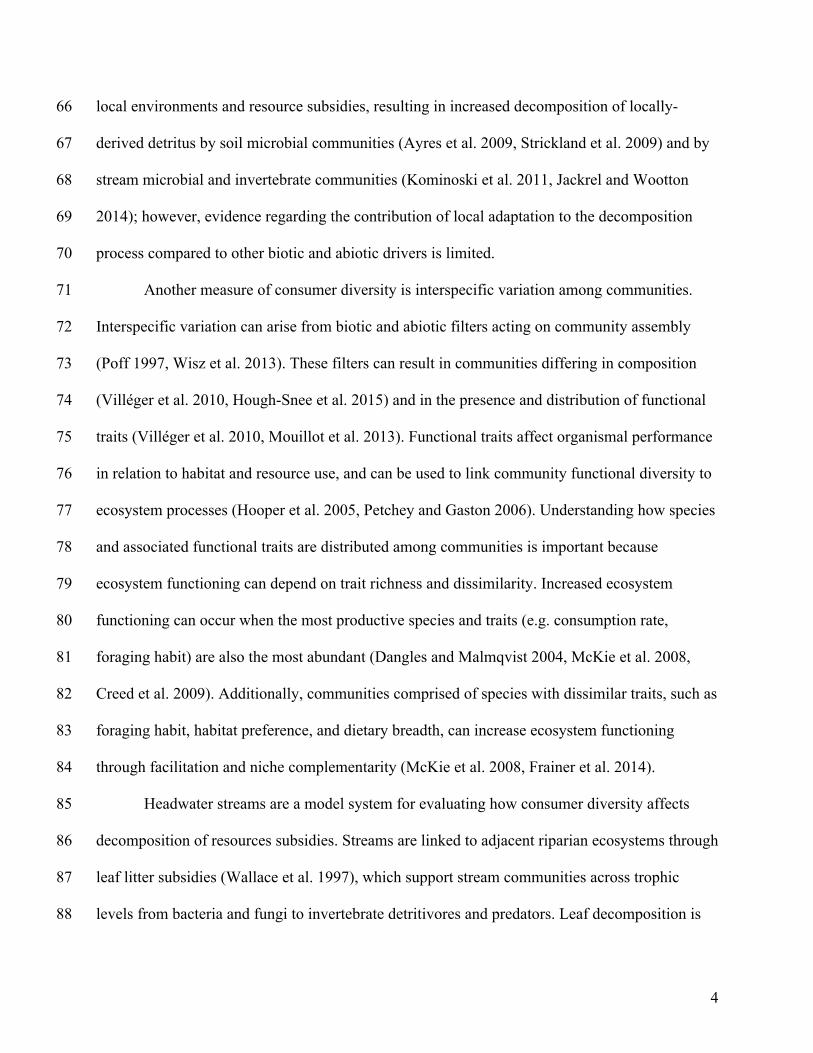
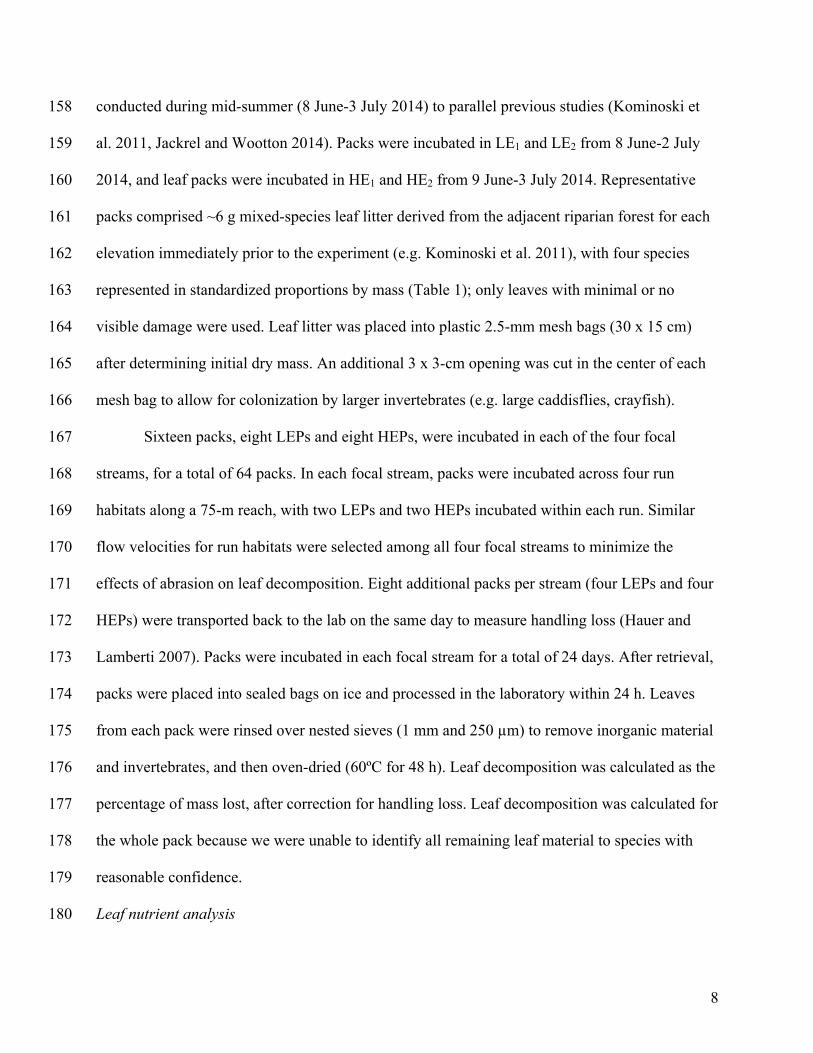
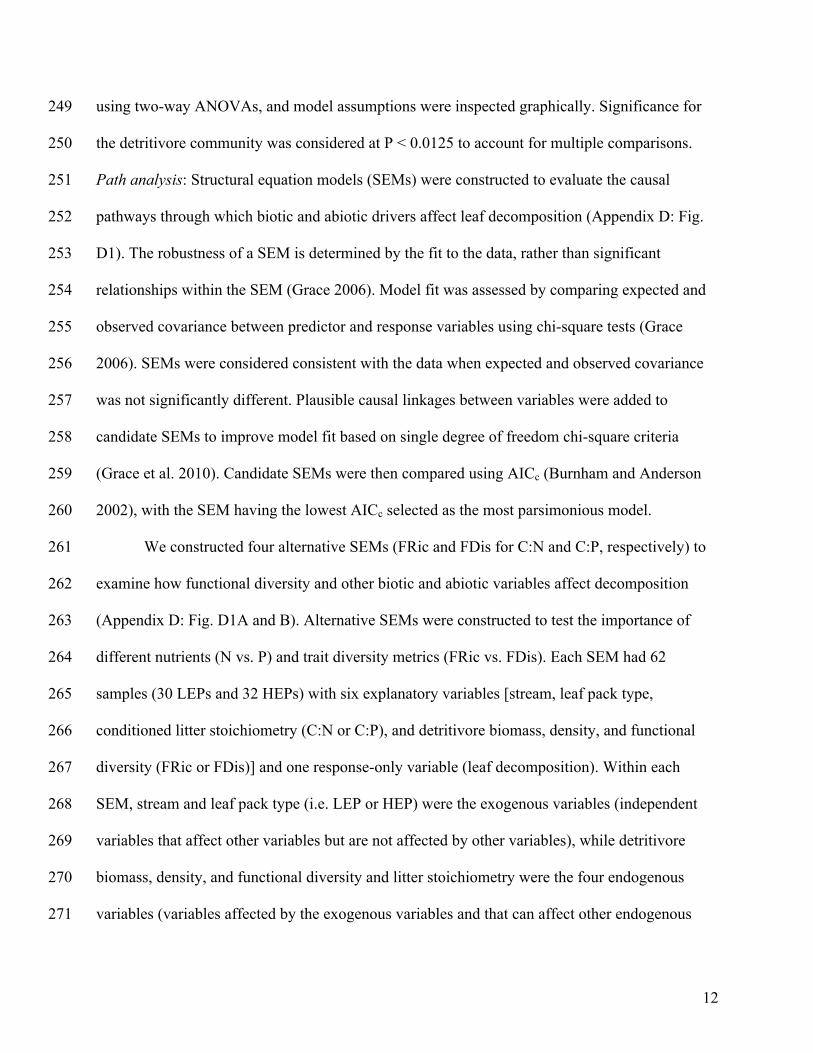
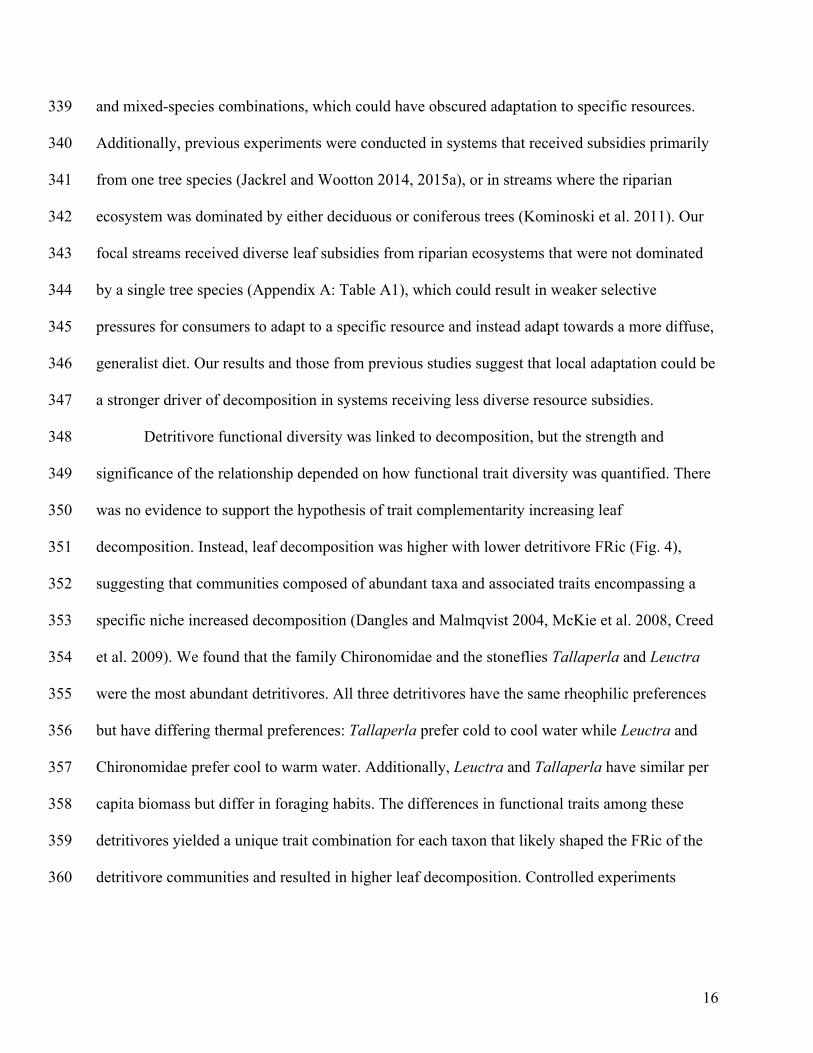
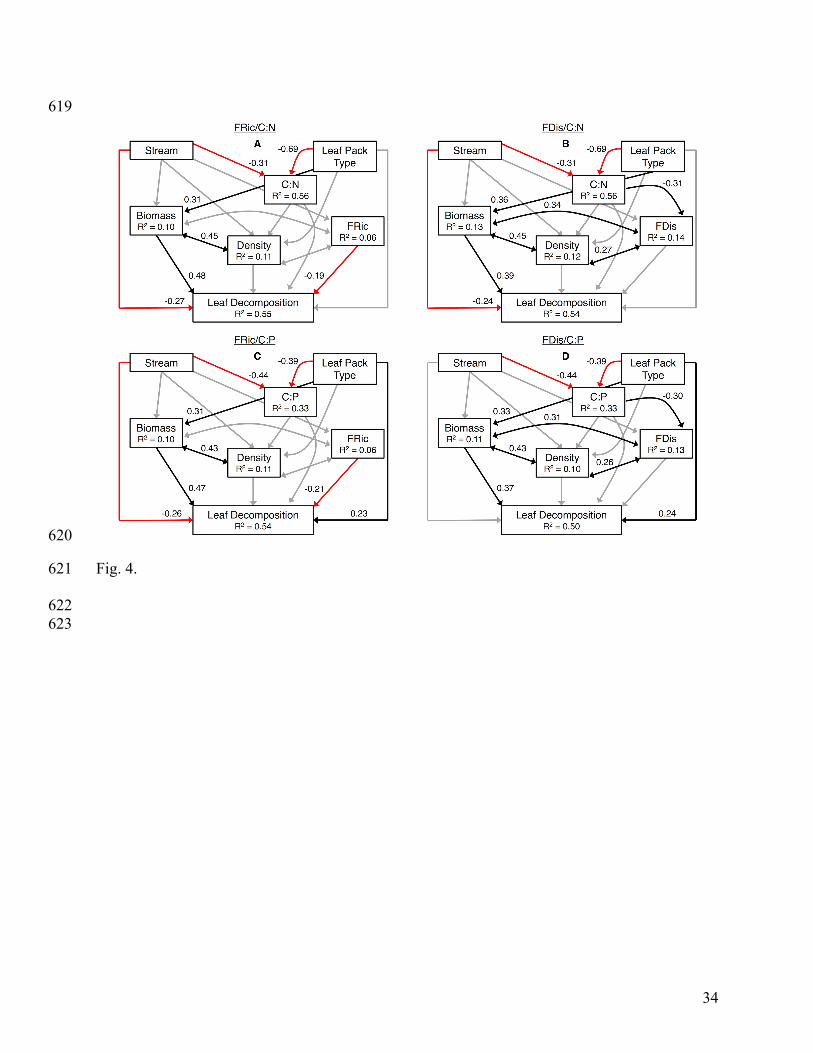
Of the four alternative SEMs, the FRic/C:P model best fit the available data (Fig. 4; 316
ΔAICc = 34.2, Appendix F: Table F1). Greater detritivore biomass and lower FRic resulted in 317
higher leaf decomposition. Leaf pack type had both direct and indirect effects on leaf 318
decomposition: HEPs had higher decomposition (single pathway = 0.31) but also supported 319
greater detritivore biomass (compound pathway = 0.31 x 0.47 = 0.15). Detritivore density and 320
biomass were correlated, but density had no further significant effects on decomposition. 321
Although C:P was lower in HEPs and in the high-elevation focal streams, C:P had no significant 322
effect on decomposition. Decomposition was lower in the high-elevation focal streams. 323
Discussion 324
Decomposition in detritus-based streams was mediated by consumer biomass and 325
function diversity as well as resource characteristics. We did not find evidence that adaptation by 326
stream detritivore communities to local resources increased leaf decomposition (Fig. 1). Instead, 327
we found that decomposition was driven by detritivore biomass and functional diversity as well 328
as resource characteristics (Fig. 4). We show that biomass was the strongest driver of 329
decomposition, and we also found that consumer functional diversity and resource characteristics 330
had comparable effects on decomposition. Of particular importance was our finding that 331
decomposition was higher with lower detritivore functional diversity. Our results demonstrate 332
the importance of considering multiple drivers when evaluating essential ecosystem functions. 333
Despite evidence for adaptation to locally-abundant resources in streams (Kominoski et 334
al. 2011, Jackrel and Wootton 2014, 2015b), our evidence suggests decomposition is not a result 335
of local adaptation by stream consumers (Fig. 1). Consumers can exhibit preferences for specific 336
resources, resulting in adaptation to a subset of all subsidies (Jackrel and Wootton 2015b). We 337
used mixed-species packs without additional treatments looking at decomposition of all single- 338
Page 16
16
and mixed-species combinations, which could have obscured adaptation to specific resources. 339
Additionally, previous experiments were conducted in systems that received subsidies primarily 340
from one tree species (Jackrel and Wootton 2014, 2015a), or in streams where the riparian 341
ecosystem was dominated by either deciduous or coniferous trees (Kominoski et al. 2011). Our 342
focal streams received diverse leaf subsidies from riparian ecosystems that were not dominated 343
by a single tree species (Appendix A: Table A1), which could result in weaker selective 344
pressures for consumers to adapt to a specific resource and instead adapt towards a more diffuse, 345
generalist diet. Our results and those from previous studies suggest that local adaptation could be 346
a stronger driver of decomposition in systems receiving less diverse resource subsidies. 347
Detritivore functional diversity was linked to decomposition, but the strength and 348
significance of the relationship depended on how functional trait diversity was quantified. There 349
was no evidence to support the hypothesis of trait complementarity increasing leaf 350
decomposition. Instead, leaf decomposition was higher with lower detritivore FRic (Fig. 4), 351
suggesting that communities composed of abundant taxa and associated traits encompassing a 352
specific niche increased decomposition (Dangles and Malmqvist 2004, McKie et al. 2008, Creed 353
et al. 2009). We found that the family Chironomidae and the stoneflies Tallaperla and Leuctra 354
were the most abundant detritivores. All three detritivores have the same rheophilic preferences 355
but have differing thermal preferences: Tallaperla prefer cold to cool water while Leuctra and 356
Chironomidae prefer cool to warm water. Additionally, Leuctra and Tallaperla have similar per 357
capita biomass but differ in foraging habits. The differences in functional traits among these 358
detritivores yielded a unique trait combination for each taxon that likely shaped the FRic of the 359
detritivore communities and resulted in higher leaf decomposition. Controlled experiments 360
Page 17
17
manipulating the presence and abundance of these dominant taxa and associated traits would 361
elucidate the mechanisms through which leaf decomposition was affected. 362
Functional traits and trait combinations may have a significant effect on ecosystem 363
functions if those traits are in sufficient abundance within the community. Realized community 364
assemblages are shaped by environmental filters and species interactions (Poff 1997, Wisz et al. 365
2013), and variation among the focal streams in this experiment likely structured functional 366
diversity of the detritivore communities (Fig. 3B and D). Larger-bodied detritivores, such as the 367
caddisflies Lepidostoma and Pycnopsyche, were more abundant in the colder, high-elevation 368
focal streams. The lower abundances of these larger taxa in the low-elevation focal streams 369
plausibly resulted in reduced complementarity of biomass, foraging habit, and habitat preference, 370
which could explain the decreased FDis in the low-elevation focal streams (Fig. 3D). Moreover, 371
these taxa had lower abundances compared to other detritivores across all the focal streams, 372
which further reduced the potential for trait complementarity (Laliberté and Legendre 2010). 373
Detritivore biomass was expected to have the strongest effect on leaf decomposition, 374
given the relationship between biomass and metabolic rates (Brown et al. 2004) and evidence 375
from previous studies (Hieber and Gessner 2002, Sanpera-Calbet et al. 2009, Frainer et al. 2014). 376
Supporting this prediction, we found that detritivore biomass was the primary driver of leaf 377
decomposition, ranging from ~1.8-2.2x as strong as other biotic and abiotic drivers (Fig. 4). 378
Detritivore biomass was affected by resource type, with greater biomass supported on HEPs 379
compared to LEPs (Fig. 3E), which could result from two mechanisms that are not mutually-380
exclusive. First, HEPs had higher nutrient content, which could result in detritivores 381
preferentially consuming these resources (Marcarelli et al. 2011, Jackrel and Wootton 2015a). 382
Second, HEPs could have provided a more heterogeneous and preferred source of habitat for 383
Page 18
18
detritivores. HEPs were comprised of labile red maple and relatively recalcitrant rhododendron 384
(Rhododendron maximum) and American beech (Fagus grandifolia, Table 1; Kominoski et al. 385
2007, Sanpera-Calbet et al. 2009). Litter serves as substrate for detritivores during foraging, and 386
detritivore biomass is often increased when multiple leaf species contrasting in nutrient content 387
and structural characteristics are present (Sanpera-Calbet et al. 2009, Jabiol et al. 2014). 388
We focused on invertebrate detritivores, but there are other important components of the 389
decomposition process. Fungi and bacteria contribute to leaf decomposition directly by feeding 390
on litter and indirectly by altering litter stoichiometry (Hieber and Gessner 2002). We did not 391
quantify the microbial contribution to leaf decomposition, but invertebrate contributions to 392
decomposition are often larger than microbial contributions in temperate streams (Hieber and 393
Gessner 2002, Moore et al. 2004, Kominoski et al. 2011). Water temperature could accelerate 394
decomposition by increasing the activity of invertebrates and microbes (Ferreira and Canhoto 395
2015, Griffiths and Tiegs 2016). In our study, decomposition was lower in the high-elevation 396
focal streams (Fig. 4), likely due to the large differences in water temperature between the low- 397
and high-elevation focal streams (Table 2). We did not find a relationship between litter nutrient 398
content and decomposition, but other litter characteristics, such as micronutrients and secondary 399
compounds, could be more useful predictors (García-Palacios et al. 2016, Jackrel et al. 2016). 400
Our results suggest that multiple drivers affect decomposition through direct and indirect 401
pathways, and although consumer diversity does matter for decomposition, other drivers are of 402
equal or greater importance. We found that the potential effects of local adaptation by stream 403
consumers on decomposition were outweighed by other drivers, with detritivore biomass being 404
the primary driver of decomposition. We also found that detritivore functional diversity was 405
comparable in magnitude to the effects of detrital resource characteristics. Importantly, 406
Page 19
19
decomposition was higher with lower detritivore functional diversity, which contradicts current 407
theory (Srivastava et al. 2009, Gessner et al. 2010). These results are particularly significant 408
because anthropogenic stressors and increased disturbance could affect consumer community 409
composition and functional diversity (Villéger et al. 2010, Mouillot et al. 2013). Moreover, 410
changes in the composition and evenness of resource subsidies could have cascading effects on 411
decomposition, as subsidies support consumer assemblages and possess structural and functional 412
components that are related to the decomposition process (Swan et al. 2009, Kominoski et al. 413
2013). As environmental change progresses, it will be essential to evaluate how the relationship 414
between and relative importance of consumer diversity and resource characteristics are altered 415
and how that affects decomposition. 416
Acknowledgements 417
We thank James Hunt, Alex Fulmer, and Somer Rowe for assistance with fieldwork; 418
Sarah Clement for laboratory assistance; Tom Maddox, Emmy Deng, and Mike Marshall at the 419
University of Georgia Stable Isotope Ecology Laboratory for nutrient analyses; David. W. P. 420
Manning and Chris J. Patrick for advice on structural equation modeling; Pedro J. Torres, Irene 421
Wyatt, and Samson Murray for stimulating conversations during data analysis and manuscript 422
preparation; and Jarrett E. K. Byrnes for providing R script for calculating AICc. Comments from 423
Chris J. Patrick, Maura P. Dudley, Carissa N. Ganong, Kelsey Solomon, Jessica Chappell, and 424
two anonymous reviewers greatly improved the manuscript. This project was funded through a 425
NASA Global Climate Change Grant (NNX10AB54A) and the NSF-funded Coweeta LTER 426
(DEB-0823293, DEB-9632854, and DEB-0218001), with additional support at the University of 427
Georgia from the Odum School of Ecology and the Center for Undergraduate Research 428
Opportunities (Undergraduate Research Assistantship grant awarded to David Stoker). 429
Page 20
20
Literature Cited 430
Allen, S. E. 1974. Chemical analysis of ecological materials. Wiley, New York, New York, 431
USA. 432
Ayres, E., H. Steltzer, S. Berg, and D. H. Wall. 2009. Soil biota accelerate decomposition in 433
high-elevation forests by specializing in the breakdown of litter produced by the plant 434
species above them. Journal of Ecology 97:901-912. 435
Benke, A. C., A. D. Huryn, L. A. Smock, and J. B. Wallace. 1999. Length-mass relationships for 436
freshwater macroinvertebrates in North America with particular reference to the 437
southeastern United States. Journal of the North American Benthological Society 18:308-438
343. 439
Brown, J. H., J. F. Gillooly, A. P. Allen, V. M. Savage, and G. B. West. 2004. Toward a 440
metabolic theory of ecology. Ecology 85:1771-1789. 441
Burnham, K. P., and D. R. Anderson. 2002. Model selection and multi-model inference: a 442
practical information-theoretic approach. Second edition. Springer, New York, New 443
York, USA. 444
Cebrian, J. 1999. Patterns in the fate of production in plant communities. American Naturalist 445
154:449-468. 446
Creed, R. P., R. P. Cherry, J. R. Pflaum, and C. J. Wood. 2009. Dominant species can produce a 447
negative relationship between species diversity and ecosystem function. Oikos 118:723-448
732. 449
Dangles, O., and B. Malmqvist. 2004. Species richness-decomposition relationships depend on 450
species dominance. Ecology Letters 7:395-402. 451
Page 21
21
Ferreira, V., and C. Canhoto. 2015. Future increase in temperature may stimulate litter 452
decomposition in temperate mountain streams: evidence from a stream manipulation 453
experiment. Freshwater Biology 60:881-892. 454
Frainer, A., B. G. McKie, and B. Malmqvist. 2014. When does diversity matter? Species 455
functional diversity and ecosystem functioning across habitats and seasons in a field 456
experiment. Journal of Animal Ecology 83:460-469. 457
García-Palacios, P., B. G. McKie, I. T. Handa, A. Frainer, S. Hättenschwiler, and H. Jones. 2016. 458
The importance of litter traits and decomposers for litter decomposition: a comparison of 459
aquatic and terrestrial ecosystems within and across biomes. Functional Ecology 30:819-460
829. 461
Gessner, M. O., C. M. Swan, C. K. Dang, B. G. McKie, R. D. Bardgett, D. H. Wall, and S. 462
Hattenschwiler. 2010. Diversity meets decomposition. Trends in Ecology and Evolution 463
25:372-380. 464
Grace, J. B. 2006. Structural equation modeling and natural systems. Cambridge University 465
Press, Cambridge, United Kingdom. 466
Grace, J. B., T. M. Anderson, H. Olff, and S. M. Scheiner. 2010. On the specification of 467
structural equation models for ecological systems. Ecological Monographs 80:67-87. 468
Griffiths, N. A., and S. D. Tiegs. 2016. Organic-matter decomposition along a temperature 469
gradient in a forested headwater stream. Freshwater Science 35:518-533. 470
Hauer, F. R., and G. A. Lamberti. 2007. Methods in stream ecology. Second edition. Academic 471
Press, Burlington, Massachusetts. 472
Hieber, M., and M. O. Gessner. 2002. Contribution of stream detritivores, fungi, and bacteria to 473
leaf decomposition based on biomass estimates. Ecology 83:1026-1038. 474
Page 22
22
Hooper, D. U., et al. 2005. Effects of biodiversity on ecosystem functioning: a consensus of 475
current knowledge. Ecological Monographs 75:3-35. 476
Hough-Snee, N., B. G. Laub, D. M. Merritt, A. L. Long, L. L. Nackley, B. B. Roper, and J. M. 477
Wheaton. 2015. Multi-scale environmental filters and niche partitioning govern the 478
distributions of riparian vegetation guilds. Ecosphere 6:art173. 479
Jabiol, J., J. Cornut, M. Danger, M. Jouffroy, A. Elger, and E. Chauvet. 2014. Litter identity 480
mediates predator impacts on the functioning of an aquatic detritus-based food web. 481
Oecologia 176:225-235. 482
Jackrel, S. L., and J. T. Wootton. 2014. Local adaptation of stream communities to intraspecific 483
variation in a terrestrial ecosystem subsidy. Ecology 95:37-43. 484
Jackrel, S. L., and J. T. Wootton. 2015a. Cascading effects of induced terrestrial plant defences 485
on aquatic and terrestrial ecosystem function. Proceedings of the Royal Society B: 486
Biological Sciences 282:20142522. 487
Jackrel, S. L., and J. T. Wootton. 2015b. Diversity of riparian plants among and within species 488
shapes river communities. PLoS One 10:e0142362. 489
Jackrel, S. L., T. C. Morton, and J. T. Wootton. 2016. Intraspecific leaf chemistry drives locally-490
accelerated ecosystem function in aquatic and terrestrial communities. Ecology 97:2125-491
2135. 492
Kominoski, J. S., L. B. Marczak, and J. S. Richardson. 2011. Riparian forest composition affects 493
stream litter decomposition despite similar microbial and invertebrate communities. 494
Ecology 92:151-159. 495
Page 23
23
Kominoski, J. S., C. M. Pringle, B. A. Ball, M. A. Bradford, D. C. Coleman, D. B. Hall, and M. 496
D. Hunter. 2007. Nonadditive effects of leaf litter species diversity on breakdown 497
dynamics in a detritus-based stream. Ecology 88:1167-1176. 498
Kominoski, J. S., et al. 2013. Forecasting functional implications of global changes in riparian 499
plant communities. Frontiers in Ecology and the Environment 11:423-432. 500
Laliberté, E., and P. Legendre. 2010. A distance-based framework for measuring functional 501
diversity from multiple traits. Ecology 91:299-305. 502
Laliberté, E., Legendre, P., and B. Shipley. 2014. FD: measuring functional diversity from 503
multiple traits, and other tools for functional ecology. R package version 1.0-12. 504
Lecerf, A., G. Risnoveanu, C. Popescu, M. O. Gessner, and E. Chauvet. 2007. Decomposition of 505
diverse leaf litter mixtures in streams. Ecology 88:219-227. 506
Marcarelli, A. M., C. V. Baxter, M. M. Mineau, and R. O. Hall, Jr. 2011. Quantity and quality: 507
unifying food web and ecosystem perspectives on the role of resource subsidies in 508
freshwaters. Ecology 92:1215-1225. 509
McKie, B. G., G. Woodward, S. Hladyz, M. Nistorescu, E. Preda, C. Popescu, P. S. Giller, and 510
B. Malmqvist. 2008. Ecosystem functioning in stream assemblages from different 511
regions: contrasting responses to variation in detritivore richness, evenness and density. 512
Journal of Animal Ecology 77:495-504. 513
Merritt, R., K. W. Cummins, and M. Berg. 2008. An Introduction to the Aquatic Insects of North 514
America. Fourth edition. Kendall Hunt. 515
Moore, J. C., et al. 2004. Detritus, trophic dynamics and biodiversity. Ecology Letters 7:584-600. 516
Page 24
24
Mouillot, D., N. A. Graham, S. Villéger, N. W. Mason, and D. R. Bellwood. 2013. A functional 517
approach reveals community responses to disturbances. Trends in Ecology and Evolution 518
28:167-177. 519
Oksanen J. , F. Guillaume Blanchet, R. Kindt, P. Legendre, P. R. Minchin, R. B. O'Hara, G. L. 520
Simpson, P. Solymos, M. Henry H. Stevens, and H. Wagner. 2016. vegan: Community 521
Ecology Package. R package version 2.3-5. 522
Patrick, C. J. 2013. The effect of shredder community composition on the production and quality 523
of fine particulate organic matter. Freshwater Science 32:1026-1035. 524
Petchey, O. L., and K. J. Gaston. 2006. Functional diversity: back to basics and looking forward. 525
Ecology Letters 9:741-758. 526
Pinheiro, J., D. Bates, S. DebRoy, D. Sarkar, and R Core Team. 2016. nlme: Linear and 527
Nonlinear Mixed Effects Models. R package version 3.1-128. 528
Poff, N. L. 1997. Landscape filters and species traits: towards mechanistic understanding and 529
prediction in stream ecology. Journal of the North American Benthological Society 16: 530
391-409. 531
Poff, N. L., J. D. Olden, N. K. M. Vieira, D. S. Finn, M. P. Simmons, and B. C. Kondratieff. 532
2006. Functional traits niches of North American lotic insects: traits-based ecological 533
applications in light of phylogenetic relationships. Journal of the North American 534
Benthological Society 25:730-755. 535
Polis, G. A., W. B. Anderson, and R. D. Holt. 1997. Toward an integration of landscape and food 536
web ecology: the dynamics of spatially-subsidized food webs. Annual Review of Ecology 537
and Systematics 28:289-316. 538
Page 25
25
R Development Core Team. 2016. R: a language and environment for statistical computing. R 539
Foundation for Statistical Computing, Vienna, Austria. 540
Richardson, J. S., and T. Sato. 2015. Resource subsidy flows across freshwater-terrestrial 541
boundaries and influence on processes linking adjacent ecosystems. Ecohydrology 8:406-542
415. 543
Rosseel, Y. 2012. Lavaan: an R package for structural equation modeling. Journal of Statistical 544
Software 48:1–36. 545
Sanpera-Calbet, I., A. Lecerf, and E. Chauvet. 2009. Leaf diversity influences in-stream litter 546
decomposition through effects on shredders. Freshwater Biology 54:1671-1682. 547
Srivastava, D. S., B. J. Cardinale, A. L. Downing, J. E. Duffy, C. Jouseau, M. Sankaran, and J. P. 548
Wright. 2009. Diversity has stronger top-down than bottom-up effects on decomposition. 549
Ecology 90:1073-1083. 550
Strickland, M. S., C. Lauber, N. Fierer, and M. A. Bradford. 2009. Testing the functional 551
significance of microbial community composition. Ecology 90:441-451. 552
Swan, C. M., M. A. Gluth, and C. L. Horne. 2009. Leaf litter species evenness influences 553
nonadditive breakdown in a headwater stream. Ecology 90:1650-1658. 554
Swank, W. T., and D. A. Crossley, Jr. 1988. Forest hydrology and ecology at Coweeta. Springer-555
Verlag, New York, New York. 556
Thompson, J. N. 2005. The geographic mosaic of coevolution. University of Chicago Press, 557
Chicago, Illinois. 558
Villéger, S., N. W. Mason, and D. Mouillot. 2008. New multidimensional functional diversity 559
indices for a multifaceted framework in functional ecology. Ecology 89:2290-2301. 560
Page 26
26
Villéger, S., J. R. Miranda, D. F. Hernandez, and D. Mouillot. 2010. Contrasting changes in 561
taxonomic vs. functional diversity of tropical fish communities after habitat degradation. 562
Ecological Applications 20:1512-1522. 563
Wallace, J. B., S. L. Eggert, J. L. Meyer, and J. R. Webster. 1997. Multiple trophic levels of a 564
forest stream linked to terrestrial litter inputs. Science 277:102-104. 565
Wisz, M. S., et al. 2013. The role of biotic interactions in shaping distributions and realized 566
assemblages of species: implications for species distribution modelling. Biological 567
Reviews 88:15-30 568
569
Page 27
27
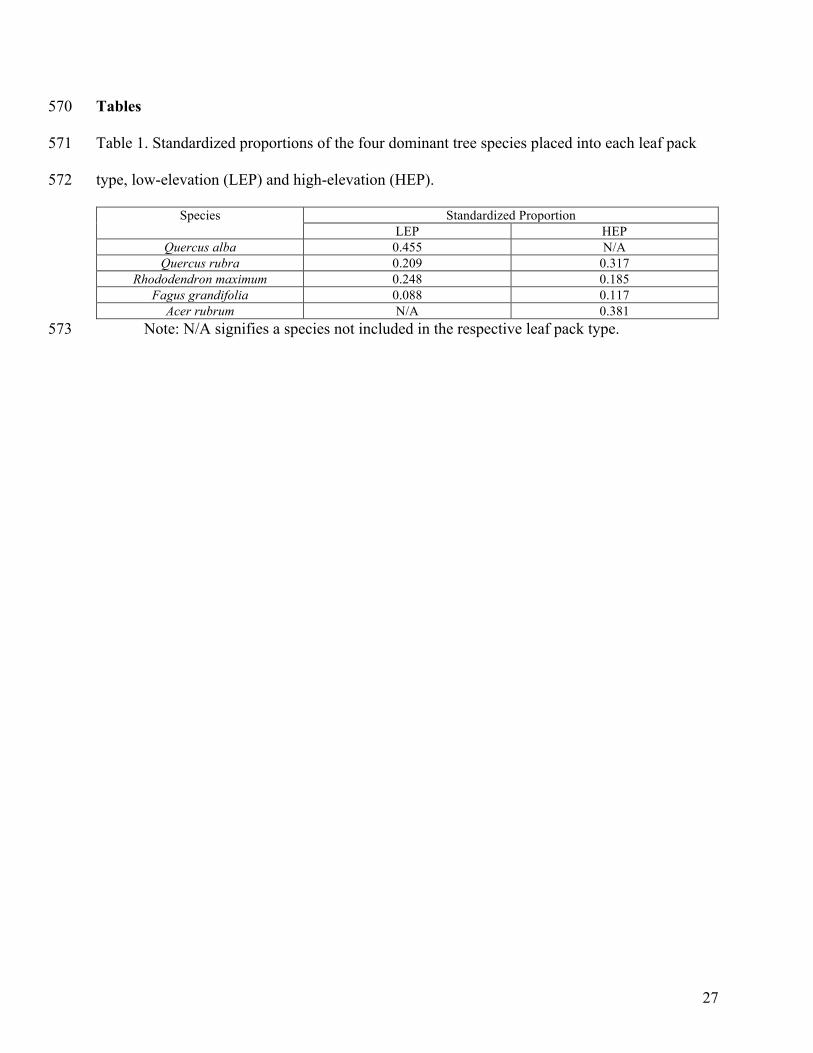
Tables 570
Table 1. Standardized proportions of the four dominant tree species placed into each leaf pack 571
type, low-elevation (LEP) and high-elevation (HEP). 572
Species Standardized Proportion LEP HEP
Quercus alba 0.455 N/A Quercus rubra 0.209 0.317
Rhododendron maximum 0.248 0.185 Fagus grandifolia 0.088 0.117
Acer rubrum N/A 0.381 Note: N/A signifies a species not included in the respective leaf pack type. 573
Page 28
28
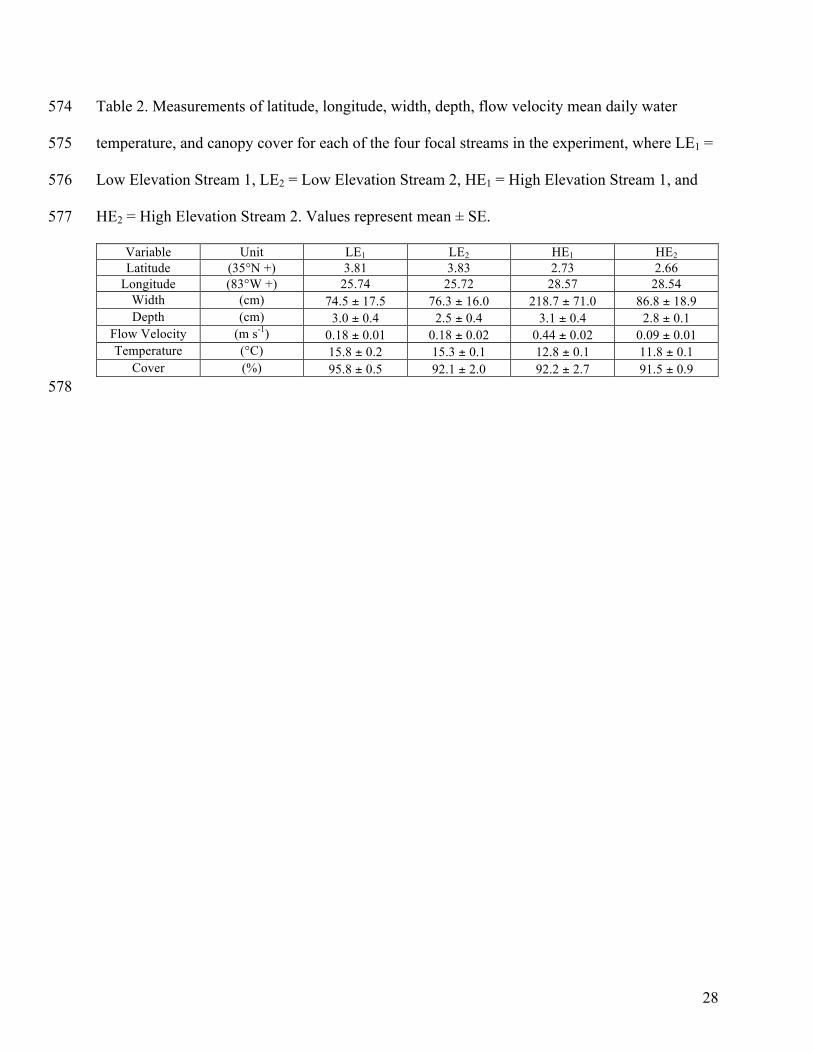
Table 2. Measurements of latitude, longitude, width, depth, flow velocity mean daily water 574
temperature, and canopy cover for each of the four focal streams in the experiment, where LE1 = 575
Low Elevation Stream 1, LE2 = Low Elevation Stream 2, HE1 = High Elevation Stream 1, and 576
HE2 = High Elevation Stream 2. Values represent mean ± SE. 577
Variable Unit LE1 LE2 HE1 HE2 Latitude (35°N +) 3.81 3.83 2.73 2.66
Longitude (83°W +) 25.74 25.72 28.57 28.54 Width (cm) 74.5 ± 17.5 76.3 ± 16.0 218.7 ± 71.0 86.8 ± 18.9 Depth (cm) 3.0 ± 0.4 2.5 ± 0.4 3.1 ± 0.4 2.8 ± 0.1
Flow Velocity (m s-1) 0.18 ± 0.01 0.18 ± 0.02 0.44 ± 0.02 0.09 ± 0.01 Temperature (°C) 15.8 ± 0.2 15.3 ± 0.1 12.8 ± 0.1 11.8 ± 0.1
Cover (%) 95.8 ± 0.5 92.1 ± 2.0 92.2 ± 2.7 91.5 ± 0.9 578
Page 29
29
Figure Captions 579
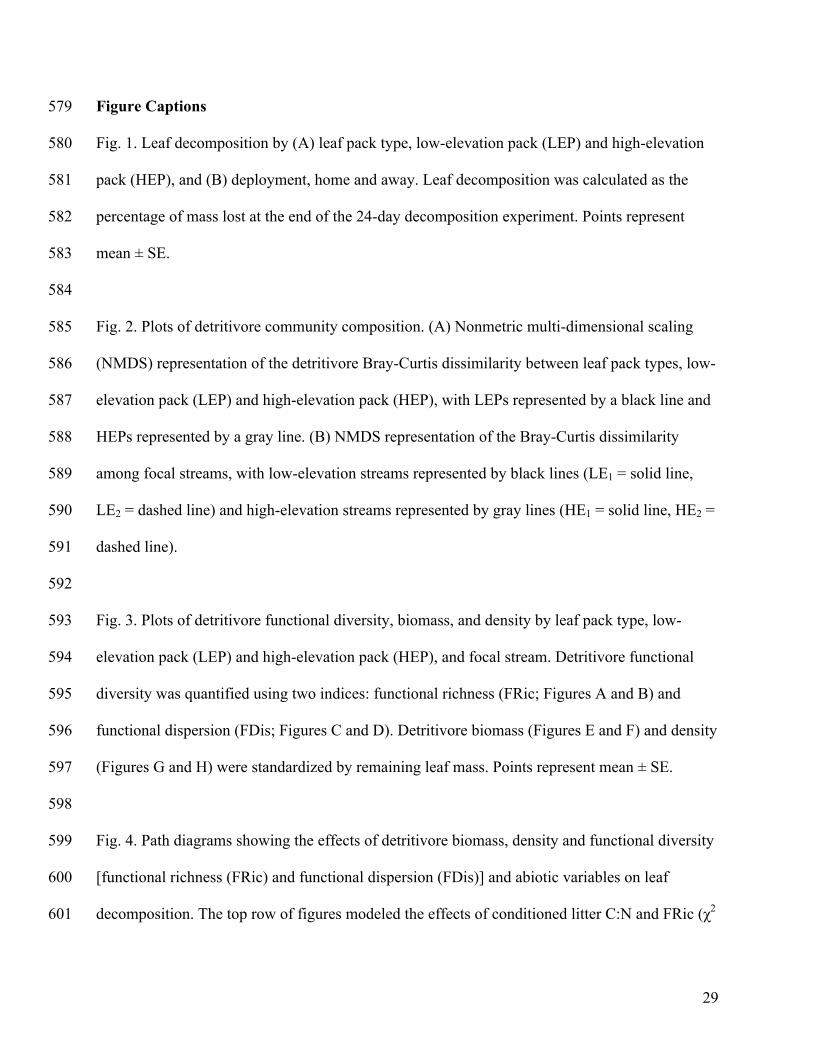
Fig. 1. Leaf decomposition by (A) leaf pack type, low-elevation pack (LEP) and high-elevation 580
pack (HEP), and (B) deployment, home and away. Leaf decomposition was calculated as the 581
percentage of mass lost at the end of the 24-day decomposition experiment. Points represent 582
mean ± SE. 583
584
Fig. 2. Plots of detritivore community composition. (A) Nonmetric multi-dimensional scaling 585
(NMDS) representation of the detritivore Bray-Curtis dissimilarity between leaf pack types, low-586
elevation pack (LEP) and high-elevation pack (HEP), with LEPs represented by a black line and 587
HEPs represented by a gray line. (B) NMDS representation of the Bray-Curtis dissimilarity 588
among focal streams, with low-elevation streams represented by black lines (LE1 = solid line, 589
LE2 = dashed line) and high-elevation streams represented by gray lines (HE1 = solid line, HE2 = 590
dashed line). 591
592
Fig. 3. Plots of detritivore functional diversity, biomass, and density by leaf pack type, low-593
elevation pack (LEP) and high-elevation pack (HEP), and focal stream. Detritivore functional 594
diversity was quantified using two indices: functional richness (FRic; Figures A and B) and 595
functional dispersion (FDis; Figures C and D). Detritivore biomass (Figures E and F) and density 596
(Figures G and H) were standardized by remaining leaf mass. Points represent mean ± SE. 597
598
Fig. 4. Path diagrams showing the effects of detritivore biomass, density and functional diversity 599
[functional richness (FRic) and functional dispersion (FDis)] and abiotic variables on leaf 600
decomposition. The top row of figures modeled the effects of conditioned litter C:N and FRic (χ2 601
Page 30
30
= 3.348, DF = 3, P = 0.341; Fig. A) and C:N and FDis (χ2 = 1.046, DF = 2, P = 0.593; Fig. B). 602
The bottom row of figures modeled the effects of conditioned litter C:P and FRic (χ2 = 1.959, DF 603
= 3, P = 0.581; Fig. C) and C:P and FDis (χ2 = 0.326, DF = 2, P = 0.849; Fig. D). The FRic/C:P 604
model best fit the available data (Fig. C). Black lines represent positive pathways, while red lines 605
represent negative pathways; gray lines represent pathways included in the model that were not 606
statistically significant. Standardized path coefficients, which show the direction and magnitude 607
of the relationship between variables, are reported next to each line. Lines represent causal 608
pathways included in the model, with single-headed arrows indicating a unidirectional pathway 609
and double-headed arrows indicating correlation between variables. The R2 is reported for each 610
endogenous variable. 611
Page 31
31
Figures 612
613
Fig. 1. 614
Page 32
32
615
Fig. 2. 616
Page 33
33
617 Fig. 3. 618
Page 34
34
619
620
Fig. 4. 621
622 623
Page 35
35
Appendices 624
Appendix A 625
Table A1: Proportion of inputs by mass for individual tree species sampled from the survey of 626
the riparian ecosystem of the low-elevation and high-elevation focal streams. 627
Low Elevation High Elevation
Species Collected Proportion
Species Collected Proportion
Quercus alba 0.393 Acer rubrum 0.207 Quercus rubra 0.214 Quercus rubra 0.173 Rhododendron maximum 0.181 Rhododendron maximum 0.100 Fagus grandifolia 0.076 Fagus grandifolia 0.064 Miscellaneous 0.136 Miscellaneous 0.456
628
629
630
631
632
633
634
635
636
637
638
639
640
641
642
Page 36
36
Appendix B 643
Table B1: Functional traits used to calculate functional richness and functional dispersion of the 644
detritivore community. Biomass was assigned as a single, continuous trait, while thermal 645
preference, rheophily, and foraging habit (Habit) were assigned as single trait states (i.e. a binary 646
presence/absence approach). 647
Taxon Per Capita Biomass (mg)
Habit Rheophily Thermal Preference
Amphinemura sp. 0.147
Sprawl Depositional & Erosional Cool/Warm Chironomidae 0.033
Sprawl Depositional & Erosional Cool/Warm
Eurylophella sp. 0.025
Cling Depositional & Erosional Cool/Warm Fattigia pele 1.646
Sprawl Depositional & Erosional Cold/Warm
Lepidostoma sp. 1.601
Climb Depositional & Erosional Cold/Cool Leptotarsus sp. 3.670
Sprawl Depositional & Erosional Cool/Warm
Leuctra sp. 0.177
Sprawl Depositional & Erosional Cool/Warm Paraleptophlebia sp. 0.173
Swim Depositional & Erosional Cool/Warm
Pycnopsyche sp. 10.744
Sprawl Depositional & Erosional Cold/Cool Tallaperla sp. 0.185
Cling Depositional & Erosional Cold/Cool
Viehoperla sp. 1.395
Cling Depositional & Erosional Cold/Cool
648
649
650
651
652
653
654
655
656
657
658
659
Page 37
37
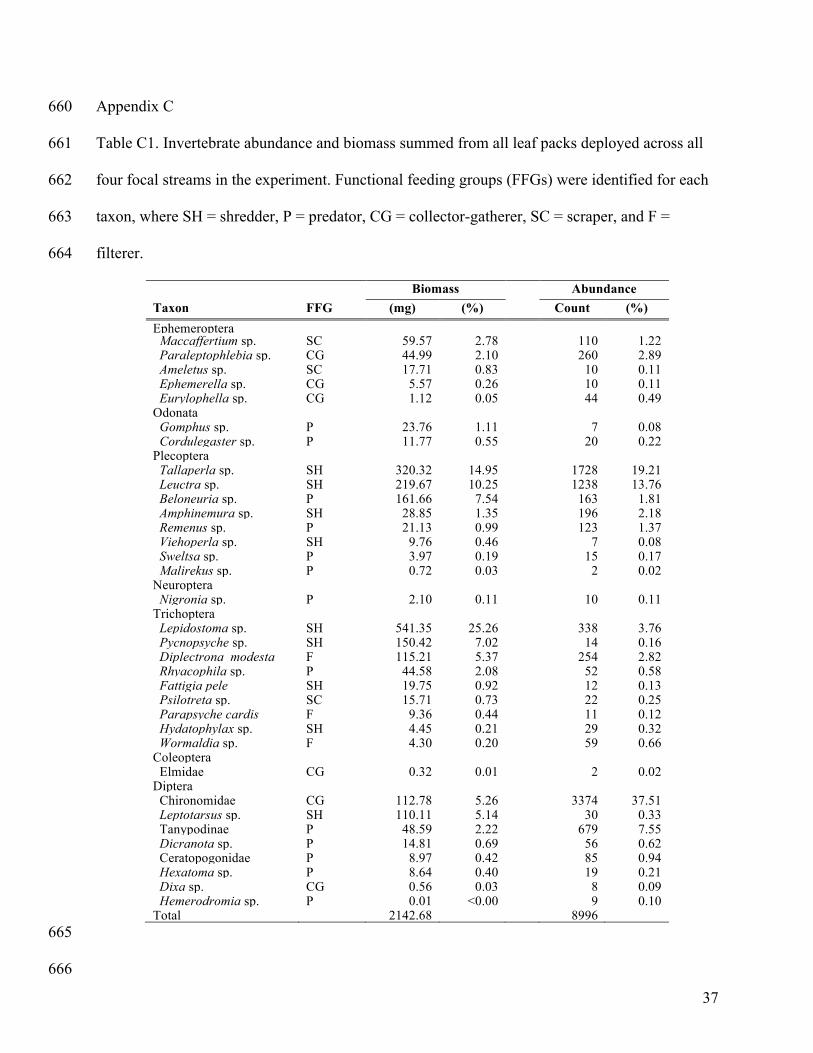
Appendix C 660
Table C1. Invertebrate abundance and biomass summed from all leaf packs deployed across all 661
four focal streams in the experiment. Functional feeding groups (FFGs) were identified for each 662
taxon, where SH = shredder, P = predator, CG = collector-gatherer, SC = scraper, and F = 663
filterer. 664
Biomass Abundance Taxon FFG (mg) (%) Count (%) Ephemeroptera Maccaffertium sp. SC 59.57 2.78 110 1.22 Paraleptophlebia sp. CG 44.99 2.10 260 2.89 Ameletus sp. SC 17.71 0.83 10 0.11 Ephemerella sp. CG 5.57 0.26 10 0.11 Eurylophella sp. CG 1.12 0.05 44 0.49 Odonata Gomphus sp. P 23.76 1.11 7 0.08 Cordulegaster sp. P 11.77 0.55 20 0.22 Plecoptera Tallaperla sp. SH 320.32 14.95 1728 19.21 Leuctra sp. SH 219.67 10.25 1238 13.76 Beloneuria sp. P 161.66 7.54 163 1.81 Amphinemura sp. SH 28.85 1.35 196 2.18 Remenus sp. P 21.13 0.99 123 1.37 Viehoperla sp. SH 9.76 0.46 7 0.08 Sweltsa sp. P 3.97 0.19 15 0.17 Malirekus sp. P 0.72 0.03 2 0.02 Neuroptera Nigronia sp. P 2.10 0.11 10 0.11 Trichoptera Lepidostoma sp. SH 541.35 25.26 338 3.76 Pycnopsyche sp. SH 150.42 7.02 14 0.16 Diplectrona modesta F 115.21 5.37 254 2.82 Rhyacophila sp. P 44.58 2.08 52 0.58 Fattigia pele SH 19.75 0.92 12 0.13 Psilotreta sp. SC 15.71 0.73 22 0.25 Parapsyche cardis F 9.36 0.44 11 0.12 Hydatophylax sp. SH 4.45 0.21 29 0.32 Wormaldia sp. F 4.30 0.20 59 0.66 Coleoptera Elmidae CG 0.32 0.01 2 0.02 Diptera Chironomidae CG 112.78 5.26 3374 37.51 Leptotarsus sp. SH 110.11 5.14 30 0.33 Tanypodinae P 48.59 2.22 679 7.55 Dicranota sp. P 14.81 0.69 56 0.62 Ceratopogonidae P 8.97 0.42 85 0.94 Hexatoma sp. P 8.64 0.40 19 0.21 Dixa sp. CG 0.56 0.03 8 0.09 Hemerodromia sp. P 0.01 <0.00 9 0.10 Total 2142.68 8996
665
666
Page 38
38
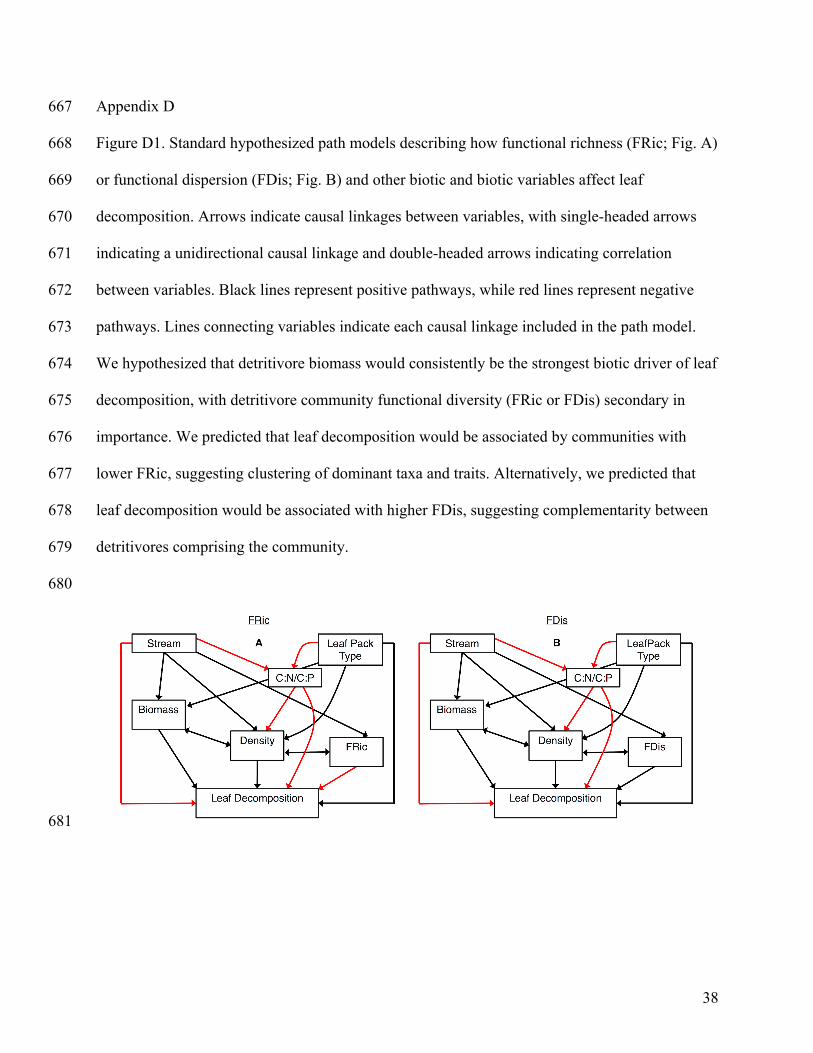
Appendix D 667
Figure D1. Standard hypothesized path models describing how functional richness (FRic; Fig. A) 668
or functional dispersion (FDis; Fig. B) and other biotic and biotic variables affect leaf 669
decomposition. Arrows indicate causal linkages between variables, with single-headed arrows 670
indicating a unidirectional causal linkage and double-headed arrows indicating correlation 671
between variables. Black lines represent positive pathways, while red lines represent negative 672
pathways. Lines connecting variables indicate each causal linkage included in the path model. 673
We hypothesized that detritivore biomass would consistently be the strongest biotic driver of leaf 674
decomposition, with detritivore community functional diversity (FRic or FDis) secondary in 675
importance. We predicted that leaf decomposition would be associated by communities with 676
lower FRic, suggesting clustering of dominant taxa and traits. Alternatively, we predicted that 677
leaf decomposition would be associated with higher FDis, suggesting complementarity between 678
detritivores comprising the community. 679
680
681
Page 39
39
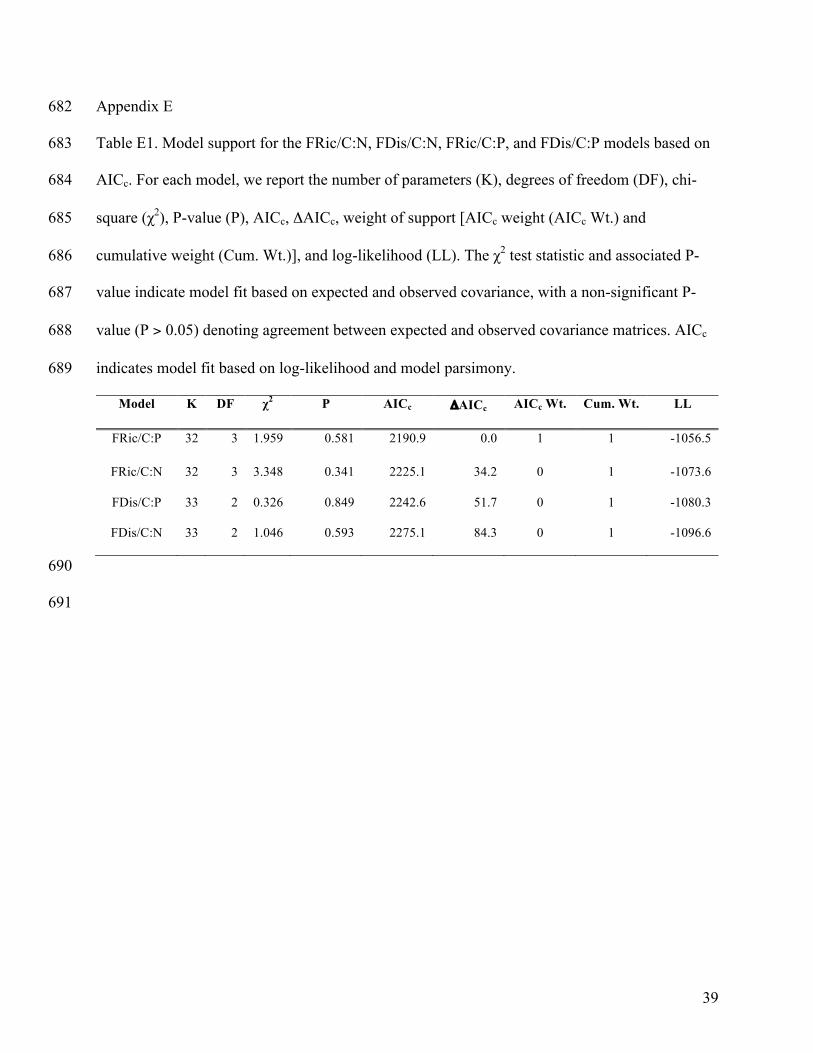
Appendix E 682
Table E1. Model support for the FRic/C:N, FDis/C:N, FRic/C:P, and FDis/C:P models based on 683
AICc. For each model, we report the number of parameters (K), degrees of freedom (DF), chi-684
square (χ2), P-value (P), AICc, ΔAICc, weight of support [AICc weight (AICc Wt.) and 685
cumulative weight (Cum. Wt.)], and log-likelihood (LL). The χ2 test statistic and associated P-686
value indicate model fit based on expected and observed covariance, with a non-significant P-687
value (P > 0.05) denoting agreement between expected and observed covariance matrices. AICc 688
indicates model fit based on log-likelihood and model parsimony. 689
Model K DF χ2 P AICc ΔAICc AICc Wt. Cum. Wt. LL
FRic/C:P 32 3 1.959 0.581 2190.9 0.0 1 1 -1056.5
FRic/C:N 32 3 3.348 0.341 2225.1 34.2 0 1 -1073.6
FDis/C:P 33 2 0.326 0.849 2242.6 51.7 0 1 -1080.3
FDis/C:N 33 2 1.046 0.593 2275.1 84.3 0 1 -1096.6
690
691
Page 40
40
Supplement 692 693 Data files and R script for all analyses. 694 695 Author 696 697 David Stoker 698 Odum School of Ecology 699 University of Georgia 700 140 E. Green St. 701 Athens GA 30602-2202 USA 702 E-mail: [email protected] 703 704 File List 705 CWT-site_survey.csv 706 CWT-traits.csv 707 CWT-model_data.csv 708 Stoker-CWT-LD.R 709 710 Description 711 712 The provided supplements should allow the reader to run each analysis in the manuscript as well 713 as all graphics excluding the path diagrams. The data are set into four files: (1) CWT-714 site_survey.csv, (2) CWT-traits.csv, and (3) CWT-model_data.csv. 715 716 CWT-site_survey.csv provides all the environmental data collected for the four focal streams. 717 718 CWT-traits.csv provides all the trait assignments for each taxon included in the functional trait 719 diversity analyses. 720 721 CWT-model_data.csv is the primary data for all analyses (ANOVAs, calculating functional trait 722 diversity, Bray-Curtis dissimilarities and PERMANOVA, and structural equation modeling). 723 724 Stoker-CWT-LD.R file provides all the code for loading required R packages, running analyses, 725 and creating figures for the manuscript. 726 727 728