SIPRI Yearbook 2011: Armaments, Disarmament and International Security 4. Military expenditure SAM PERLO- FREEMAN, JULIAN COOPER, OLAWALE ISMAIL , ELISABETH SKÖNS AND CARINA SOLMIRANO I. Introduction World military expenditure in 2010 reached $1630 billion, representing 2.6 per cent of global gross domestic product (GDP) or $236 for each person. Spending was 1.3 per cent higher in real terms than in 2009 and 50 per cent higher than in 2001. 1 The growth in 2010 was almost entirely due to the United States; military spending in the rest of the world increased by just 0.1 per cent. Over the period 2001–10, US military spend- ing increased by 81 per cent, compared to 32 per cent in the rest of the world. However, regional patterns varied considerably. Significant increases continued in 2010 in South America (5.8 per cent) and Africa (5.2 per cent). In contrast, the increases in North America (2.8 per cent) and Asia and Oceania (1.4 per cent) were lower than in recent years, while in Europe spending fell for the first time since 1998 (by 2.8 per cent). This reflects a delayed response to the global economic crisis, as European governments started to cut budget deficits, while in Asia growth in military spending slowed, in line with lower rates of economic growth in 2009. This chapter focuses on the military spending trends in six key regional powers: China, Russia, India, Brazil, Turkey and South Africa. Strong eco- nomic growth in each of these countries has given them increasing promin- ence in regional and global affairs. Along with their enhanced economic strength, each has in different ways sought to develop its role as a political and diplomatic actor—and as a military power. Most have increased mili- tary spending rapidly in recent years, and all are engaging in major military modernization programmes, not all of which are clearly linked to a per- ceived military threat or clear military mission. Sections III–VII of this chapter discuss the military spending trends in each of these countries, in the light of their overall defence and security policies. Before this, section II gives a brief overview of past and planned US mili- tary spending, while the chapter concludes in section VIII. Appendix 4A presents SIPRI’s complete tables of world, regional and national military 1 Except where otherwise stated, all US dollar figures for 2010 are in current (2010) prices and exchange rates, while all percentage changes are in real terms, calculated using constant 2009 prices and exchange rates. For full details see appendix 4A.
Transcript
SIPRI Yearbook 2011: Armaments, Disarmament and International Security
4. Military expenditure
SAM PERLO-FREEMAN, JULIAN COOPER, OLAWALE ISMAIL,
ELISABETH SKÖNS AND CARINA SOLMIRANO
I. Introduction
World military expenditure in 2010 reached $1630 billion, representing 2.6 per cent of global gross domestic product (GDP) or $236 for each person. Spending was 1.3 per cent higher in real terms than in 2009 and 50 per cent higher than in 2001.1 The growth in 2010 was almost entirely due to the United States; military spending in the rest of the world increased by just 0.1 per cent. Over the period 2001–10, US military spend-ing increased by 81 per cent, compared to 32 per cent in the rest of the world.
However, regional patterns varied considerably. Significant increases continued in 2010 in South America (5.8 per cent) and Africa (5.2 per cent). In contrast, the increases in North America (2.8 per cent) and Asia and Oceania (1.4 per cent) were lower than in recent years, while in Europe spending fell for the first time since 1998 (by 2.8 per cent). This reflects a delayed response to the global economic crisis, as European governments started to cut budget deficits, while in Asia growth in military spending slowed, in line with lower rates of economic growth in 2009.
This chapter focuses on the military spending trends in six key regional powers: China, Russia, India, Brazil, Turkey and South Africa. Strong eco-nomic growth in each of these countries has given them increasing promin-ence in regional and global affairs. Along with their enhanced economic strength, each has in different ways sought to develop its role as a political and diplomatic actor—and as a military power. Most have increased mili-tary spending rapidly in recent years, and all are engaging in major military modernization programmes, not all of which are clearly linked to a per-ceived military threat or clear military mission. Sections III–VII of this chapter discuss the military spending trends in each of these countries, in the light of their overall defence and security policies.
Before this, section II gives a brief overview of past and planned US mili-tary spending, while the chapter concludes in section VIII. Appendix 4A presents SIPRI’s complete tables of world, regional and national military
1 Except where otherwise stated, all US dollar figures for 2010 are in current (2010) prices and
exchange rates, while all percentage changes are in real terms, calculated using constant 2009 prices and exchange rates. For full details see appendix 4A.
158 MILITARY SPENDING AND ARMAMENTS, 2010
expenditure from 2001 to 2010, as well as information on regional trends in military spending in 2010, data on the top 15 military spenders, and the sources and methods for SIPRI data. Appendix 4B presents data on national reporting of military expenditure to SIPRI and to the United Nations, which reveals a decrease in the rates of reporting.
II. The United States
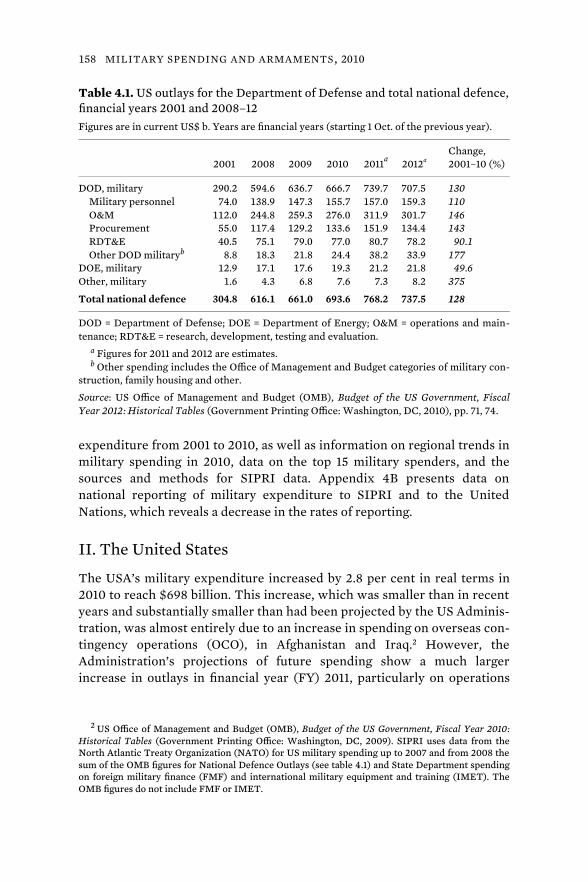
The USA’s military expenditure increased by 2.8 per cent in real terms in 2010 to reach $698 billion. This increase, which was smaller than in recent years and substantially smaller than had been projected by the US Adminis-tration, was almost entirely due to an increase in spending on overseas con-tingency operations (OCO), in Afghanistan and Iraq.2 However, the Administration’s projections of future spending show a much larger increase in outlays in financial year (FY) 2011, particularly on operations
2 US Office of Management and Budget (OMB), Budget of the US Government, Fiscal Year 2010:
Historical Tables (Government Printing Office: Washington, DC, 2009). SIPRI uses data from the North Atlantic Treaty Organization (NATO) for US military spending up to 2007 and from 2008 the sum of the OMB figures for National Defence Outlays (see table 4.1) and State Department spending on foreign military finance (FMF) and international military equipment and training (IMET). The OMB figures do not include FMF or IMET.
Table 4.1. US outlays for the Department of Defense and total national defence, financial years 2001 and 2008–12 Figures are in current US$ b. Years are financial years (starting 1 Oct. of the previous year).
Total national defence 304.8 616.1 661.0 693.6 768.2 737.5 128
DOD = Department of Defense; DOE = Department of Energy; O&M = operations and main-tenance; RDT&E = research, development, testing and evaluation.
a Figures for 2011 and 2012 are estimates. b Other spending includes the Office of Management and Budget categories of military con-
struction, family housing and other.
Source: US Office of Management and Budget (OMB), Budget of the US Government, FiscalYear 2012: Historical Tables (Government Printing Office: Washington, DC, 2010), pp. 71, 74.
MILITARY EXPENDITURE 159
and maintenance and procurement spending.3 This suggests that some of the spending planned for 2010 has been delayed until 2011.
The budget for FY 2012 represents a fall in both budget authority requested and projected outlays, which indicates that US military spending is finally peaking after a decade-long surge (see table 4.1). The drop in 2012 is due to a $41 billion decrease in requested spending on OCO, mostly resulting from the planned withdrawal of US troops from Iraq at the end of 2011.4 However, the base military budget request for 2012 (which excludes OCO but includes military spending outside the Department of Defense) is projected to be 0.8 per cent higher than in 2011, despite a $78 billion cut to previously planned procurement programmes over 5 years.5
III. China
The official Chinese defence budget for 2010 was 532 billion yuan ($78 bil-lion), but SIPRI estimates that China’s total military expenditure was 809 billion yuan ($119 billion).6 Military spending increased by 189 per cent in real terms between 2001 and 2010, an average annual increase of 12.5 per cent. The increase of 3.8 per cent in 2010 thus represents a significant slow-ing in the rate of growth, reflecting the lower economic growth in 2009 caused by the global recession.7 The rate of increase accelerated sharply in the 2000s compared to the 1980s and 1990s, when military modernization had the lowest priority among the ‘four modernizations’, behind agri-culture, industry, and science and technology. However, as a share of GDP, China’s military expenditure was consistently in the range 2.0–2.2 per cent in the period 2001–10.
China’s military modernization and rapidly growing military spending reflect the country’s equally rapid economic growth in recent years, which has propelled the country to the position of the world’s second largest economy and has defined its position as a global power.8 According to official policy, the country’s military modernization depends on and is sub-ordinate to national economic development.9
3 These projections were released with the US Administration’s budget request for FY 2012. US
Office of Management and Budget, Budget of the US Government, Fiscal Year 2012: Historical Tables (Government Printing Office: Washington, DC, 2010), p. 74. SIPRI figures relate to outlays (actual expenditure), in contrast to budgetary authority, which authorizes government spending. This authorization may lead to outlays in both the current and subsequent financial years.
4 US Office of Management and Budget, Budget of the US Government, Fiscal Year 2012 (Govern-ment Printing Office: Washington, DC, 2010), pp. 137–40.
5 US Office of Management and Budget (note 4), p. 59. 6 SIPRI has revised its estimates of China’s military expenditure. See appendix 4A, section III. 7 See e.g. Kou L. and Hui L., [Behind the scenes of the introduction of China’s 2010 national
defence budget], Guoji Xianqu Daobao, 12 Mar. 2010, Translation from Chinese, Open Source Center. 8 World Bank, World Development Indicators 2010 (World Bank: Washington, DC, 2010), p. 89. 9 Chinese State Council, Information Office, China’s National Defense in 2008 (Foreign Languages
Press: Beijing, Jan. 2009).
160 MILITARY SPENDING AND ARMAMENTS, 2010
SIPRI’s estimate of China’s military spending includes the official budget of the People’s Liberation Army (PLA) and official figures or estimates for a number of additional elements of military spending. The Chinese Govern-ment has provided a breakdown of the PLA budget, from 1998 onwards, into three categories: personnel, training and maintenance, and equipment (which includes procurement, maintenance, and research and develop-ment, R&D).10 These have consistently shown roughly equal shares for the three categories.11 No breakdown of spending by service is available.12 The main uncertainty in SIPRI’s estimate of total military expenditure is in esti-mating extra-budgetary spending on research, development, testing and evaluation.13
According to official statements, two of the major purposes of the large spending increases are improving the pay and living conditions of troops and the modernization and ‘informationization’ of the armed forces.14 The first is a natural development, given China’s rapid economic growth. The second reflects a determination to narrow the gap in military technology and capabilities with the West, especially the USA. Both Chinese and West-ern analyses indicate that the PLA has made considerable strides in infor-mationizing its systems and equipment, but that extending this throughout the 2.2 million-strong armed forces will take a long time. In particular, the ability of the different armed services to carry out joint operations is still questionable.15 In addition, the 2008 Defence White Paper for the first time emphasizes ‘military operations other than war’ (MOOTW), including dis-aster relief, peacekeeping and anti-piracy operations, as key tasks of the PLA. While the PLA has certainly become more involved in such activities in recent years, they are unlikely to account for a significant portion of mili-tary spending increases.16
10 Chinese defence white papers, 1998–2008, <http://eng.mod.gov.cn/Database/WhitePapers/>;
and Chinese submissions to United Nations Reporting Instrument for Military Expenditures, 1998–2010, <http://www.un.org/disarmament/convarms/Milex/html/Milex_SGReports.shtml>.
11 Definitions of categories such as ‘personnel’ and ‘equipment’ vary considerably between coun-tries in their reporting of budgets, so international comparisons of these shares are difficult.
12 In 2011 Xu Guangyu of the China Arms Control and Disarmament Association (CACDA) gave a rough breakdown of 60:20:20 between the army, navy and air force. Lin, J. Y., ‘China focuses on “far sea defense”’, Asia Times Online, 8 July 2010, <http://www.atimes.com/atimes/China/LG09Ad02. html>.
13 For more on the way in which SIPRI estimates China’s military spending see appendix 4A, sec-tion III.
14 Chinese State Council (note 9), chapter XII. ‘Informationization’ refers to the incorporation of modern information and communications technology into military systems and operations, the equivalent of ‘network-centric warfare’ in the West.
15 Polpetter, K., ‘Towards an integrative C4ISR system: informationization and joint operations in the People’s Liberation Army’, eds R. Kamphausen, D. Lai and A. Scobell, The PLA at Home and Abroad: Assessing the Operational Capabilities of China’s Military (US Army War College, Strategic Studies Institute: Carlisle, PA, June 2010).
16 See also Gill, B. and Huang, C., China’s Expanding Role in Peacekeeping: Prospects and Policy Implications, SIPRI Policy Paper no. 25 (SIPRI: Stockholm, Nov. 2009).
MILITARY EXPENDITURE 161
Until recently, much of China’s military modernization depended on imports from Russia, but these have declined substantially and China increasingly procures equipment domestically.17 The Chinese arms indus-try has made major advances in its ability to develop modern weapons, in particular in areas where it has been able to adapt Chinese strengths in civilian technology to military uses.18 However, developments in other areas, such as military aircraft, have depended more on copying imported Russian systems. China remains dependant on imports from Russia for some subsystems, especially military aircraft engines, and on some high-technology imports from Western Europe.19
Several areas of capability—including space technology, missile systems and cyberwarfare—have received particular priority as part of the drive towards the goal of ‘winning local wars in conditions of information-ization’.20 Some of the missile systems directly target Taiwan, while others form part of an asymmetric ‘anti-access’ and ‘area-denial’ strategy to keep the US Navy out of any potential conflict in the Taiwan Strait.21 China is also rapidly developing naval capabilities, both surface and submarine. This is key to projecting Chinese power in the South China Sea and, potentially, the Indian Ocean, while modern submarines can also form part of an ‘anti-access’ strategy.22 In addition, informationization has required major development in the training and education of troops.23
China describes its economic, political and security strategy as ‘peaceful development’, with major interstate conflict seen as only a remote pos-sibility for the foreseeable future.24 In particular, China regards deepening international economic interdependency as providing an ‘invisible shield’ against major conflict.25 China insists that it will never seek ‘hegemony’ and that its military development is purely for self-defence. As justification for military modernization, official statements frequently cite the ‘three evils’
17 See chapter 6, section II, in this volume; and Wezeman, S. T., Bromley, M. and Wezeman, P. D.,
‘International arms transfers’, SIPRI Yearbook 2009, pp. 308–13. 18 Medeiros, E. S. et al., A New Direction for China’s Defense Industry (RAND Corporation: Santa
Monica, CA, 2005); and Mulvenon, J. and Tyroler-Cooper, R. S., ‘China’s defense industry on the path of reform’, US–China Economic and Security Review Commission, Oct. 2009, <http://www. uscc.gov/researchpapers/research_archive.php>.
19 Wezeman et al. (note 17). 20 Chinese State Council (note 9), chapter II. On space technology see Fisher, R. D., ‘China’s scary
space ambitions’, Wall Street Journal, 20 Jan. 2010. 21 US Department of Defense (DOD), Military and Security Developments Involving the People’s
Republic of China 2010, Annual report to Congress (DOD: Washington, DC, 2010), pp. 29–33. 22 Tran, P., ‘China extends military’s reach’, Defense News, 24 May 2010; Polpetter (note 15); and
Lin (note 11). 23 ‘2nd Ld: China’s military forces to be trained for informationized warfare’, Xinhua, 5 Mar.
2009. 24 Chinese State Council (note 9). 25 Shitting, X. and Junlan, Z., [Seize opportunity of domestic demand stimulation to advance
national defense building to new level], Junshi Jingji Yanjiu, Dec. 2009, Translation from Chinese, Open Source Center, 9 Feb. 2010.
162 MILITARY SPENDING AND ARMAMENTS, 2010
of separatism, terrorism and extremism and other new security challenges, as well as peacekeeping and anti-piracy missions.26
The stated goal of modernization of ‘winning local wars in conditions of informationization’ most likely relates to potential conflict with the USA over Taiwan, which China regards as an integral part of its territory. The USA has pledged to defend and supplies arms to Taiwan, and in 2010 it announced an arms sale worth $6.4 billion.27 While relations between China and Taiwan have improved in recent years and China currently regards prospects for continued peace as good, its military modernization is in part a preparation for a worst-case scenario.
Aside from the Taiwan issue, as China’s military power grows it appears to be becoming more assertive on claims to sovereignty in the South China Sea, disputed with Malaysia, the Philippines, Taiwan and Viet Nam, as well as its dispute with Japan over the Senkaku/Diaoyu Islands.28 Beyond this, as a growing economic power, China’s perceptions of its own interests and of what constitutes its security have expanded. In particular, as economic growth brings rapidly increasing energy demands, China is seeking access to and investments in energy resources from Africa to Latin America. The development of naval power is thus also aimed at guaranteeing China’s vital sea lines of communication.
China’s assurances of its peaceful intent have not stopped both the USA and neighbouring states including India and Japan from expressing con-cern at, and responding to, China’s growing military power.29 However, China’s increases in military spending partly reflect its own fear of over-whelming US military power. Leading Chinese generals have made it clear that for China to continue to lag so far behind the West in military tech-nology would leave it vulnerable.30
While China’s rapid economic growth has pulled hundreds of millions of people out of poverty, this has been accompanied by environmental prob-lems, economic inequality and continuing poverty in much of the country’s interior. For the moment, however, the tension between military and social spending is mitigated by economic growth that permits increases in both.31
26 Chinese State Council (note 9). 27 American Institute in Taiwan, ‘U.S. arms sales to Taiwan’, Press release, 11 Feb. 2010, <http://
www.ait.org.tw/en/pressrelease-pr1012.html>. 28 E.g. Sutter, R. and Huang, C., ‘China–Southeast Asia relations: senior officials visits; South
China Sea tensions’, Comparative Connections, vol. 12, no. 2 (July 2010), pp. 71–72. 29 See e.g. Gienger, V., ‘Gates seeks more stable China relations as Pentagon hedges bets’, Bloom-
berg Businessweek, 9 Jan. 2011; and Japanese Ministry of Defence, ‘National defense program guide-lines for FY 2011 and beyond’, 17 Dec. 2010, <http://www.mod.go.jp/e/d_act/d_policy/national. html>.
30 E.g. Ma Xiaotian (Gen.), Deputy Chief of PLA General Staff, reported in Ai Y., Li X. and Wang C., ‘China needs to “forge ahead” in defense’, China Daily, 22 Oct. 2010.
31 E.g. ‘China budget increases social spending’, Associated Press, 5 Mar. 2011, <http://www.cbc. ca/news/world/story/2011/03/05/china-budget.html>.
MILITARY EXPENDITURE 163
IV. Russia
Russia’s military expenditure in 2010 was 1782 billion roubles ($58.7 bil-lion), 1.4 per cent lower in real terms than in 2009, but 82 per cent higher than in 2001.
Russia as a regional power can only be understood in the context of its role as the largest successor state of the Soviet Union, a Communist coun-try with a centrally planned economy and a military capability comparable to that of the USA. In the 1980s Soviet military spending is thought to have reached at least 18 per cent of national income.32 The vast Soviet arms industry employed about 10 million people, and by 1990 the armed forces of the Ministry of Defence (MOD) alone had 3 393 000 uniformed person-nel.33 Reductions in Soviet military expenditure began in 1989, but in 1992 newly independent Russia retained a hypertrophied military capability.
Russia is still marked in a number of respects by its Communist past. It has a functioning market economy, but one in which the state plays a significant role. The economy is orientated strongly to resource extraction and export, with a relatively weak and uncompetitive manufacturing sector in which armaments occupy a predominant position. Democracy in Russia remains weak, and corruption is a serious problem.
During the 1990s the Russian economy contracted sharply as a turbulent market transformation was undertaken. As a result, military expenditure fell rapidly, to 32 per cent of its 1992 level by 1998 and from 5.5 per cent to 3.3 per cent of GDP. The arms industry also contracted rapidly. But after the 1998 economic crisis, the Russian economy began to recover, and it has since enjoyed a period of steady growth, in part fostered by rising prices for oil, natural gas and metals, the country’s principal export goods. This per-mitted an expansion of military spending, which grew approximately in line with GDP (see table 4.2).
During President Vladimir Putin’s first term of office (2000–2004) ‘national defence’ spending, which includes outlays on the MOD forces, nuclear weapons and some other categories of direct military support, grew much in line with the growth of GDP, by about 60 per cent in real terms.34 However, in his second term (2004–2008) it lagged behind the growth of GDP, falling to a share of 2.5 per cent. The August 2008 conflict
32 Vikulov, S. F., [Theory and practice: in a bundle], Voenno-ekonomicheskii zhurnal Tyl’, no. 3,
1993, pp. 4–5. 33 Minaev, A. V. (ed.), [Soviet military might from Stalin to Gorbachev] (Voennyi parad: Moscow,
1999), p. 121. 34 The real-terms calculation is based on the annual GDP deflator. In Russian conditions, with
rapidly rising costs for procurement of arms and other materiel, this method better reflects price trends in relation to goods purchased by government agencies than the consumer price index (CPI), which is used to calculate SIPRI’s constant US dollar figures in appendix 4A. Using the CPI, Russian military spending grew by 86% in real terms between 1999 and 2004.
164 MILITARY SPENDING AND ARMAMENTS, 2010
in Georgia prompted a policy change. Military reform and modernization became a national priority, and notwithstanding the severe impact on Russia of the global financial crisis, ‘national defence’ spending increased in real terms, to over 3 per cent of GDP in 2009.35 In the plans for 2011–13, the ‘national defence’ budget is to increase more rapidly than the rate of growth of GDP, although in 2010 this budget fell by 5 per cent in real terms compared with 2009.36
Even though the Russian military is a predominantly conscripted force, its large size means that personnel and operations and maintenance costs have dominated military spending. However, the scale of the MOD forces has gradually been reduced, and since the appointment in 2007 of Anatoly Serdyukov as defence minister, the Russian armed forces have been under-going a fundamental restructuring and modernization. The number of personnel has been reduced from 1.2 million to 1 million, mainly by retiring
35 E.g. Cowan, G. and Petrov, V., ‘Russian defence modernisation “will stay on track” despite
crisis’, Jane’s Defence Weekly, 25 Mar. 2009, p. 13. 36 Cooper, J., ‘Military expenditure in the Russian federal budget, 2010–2013’, Research note,
Table 4.2. Russian military expenditure 2001, 2005, 2008–11 All figures are in current prices.
‘National defence’ ‘National defence’ SIPRI estimate of SIPRI estimate of spending spending as a military spending military spending as a Yeara (b. roubles) share of GDP (%)b (b. roubles)c share of GDP (%)b
GDP = gross domestic product. a Figures for 2001–10 are for actual spending; figures for 2011 are budgeted figures. b The figures for 2001–2009 are based on GDP statistics from the IMF’s International
Finance Statistics; the figures for 2010–11 are based on the IMF’s World Economic Outlook projections.
c SIPRI’s data for Russia’s total military spending includes spending on military pensionsand various paramilitary forces, an estimate of additional military research and developmentspending, and some military-related subsidies, in addition to ‘national defence’ spending.
Sources: Appendix 4A; ‘National defence’ spending, 2000–2009: annual laws on budget imple-mentation, <http://www.kremlin.ru/acts>; 2010 (provisional): Russian Federal Treasury, [Per-formance report of the federal budget], 1 Jan. 2011, <http://www.roskazna.ru/reports/oi.html>; 2011: Federal budget, draft as transmitted to State Duma, draft law 433091-5, Oct. 2010,<http://asozd2.duma.gov.ru/>; GDP, 2000–2009: Russian Federal State Statistics Service (Ros-stat), <http://www.gks.ru/wps/wcm/connect/rosstat/rosstatsite/main/account/>.
MILITARY EXPENDITURE 165
officers. At the same time, many support services are now undertaken by civilian employees or have been contracted out to external suppliers.37 According to data submitted to the UN, 36 per cent of MOD spending in 2008 was for personnel, 23 per cent for operations and maintenance, 23 per cent for arms procurement, and 9 per cent each for R&D and construc-tion.38 Over time, the share of procurement has been gradually rising, and this trend is likely to be maintained over the next few years.
The most recent state armaments programme, approved in October 2006, envisaged expenditure over the 10 years to 2015 of 5000 billion roubles ($165 billion).39 Since the conflict in Georgia, a new programme has been drafted, for the period to 2020. By the end of 2010, the programme had not yet been approved, but it appeared that total MOD expenditure would be 20 000 billion roubles ($659 billion), reflecting a new commit-ment to thoroughly re-equipping the Russian armed forces over the next decade.40 This will inevitably involve an increased share of GDP being spent on the military from 2012 (the probable first year of implementation), perhaps up to 3.5 per cent.
By service, the ground forces have consistently accounted for the largest share of spending. In 2005–2008 they received an average of 33 per cent of the total, the navy 18 per cent, the air and air defence forces 13 per cent, other forces (mainly the Strategic Rocket Forces, responsible for the land-based intercontinental ballistic missile capability) 17 per cent, and central support and administration 19 per cent.41
In conjunction with a major reorganization of the overall arms acqui-sition system, a potentially significant development is a new willingness to import weapons if the domestic arms industry is unable to supply the modern equipment required.42 The most prominent example is the decision to buy from France two Mistral class helicopter-carrying assault vessels, with an option to build two more at a shipyard in St Petersburg.43 Other imports include unmanned aerial vehicles (UAVs) from Israel and armoured vehicles from Italy. However, the intention is not to rely on
37 Galeotti, M., ‘Russian reform act’, Jane’s Defence Weekly, 29 Sep. 2010, pp. 26–31. 38 United Nations, Office for Disarmament Affairs, Instrument for Reporting Military Expend-
itures Database, <http://disarmament.un.org/Milex.nsf>. 39 Sergeev, M., [Sergei Ivanov has been given a new organization], Gazeta, 31 July 2006, p. 9. The
annual state order for new arms procurement, repairs, modernization and military R&D is drawn up within the framework of a 10-year state armaments programme, updated every 5 years. Since 1996, 3 programmes have been operational.
40 [State armaments programme], Krasnaya zvezda, 30 Dec. 2010. 41 United Nations (note 38). For comparison with the late Soviet period and the first half of the
1990s see Cooper, J., ‘The military expenditure of the USSR and the Russian Federation, 1987–97’, SIPRI Yearbook 1998.
42 See Cooper, J., ‘Military procurement in Russia’, eds B. Nygren, C. Vendil Pallin and R. McDermott, Russian Military Development (Routledge: Abingdon, forthcoming 2011).
43 See chapter 6, section IV, in this volume.
166 MILITARY SPENDING AND ARMAMENTS, 2010
imports but rather to develop the manufacture of equipment produced by foreign companies in Russia on a joint venture or licence basis.
Russia’s military doctrine, which provides the context for the develop-ment of Russia’s armed forces, was updated in February 2010.44 It identifies the North Atlantic Treaty Organization (NATO) as a ‘danger’—that is, a potential threat—but not as a current threat. Nuclear weapons remain a key component of Russia’s military capability but are to be used only in response to an attack by weapons of mass destruction or ‘when the very existence of the state is under threat’. The 2010 Russian–US Treaty on Measures for the Further Reduction and Limitation of Strategic Offensive Arms (New START) reflects the fact that Russia’s strategic nuclear cap-ability will inevitably contract over the coming years as Soviet-era missiles are withdrawn faster than they can be replaced by new systems.45 The 2008 conflict in Georgia revealed to the political and military leadership that the armed forces required substantial upgrading. The new doctrine recognizes that conventional forces are most likely to be deployed in local conflicts, border and internal security, and anti-terrorist actions. In terms of the acquisition of new armaments, priorities are now systems for intelligence, communications, command and control, air and space defence systems; combat aeroplanes and helicopters; and equipment that will increase force mobility. These priorities are likely to be reflected in the new armaments programme and spending priorities up to 2020.
V. India
India’s military expenditure in 2010 was an estimated 1888 billion rupees ($41.3 billion), 2.8 per cent lower in real terms than in 2009 but 54 per cent higher than in 2001.46 The decline in 2010, the first fall in Indian military spending since 2002, appears to reflect a ‘rebalancing’ in relation to eco-nomic growth rates. In the mid-2000s, annual GDP growth rates of 8–9 per cent meant that the military burden fell from 3.0 per cent of GDP in 2001 to 2.3 per cent in 2007, but slower economic growth in 2008–2009 had raised the burden to 2.8 per cent in 2009 and an estimated 2.7 in 2010.
Like China, strong economic performance has propelled India to the status of a rising regional power with increasing global aspirations. While
44 [Military Doctrine of the Russian Federation], Approved by presidential decree, 5 Feb. 2010,
<http://news.kremlin.ru/ref_notes/461> (in Russian). For an insightful analysis see Giles, K., ‘The Military Doctrine of the Russian Federation 2010’, Research Review, NATO Defense College, Rome, Feb. 2010, <http://www.ndc.nato.int/research/series.php?icode=9>.
45 On Russia’s nuclear forces see chapter 7, section III, in this volume. On New START see chap-ter 8, section II, and annex A in this volume.
46 These are estimates for the calendar year 2010. Budgeted military spending for FY 2010/11 was 1911 billion rupees ($41.7 billion). SIPRI estimates spending for calendar years by assuming an even rate of spending across the year.
MILITARY EXPENDITURE 167
India has traditionally had a close relationship with Russia, in recent years it has developed a strong strategic partnership with the USA, including wide-ranging agreements on civil nuclear and military cooperation. In part, this relationship is an attempt by both India and the USA to balance China’s power, but India also sees partnership with the global superpower as an affirmation of its own growing importance in world affairs.47
Most discussions of India’s military spending only refer to the ‘defence services’ budget, which includes the current and capital expenditure of the army, navy and air force, as well as R&D spending. This budget totalled 1473 billion rupees ($32.2 billion) in FY 2010/11. SIPRI’s figures for total Indian military spending include two additional elements: the ‘defence civil estimates’ and expenditure on paramilitary forces. The ‘defence civil esti-mates’ include central MOD expenditure and military pensions, which totalled 284 billion rupees ($6.2 billion) in FY 2010/11. Expenditure on paramilitary forces has increased especially rapidly since 2001—to reach 153 billion rupees ($3.3 billion) in FY 2010/11—perhaps partly due to the role of these forces in combating the Maoist Naxalite rebels.
Three trends are notable in the budget for the regular armed forces (the defence services and defence civil estimates). First, capital expenditure (on equipment and infrastructure) jumped from 23 per cent of total spending on the regular armed forces in 2003/2004 to 37 per cent in FY 2004/2005 and has remained around 34 per cent since then. This spending has been used to modernize the Indian armed forces, whose equipment was pre-viously dominated by Soviet-era technology. Moreover, the capital budget is planned to increase by 10 per cent each year up to FY 2015/16.48 Second, in conjunction with this the share of the total devoted to R&D has quad-rupled, from 1.3 per cent in FY 2001/2002 to 5.6 per cent in FY 2010/11. This reflects a long-standing desire to improve the performance of the sclerotic Indian arms industry, with R&D efforts accompanied by attempts to reform the industry by allowing more private involvement and to obtain foreign technology through offset arrangements.49 Third, there has been a substantial increase in the Indian Air Force’s share of the capital budget. While this has primarily been at the expense of the army, it has also affected the navy, despite the strong policy focus on naval development.
47 See e.g. Indian Embassy in Washington, DC, ‘India–US defense relations’, [n.d.], <http://www.
indianembassy.org/india-us-defense-relations.php>; and ‘India very important strategic partner: US’, The Hindu, 13 Feb. 2009.
48 Mathew, T., ‘No cap on FDI in defence’, New Indian Express, 8 Apr. 2010; and ‘India offers huge defence market’, Indian Aviation Civil & Military, May/June 2010, pp. 13–22.
49 See e.g. Indian Ministry of Defence (MOD), Annual Report 2009–2010 (MOD: New Delhi, [2010]); Indian MOD, Department of Defence Production, Defence Production Policy 2011 (MOD: New Delhi, Jan. 2011); and Indian MOD, Defence Procurement Procedure 2011 (MOD: New Delhi, Dec. 2010). See also Matthew (note 48).
168 MILITARY SPENDING AND ARMAMENTS, 2010
However, the absolute level of spending on naval equipment has increased rapidly.
India was the world’s largest recipient of major conventional weapons over the period 2006–10, reflecting both the rapid pace of India’s military modernization and the inability of the domestic industry to supply it.50 India’s Defence Minister, A. K. Antony, stated in 2009 that 70 per cent of India’s military equipment was imported.51 Since 2003, aircraft have accounted for a majority of India’s imports by volume, reflecting in part the increasing share of capital expenditure allocated to the air force.52 The aim of the modernization of the air force, with both new major combat aircraft and sensors, radars, satellites and UAVs, is to achieve superiority over China and Pakistan in air power and information.53 In the naval sphere, India has been seeking for some years to expand its blue-water naval capabilities to allow it to project power in the Indian Ocean. Some equip-ment has been acquired specifically to prevent or respond to terrorist acts such as the Mumbai attacks of November 2008, including sensors for the coastguard and transport aircraft to speed up response.54
India has not published any comprehensive defence or security strategy document and does not issue defence white papers, although a summary of its defence policy is given in the MOD’s annual reports and each of the three armed services has a doctrine.55 In practice, several pressing security issues largely determine the direction of India’s security policy and thus its military spending. First, the insurgency in Kashmir and the related conflict with Pakistan remain unresolved. India also suspects elements of the Paki-stani intelligence services of involvement in the 2008 Mumbai terrorist attacks. While India’s military expenditure now vastly exceeds Pakistan’s, both the insurgency itself and the potential for wider conflict mean that Pakistan and Kashmir remain a major focus for India’s armed forces. The experience of the brief, inconclusive 1999 ‘Kargil war’ is one factor driving the modernization of India’s military aircraft and its pursuit of network-
50 See chapter 6, section III, in this volume. 51 Grevatt, J. ‘Indian defence minister urges DRDO to maintain high-tech focus in self-reliance
measures the volume of arms imports, which cannot be directly linked to military expenditure since it does not usually reflect the price paid and since delivery of an import does not necessarily coincide with payment.
53 See chapter 6 in this volume; ‘Indian air force turns 77’, Indian Aviation Civil & Military, Sep./ Oct. 2009, pp. 18, 20–21; and Sawhney, P. and Wahab, G., ‘Building capabilities’, Force (New Delhi), Oct. 2010.
54 Bedi, R., ‘Mumbai attack prompts Indian security spending’, Jane’s Defence Weekly, 28 Jan. 2009, p. 14; and ‘India boosts terror defense’, Defense Technology International, Jan. 2009, p. 10. Note that spending on the coastguard is not included in SIPRI military spending figures for India.
55 See e.g. Datta, R., ‘An urgent need for national defence policy’, Political and Defence Weekly (New Delhi), 9–15 Nov. 2010, pp. 17–18.
MILITARY EXPENDITURE 169
centric systems.56 With both countries possessing nuclear weapons, India sees the option of an all-out military attack on Pakistan in response to Paki-stani actions as unviable. Instead, India has decided to develop capabilities for delivering limited, swift, ‘smart’ attacks, as expressed in its 2004 ‘cold start’ armed forces plan for mobilizing for limited warfare within 72 hours.57
Second, the burgeoning Naxalite rebellion by Maoist groups—which reflect the economic and environmental grievances of a variety of mar-ginalized groups—have been described by the Indian Prime Minister, Manmohan Singh, as India’s greatest internal security threat. In 2009 this intrastate conflict for the first time overtook that in Kashmir as India’s most lethal.58
Third, despite the long-running conflict with Pakistan, India in many ways sees China as its major rival; the ‘China threat’ is a perennial theme in Indian defence and foreign policy circles and in the media.59 The two coun-tries have several territorial disputes, most notably China’s claim to most of the Indian state of Arunachal Pradesh, over which tensions sharpened in 2010, and both sides have built up their forces near the border.60 China’s military modernization has been so rapid that the Indian military now admits that it is far behind in most categories of weaponry.61 India also sees China as a potential rival for influence in the Indian Ocean. India’s sus-picions are particular aroused by China’s investment in major port facilities in Bangladesh, Myanmar, Pakistan and Sri Lanka—the so-called string of pearls. Although these are purely civilian port facilities, India fears that China could use them to project naval power in the future.62 Despite these issues, the Indian Government is keen to downplay tensions, and trade relations between the two countries are growing.63
India’s relatively high and rising level of military spending is con-troversial in a country where extreme poverty is still prevalent. In 2005 India had more people living on less than $1.25 a day than sub-Saharan
56 ‘India offers huge defense market’ (note 48). On the 1999 India–Pakistan conflict, the ‘Kargil
war’, over Kashmir see Seybolt, T. B., ‘Major armed conflicts’, SIPRI Yearbook 2000, pp. 20–21. 57 See e.g. Ladwig, W. C., ‘A cold start for hot wars? The Indian Army’s new limited war doctrine’,
International Security, vol. 32, no. 3 (winter 2007/2008), pp. 158–90. 58 Uppsala Conflict Data Program (UCDP) Database, <http://www.ucdp.uu.se/>. The Naxalite
conflict (denoted ‘India (government)’ by the UCDP) is classified as a minor armed conflict since it has never crossed the threshold of 1000 battle-related deaths in a year. See appendix 2A in this volume.
59 For an overview of China–India relations see Malone, D. and Mukherjee, R., ‘India and China: conflict and cooperation’, Survival, vol. 52, no. 1 (Feb./Mar. 2010).
60 Bhaumik, S., ‘India to deploy 36,000 troops on Chinese border’, BBC News, 23 Nov. 2010, <http://www.bbc.co.uk/news/world-south-asia-11818840>; and Shukla, A., ‘Now, another air force base on the China border’, Business Standard (New Delhi), 2 Oct. 2010.
61 Gupta, S., ‘Spendings stuck, India trails China in firepower’, Indian Express, 30 Sep. 2010. 62 Lamont, J. and Kazmin, A., ‘Fear of influence’, Financial Times, 13 July 2009, p. 5. 63 See e.g. ‘India and China set $100bn trade target by 2015’, BBC News, 16 Dec. 2010, <http://
www.bbc.co.uk/news/world-south-asia-12006092>.
170 MILITARY SPENDING AND ARMAMENTS, 2010
Africa.64 Indian non-governmental organizations (NGOs), UN officials in India and others have spoken in favour of redirecting money spent on the military towards development.65 At the same time, surveys of Indian public opinion in 2010 showed that respondents perceived Pakistan and Islamic terrorist groups to be threats, feared China’s military power and had a positive view of the Indian military as an institution.66 Thus, high levels of military expenditure do not necessarily run contrary to Indian public opinion.
VI. Brazil
In 2010 Brazil’s military spending was 59 billion reais ($33.5 billion), 9.3 per cent higher in real terms than in 2009. Between 2001 and 2010, military expenditure rose by 30 per cent, an annual average of only 2.9 per cent. The slow increase over the decade is explained by the cut of 20 per cent made to the military budget in 2003 by President Luiz Inácio Lula da Silva as part of his ‘zero hunger’ programme.67 While this cut reversed a steadily rising trend since the mid-1990s, from 2004 military expenditure rose again, at an annual average of 6.9 per cent in 2004–2010. Between 2003 and 2010 Brazilian military expenditure was consistently 1.5–1.6 per cent of GDP, indicating that military spending increases have been broadly in line with economic growth. However, a financial adjustment programme proposed by President Dilma Rousseff in early 2011 aimed at slowing the rate of GDP growth includes a cut of 27 per cent in the planned military budget for 2011.68
A combination of factors has given Brazil a leadership role in South America. Brazil’s economic performance in the past decade, with GDP growth of 41 per cent between 2001 and 2010, has made the country the world’s 8th largest economy.69 It is the largest country in South America and the fifth largest in the world.70 It is one of the most stable democracies
64 World Bank (note 8), p. 92. 65 E.g. Menon, S., ‘India’s problem is implementation’, Business Standard (New Delhi), 19 Oct.
2009; and Control Arms Foundation of India, ‘Indian civil society challenges international arms manufacturers at DEFEXPO 2010’, Press communiqué, 12 Feb. 2010, <http://www.cafi-online.org/ press-detail.php?pr_id=27>.
66 Pew Research Center, Global Attitudes Project, ‘Indians see threat from Pakistan, extremist groups’, 20 Oct. 2010, <http://pewglobal.org/2010/10/20/>; and Pew Research Center, Global Atti-tudes Project, ‘Obama more popular abroad than at home, global image of U.S. continues to benefit’, 17 June 2010, <http://pewglobal.org/2010/06/17/>, pp. 51–55.
67 On this programme and cuts to Brazil’s military expenditure see Sköns, E. et al., ‘Military expenditure’, SIPRI Yearbook 2004, pp. 335–37.
68 Lima, M. S., ‘Governo oficializa corte de R$ 50 bi no orçamento de 2011’ [Government formal-izes cut of R$50 billion in the 2011 budget], Folha, 9 Feb. 2011.
69 International Monetary Fund, World Economic Outlook database, Oct. 2010, <http://www.imf. org/external/ns/cs.aspx?id=28>.
70 United Nations Population Fund (UNFPA), State of World Population 2010: From Conflict and Crisis to Renewal—Generation of Change (UNFPA: New York, 2010).
MILITARY EXPENDITURE 171
in the region. It has pursued a proactive foreign policy in its own neigh-bourhood and beyond, based on two broad goals: regional integration and multilateralism.71 Brazil’s aspirations to a broader regional and inter-national role are reflected in its long-standing desire for a permanent seat on the UN Security Council. The fact that Brazil is a founder of the Group of 20 (G20) leading developed and developing economies also gives it a special place among the emerging powers.72
SIPRI’s figures for Brazil’s military expenditure are based on the budget act (lei orçamentária) approved by the National Congress each year. In 2010, 73 per cent of the budget was spent on personnel (salaries and pen-sions), with the remaining 27 per cent allocated to ‘current and other type of expenses’, including arms acquisitions.73 In addition to the regular mili-tary budget for 2010, the MOD was allocated 1.5 billion reais ($853 million) from the investment budget to improve the airspace control system and develop airport infrastructure.74
Along with many other countries in the region, Brazil has in recent years embarked on a programme to modernize and upgrade its armed forces. The 2008 National Defence Strategy announced plans to boost Brazil’s military capabilities and reinvigorate the domestic arms industry through a series of acquisitions, which include significant volumes of technology transfer.75 Most important is the agreement signed with France in September 2009 for the production of four Scorpène class diesel-powered submarines and Brazil’s first nuclear-powered submarine, as well as 50 Super Cougar EC725 helicopters, which are to be built in Brazil.76 The first submarine is to be delivered to Brazil in 2017.77 The submarine deal was reported to cost €6.7 billion ($9.5 billion) and is to be financed by a consortium of banks.78
71 Roett, R., ‘Brazil: an emerging power’, Paper presented at the conference ‘Worldviews of Major
and Aspiring Powers: Exploring National Identities’, George Washington University, Sigur Center for Asian Studies, 14 Sep. 2007, <http://www.gwu.edu/~sigur/research/worldviews.cfm>, p. 2.
72 See Hurrell, A., ‘Lula’s Brazil: a rising power, but going where?’, Current History, vol. 107, no. 706 (Feb. 2008), p. 51.
73 The predominance of personnel expenses over other expenses is a typical pattern across Latin America. On the distribution of military expenditure in other countries see A Comparative Atlas of Defence in Latin America and Caribbean, 2010 edn (RESDAL: Buenos Aires, 2010).
74 Lei Orçamentária [Budget act], Brazilian Act no. 12.214, 26 Jan. 2010, Diário Oficial da União (Brasília), 27 Jan. 2010, pp. 1598–653.
75 Brazilian Ministry of Defence (MOD), Éstrategia Nacional de Defesa: Paz e segurança para o Brasil [National Defence Strategy: peace and security in Brazil] (MOD: Brasília, 17 Dec. 2008). See also Perlo-Freeman, S. et al., ‘Military expenditure’, SIPRI Yearbook 2009, pp. 202–204; and Holtom, P. et al., ‘International arms transfers’, SIPRI Yearbook 2008, p. 309.
76 Anderson, G. and Jennings, G., ‘Brazil signs deal worth EUR6 billion with France’, Jane’s Defence Weekly, 14 Jan. 2009, p. 8.
77 Fish, T., ‘Steel cutting begins for first Brazilian Scorpene’, Jane’s Defence Weekly, 2 June 2010, p. 6.
78 Barreria, V., ‘Brazil puts price tag on its new submarine fleet’, Jane’s Defence Weekly, 26 Aug. 2009, p. 12.
172 MILITARY SPENDING AND ARMAMENTS, 2010
The Brazilian Air Force is similarly pursuing a programme of modern-izing its fleet of combat aircraft, known as the FX-2 programme. Although initiated in 2002, the programme was relaunched in 2007 and an open tender competition announced in 2008.79 The winning contender for a $2 billion deal, which would include the joint production of some of the aircraft in Brazil (via technology transfer), was expected to be announced in 2011. However, the proposed cut in the MOD’s budget for 2011 may lead to further delays in the deal. The cut may cause the cancellation or delay of other procurement plans, such as a $6 billion deal to acquire frigates and patrol boats and a proposed integrated border surveillance system that would include the acquisition of radars, armoured vehicles and UAVs.80
Brazilian defence policy can be understood in terms of Brazil’s broader foreign policy goals as an emerging regional power with a significant role in global affairs. The 2008 National Defence Strategy examines the security challenges faced by Brazil in the 21st century in key strategic areas such as space, cybernetics, nuclear energy, and the defence of the Amazon region and of recently discovered offshore oil fields.81 Despite Brazil’s location in a peaceful region, the strategy argues that the country has to be prepared to defend itself from potential conflicts and to take its place in the world.82 The procurement plans discussed above appear to be a way to enhance Brazil’s power-projection capabilities. Brazil has also sought to expand its global presence by participating in UN peace operations. For example, Brazil leads the military component of the UN Stabilization Mission in Haiti (MINUSTAH), with a contingent of 2187 troops deployed as of December 2010.83
The implementation of the National Defence Strategy is likely to involve further military spending increases as Brazil seeks to modernize its defence structure through the reorganization of the armed forces, the restructuring of its arms industry and a proposal for mandatory military service.84 Another proposed reform is a move to mandatory multi-year military investment budgeting, which would allow the MOD and the three services
79 Duarte Villa, R., Corrida armamentista ou modernizacao de armamentos na America do Sul:
estudo comparativo dos gastos militares [Arms race or arms modernization in South America: com-parative study of military expenditures], Estudos e Cenarios (Observatório Político Sul-Americano: Rio de Janeiro, Dec. 2008), p. 18.
80 Lima (note 68); ‘Brasil revaluará plan compra barcos de guerra por US$6.000 millones’ [Brazil to reassess $6 billion warship purchase], Infolatam, 24 Jan. 2011, <http://www.infolatam.com/2011/ 01/24/brasil-revaluara-plan-compra-barcos-de-guerra-por-us6-000-millones/>; and ‘Exército terá investimento bilionário nas fronteiras’ [Army will have to invest heavily in the borders], Folha, 9 Jan. 2011.
81 See Perlo-Freeman et al. (note 75); and Brazilian Ministry of Defence (note 75). 82 Brazilian Ministry of Defence (note 75), p. 8. 83 United Nations Peacekeeping, ‘UN mission’s contributions by country’, 31 Dec. 2010, <http://
www.un.org/en/peacekeeping/resources/statistics/>. See also chapter 3 and appendix 3A in this volume.
84 Brazilian Ministry of Defence (note 75), pp. 5.
MILITARY EXPENDITURE 173
to better plan and assess the resources needed to carry out the National Defence Strategy.85
In 2010, as part of the implementation of the National Defence Strategy, the National Congress approved the restructuring of the armed forces in a project that included the creation of a joint general staff under the MOD and a proposal to draft Brazil’s first defence white paper.86 Every four years from 2012 the government will have to submit to the National Congress information on its defence policies and strategies, the modernization of the armed forces, and the military sector’s economic resources.87 In addition, it is expected that a secretariat of defence products will be established to handle military procurement.
Brazil is moving forward with its intention to become a regional power in both the economic and military realms. In the absence of real military threats to Brazil, its military expenditure choices may be mostly motivated by the search for prestige or status, rather than by national defence needs. At the same time, the 2003 and 2011 budgets, which cut planned military spending while protecting areas such as health and education, show that the government recognizes more pressing social needs, in a country still plagued by extreme inequality.
VII. Turkey
Turkey’s military expenditure totalled an estimated 26.3 billion liras ($17.5 billion) in 2010, 3.0 per cent lower in real terms than in 2009 and 11.2 per cent lower than in 2001. Military expenditure as a share of GDP has also fallen, from 3.7 per cent in 2001 to an estimated 2.4 per cent in 2010. Despite this decrease, in 2010 Turkey became the world’s 15th largest mili-tary spender.88
In recent years Turkey has re-emerged as a significant player in inter-national politics. It has the eighth largest economy in Europe and the 17th largest in the world.89 After the break-up of the Ottoman Empire at the end of World War I, Turkey was built by President Mustafa Kemal Atatürk
85 Brazilian Ministry of Defence, ‘Palestra do Ministro Nelson Jobim na SAE: “Politica de Defesa
do Governo Lula”’ [Address by Minister Nelsom Jobim to the Secretariat of Strategic Affairs: ‘the defence policy of the Lula government’], 15 Dec. 2010, <https://www.defesa.gov.br/index.php/ noticias-do-md.html>.
86 Richard, I., ‘Lula sanciona lei que cria Estado-Maior da Defesa e dá mais poderes a ministro da pasta’ [Lula approves law that creates defence general staff and gives more power to the ministry], Agencia Brasil, 25 Aug. 2010, <http://agenciabrasil.ebc.com.br/noticia/2010-08-25/lula-sanciona-lei-que-cria-estado-maior-da-defesa-e-da-mais-poderes-ministro-da-pasta>.
87 Brazilian Complementary Act no. 136 of 25 Aug. 2010, Diário Oficial da União (Brasília), 26 Aug. 2010. On the drafting process for the first defence white paper, which was launched in Feb. 2011, see Brazilian Ministry of Defence, ‘Livro branco de defesa nacional’ [National defence white paper], <http://livrobranco.defesa.gov.br/>.
88 See appendix 4A, section II. 89 International Monetary Fund (note 69).
174 MILITARY SPENDING AND ARMAMENTS, 2010
as a secular and modern state. The military was given the role of guardian of the state and has intervened several times when it deemed that Turkey’s secular democracy was threatened.90 Although it remains a key actor in Turkey’s political life, the military is now less influential. Since 2001 governance of the military has been reformed, partly in response to recom-mendations made in negotiations on Turkey’s accession to the European Union (EU): the military is now accountable to the Grand National Assem-bly (the Turkish Parliament), which has been given full control of military budgeting, including extra-budgetary funding; and the National Security Council has been transformed from a coordinating organ with executive powers into an advisory body that now includes civilians.91 These reforms, along with changes to the constitution in 2010 and ongoing investigations into alleged military coup plots, continue to generate tensions between the military and the ruling Justice and Development Party (Adalet ve Kalkınma Partisi, AKP), which is seeking to reduce the military’s role in politics.92
Traditionally orientated towards Europe and the USA, Turkish foreign policy has been slowly but consistently reoriented to its neighbourhood in the Middle East and the Caucasus, especially since the AKP came to power in 2002.93 One of the main pillars of this new architecture is the ‘zero prob-lems with neighbours’ policy, by which Turkey seeks to strengthen cooper-ation on political, economic and security issues within its vicinity.94
SIPRI’s estimate of Turkey’s military expenditure includes spending on both the Turkish Armed Forces (Türk Silahlı Kuvvetleri, TSK) and para-military forces—the gendarmerie and coastguard. The TSK, with approxi-mately 511 000 active members and 378 700 in the reserve, is NATO’s second largest military (after that of the USA).95 In 2010 its budget, allocated via the Ministry of National Defence, was 15.9 billion liras ($10.6 billion). Although the paramilitary gendarmerie and coastguard depend administratively on the Ministry of the Interior, they fulfil military functions. In 2010 their respective budgets were 3.77 billion liras ($2.5 bil-
90 Taspinar, Ö., Turkey’s Middle East Policies: Between Neo-Ottomanism and Kemalism, Carnegie
Papers no. 10 (Carnegie Endowment for International Peace: Washington, DC, Sep. 2008). 91 Narli, A. N., ‘Aligning civil–military relations in Turkey: transperency [sic] building in defense
sector and the EU reforms’, eds E. M. Felberbauer, P. Jureković and P. Pantev, Transforming National Armed Forces in South East Europe: From the Social to the Military Challenge (National Defence Academy and Bureau for Security Policy: Vienna, Oct. 2004), pp. 164, 166. See also Özcan, G., ‘National Security Council’, ed. Ü. Cizre, Geneva Centre for the Democratic Control of Armed Forces, Democratic Oversight and Reform of the Security Sector in Turkey (LIT: Zurich, 2007), pp. 41–58.
92 E.g. Butler, D., ‘Turkish army plot trial to revive tensions’, Reuters, 15 Dec. 2010, <http://www. reuters.com/article/2010/12/15/us-turkey-sledgehammer-preview-idUSTRE6BE3AU20101215>.
93 Yilmaz, M. ‘Conceptual framework of Turkish foreign policy in AK Party era’, Turkish Review, spring 2010, p. 106.
94 Davutoğlu, A., ‘Turkey’s zero-problems foreign policy’, Foreign Policy, May 2010. 95 International Institute for Strategic Studies, The Military Balance 2010 (Routledge: London,
2010), p. 164.
MILITARY EXPENDITURE 175
lion) and 192 million liras ($128 million).96 Funding for military procure-ment comes from the TSK budget and from the Defence Industry Support Fund (DISF). The DISF is a special fund created in 1986 that collects levies on petrol, tobacco, alcohol and legal gambling. Between 1986 and 2008 it is reported to have collected $22 billion, including $1.5 billion in 2008.97 For 2010, expenditure by the DISF was budgeted at 2.3 billion liras ($1.5 bil-lion).98
In addition to the DISF, the Turkish military budget includes resources from the TSK Foundation (TSK Güçlendirme Vakfı, TSKGV), credits reimbursed by the Treasury, funds allocated to the gendarmerie and coast-guard commands, slush funds from the Office of the Prime Minister, and funding for ‘village guards’—local paramilitary units originally raised to fight the Kurdistan Workers’ Party (Partiya Karkerên Kurdistan, PKK).99 These extra-budgetary resources are generally not subject to public scrutiny. Turkish NGOs have criticized the lack of transparency in Turkish military spending and have called for improved availability of data, including on extra-budgetary funding.100
The ongoing plans for modernization of the TSK, which include strengthening domestic arms production capability and planned increases in future R&D and procurement budgets, suggest that the downward trend in Turkey’s military expenditure since 2001 may not continue.101 Indeed, in December 2010 the Grand National Assembly approved an increase in the budget of the Ministry of National Defence for 2011, including higher spending on procurement.102 This trend will continue in subsequent years as Turkey starts to pay for ongoing and future weapons acquisitions, including long-range and transport aircraft, major warships (including an aircraft carrier), UAVs and mine-resistant ambush-protected (MRAP) vehicles for internal security.103
Turkey’s defence and security policy has been guided by two main policy documents: the 2000 Defence White Paper and the National Security
96 Public Expenditures Monitoring Platform, Letter to Grand National Assembly of Turkey from
coalition of Turkish non-governmental organizations, Mar. 2010, <http://www.kamuharcamalarini izlemeplatformu.org/index_en.html>, p. 17.
97 Enginsoy, U. and Bekdil, B. E., ‘Turkey needs to boost procurement funds’, Defense News, 6 Sep. 2010, p. 13; and Akça, İ., Military-Economic Structure in Turkey: Present Situation, Problems, and Solutions (TESEV: Istanbul, 2010), p. 17.
98 Public Expenditures Monitoring Platform (note 96), p. 17. 99 Sarıibrahimoğlu, L., ‘Turkish armed forces’, ed. Cizre (note 91), p. 82; and Public Expenditures
Monitoring Platform (note 96), pp. 10–12. 100 Public Expenditure Monitoring Platform (note 96). 101 Sarıibrahimoğlu, L., ‘Undeterred by financial crisis, Turkish defense companies plan to
increase domestic arms production’, Eurasia Daily Monitor, 27 Feb. 2009. On the modernization plans see Hen-Tov, E., ‘The political economy of Turkish military modernization’, Middle East Review of International Affairs, vol. 8, no. 4 (Dec. 2004). On the Turkish arms industry see chapter 5, section VI, in this volume.
102 Enginsoy, Ü., ‘Turkey to increase arms spending in 2011’, Hürriyet Daily News, 10 Jan. 2011. 103 SIPRI Arms Transfers Database (note 52); and Enginsoy (note 102).
176 MILITARY SPENDING AND ARMAMENTS, 2010
Policy Document (NSPD). The white paper sets Turkey’s official defence policy, based on Atatürk’s principle of ‘peace at home, peace in the world’.104 The NSPD—sometimes referred to as the ‘secret constitution’—‘identifies the domestic and foreign threats faced by Turkey and delineates the policies which have been established in order to avoid these threats’.105 It is revised every five years, and in 2010 it was reviewed for the first time by a team of civilians. Although the document is not available to the public, this review reportedly removed Greece, Iran, Iraq and Russia from the list of critical threats to Turkish national security, in line with the AKP’s zero problems policy.106 At the domestic level, the main threat to national secur-ity continues to be the intrastate conflict with the PKK, although the inten-sity of this conflict has generally diminished since 1999, especially after Turkey increased cooperation with the Iraqi Government.107
The recent downward trend in Turkish military expenditure may be explained by reforms introduced to democratize the military, the changes in the perception of Turkey’s security threats since the implementation of the zero problems policies and the lower intensity of the conflict with the PKK. Indeed, the Turkish and Greek prime ministers explicitly discussed mutual reductions in military spending during the former’s visit to Greece in May 2010.108 In the light of this, the rationale for Turkey’s major military modernization plans is not immediately apparent. With the exception of military equipment for internal security tasks, it is questionable whether the acquisition of advanced power-projection capabilities is in line with Turkey’s defence and foreign policy. It is possible that Turkish military spending is motivated more by considerations of regional status than by its real defence needs.
VIII. South Africa
Although South Africa’s military expenditure is far lower than the other cases studied here, it is the highest in sub-Saharan Africa. In 2010 it totalled 32.9 billion rand ($4.5 billion), representing an estimated 1.2 per cent of GDP. While spending in 2010 was 2.0 per cent lower than in 2009, it was 22 per cent higher than in 2001.
104 Turkish Ministry of National Defence (MND), Defense White Paper 2000 (MND: Ankara,
2000). 105 Sariibrahimglu (note 99), p. 74. 106 ‘Russia, Iran, Iraq, Greece no longer “national threat” ’ to Turkey’, Hürriyet Daily News,
23 Aug. 2010. 107 See appendix 2A in this volume; and Migdalovitz, C., Turkey: Politics of Identity and Power,
Congressional Research Service (CRS) Report for Congress R41368 (US Congress, CRS: Washington, DC, 13 Aug. 2010), pp. 14–18.
108 Kambas, M. and Kyriakidou, D., ‘Greek, Turkish PMs meet, discuss defense cuts’, Reuters, 14 May 2010, <http://www.reuters.com/article/2010/05/14/us-turkey-greece-idUSTRE64D5BN20 100514>.
MILITARY EXPENDITURE 177
Since the end of apartheid in 1994 South Africa has emerged as a major economic, political, security and diplomatic actor in Africa. This is linked to three factors. First is its economic profile as the hub of trade, manu-facturing and investment in southern Africa. The country’s gross national income (GNI) in 2008 accounted for 29.8 per cent of the entire GNI of sub-Saharan Africa.109 Second is its military strength, both in terms of military expenditure and having the most developed arms industry in Africa.110 Third is South Africa’s increasingly assertive role in multilateral insti-tutions, specifically the Southern African Development Community (SADC) and the African Union (AU). South Africa was instrumental in the development and adoption of the AU’s Constitutive Act in 2000 and its New Partnership for Africa’s Development (NEPAD) in 2001.111 In add-ition, South Africa claims leadership in Africa in promoting human rights, good governance and the ‘African renaissance’, underscored by its hosting of the 2010 FIFA World Cup.112
Since 2002 a large share of South Africa’s military spending has been allocated to the Special Defence Account (SDA), which is dedicated to arms procurement. From 40 per cent of the total in 2002, the SDA share gradu-ally declined to 27 per cent in 2009, and just 18 per cent was budgeted for 2010.113 The high level of procurement spending over the past decade has been driven by the 47.2 billion rand ($6.4 billion) Strategic Defence Procurement (SDP) programme, a multi-year arms acquisition programme that was initiated in 1999 to transform apartheid-era military capabilities.114 The SDP initially included the purchase of 4 corvettes, 3 submarines, 24 trainer aircraft, 26 combat aircraft and 30 helicopters.115 The 2006 Defence Update emphasizes more flexible, mobile and deployable land forces, with concomitant air- and sealift capabilities.116 The most significant consequent change to the SDP was a 2007 order—also known as the
109 World Bank (note 8), p. 34. 110 On the South African arms industry see e.g. Dunne, J. P., ‘The making of arms in South Africa’,
Economics of Peace and Security Journal, vol. 1, no. 1 (Jan. 2006); and Wezeman, P. D., ‘South African arms supplies to sub-Saharan Africa’, SIPRI Background Paper, Jan. 2011, <http://books.sipri.org/ product_info?c_product_id=419>.
111 Constitutive Act of the African Union, adopted 11 July 2000, entered into force 26 May 2001, <http://www.au.int/en/about/constitutive_act>. On NEPAD see the NEPAD Planning and Coord-ination Agency website, <http://www.nepad.org/>.
112 See e.g. Mbeki, T., South African Deputy President, ‘The African renaissance, South Africa and the world’, Speech, United Nations University, Tokyo, 9 Apr. 1998, <http://www.info.gov.za/ speeches/1998/98b17_5559811376.htm>.
113 South African National Treasury, Estimates of national expenditure, 2002–10, <http://www. treasury.gov.za/documents/national budget/>.
114 ‘SDP to cost R47.225bn’, DefenceWeb, 25 Jan. 2011, <http://www.defenceweb.co.za/index. php?option=com_content&id=13207>. For an alternative estimate of the total cost of the SDP see chapter 1, section III, in this volume.
115 For full details see chapter 1, section III, in this volume. 116 South African Department of Defence (DOD), Annual Report FY 2007–2008 (DOD: Pretoria,
2008), pp. 2–3.
178 MILITARY SPENDING AND ARMAMENTS, 2010
Hoefyster project—for 264 infantry combat vehicles worth $1.5 billion.117 The Defence Update also calls for significantly higher military spending from FY 2011/12.118
Important domestic changes and policy processes have shaped South Africa’s military expenditure and its emergent geopolitical status. First, a new constitution in 1996—based on equality, respect for human rights and social welfare—reshaped the composition, mandate and defence doctrine of the armed forces, specifically changing from an adversarial relationship with South Africa’s neighbours to one of cooperation.119
Second has been a series of military-related policy initiatives launched since the mid-1990s, including the 1996 White Paper on National Defence, the 1998 Defence Review, the 2002 Defence Act, the 2006 Defence Update and the 2009 Future SA Army 2020 Strategy (Strategy 2020).120 The white paper and defence review undertook comprehensive planning of force doc-trine and design, armaments, equipment, and funding. The review con-cluded that, despite the absence of a major external military threat to South Africa in the medium term, there was a need to acquire conventional mili-tary deterrence capabilities. This became the basis for the SDP, although the connection between the conclusions of the review and what was actually bought has been questioned.121 The 2006 Defence Update redefined and aligned South Africa’s defence capabilities with the govern-ment’s foreign policy objective of active participation in AU and UN peace operations, while Strategy 2020, which is closely linked to the 2006 Defence Update, includes plans for three infantry battalions and three engineer squadrons for external deployment and three infantry companies and one composite engineer squadron for internal deployment.122
The third factor shaping South Africa’s military expenditure has been a policy launched in 2007 to align military capabilities to the country’s for-eign policy objectives of regional military cooperation, participation in peace operations and deployment of defence attachés.123 By 2007 South
117 SIPRI Arms Transfers Database (note 52); and Gibson, E., ‘A lucky “horseshoe” for Denel?’,
Defense News, 21 May 2007. 118 South African Department of Defence (note 116), p. 4. 119 South African Department of Defence (DOD), White Paper on National Defence for the Repub-
lic of South Africa: Defence in a Democracy (DOD: Pretoria, May 1996), chapter 1, para. 4. 120 South African Department of Defence (note 119); South African Department of Defence
(DOD), South African Defence Review (DOD: Pretoria, 1998); Defence Act, South African Act no. 42 of 2002, assented to 12 Feb. 2003, Government Gazette (Pretoria), 20 Feb. 2003; and South African DOD, The Future SA Army Strategy, Version 1 (DOD: Pretoria, Jan. 2009).
121 South African Department of Defence, South African Defence Review (note 120), chapter 8, para. 73; Feinstein, A., After the Party: Corruption, the ANC and South Africa’s Uncertain Future (Verso: London, 2009); and chapter 1 in this volume.
122 Kruys, G. P. H., South African Army Priorities and Roles in the Early 21st Century, University of Pretoria, Institute for Strategic Studies (ISSUP) Bulletin no. 3/2009 (ISSUP: Pretoria, Apr. 2009), p. 4; and South African Department of Defence (note 116), pp. xi–xiii.
123 South African Department of Defence (note 116), pp. 1–2.
MILITARY EXPENDITURE 179
Africa had defence representation in 31 countries.124 It has participated in three of the four AU-led peace operations and in December 2010 had 2005 troops deployed on UN operations.125 This policy of defence diplomacy underscores South Africa’s aspiration to become a permanent member of the UN Security Council.126
The size and focus of South Africa’s military spending has proved contro-versial given the many competing domestic priorities, especially the needs to tackle poverty, unemployment and extreme inequality, HIV/Aids, and poor housing.127 Most controversial are the SDP acquisitions, which largely relate to external deterrence and power projection and which have placed a heavy strain on the military budget, hampering efforts to meet the immediate operational needs of the South African National Defence Force (SANDF). These are primarily for peacekeeping and internal security, since extreme levels of violent crime have led to the involvement of the SANDF in internal security operations alongside the police force.128 Meanwhile, the corruption that accompanied the SDP has implicated several top-ranking military officers, ministers and leaders of the ruling African National Con-gress. This shows that South Africa is not insulated from the poor military budgeting, procurement and oversight practices and mismanagement of resources associated with many African countries.129
IX. Conclusions
World military expenditure continued to increase in 2010, albeit much more slowly than in recent years. The continuing effects of the global eco-nomic recession slowed or halted growth in Asia and Europe, but large increases continued in Africa and South America and the United States again accounted for most of the real-terms increase in the world total.
While the USA led the global rise in military spending over the past decade, this trend has been followed by many emerging (or re-emerging) regional powers such as Brazil, China, India, Russia, South Africa and Turkey. Of these six countries, all but Turkey increased their military spending significantly over the decade 2001–10.
124 Lekota, M., Minister of Defence, Defence budget speech, South African National Assembly,
27 Mar. 2007, <http://www.info.gov.za/speeches/2007/07032717151001.htm>. 125 SIPRI Multilateral Peace Operations Database, <http://www.sipri.org/databases/pko/>. On
South Africa’s involvement in peacekeeping see chapter 3 and appendix 3A in this volume. 126 Neethling, T., ‘Military spending, socio-economic challenges and foreign policy demands:
Appraising South Africa’s predicament’, African Security Review, vol. 15, no. 4 (2006), p. 69. 127 World Bank (note 8), pp. 80–142. 128 Elowson, C., Clouds at the Horizon? Security Challenges in South Africa’s Post-transition
Period, User Report (Swedish Defence Research Agency, FOI: Stockholm, Mar. 2009). On crime and conflict see Stepanova, E., ‘Armed conflict, crime and criminal violence’, SIPRI Yearbook 2010.
129 Omitoogun, W. and Hutchful, E. (eds), SIPRI, Budgeting for the Military Sector in Africa: The Processes and Mechanisms of Control (Oxford University Press: Oxford, 2006), p. 6.
180 MILITARY SPENDING AND ARMAMENTS, 2010
The reasons for military spending increases in these countries vary. The economy has been a key constraining factor, with increases in military spending remaining in line with or slower than economic growth rates. Thus, China’s economic growth has allowed it to increase its military spending at by far the fastest rate, and many have engaged in military modernization to accompany their growing economic and political roles. Rising military expenditure carries an opportunity cost in terms of the potential alternative uses—for example, in relation to social and develop-mental needs—to which the spending could be applied. This issue is par-ticularly pressing and controversial in Brazil, India and South Africa, all of which are democracies with high levels of poverty and inequality.
Another key variable influencing military expenditure levels has been the intensity of ongoing conflicts, immediate security threats and relations with neighbouring countries, such as India’s conflict in Kashmir and Turkey’s relations with Greece.
Most of these powers seek global or regional status—in economic, polit-ical and diplomatic terms—for which a strong and modern military able to project influence is seen as a key element. Brazil, China, India, South Africa and Turkey are all pursuing naval and airborne power-projection capabil-ities, while Russia is seeking to re-establish itself as the dominant military force in the former Soviet area. In connection with this, the development of domestic arms industries able to reduce dependence on imports for modernization is a priority for all six countries.130
For some, this desire for military power reflects a fear of the con-sequences for security and status of falling behind in military technology. China and Russia are both concerned by overwhelming US military domin-ance and technological superiority, while China’s rapid modernization is a major concern for India. However, in the cases of Brazil, South Africa and Turkey, which lack any clear actual or perceived threats or obvious poten-tial uses for advanced weapons systems, military power appears to be desired as a mark of prestige.
Rapid military modernization in Asia in particular, while not yet showing signs of becoming a hostile arms race, in some ways reflects a classic secur-ity dilemma.131 China’s military development comes in part from a sense of its vulnerability to US power but generates similar feelings of vulnerability in its neighbours, in particular India. In each case, protestations of peaceful intent have offered little reassurance, and the danger is that predictions of an arms race and of inevitable rivalry could become self-fulfilling.
130 See chapter 5, section III, in this volume. 131 On modernization in Asia see e.g. Asian Perspective, vol. 33, no. 4, Special issue on the arms
race in North East Asia (2009). In addition to China and India, Asian countries that are significantly modernizing their militaries include Japan, South Korea, the Philippines, Thailand and Viet Nam.