28 UK Economic Outlook March 2019 Key points • London has consistently outperformed other UK regions for most of the past three decades in terms of economic growth. This is in marked contrast to the 1970s and early 1980s when London’s average growth rate was slower than the UK average due to people moving out of the capital. • Outside London, Southern English regions and the East Midlands grew relatively rapidly in the 1970s and 1980s, while heavy industrial areas in the West Midlands and Northern regions lagged behind. • Since the early 1990s, however, there has been less consistent evidence of a clear North-South divide outside London. Much of London’s outperformance is linked to the boom in financial and business services following the financial deregulation of the 1980s, as well as its relatively smaller exposure to the declining UK manufacturing sector. • Population trends have played an important role in explaining overall economic growth variations by region since the 1970s, with strong net immigration over the past two decades masking an underlying decline in output per person growth in most regions relative to earlier decades. • More recently, there have been signs from housing and labour markets that London’s relative performance has been less strong. We expect this to continue in 2019-20, with London growing only slightly faster than the UK average rate in those years. • Brexit-related uncertainty is likely to dampen growth in all regions this year, but there could be some pick-up in growth across the UK in 2020 if a reasonably orderly Brexit can be achieved. Introduction It is well-documented that the UK has been characterised in recent decades by an increasing economic growth divide between London and other regions of the country. But what exactly has driven the opening up of this growth divide and can we expect it to continue? To address this question we have made use both of the latest official ONS data on real output (GVA 2 ) growth by region from 1998 to 2017, which was published in December 2018 3 , and a new set of estimates of quarterly and annual regional growth dating back as far as 1972 that has been published by the Economic Statistics Centre of Excellence (ESCoE) 4 . The combination of these two data sets provides us with a longer term historical view of the UK regional real output growth than was previously available. 1 This article was written by John Hawksworth and Hoa Duong 2 Gross Value Added (GVA) provides the best available measure of economic activity at regional level, broadly corresponding to Gross Domestic Product (GDP) at national level. We therefore focus on GVA here, although we recognise that there are a range of other socio-economic measures that can help assess regional and local performance as discussed, for example, in our Good Growth for Cities report here: https://www.pwc.co.uk/industries/government-public-sector/good-growth.html 3 For details of the latest ONS regional GVA data see: https://www.ons.gov.uk/economy/grossvalueaddedgva/bulletins/regionalgrossvalueaddedbalanceduk/1998to2017 4 Details of this new dataset were published in a November 2018 ESCoE discussion paper by G. Koop, J. Mitchell, S.McIntyre and A.Poon that is available here: https://www.escoe.ac.uk/wp-content/uploads/2018/11/ESCoE-DP-2018-14.pdf 4. Regional growth trends and prospects 1 In this article we begin by reviewing the key trends in real GVA growth by region since the early 1970s (Section 4.1) and then consider how far variations in regional population growth may have driven these historical growth differentials (Section 4.2). We also explore what other factors might explain these regional GVA growth variations, including differences in the mix of industry sectors seen in different regions and variations in education levels (Section 4.3). We then look at regional trends in 2018 and how regional growth rates might evolve in 2019 and 2020 (Section 4.4). Section 4.5 summarises and concludes. Data on average regional growth in GVA, population and GVA per capita for the decades since the 1970s is also available to explore further on our website at www.pwc.co.uk/ukeo More recently, there have been signs from housing and labour markets that London’s relative performance has been less strong. We expect this to continue in 2019-20, with London growing only slightly faster than the UK average rate in those years. John Hawksworth Chief Economist, PwC
Transcript
28 UK Economic Outlook March 2019
Key points• London has consistently outperformed
other UK regions for most of the past three decades in terms of economic growth. This is in marked contrast to the 1970s and early 1980s when London’s average growth rate was slower than the UK average due to people moving out of the capital.
• Outside London, Southern English regions and the East Midlands grew relatively rapidly in the 1970s and 1980s, while heavy industrial areas in the West Midlands and Northern regions lagged behind.
• Since the early 1990s, however, there has been less consistent evidence of a clear North-South divide outside London. Much of London’s outperformance is linked to the boom in financial and business services following the financial deregulation of the 1980s, as well as its relatively smaller exposure to the declining UK manufacturing sector.
• Population trends have played an important role in explaining overall economic growth variations by region since the 1970s, with strong net immigration over the past two decades masking an underlying decline in output per person growth in most regions relative to earlier decades.
• More recently, there have been signs from housing and labour markets that London’s relative performance has been less strong. We expect this to continue in 2019-20, with London growing only slightly faster than the UK average rate in those years.
• Brexit-related uncertainty is likely to dampen growth in all regions this year, but there could be some pick-up in growth across the UK in 2020 if a reasonably orderly Brexit can be achieved.
IntroductionIt is well-documented that the UK has been characterised in recent decades by an increasing economic growth divide between London and other regions of the country. But what exactly has driven the opening up of this growth divide and can we expect it to continue?
To address this question we have made use both of the latest official ONS data on real output (GVA2) growth by region from 1998 to 2017, which was published in December 20183, and a new set of estimates of quarterly and annual regional growth dating back as far as 1972 that has been published by the Economic Statistics Centre of Excellence (ESCoE)4. The combination of these two data sets provides us with a longer term historical view of the UK regional real output growth than was previously available.
1 This article was written by John Hawksworth and Hoa Duong2 Gross Value Added (GVA) provides the best available measure of economic activity at regional level, broadly corresponding to Gross Domestic Product (GDP)
at national level. We therefore focus on GVA here, although we recognise that there are a range of other socio-economic measures that can help assess regional and local performance as discussed, for example, in our Good Growth for Cities report here: https://www.pwc.co.uk/industries/government-public-sector/good-growth.html
3 For details of the latest ONS regional GVA data see: https://www.ons.gov.uk/economy/grossvalueaddedgva/bulletins/regionalgrossvalueaddedbalanceduk/1998to2017
4 Details of this new dataset were published in a November 2018 ESCoE discussion paper by G. Koop, J. Mitchell, S.McIntyre and A.Poon that is available here: https://www.escoe.ac.uk/wp-content/uploads/2018/11/ESCoE-DP-2018-14.pdf
4. Regional growth trends and prospects1
In this article we begin by reviewing the key trends in real GVA growth by region since the early 1970s (Section 4.1) and then consider how far variations in regional population growth may have driven these historical growth differentials (Section 4.2). We also explore what other factors might explain these regional GVA growth variations, including differences in the mix of industry sectors seen in different regions and variations in education levels (Section 4.3). We then look at regional trends in 2018 and how regional growth rates might evolve in 2019 and 2020 (Section 4.4). Section 4.5 summarises and concludes.
Data on average regional growth in GVA, population and GVA per capita for the decades since the 1970s is also available to explore further on our website at www.pwc.co.uk/ukeo
More recently, there have been signs from housing and labour markets that London’s relative performance has been less strong. We expect this to continue in 2019-20, with London growing only slightly faster than the UK average rate in those years.
John HawksworthChief Economist, PwC
31UK Economic Outlook March 2019
% p
er a
nnum
UK Average South West
-0.4
-0.2
0
0.2
0.4
0.6
0.8
1.0
South EastEast Midlands Scotland North WestYorkshire and the Humber West Midlands North East
1972-79 1980-89 1990-99 2000-09 2010-17
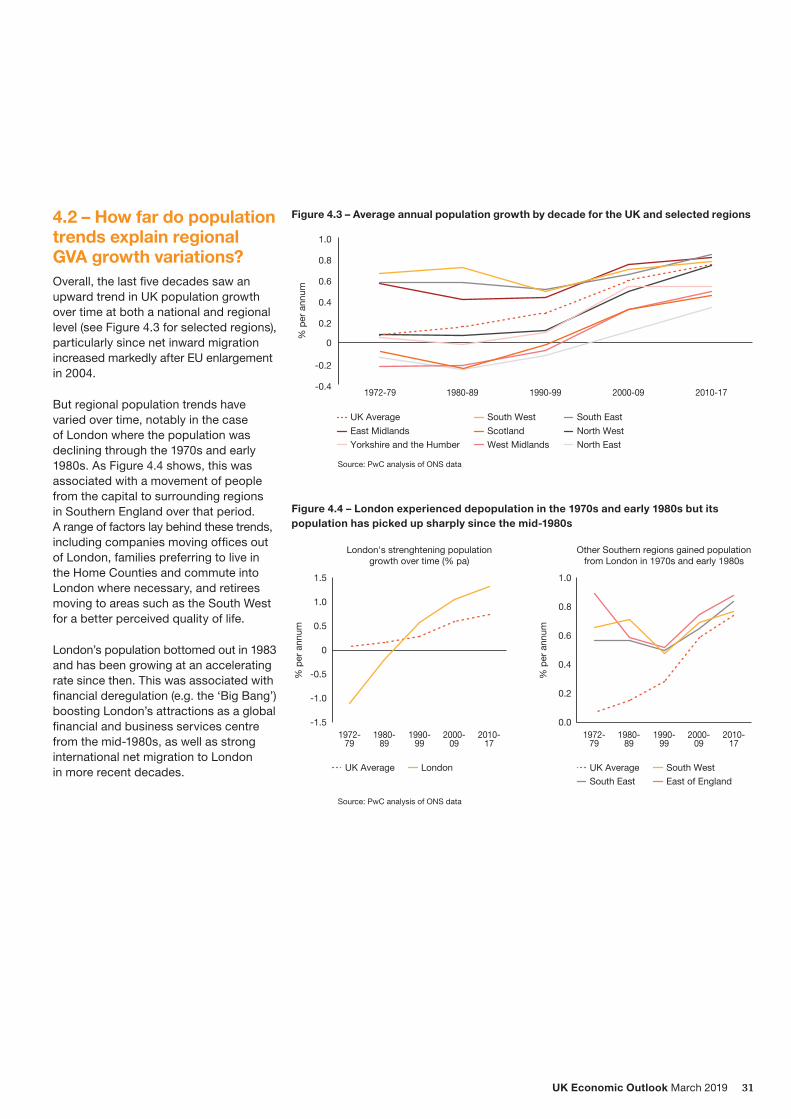
4.2 – How far do population trends explain regional GVA growth variations?Overall, the last five decades saw an upward trend in UK population growth over time at both a national and regional level (see Figure 4.3 for selected regions), particularly since net inward migration increased markedly after EU enlargement in 2004.
But regional population trends have varied over time, notably in the case of London where the population was declining through the 1970s and early 1980s. As Figure 4.4 shows, this was associated with a movement of people from the capital to surrounding regions in Southern England over that period. A range of factors lay behind these trends, including companies moving offices out of London, families preferring to live in the Home Counties and commute into London where necessary, and retirees moving to areas such as the South West for a better perceived quality of life.
London’s population bottomed out in 1983 and has been growing at an accelerating rate since then. This was associated with financial deregulation (e.g. the ‘Big Bang’) boosting London’s attractions as a global financial and business services centre from the mid-1980s, as well as strong international net migration to London in more recent decades.
Figure 4.3 – Average annual population growth by decade for the UK and selected regions
Source: PwC analysis of ONS data
% p
er a
nnum
UK Average London
1972-79
1980-89
1990-99
2000-09
2010-17
London's strenghtening populationgrowth over time (% pa)
-1.5
-1.0
-0.5
0
0.5
1.0
1.5
% p
er a
nnum
1972-79
1980-89
1990-99
2000-09
2010-17
Other Southern regions gained populationfrom London in 1970s and early 1980s
0.0
0.2
0.4
0.6
0.8
1.0
UK Average South WestSouth East East of England
Figure 4.4 – London experienced depopulation in the 1970s and early 1980s but its population has picked up sharply since the mid-1980s
Source: PwC analysis of ONS data
39UK Economic Outlook March 2019
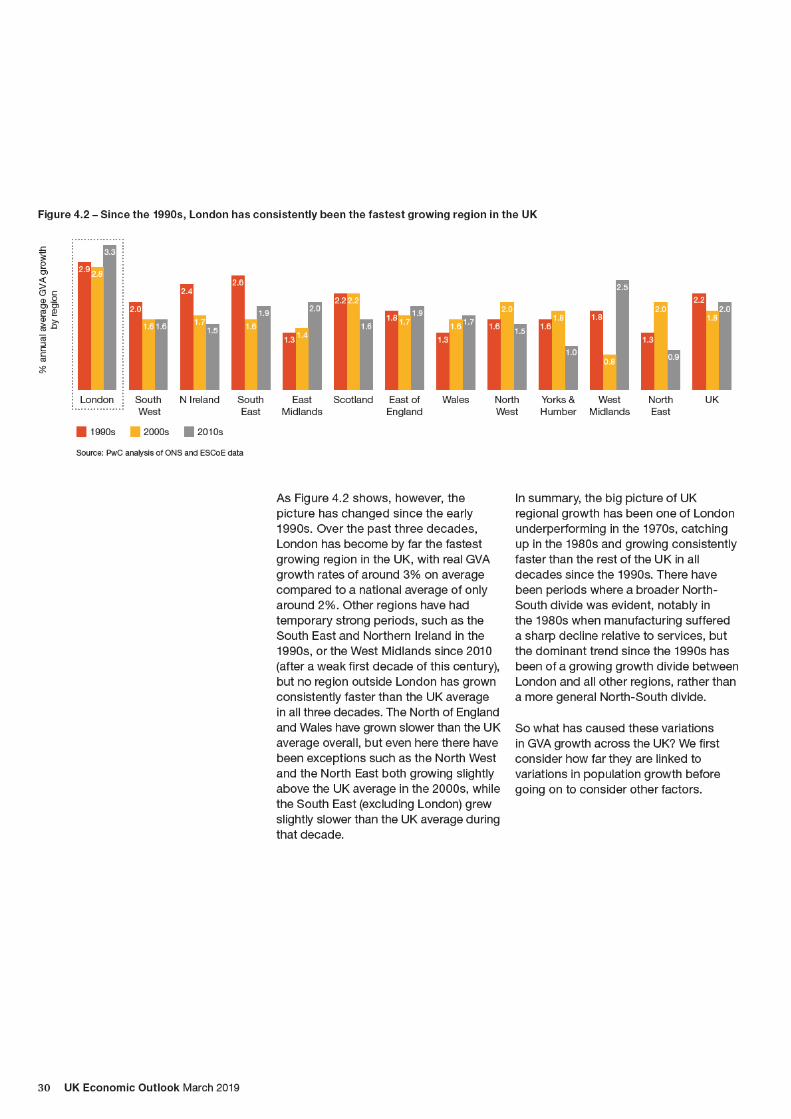
4.5 – Summary and conclusionsLondon has consistently outperformed other UK regions for most of the past three decades in terms of economic growth, but this was not always the case. London had relatively slower GVA growth in the 1970s and early 1980s as people moved out of the capital to other parts of Southern England.
This only began to reverse with the financial deregulation of the mid-1980s, which boosted London’s position as a global financial and business services centre and acted as a global magnet for talent that has boosted London’s population and GVA growth to well above the UK average since the 1990s. At the same time, a sharp decline in manufacturing activity hit traditional industrial regions in the North, West Midlands and Wales relatively hard, particularly in the 1980s.
Since the 1990s, however, there has been less of a general North-South growth divide outside London. Relative growth rankings of different regions outside the capital have varied across decades without a clear, consistent pattern. All regions have also seen a boost to total GVA growth from increased net immigration since the early 2000s, but this has also been reflected in a general decline in real GVA per capita growth across UK regions relative to the average rates seen in earlier decades. This is also true of London.
More recently, there are some signs from the latest housing and labour market data that London’s relative performance may have been less strong in 2018 and we expect this to continue in 2019-20, with London growing at only a slightly faster rate than the UK average in those years. It remains to be seen if this is a short-term cyclical phenomenon or the start of a longer term trend where London’s growth is held back by problems related to transport congestion and lack of affordable housing.
All regions continue to be affected by uncertainties relating to the future UK-EU relationship after Brexit, although they could see some boost to growth later this year and into 2020 if the downside risks associated with a disorderly Brexit can be avoided.
www.pwc.co.uk/economics
At PwC, our purpose is to build trust in society and solve important problems. PwC is a network of firms in 158 countries with more than 236,000 people who are committed to delivering quality in assurance, advisory and tax services. Find out more and tell us what matters to you by visiting us at www.pwc.com/UK.
This publication has been prepared for general guidance on matters of interest only, and does not constitute professional advice. You should not act upon the information contained in this publication without obtaining specific professional advice. No representation or warranty (express or implied) is given as to the accuracy or completeness of the information contained in this publication, and, to the extent permitted by law, PricewaterhouseCoopers LLP, its members, employees and agents do not accept or assume any liability, responsibility or duty of care for any consequences of you or anyone else acting, or refraining to act, in reliance on the information contained in this publication or for any decision based on it.