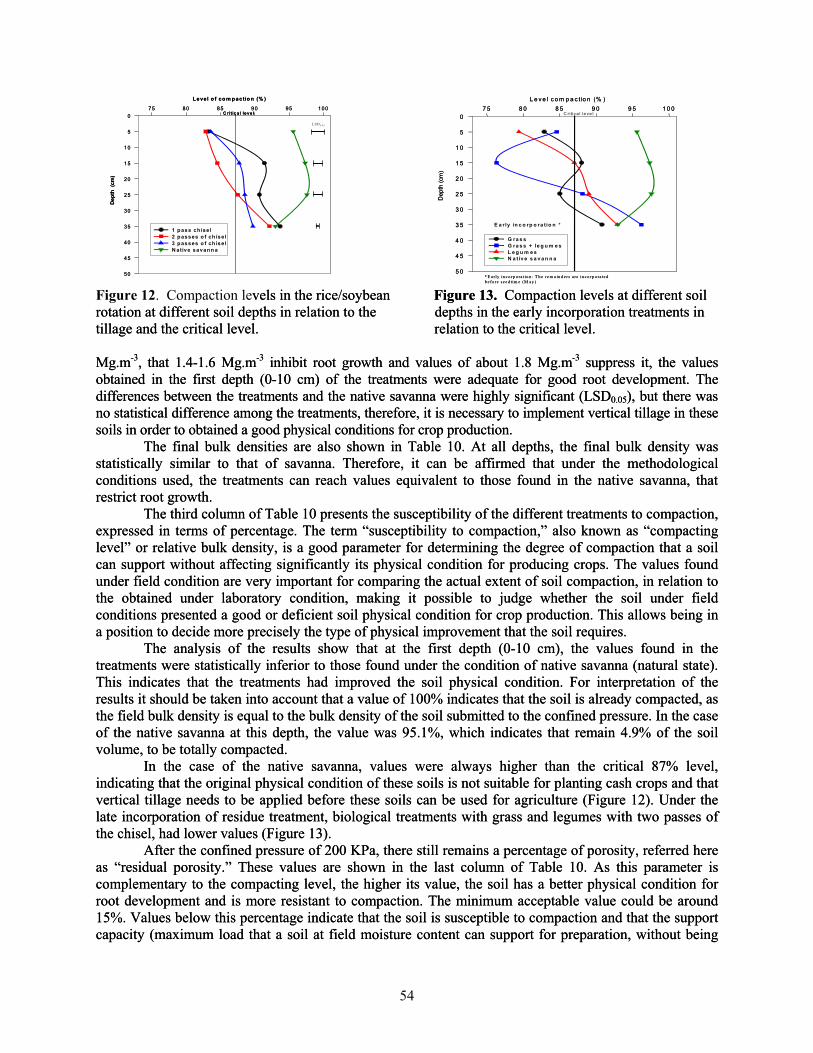
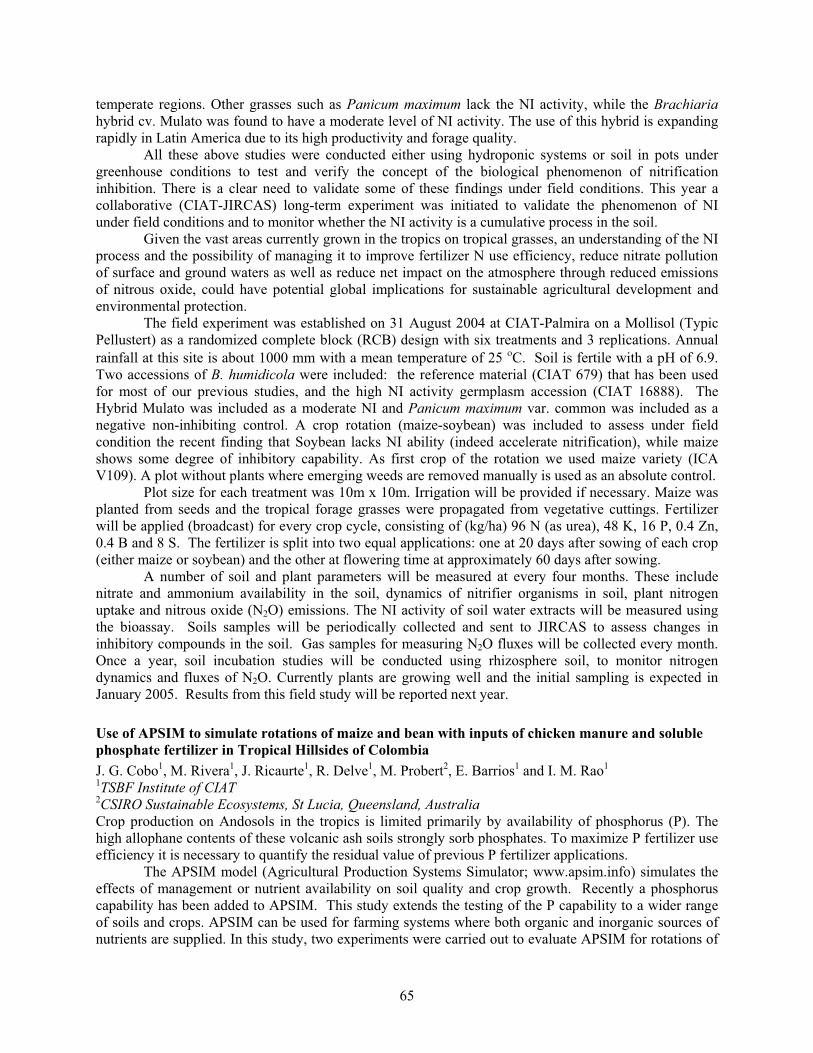
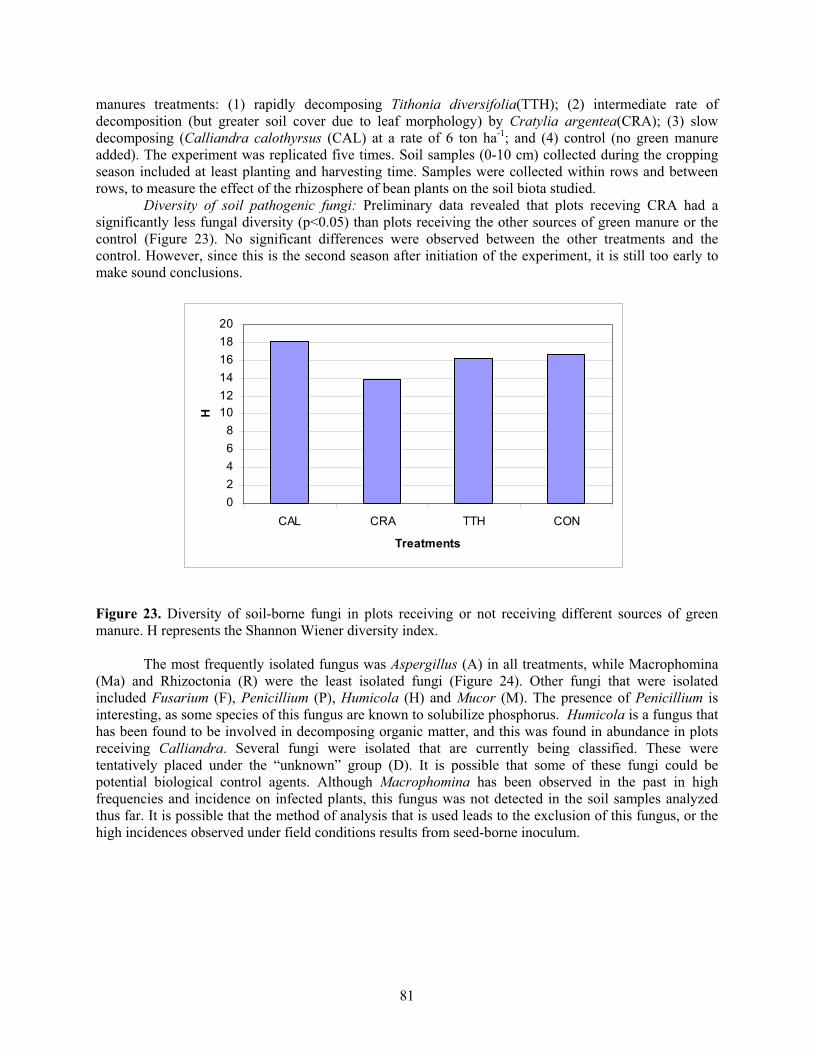
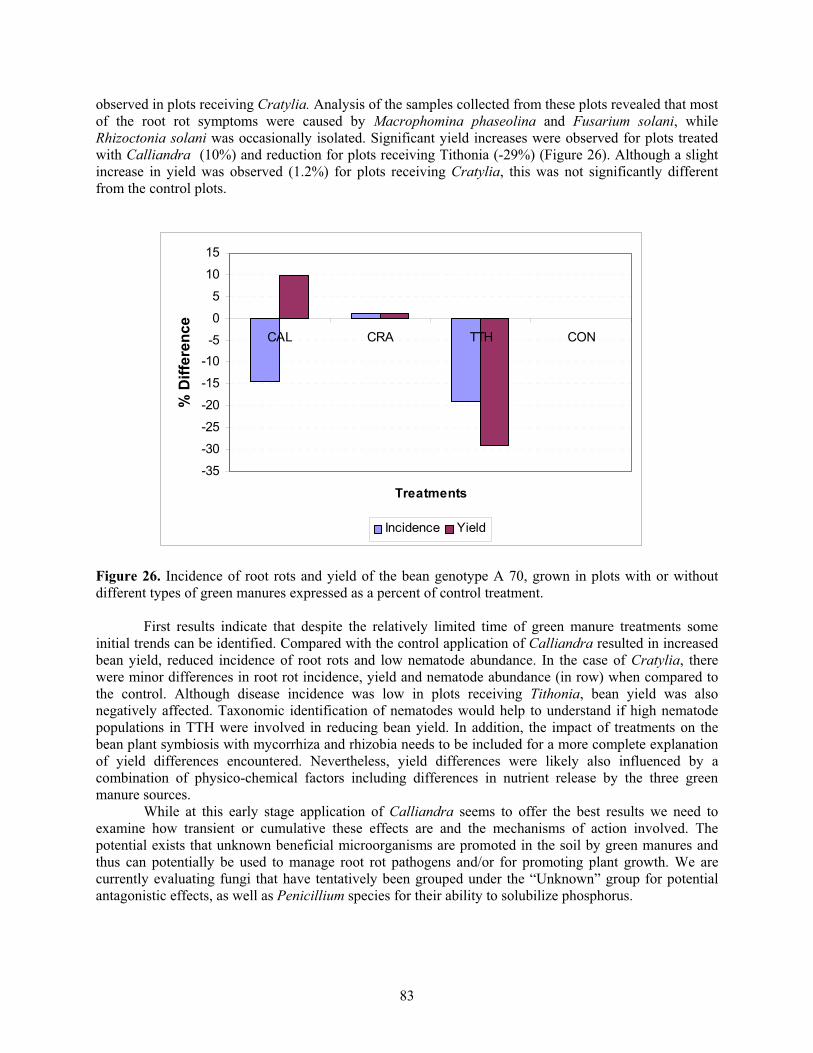
4. RESEARCH OUTPUTS AND ACTIVITIES 4.1 Output 1: Biophysical and socioeconomic processes understood, principles and concepts developed for protecting and improving the health and fertility of soils Rationale Sustainable agriculture is viewed from a systems perspective in which the agroecosystem interacts with the atmospheric system and the hydrological cycle as well as with the social and economic systems of the community where it is practiced. This conceptual model trascends the classical boundaries of the biophysical sciences and requires integration with economics, sociology, anthropology and political science.However, the rural poor are often trapped in a vicious poverty cycle with land degradation, fuelled by the lack of relevant knowledge or appropriate technologies to generate adequate income and opportunities to overcome land degradation. Improving soil fertility is essential for intensification and diversification of cropping systems and the recuperation of degraded lands. Farmers in the tropics, particularly in Africa and few countries in Central America rely mainly on organic inputs to maintain or improve soil fertility, with small or no additions of inorganic fertilizers. Within the ISFM framework, it is now recognized that both organic and mineral inputs are necessary to enhance crop yields without deteriorating the soil resource base. This recognition has a practical dimension because either of the two inputs are hardly ever available in sufficient quantities to the small scale farmer, but it also has an important resource management dimension as there is potential for added benefits created by positive interactions between both inputs when applied in combination. Such interactions can lead to improved use efficiency of the nutrients applied in organic or mineral form or both. Assessing the combination of the two in terms of resource quality, nutrient input, C, N and P dynamics and water use efficiency help to identify technology options for increasing farm productivity and system resilience. There is increasing need, however, to address the issue of scale- dependence of different soil processes ranging from processes at the plant’s rhizosphere, to nutrient gradients within farms or greenhouse gas emissions at the landscape scale and confront these processes with the socio-economical dimensions of rural and urban communities. The processes of land conversion and agricultural intensification are a significant cause of biodiversity loss, including that of below ground biodiversity (BGBD), with consequent negative effects both on the environment, ecosystem services and the sustainability of agricultural production. Documentation of BGBD, including the biological populations conserved and managed across the spectrum of agricultural intensification, is an essential component of the information required for assessment of environment- agriculture interactions, as is the evaluation of the impact of agricultural management on the resource base, particularly that of the soil. Soil organisms contribute a wide range of essential services to the sustainable function of agroecosystems among which the biological control of pests and diseases ranks high. The combination of soil fertility and pest and disease management approaches is likely a unique opportunity to exploit synergies for the benefit of crop productivity. Improving the natural resource base without addressing issues of marketing and income generation is often the reason for the lack of adoption of improved farming practices. Participatory approaches have shown considerable potential in facilitating farmer consensus about which soil related constraints should be tackled first. Consensus building is an important step prior to upscaling and collective action by farming communities in integrated soil management at the landscape scale. Integration of local and scientific knowledge to develop an integrated or “hybrid” knowledge and thus increased relevance is an overall strategy for sustainable soil management. 13
Transcript
4. RESEARCH OUTPUTS AND ACTIVITIES
4.1 Output 1: Biophysical and socioeconomic processes understood, principles and
concepts developed for protecting and improving the health and fertility of soils
Rationale
Sustainable agriculture is viewed from a systems perspective in which the agroecosystem interacts with theatmospheric system and the hydrological cycle as well as with the social and economic systems of the community where it is practiced. This conceptual model trascends the classical boundaries of the biophysical sciences and requires integration with economics, sociology, anthropology and political science.However, therural poor are often trapped in a vicious poverty cycle with land degradation, fuelled by the lack of relevant knowledge or appropriate technologies to generate adequate income and opportunities to overcome land degradation.
Improving soil fertility is essential for intensification and diversification of cropping systems and therecuperation of degraded lands. Farmers in the tropics, particularly in Africa and few countries in Central America rely mainly on organic inputs to maintain or improve soil fertility, with small or no additions ofinorganic fertilizers. Within the ISFM framework, it is now recognized that both organic and mineralinputs are necessary to enhance crop yields without deteriorating the soil resource base. This recognition has a practical dimension because either of the two inputs are hardly ever available in sufficient quantitiesto the small scale farmer, but it also has an important resource management dimension as there ispotential for added benefits created by positive interactions between both inputs when applied in combination. Such interactions can lead to improved use efficiency of the nutrients applied in organic ormineral form or both. Assessing the combination of the two in terms of resource quality, nutrient input, C,N and P dynamics and water use efficiency help to identify technology options for increasing farmproductivity and system resilience. There is increasing need, however, to address the issue of scale-dependence of different soil processes ranging from processes at the plant’s rhizosphere, to nutrient gradients within farms or greenhouse gas emissions at the landscape scale and confront these processes with the socio-economical dimensions of rural and urban communities.
The processes of land conversion and agricultural intensification are a significant cause of biodiversityloss, including that of below ground biodiversity (BGBD), with consequent negative effects both on theenvironment, ecosystem services and the sustainability of agricultural production. Documentation of BGBD, including the biological populations conserved and managed across the spectrum of agricultural intensification, is an essential component of the information required for assessment of environment-agriculture interactions, as is the evaluation of the impact of agricultural management on the resource base, particularly that of the soil. Soil organisms contribute a wide range of essential services to the sustainable function of agroecosystems among which the biological control of pests and diseases rankshigh. The combination of soil fertility and pest and disease management approaches is likely a uniqueopportunity to exploit synergies for the benefit of crop productivity.
Improving the natural resource base without addressing issues of marketing and income generation is often the reason for the lack of adoption of improved farming practices. Participatory approaches have shown considerable potential in facilitating farmer consensus about which soil related constraints should be tackled first. Consensus building is an important step prior to upscaling and collective action byfarming communities in integrated soil management at the landscape scale. Integration of local and scientific knowledge to develop an integrated or “hybrid” knowledge and thus increased relevance is anoverall strategy for sustainable soil management.
13
Milestones
By 2006, indicators of soil health and fertility at plot, farm and landscape scales identified.
By 2008, practical methods for rapid assessment and monitoring of soil resource base status developed.
By 2010, decision tools for soil biota, nutrient and water management developed anddisseminated to stakeholders.
Highlights
TSBFI-Africa
Short-term mineralization data supported the existence of 3 classes of organic resources insteadof the four originally proposed by the Decision Support System for organic N management,although threshold values for N, polyphenol, and ligning content were observed to be respected. However, organic resources also govern other functions, operating in the medium to long term,and for these functions, the original 4-class concept may be proven valid.
Near Infra Red (NIR) spectrometry was observed to be a powerfull tool to predict decompositionand nutrient release characteristics of organic residues.
Although soil organic matter (SOM) was responsible for 75 to 85% of the cation exchange capacity (CEC) of sandy soils, the biochemical composition of the organic inputs did not have an important effect on the CEC of SOM, invalidating one of the potential long-term benefits of managing organic resource quality.
In Western Kenya, farmers managed their fields according to their perceived land quality, varyingthe timing and intensity of management practices along soil fertility gradients, while the internalheterogeneity in resource allocation varied also between farms of different social classes,according to their objectives and factor constraints.
In Western and Central Kenya and Eastern Uganda, most of the variation in soil fertility status(organic C and available P content) of individual fields was observed at the farm level, exceedingthat of the village and district level. Farmer’s appreciation of these differences in soil fertilitystatus between fields within a farm correlated very well with measurements of organic C andavailable P, taken together.
A decision guide to integrate various food, feed and green manure legumes in various social and farm niches was developed and tested in Ethiopia, Kenya and Uganda. Other research and development partners have started to validate it in East African Region and beyond.
Plant height measurements, taken at any moment after maize flowering, are a useful means to predict maize yield, using simple linear regression models.
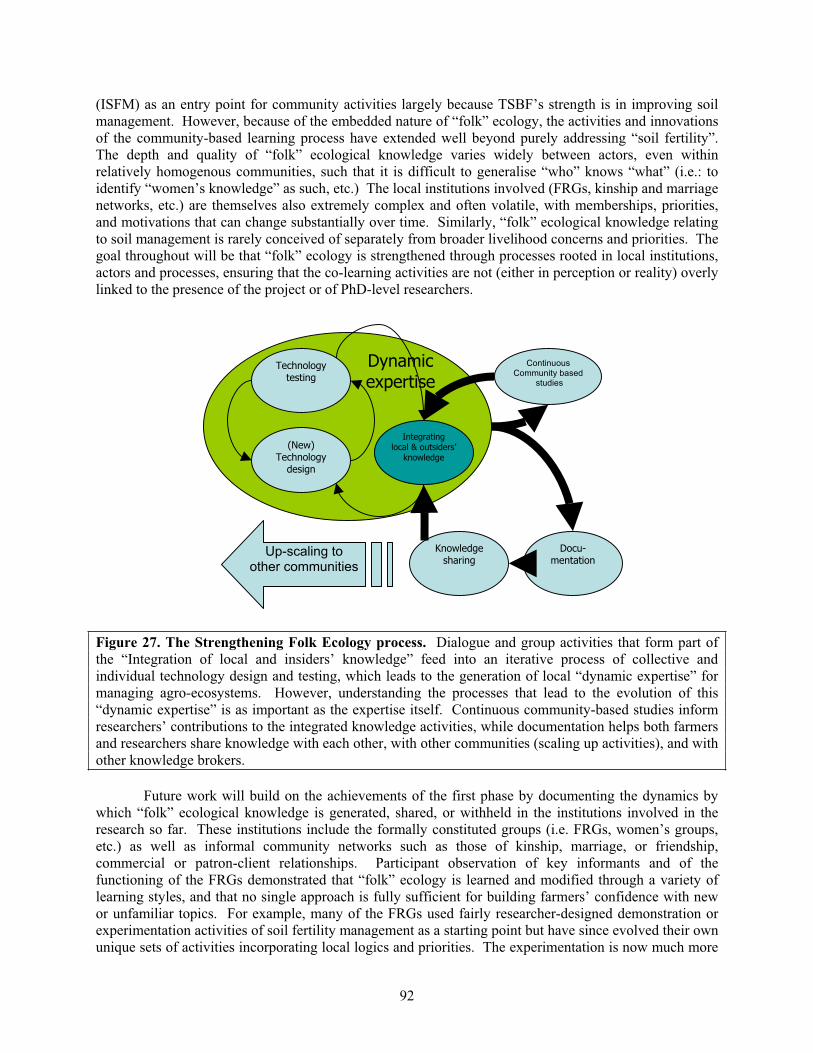
The lessons learned from the “Folk” Ecology project have been synthesized and summarized as a manual of interactive techniques. Rather than simply offering another “toolkit” for practitioners and farmers, the goal is to provide knowledge about the application of tools and methods
developed and adapted under the project, highly relevant questions for scaling up the “Folk” Ecology approach to other projects and partners. Evaluation of water harvesting and input application revealed that while in Niger, the Zai technique was observed to significantly improve plant establishment and yields, in Kenya there was no significant effect of water harvesting on maize grain yield.
14
TSBFI-Latin America
Showed that the plant measurements used to assess forage quality in animal nutrition studies can be used topredict aerobic decomposition of tropical legumes on the soil and confirmed the potential usefulness ofIVDMD (in vitro dry matter digestibility) for screening tropical legumes for soil fertility management.
High Mg2+ saturation caused marked negative effects in some soil physical properties of Vertisols such as: soil structure, rate of infiltration, saturated hydraulic conductivity and sorptivity. Thesechanges have to be taken into account for developing improved soil management strategies.
Showed that during the drying process, “magnesium soils” tend to reduce their volume, therefore causing negative changes in specific soil volume and normal and residual shrinkage. There was areduction of soil volume equivalent to 28% when the soil dries from field capacity to wiltingpoint.
A description of Martiodrilus species with its main biological, ecological and functionalattributes was made in native savanna and introduced pastures in Carimagua. Introduced pastures were a favorable media for this species.
The impacts of the conversion of native ecosystems into extensive or intensive pastures on soilfauna were assessed. Extensive cattle ranching led to slight enhancement of earthwormpopulations, while fire induced a decrease in macrofaunal density.
Found that there is genetic variability among accessions of Brachiaria humidicola regarding the nitrification inhibition (NI) activity of root exudates. The accession CIAT 16888 was identified ashaving superior NI activity compared with the commercial cultivar CIAT 679 used in moststudies so far.
Found that additions of charcoal to low fertility, acid Oxisols increases soil pH, cation exchangecapacity and availability of various soil nutrients and result in a net increase in nitrogen fixationby common beans, measured by 15N isotope dilution technique.
Belgium; Wageningen University, Wageningen, The Netherlands; Cornell University, Ithaca, USA.
Published Work
Cation exchange capacities of soil organic matter fractions in a Ferric Lixisol with different organic
matter inputs K. Oort, B. Vanlauwe and R. Merckx Agriculture, Ecosystems and Environment, 2004, In Press
Soil organic matter (SOM) has an important effect on the physicochemical status of highly weatheredsoils in the tropics. This work was conducted to determine the contribution of different SOM fractions tothe cation exchange capacity (CEC) of a tropical soil and to study the effect of organic matter inputs of different biochemical composition on the CEC of SOM. Soil samples were collected from a 20-yr old arboretum established on a Ferric Lixisol, under seven multipurpose tree species: Afzelia africana,
santalinoides, and Treculia africana. Fractions were obtained by wet sieving and sedimentation after ultrasonic dispersion. Relationships between CEC and pH were determined using the silver thiourea-method and were described by linear regression. The CEC of the fractions smaller than 0.053 mm wasinversely related to their particle size: clay (<0.002 mm) > fine silt (0.002-0.02 mm) > coarse silt (0.02-0.053 mm), except for the soils under Treculia africana, Dactyladenia barteri and Leucaena
leucocephala, where the CEC of the fine silt fraction was highest or comparable to the CEC of the clay fraction. The clay and fine silt fractions were responsible for 76 to 90% of the soil CEC at pH 5.8. The contribution of the fine silt fraction to the CEC at pH 5.8 ranged from 35% to 50%, which stressed the importance of the fine silt fraction for the physicochemical properties of the soil. Differences in CEC between treatments for the whole soil and the fractions could be explained by the differences in carbon content. Except for the intercept for the clay fraction, SOM had a significant (at P = 0.001) contributionto both the intercepts ( = estimated CEC at pH 0) and slopes ( = pH dependent charge) of the CEC-pHrelationships for the whole soil and the fractions. The CEC of SOM at pH 5.8 varied between 283 cmolc
kg-1 C for particulate organic matter and 563 cmolc kg-1 C for the fine silt fraction. The biochemicalcomposition of the organic inputs did not have an important effect on the CEC of SOM. In total, SOMwas responsible for 75 to 85% of the CEC of these soils.
Assessment of labile phosphorus fractions and adsorption characteristics in relation to soil
properties of West African savanna soils O.C. Nwoke, B. Vanlauwe, J. Diels, N. Sanginga and R. Merckx Agriculture, Ecosystemsn and Environment, 2004, In Press
The labile and moderately labile phosphorus fractions and adsorption characteristics of surface andsubsurface horizons of eleven soil profiles in the derived savanna (DS) and the northern Guinea savanna (NGS) of West Africa were assessed. The labile P fractions are the resin and HCO3 extracTable inorganic(Pi) and organic (Po) P. The moderately labile fractions are the NaOH extracTable portion of soil P in the Hedley sequential procedure. The resin P, considered the most readily available fraction, varied from 1 to 14 mg kg-1, HCO3-Pi ranged from 3.3 to 11 and HCO3-Po was between 4 and 12 mg kg-1 in the surfacehorizons of the DS soils. In the NGS, the topsoil contained 1.5 – 3 mg kg-1 of resin P, 5 – 8 mg kg-1 of HCO3-Pi, and 7.5 – 9.7 mg kg-1 of HCO3-Po. Sodium hydroxide-Po was the largest of the fractions in all
16
the soils studied. It ranged from 23 to 55 mg kg-1 in the topsoil. In general, the labile P levels were higherin soils of the DS than of the NGS and were related to the oxalate-extracTable Fe (Feox), and Al (Alox) as well as soil texture. The subsoil of Kasuwan Magani (profile KS 9-21 cm) required 153 mg P kg-1 tomaintain 0.2 mg P l-1 in solution (standard P requirement), and Danayamaka (profile DD 7-32 cm)required 145 mg P kg-1. These could translate to 214 and 200 kg P ha-1 if a plough layer of 10 cm is assumed. Because these are within the plough layer, more P fertilizer would be needed for crop production than in the other soils. The standard P requirement and the adsorption maxima were related toFeox and Alox, dithionite-Fe (Fed), and texture. The increase in labile P content with decreasing Feox and Alox could imply that management practices capable of reducing the activities of Fe and Al in solution might improve P availability.
Modeling nitrogen mineralization from organic sources: representing quality aspects by varying
C:N ratios of sub-pools
M.E. Probert, R.J. Delve, S.K. Kimani and J.P. Dimes Soil Biology and Biochemistry. 2005. In Press
The mineralization/immobilization of nitrogen when organic sources are added to soil is represented inmany simulation models as the outcome of decomposition of the added material and synthesis of soil organic matter. These models are able to capture the pattern of N release that is attribuTable to the N concentration of plant materials, or more generally the C:N ratio of the organic input. However the models are unable to simulate the more complex pattern of N release that has been reported for someanimal manures, notably materials that exhibit initial immobilization of N even when the C:N of thematerial suggests it should mineralize N. The APSIM SoilN module was modified so that the three pools that constitute added organic matter could be specified in terms of both the fraction of carbon in each pool and also their C:N ratios (previously it has been assumed that all pools have the same C:N ratio). It is shown that the revised model is better able to simulate the general patterns on N mineralized that has beenreported for various organic sources. By associating the model parameters with measured properties (thepool that decomposes most rapidly equates with water-soluble C and N; the pool that decomposes slowest equates with lignin-C) the model performed better than the unmodified model in simulating the Nmineralization from a range of feeds and faecal materials measured in an incubation experiment.
On-farm testing of integrated nutrient management strategies in Eastern Uganda
A.O Esilaba, J.B. Byalebeka, R.J. Delve, J.R. Okalebo, D. Ssenyange, M. Mbalule, and H. Ssali.Agricultural Systems, 2005. In press
This paper reports on a Participatory Learning and Action Research (PLAR) process that was initiated in three villages in Eastern Uganda in September 1999 to enable small-scale farmers to profitably reverse nutrient depletion of their soils by increasing their capacity to develop, adapt and use integrated natural resource management strategies. The PLAR process was also used to improve the participatory skills and tools of research and extension personnel to support this process. The farming systems of the area were characterized for socio-economic and biophysical conditions that included social organizations, wealthcategories, gender, crop, soil, agroforestry and livestock production. Farmers identified soil fertility constraints, indicators and causes of soil fertility decline and suggested strategies to address the problem of soil fertility decline. Soil fertility management diversity among households indicated that most farmerswere not carrying out any improved soil fertility management practices, despite previous research and dissemination in the area. Following the diagnosis stage and exposure visits to other farmer groups working on integrated soil fertility projects, the farmer’s designed eleven experiments for on-farm testing. One hundred and twenty farmers then chose, for participatory technology development, sub-sets of these eleven experiments, based on the main agricultural constraints and potential solutions identified and prioritized by the farmers. Quantitative and qualitative results from the testing, farmer evaluation and adaptation, training, dissemination strategies and socio-economic implications of these technologies arediscussed.
17
The APSIM Manure Module: Improvements in Predictability and Application to Laboratory
Studies
Probert, M.E., Delve, R.J., Kimani, S.K. and Dimes, J.P.In: Delve, R.J. and Probert, M.E., ed., 2004. Modeling nutrient management in tropical cropping
systems. ACIAR Proceedings No. 114, 136p.
Existing models are able to capture the pattern of N release from plant materials based on their C/N ratios.However, these models are unable to simulate the more complex pattern of N release reported for someanimal manures, especially for manures that exhibit initial immobilization of N even when the C/N ratioof the material suggests it should mineralize N. This paper reports on progress towards developing a capability within the APSIM SoilN module to simulate nitrogen release from these manures. The SoilNmodule was modified so that the three pools that constitute added organic matter can be specified in terms of both the fraction of carbon in each pool and also their C/N ratios. The previous assumption that all pools have the same C/N ratio fails to adequately represent the observed behavior for release of N fromsome organic inputs. By associating the model parameters with measured properties (the pool thatdecomposes most rapidly equates with water-soluble C and N; the pool that decomposes slowest equates with lignin-C) the model performed better than the unmodified model in simulating the N mineralizationfrom a range of livestock feeds and manure samples.
Testing the APSIM Model with Data from a Phosphorus and Nitrogen Replenishment Experiment
on an Oxisol in Western Kenya
J. Kinyangi, R.J. Delve and M.E. ProbertIn: Delve, R.J. and Probert, M.E., ed., 2004. Modeling nutrient management in tropical cropping
systems. ACIAR Proceedings No. 114, 136p.
An experiment was conducted on an Oxisol near Maseno in western Kenya, to compare the growth ofmaize crops to inputs of two phosphorus sources. Commercial triple superphosphate (TSP) and Minjinguphosphate rock were applied either at a once-only rate of 250 kg P ha–1 or as five annual inputs of 50 kg P ha–1. The experiment was carried out over 10 cropping seasons between 1996 and 2000. An additionalfactor studied was the source of N, either as urea or Tithonia biomass-N to supply 60 kg N ha–1. Both Nand P sources were applied only to the crops grown in the long rain season. The APSIM model has been tested against this data set. The effects of P treatments were large in the long rain season, but in the shortrain season the inadequate supply of N greatly reduced growth and P effects. The yields of the maizecrops were predicted well (r2 = 0.88) with respect to both the P treatments (as TSP) and the N inputs (as urea). The predicted water, N and P stresses were informative in understanding the contrasting pattern ofresponse observed in the two seasons. The simulation of this long-term experiment shows that the APSIM SoilP module is robust, in as much as it extends the testing of the model to a very different environmentwhere there were both N and P stresses affecting plant growth, and on a very different soil type to where the concepts in the APSIM phosphorus routines were originally developed and tested.
Evaluation of a farm-level decision support tool for trade-off and scenario analysis for addressing
food security, income generation and natural resource management
Robert J. Delve, Ernesto Gonzalez-Estrada, John Dimes, Tilahun Amede and Juma Wickama.In: German, L. and Stroud, A., (ed.). Integrated Natural Resource Management in Practice: Enabling
Communities to Improve Mountain Landscapes and Livelihoods. AHI Conference, 12-15 October,
2004. Nairobi, Kenya.
Resource-poor farmers face difficult decisions over the use of scarce nutrient sources in crop-livestockproduction systems. A better understanding of the comparative values and trade-offs in the use of land, labor, manures and other locally available resources is required in order to increase the production and efficiency of mixed crop-livestock systems. While efforts are required to expand our knowledge of thebiophysical aspects of alternative uses of organic nutrient sources, similar efforts are also required on thesocio-economic driving forces behind farmers' decision making. The approach uses trade-off analysis,partial budgeting and multiple goal linear programming to identify management options to address
18
farmers production criteria and overcome their constraints. This evaluation includes both the short and longer-term economic and environmental benefits. From the social and economic viewpoint, organic resources can be identified that could substitute for mineral fertilizers in areas where fertilizers are notaffordable. From an environmental aspect, management practices could be identified that results in fewer nutrient losses and could rebuild or maintain the soil resource base. A multi-stakeholder coalition has been working in Ethiopia, Tanzania, Zimbabwe and Uganda and has successfully developed a decision support tool (DST) to explore these different trade-offs and scenarios based on smallholder farmersexisting practices and opportunities. This paper uses case studies from AHI benchmark sites in Lushoto,Tanzania and Areka, Ethiopia to discuss the potential of the DST for improving farmers and developmentpartners decision making to achieve food security, increase farm income, increase returns to land andlabor and maintaining sustainable production. Examples to be presented will investigate scenarios andtrade-offs for three different wealth categories per site and for different areas of the farm with varying soil fertility levels, for example:
Land allocation – which crops to which land
Efficiency of fertilizer use – when to apply, where to apply it in the rotation, how much
Labor constraints – when to weed, when to apply manures
Investment options: capital allocation-livestock versus crop enterprises, labor allocation-farm and non-farm
Appropriate use of crop residues in mixed systems
Integration of legumes into the system
The distribution of phosphorous fractions and sorption characteristics of benchmark soils in the
moist savanna zone of West Africa
O.C. Nwoke, B. Vanlauwe, J. Diels, N. Sanginga and O. Osunubi Nutrient Cycling in Agroecosytems, 2004, In Press
The fractionation of soil P into various organic and inorganic pools with differing levels of bioavailabilitycoupled with the knowledge of the P adsorption and desorption characteristics of the soils provideinsights into management strategies that might enhance availability to crops. Sequential soil P fractionation (using the modified Hedley scheme) was conducted on 11 soil profiles selected from the benchmark areas of the West-African moist savanna zone. Also P fractions were determined on soilsamples taken from experimental fields under different management practices in the study area. Phosphorus adsorption and desorption studies were conducted on samples from the surface horizon of the soil profiles. The total P content varied within and among the soil profiles and tended to decrease withincreasing depth in most cases. It varied from 53 to 198 mg kg-1 in the topsoil and about 30% existed inthe organic form. The resin P fraction of the topsoil ranged between 1 and 14 mg kg-1 decreasing with depth within the soil profile. The low resin P levels indicate low availability. Addition of organic matter (OM) and soluble phosphate fertilizer (PF) increased the inorganic P (Pi) fractions extracTable with resin, HCO3 and NaOH by about 400% in the northern Guinea savanna (NGS) fields but had no significanteffect on the organic P (Po) pools and the more sTable Pi forms. Organic matter and PF alone or incombination (OM+PF) did not influence the Pi fractions differently in Glidji. The P sorption capacities were low with the adsorption maximum deduced from the Langmuir equation ranging from 36 to 230 mgkg-1. The amount of P sorbed to maintain 0.2 mg l-1 in solution ranged between 0.6 and 16 mg kg-1.Phosphorus desorption with anion exchange resin differed among the soils with the recovery of added Pranging from 17 to 66% after 96 h. On the average, more of the applied P was recovered in the DS soils than in the NGS soils. Because of the relatively low sorption capacity and the relatively high percentagerecovery, small additions of P to most of the DS soils tested might be adequate for crop growth.
Performance evaluation of various agroforestry species as short duration improved fallows for
enhancement of soil fertility and sorghum crop yields in Mali
Bocary Kaya1, Amadou Niang2, Ramadjita Tabo3, André Bationo4
1 Institut d’Economie Rurale secondé à ICRAF Sahel Program, BP 320 Bamako, Mali
19
2 International Centre for Research in Agroforestry, Sahel Program, BP 320 Bamako, Mali 3 International Crops Research Institute for the Semi Arid Tropics, ICRISAT Niamey, BP 12404 , Niamey,
Niger; 4 Tropical Soil Biology and Fertility, Afnet-TSBF/CIAT, Nairobi, Kenya The human population growth rate in the Sahel (nearly 3% per annum) is among the highest in the worldcreating a high land use pressure with the disappearance of the traditional fallow system. This hasaccelerated the degradation of the natural resources base by a poverty-stricken population forced to overexploit soils, rangelands and forests in order to subsist. The consumption of mineral fertilizers in SSAincreased slowly by 0.6% during the last 10 years, compared to 4.4% in the rest of the other developingregions. The total annual nutrient depletion in SSA is equivalent to 7.9 Mg yr-1 of N, P, and K, six timesthe amount of annual fertilizer consumption in the region. In the particular case of the southern Maliregion, N-K-Mg budgets in 1992 were estimated to be -25, -20, and -5 kg per hectare per year indicating that as much as 40% to 60% of the income generated by farming in this region were based on “soil mining”. It is in the light of these constraints that the Malian agricultural research institute (Institut d ‘Economie Rurale, IER), the Sahel Program of the World Agroforestry Centre (ICRAF) and the International Crops Research Institute for the Semi Arid Tropics (ICRISAT) joined efforts to undertake research activities aimed at sustainably improving soil fertility and agricultural crop yields in the Mali.Thus, from the year 2000 14 different trees and shrubs are being tested in improved fallow systems to findwhich ones perform best to replenish soils and improve crop yields. The results have i) identified mostsuited species for 1 or 2 yr improved fallows, ii) determined their impact on sorghum grain yields and iii) documented the remnant effects of their impact on soil fertility and crop yields. Some species could notsurvive more than 1 year the Samanko conditions. In 2002, the first year of cultivation, it was the Kenyanprovenances of Sesbania sesban which performed best with sorghum yields over 2 t ha-1. A year later,2003, there has been a general decrease in crop yield. Again, the Kenyan provenances of S. seban, with yields 40% lower than the first year of cultivation, were the worst affected by this decrease. Nosignificant changes were observed in the traditionally tested chemical soil parameters.
Characterisation of soil degradation under intensive rice production in Office du Niger zone of
Mali
M. Bagayoko, M.K. N’Diaye; M. Dicko and B. Tangara Food security is a major priority of the most Sahelian governments. With the cyclic droughts, irrigation is believed to achieve that objective. Unfortunately, present observations show that soils of irrigated areas inSub Sahara African countries have changed unfavourably. In the Office du Niger zones, producers and extension workers are concerned with soil degradation symptoms such as salinisation / alkalinisation orsodisation. For some people, this needs more attention while other think that the phenomenon is localisedand therefore not very important. In the context of intensive crop production, from 1995 to 1999, “the Pole regional de recherche sur les Systèmes Irrigués (PSI)” which was a regional networking project was aimed to determine the nature, and the importance and dynamic of the processes in general and theireffect on the evolution of soil fertility in particular. Analysis of the functioning of water Table has beenmade at different scales in the irrigated zones to explain the operation of the hydraulic system of the soiland estimated the in and out flow of water. More over, the study addressed the terms of hydro-saline balance. A piezometric network installed in the area revealed the impact of cropping systems and soil types on the evolution of water Table in terms of dynamics and quality. The results clearly show evidenceof soil geochemical changes and water management of the irrigated areas. The present paper highlight the research conducted to combat soil degradation in the irrigated rice system in the Office du Niger in Mali from 1995 to the present days.
Mineral fertilisers, organic amendments and crop rotation managements for soil fertility
maintenance in the Guinean zone of Burkina Faso (West Africa)
B. V. Bado1, A. Bationo2, Lompo, F3; M. P. Cescas4 and M. P Sedogo3
1 INERA, Centre Régional de Recherche Agronomique de Farakô-Ba, P. O. Box 910 Bobo-Dioulasso,
BURKINA FASO
20
2 The Tropical Soil Biology and Fertility Institute of CIAT, P. O. Box 30677 Nairobi, KENEYA 3 INERA, CREAF de Kamboinse, 01 BP 476 Ouagadougou, BURKINA FASO 4 Département des Sols et Génie Agroalimentaire (FSSA), 2219 Comtois, Université Laval Ste Foy
Québec (QC) G1K 7P4, CANADA
Low nutrient contents in particular N and P deficiencies, low organic carbon content are the maincharacteristics of dominated Alfisols of the Guinean zone of Burkina Faso (West Africa). Long-termcultivation without or with low quantities of mineral fertilisers due to weak incomes of small holderfarmers leads to soil fertility declining over years. Management options using mineral fertilisers, organicamendments, crop rotations with fallow and N2-fixing legume crops are discussed using results of agronomic experiments. Optimum crop yields are usually abstained by combination of mineral andorganic fertilisers. Positive interactions between mineral and organic N have been pointed out, indicated that management options using both mineral and organic fertiliser could increase crop yields and allowing a sustainable management of soil fertility. Crop rotation with one year fallow could be an usable management option for soil fertility maintenance. Soil of annual fallow prevents soil organic carbondeclining. But highest crop yields are usually achieved when legume crops such as groundnut or cowpeawere used in rotation systems. Legume crops increase soil mineral nitrogen and N fertiliser use efficiencyand both sorghum and cotton produced highest in Cotton-Sorghum-Groundnut rotation. Then, sustainable management of soil fertility can be achieved by integrated management of mineral and organic fertilisers in combination with crop rotations. N2-fixing legume crops (cowpea and groundnut) could be efficientlyused to increase soil fertility and system productivities. Cotton-Sorghum-Groundnut rotation is one of the most efficient rotations for crop productivities increasing and soil fertility maintenance using mineralfertilisers at recommended doses for each crop. For a better productivity of the system, cattle manure needto be applied at 3 tonnes per hectare on sorghum and cotton.
Intensity of cultivation induced-effects on Soil Organic Carbon Dynamic in the western cotton area
of Burkina Faso
B. Ouattara1, K. Ouattara1, G. Serpantié2, M. Abdoulaye3, M.P. Sédogo1, A. Bationo4.1Institut de l’Environnement et de Recherche Agricole (INERA), 04 BP 8645, Ouagadougou 04,
Fertility Institute of CIAT, P.O Box 30677, Nairobi, KenyaSoil organic carbon (SOC) dynamic is a key element in savannah soil fertility and much depends on farming systems. In the western part of Burkina Faso, the land use is greatly linked to the cotton-basedcropping systems. These practices induced modifications of the traditional shifting cultivation and upgraded the issue of soil fertility management. In order to more understand its depletion process in this area, SOC dynamic was assessed based on a large typology of land cultivation intensity at Bondoukui (11° 51’ N, 3° 46’ W, altitude 360 m). Thus, 114 plots were sampled on soil 0 – 15 cm depth, considering thefield-fallow successions (shifting cultivation, cyclic cultivation, continuous cropping), the age of eachcultural phase, the tillage intensity (occasional ploughing, biennial ploughing, annual ploughing), and thesoil texture (sandy and silty-clayey soils). Soil organic carbon physical fractionation was done according to the following particles size classes: > 200 µm; 50-200 µm, 20-50 µm and < 20 µm. The results exhibited an increase of SOC content, and a lower depletion rate with the clay content. After a long-termfallow, the land cultivation led to an annual loss of 2 % (315 kg ha-1) of its organic carbon during the first twenty years. The different fractions of SOC content are affected by this depletion according to the cultivation intensity. The coarse SOC fraction (> 200 µm) was the most depleted. The organic matter(manure, crop residues) ploughing-in in low frequency of tillage system lowered soil carbon loss compared to annual ploughing. Nowadays, human-induced disturbances (wildfire, overgrazing, fuel woodcollection, fallow duration decreasing, crop duration increasing) in savanna land unable fallow to reachthe SOC level of previous equilibrated shifting cultivation system.
21
Nitrogen fertilizer equivalencies of organics of differing quality and optimum combination with
inorganic nitrogen source in Central Kenya
J.M. Kimetu1, D.N. Mugendi2, C.A. Palm1, P.K. Mutuo1, C.N. Gachengo1, A. Bationo1, S. Nandwa3, J.B.Kungu2
1Tropical Soil Biology and Fertility Institute of CIAT (TSBF-CIAT), ICRAF Complex, P.O Box 30677,
Nairobi, Kenya; 2 Department of Environmental Foundations, Kenyatta University, P.O Box 43844,
Nairobi, Kenya; 3National Agricultural Research Laboratories (NARL), P.O Box 14733, Nairobi, Kenya
Nutrient Cycling in Agroecosystems 68: 127–135, 2004
Decline in crop yields is a major problem facing smallholder farming in Kenya and the entire Sub-Saharan region. This is attributed mainly to the mining of major nutrients due to continuous cropping without addition of adequate external nutrients. In most cases, inorganic fertilizers are expensive hence unaffordable to most smallholder farmers. Although organic nutrient sources are available, informationabout their potential use is scanty. A field experiment was set up in the sub-humid highlands of Kenya toestablish the chemical fertilizer equivalency values of different organic materials based on their quality.The experiment consisted of maize plots to which freshly collected leaves of Tithonia diversifolia (tithonia), Senna spectabilis (senna) and Calliandra calothyrsus (calliandra) (all with % N >3) obtainedfrom hedgerows grown ex situ (biomass transfer) and urea (inorganic nitrogen source) were applied. Results obtained for the cumulative above ground biomass yield for three seasons indicated that a combination of both organic and inorganic nutrient source gave higher maize biomass yield than wheneach was applied separately. Above ground biomass yield production in maize (t ha-1) from organic and inorganic fertilization was in the order of senna+urea (31.2), tithonia+urea (29.4), calliandra+urea (29.3),tithonia (28.6), senna (27.9), urea (27.4), calliandra (25.9), and control (22.5) for three cumulativeseasons. On average, the three organic materials (calliandra, senna and tithonia) gave fertilizer equivalency values for the nitrogen contained in them of 50%, 87% and 118% respectively. It is therefore recommended that tithonia biomass can be used in place of mineral fertilizer as a source of nitrogen. The high equivalency values can be attributed to the synergetic effects of nutrient supply, and improvedmoisture and soil physical conditions of the mulch. However, for sustainable agricultural production,combination with mineral fertilizer could be the best option.
Completed Work
Resource flows and nutrient balances in smallholder farming systems in Mayuge district, eastern
Uganda
A.O. Esilaba, P. Nyende, G. Nalukenge, J.B. Byalebeka, R.J. Delve and H. Ssali.Agroecosystems and Environment, 2005, Revised article submitted
Resource flows and farm nutrient balance studies were carried out in eastern Uganda to ascertain themovement of organic resources and nutrients in and out of the farm system. Resource flow mapping was conducted during a participatory learning and action research (PLAR) process. The resource flows weretransformed into nutrient flows and partial nutrient balances were calculated for the crop production,animal production, household and out of farm systems using the Resource Kit computer package. Resultsof a farmers’ soil fertility management classification at the start of the PLAR intervention in 1999 revealed that 3% of the farmers were good soil fertility managers, 10 % were average soil fertility managers (class II) and 87% were poor soil fertility managers (class III). There was a strong relationship between wealth ranking according to the farmers’ own criteria and soil fertility managementclassification. Soil chemical and physical properties of the soils in the three soil fertility management classes did not differ significantly despite the differences perceived by the farmers. The study revealed that very low quantities of resources and nutrients enter the farm system, but substantial amounts leavethe farm in crop harvests. The main source of nutrients on the farm is the crop production system and the major destination is the household system. The livestock component contributed little to the flow of nutrients in the farm system due to the low levels of livestock ownership. The results indicate that the net farm nutrient balances kg ha-1 per season for all the nutrients (N, P, and K) were negative for both the
22
good and the poor soil fertility managers. Class 1 farm balances irrespective of the season, were however more negative than those of class 3 farms. For the long rains seasons (LR 2000,2001 and 2002), theaverage net farm nutrient balances for N, P, and K for class I farms were -5.0, -0.6 and – 8.0 kg ha-1 year-
1, while for the short rains seasons (SR 2000 and 2001), the nutrient balances were –3.5, - 0.5 and -6.0 kgha-1 year-1 respectively. For the class III farms, the average net farm nutrient balances for N, P, and K in the long rain seasons (LR 2000,2001 and 2002) were –3.3, -0.3 and –4.0 kg ha-1 year-1 while for the shortrains seasons (SR 2000 and 2001), the nutrient balances were –3.5, 0.5 and –5.0 kg ha-1 year-1
respectively. The partial nutrient balances for the various subsystems in the short rains for class 1 farmers were lower than those of the long rains season. Significant nutrient loss occurred in the crop productionsystem as almost no nutrients return to the system. Potassium export from the farm was severe especiallyfor farmers who sell a lot of banana. Soil management interventions for these small-scale farmers shouldaim at reversing nutrient depletion with a focus on profiTable management of the crop production system,which is the major cause of nutrient depletion. Strategic management of nutrients that enter the householdsystem such as through home gardening and composting near the household would greatly increase the return of nutrients to the crop production system.
Mineral nitrogen contribution of Crotalaria grahamiana and Mucuna pruriens short-term
fallows in eastern Uganda
J.B. Tumuhairwe, B. Jama, R.J. Delve, M.C. Rwakaikara-Silver.African Crop Science Journal, in review
Nitrogen (N) is one of the major limiting nutrients to crop production in Uganda and is depleted at faster rates that replaced. Consequently, yields at farm level are less than 30% of the expected potential. Paradoxically, the majority subsistence farmers are poor to afford use of mineral fertilizers but improvedfallow have been reported economically feasible in such conditions. Therefore, a study was initiated inTororo district, eastern Uganda (i) to determine mineral N contribution of C. grahamiana and M. pruriens
short-duration fallows compared with farmers’ practices of natural fallow, compost manuring and continuous cropping, (ii) sampling period that closely related to maize grain yield was also determinedand also (iii) whether improved fallow provided adequate mineral N for optimum grain yield compared tofarmers’ practices. It was noted that improved fallows increased mineral N at Dina’s site during fallowing (at 0 week sampling), and in the first and fifth week after incorporating their biomass than farmers’practices. For instance, at harvesting fallows (0 week sampling), C. grahamiana and M. pruriens had 12.68 and 12.97 mg Kg-1 N compared to 6.79 and 7.79 mg kg-1 N from following natural fallow and continuous cropping respectively. However, no significant increase was realized at Geoffrey’s site at anyof the sampling dates attributed to low biomass yield and incorporated. C. grahamiana increased grainyield by 29.3% (Dina’s site) and 56.6% (Geoffrey’s site) and M. pruriens by 36.0% (Dina’s site) and 27.2% (Geoffrey’s site) compared to natural fallow with -11.9% (Dina’s site) and 17.4% (Geoffrey’s site) then compost manure -9.6% (Dina’s site and 0% (Geoffrey’s site) in relation to continuous cropping as a bench mark. Supplementing the land use systems LUS (C. grahamiana, M. pruriens, natural fallows,compost manure and continuous cropping) with inorganic N fertilizer as urea significantly increased grainyield in all except C. grahamiana at both sites. There were two peaks on mineral N. The first and majorpeak occurred in the third week dominated by NO3
--N and the minor one in the tenth week with NH4+-N
prominent consistent at both sites. Mineral N in the fifth week after incorporating biomass was mostclosely related to grain yield followed by sampling at planting (0 week).
Mucuna pruriens and Canavalia ensiformis legume cover crops: Sole crop productivity, nutrient
balance, farmer evaluation and management implications
R.J. Delve and B. JamaAfrcian Crop Science Journal, in review
The high costs of inorganic fertilizers in Uganda limits their use by resource-poor smallholder farmers.There is also little practical knowledge existing in Uganda about the management of herbaceous legumecover crops that often are promoted as low-cost alternatives. Therefore, the effects of a one season sole-
23
crop fallow of Mucuna pruriens and Canavalia ensiformis legume cover crop on a following maize cropand topsoil N, P and K balances were assessed for 2 seasons in two locations, Osukuru (0o 39/ N, 34o 11/
E) and Kisoko (0o 43/ N, 340 06 / E) of Eastern Uganda. During land preparation, 50 or 100% of theaboveground biomass of Mucuna and Canavalia was manually incorporated into the topsoil (0 to 15 cmdepth) using a hand hoe. Mucuna and Canavalia aboveground biomass production was not affected by theinitial soil fertility of the sites and produced 6 t ha-1 at Osukuru and 7 t ha-1 at Kisoko. Incorporation of50% or 100% of the in-situ aboveground biomass significantly increased maize grain by up to 118% and stover yields by up to 75% compared to farmer practice in the first season after incorporation in nearly alltreatments. No significant increases in maize grain or stover yields were observed in the second seasonafter application. No significant differences were also observed between 50% and 100% in-situ biomassincorporation on maize grain and stover yields, giving resource poor farmers the option of alternative uses for the additional 50% of the biomass, for example, biomass transfer to other parts of the farm, for compost making or for livestock feed. In the first season after incorporation of the legume cover crops, addition of 100% and 50% of the aboveground biomass resulted in a positive nutrient balance for N only. Additions of 100% of the aboveground biomass of either Mucuna or Canavalia were needed for a positive nutrient balance for K, whereas none of the treatments produced a positive balance for P, thus suggestingthe need for inorganic P fertilizers additions in order to mitigate depletion in the long run. Farmers had multiple criteria for assessing the different species and used these to select the potential species that fittedwithin their production systems and production objectives.
On-going Work
Relationships between organic resource quality and the quantity/quality of the soil organic matter
pool
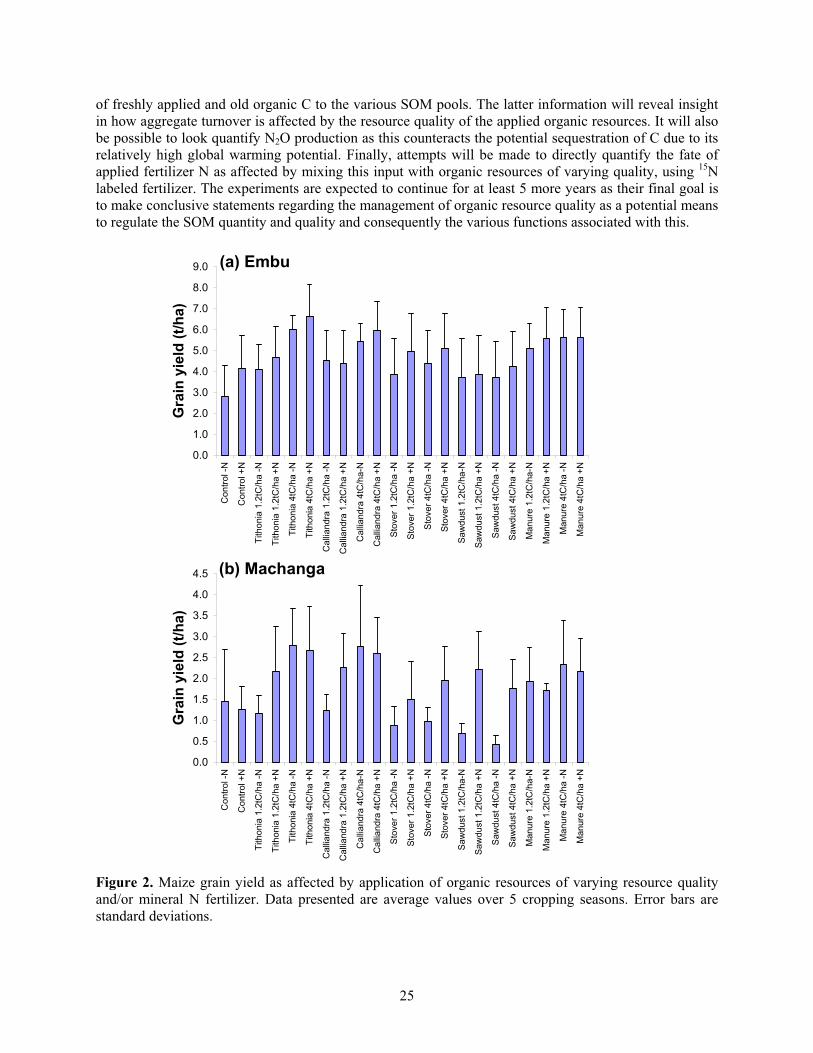
H Wangechi and B Vanlauwe The management and enhancement of Soil Organic Matter (SOM) is pivotal to the sustainable utilizationof soils. SOM is a major determinant of soil fertility, water holding capacity and biological activity and is highly correlated to levels of above and below ground biodiversity. A loss of SOM can lead to soil erosion, loss of fertility, compaction and general land degradation. In addition changes in the use and management of soils that result in a decline in SOM can lead to a release of CO2 to the atmosphere, withpractice that increases SOM leading to sequestration of C from the atmosphere to soils. The managementof SOM is therefore important at the field, regional and global scale. Management practices that affectcrop biomass production, residue maintenance, and litter will also affect SOM.This report summarizes the progress of an ongoing project in central Kenya (Embu and Machanga) sites. The main objective focuseson the role of the quality and/or quantity of organic resources in sustaining crop production and regulating the quality and quantity of the SOM pool under different soil and climatic conditions. Similarexperiments are being undertaken in Ghana and Zimbabwe. The impact of these organic resources on crop yields, N use efficiency, and SOM dynamics are being monitored over time in these sites.
Summarizing the last 5 seasons in the Kenyan sites, maize yields were influenced significantly bythe application of organic materials, their organic resource quality, and fertilizer nitrogen application (Figure 2a). Grain yields were highest for Tithoniaand and Calliandra for both Embu and Machanga sites.In Embu, application of maize stover, manure, and sawdust resulted in higher yields compared to the control plots, while in Machanga, this was true for the manure treatment. In the latter site, application of maize stover and sawdust in absence of fertilizer N depressed maize yields. Generally spoken, responses to application of N fertilizer were minimal in Embu for most organic resources while in Machanga, application of N fertilizer substantially increased grain yields for all organic inputs, except manure (Figure 2b).
With last year’s approval of the National Science Foundation grant on ‘The interaction betweenresource quality and aggregate turnover controls ecosystem nitrogen and carbon cycling’, it will be possible to look at the quantity and quality of biologically meaningful SOM pools, following a size-density fractionation procedure after aggregate separation. Isotopes will be used to trace the contribution
24
of freshly applied and old organic C to the various SOM pools. The latter information will reveal insight in how aggregate turnover is affected by the resource quality of the applied organic resources. It will alsobe possible to look quantify N2O production as this counteracts the potential sequestration of C due to its relatively high global warming potential. Finally, attempts will be made to directly quantify the fate of applied fertilizer N as affected by mixing this input with organic resources of varying quality, using 15Nlabeled fertilizer. The experiments are expected to continue for at least 5 more years as their final goal isto make conclusive statements regarding the management of organic resource quality as a potential meansto regulate the SOM quantity and quality and consequently the various functions associated with this.
igure 2. Maize grain yield as affected by application of organic resources of varying resource quality
0.0
1.0
2.0
3.0
4.0
5.0
6.0
7.0
8.0
9.0
Con
trol -N
Contr
ol +
N
Titho
nia
1.2
tC/h
a-N
Tithonia
1.2
tC/h
a+
N
Tithonia
4tC
/ha -
N
Tith
onia
4tC
/ha
+N
Ca
lliandra
1.2
tC/h
a -
N
Calli
andra
1.2
tC/h
a+
N
Calli
andra
4tC
/ha-N
Ca
lliandra
4tC
/ha
+N
Sto
ver
1.2
tC/h
a -
N
Sto
ver
1.2
tC/h
a+
N
Sto
ver
4tC
/ha -
N
Sto
ver
4tC
/ha
+N
Saw
dust
1.2
tC/h
a-N
Saw
du
st
1.2
tC/h
a +
N
Saw
dust 4tC
/ha -
N
Sa
wdust 4tC
/ha
+N
Ma
nure
1.2
tC/h
a-N
Ma
nure
1.2
tC/h
a+
N
Manure
4tC
/ha
-N
Manu
re 4
tC/h
a +
N
Gra
in y
ield
(t/
ha)
(a) Embu
0.0
0.5
1.0
1.5
2.0
2.5
3.0
3.5
4.0
4.5
Co
ntr
ol -N
Co
ntr
ol +
N
Tithonia
1.2
tC/h
a-N
Tith
onia
1.2
tC/h
a+
N
Tithonia
4tC
/ha
-N
Titho
nia
4tC
/ha
+N
Calli
andra
1.2
tC/h
a -
N
Calli
and
ra 1
.2tC
/ha
+N
Ca
lliandra
4tC
/ha-N
Calli
andra
4tC
/ha
+N
Sto
ve
r 1.2
tC/h
a-N
Sto
ver
1.2
tC/h
a+
N
Sto
ver
4tC
/ha
-N
Sto
ver
4tC
/ha +
N
Sa
wdust 1.2
tC/h
a-N
Saw
dust 1.2
tC/h
a+
N
Saw
du
st 4
tC/h
a -
N
Saw
dust 4tC
/ha +
N
Manu
re 1
.2tC
/ha-N
Manu
re 1
.2tC
/ha
+N
Man
ure
4tC
/ha -
N
Manure
4tC
/ha
+N
Gra
in y
ield
(t/
ha)
(b) Machanga
F
and/or mineral N fertilizer. Data presented are average values over 5 cropping seasons. Error bars are standard deviations.
25
Developing a decision support tool for evaluation of trade-offs and scenario analysis, results of a
collaboration between ILRI, ICRISAT, TSBF and national partners
A decision support tool for evaluating alternative nutrient sources, management practices and impacts onsoil fertility has been developed and evaluated. This has successfully developed a linked Decision Support Tool (DST). The DST has two components, a data entry and database section and a multiple goal linear programming tool. It was not thought necessary to link simulation models explicitly as their data can be added into the DST for evaluating trade-offs and scenarios. For this work, an approach establishedby the International Livestock Research Institute (ILRI), to analyze agricultural systems at the farm levelwas followed. The core component of this approach is the integration of simulation and multiple-criteriaoptimization models. Both data and models are assembled in the software, IMPACT (integrated modelingplatform for animal-crop systems). The methodological aspects of IMPACT and its interaction with optimization models are briefly described below and given in Figure 3. IMPACT provides a protocol forcollecting essential data to characterize a farming system. This data collection protocol is organized insuch way that it describes the flow of resources through all the farming activities and their interactions.Information within IMPACT is organized in eight groups: 1) climate; 2) family structure; 3) land management; 4) livestock management; 5) labor allocation; 6) family’s dietary pattern; 7) farm’s sales and expenses; and 8) soil nutrient flow. In addition, IMPACT processes these data to provide a baseline analysis of the system’s performance. This base-line analysis includes: 1) monthly financial balances; 2) the family’s monthly nutritional status; and 3) an annual soil nutrient balance.
igure 3. System prototyping and impact assessment for sustainable alternatives in mixed farming
A suite of simulation and optimization models can be directly linked to the data stored inIMPAC
Farming prototypesBased on farmers
perceptions
Scenario analysisSustainable
alternatives
ModelingSoil-crop-livestock
interactions
Longitudinal
householdsurvey
2° data and
expertopinion
Farmhousehold
modeling
Stable prototypesProduction systems that
achieve
desired farming objectives
F
systems in high potential areas of East Africa (Ref: M. Waithaka, P. Thornton, H. Booltink, K. Shepherd, R. Kaitho, W. Thorpe and B. Salasya, 2002).
T. In IMPACT’s current version (1.0.3), there is direct connectivity with the Householdoptimization model and the Ruminant simulation model. The Household model is a multiple-criteriamodel for assessing the impact of management interventions on the performance of farming systems and the livelihoods of the families that depend on them. The model explicitly incorporates IMPACT data
26
related to on- and off-farm resources, as well as their seasonal management. It also includes informationon food security-related factors, off-farm income generation, and labor constraints. Thus, the Householdmodel determines the best combination of farm resources that satisfy a set of objectives according to aseries of both management and economic interventions. These objectives can be directed towardsmaximizing gross margins, minimizing nutrient losses, or minimizing risk, amongst others. The effect of interventions can be tested by including simulated outputs from other models (e.g. the Ruminant modelmentioned above and DSSAT). Thus, the overall effect of a specific intervention is subsequently tested at the whole farming system level by including simulated outputs in the Household model.
The DST captures all inputs and outputs for the farm enterprise, especially in terms of labor andcash spe
egume green manuring for soil productivity improvement in eastern Uganda
een blamed on continuous cultivation of the land resource
fNet: The role of micro organisms in African farming systems
ite 1: Cameroon
rbuscular Mycorrhiza Resource Bank and Selection of Beneficial Microorganisms for Crop
vours an integrated approach based on a significant reduction inthe excess use of chemical products for more sound ecological ones. Our overall goal in this project is to
nt on buying food and household items throughout the year. A major advance in this work wasachieved when labor was separated by individual operation within crop and livestock management, e.g. for land preparation, planting, fertilizing, weeding etc. This gives the DST the power to be able to add indifferent scenarios easily, for example, if you wanted to see what difference adding more fertilizer to a crop would make, a soil-crop model could be used to give a 20 year average yield and in the DST another enterprise can be added to reflect this fertilizer use. As labor and cost are already known for most of the operations in this crops production, another scenario is very quick to add.
L
M.J. Kuule, M.A. Bekunda and R.J. Delve.Paper in preparation from Masters thesis
Declining per capita food production has bwithout adequate replenishment of soil nutrients. A recent fertilizer use survey reported a less than 1kg of nutrient fertilizer per hectare per year. Yet rates of nutrient uptake by plants through crop harvest or loss through leaching and other loss processes from arable land are much higher. This leads to seriousnutrient depletion. Green manuring offers an alternative source of nutrients especially N in a relaysystem of intercropping. A study to demonstrate this potential and to identify suiTable legume speciesfor the area was conducted on farmers' fields in two sub counties, Kisoko and Osukuru in Tororodistrict. Four legume species, Canavalia, Crotalaria, lablab and Mucuna, were intercropped with Maize (Longe 1variety) in the first season (short rains of 2000) on plots of 5m X 5m. The legumes were incorporated during land preparation for the second season, in their respective plots and planted with maize. Maize grain and stover yields were measured for each season and an economic analysis using partial budgeting and marginal rate of return tools performed to highlight the feasibility of the greenmanure technology in the farming system. Results showed a no significant response in the intercropping (first) and third (residual) seasons, but significant maize gain yield increase for Crotalaria and Lablab green manure after incorporating(second season) the legumes of 96.4 and 69.6 % respectively comparedto the control plot. This was probably due to deep nutrient capture by the Crotalaria roots and recyclingthe nutrients through leaf fall. Economic analysis results indicated positive returns to both land andlabor from using green manure technology and highest Marginal rate of return of 100.63%wereobtained from using Mucuna compared to Canavalia green manure. Based on economic returns andease of establishment, Mucuna and Canavalia green manures were recommended for farmers as lowcost soil improving technology.
A
S
A
Production in Cameroon Acidic Soils
The new concepts on food production fa
27
promote an ecological approach in agricultural systems and the integrated management of land resources for the enhancement of productivity and agro-ecosystem sustainability. Soil biota can be manipulated to enhance nutrient cycling, improve the physical properties of soil and regulate decomposition processes. Key soil biotic groups such as N-fixing bacteria, mycorrhizal fungi, earthworms and termites areimportant regulators for nutrient cycling and good soil physico-chemical properties. The AppliedMicrobiology & Bio-fertiliser Unit (UMAB) is developing biological processes in Cameroon. A project set up by UMAB for the production and marketing of two microbial fertilisers. N-fixing bacteria mayaccelerate natural fertilisation of soil through atmospheric nitrogen fixation in the root nodules of legumessuch as groundnut. Mycorrhizal fungi are useful for soils’ natural fertilisation, improving phosphoruscycling, protecting crops against some diseases and pests or drought. Bio-fertilised crops and trees have some additional characteristics such as: a better growth and vigour, fast production, yield improvement,reduction of losses caused by diseases, pests or transplantation, products of better quality and are alsobetter adapted to poor soil conditions. Most field assessment in Oxisol, Ultisol and Vertisol showedsignificant increase in growth, yield (50 to more than 200 %), diseases tolerance and also food qualityafter using the bio-fertiliser inoculation technology (rhizobia or mycorrhiza).
Nutrient cycling by AM and legume cover crop: potential for crop production in sub-Sahara acid
oils
oject is to assist small scale farmers in these countries to improve their agricultural production
nt of Arbuscular mycorrhiza fungi resource bank and selecting beneficial micro-organisms
n important microbial resource bank of beneficial organisms was set up. The beneficial organisms are:
s
This is collaborative work between institutions in six AfNet Sub-Saharan African countries. The aim of the prsystems and profitability by introducing ecologically sound and sustainable mycorrhiza bio-fertiliser technology. The specific objectives of the project are to: 1) Initiate an arbuscular mycorrhiza fungi resource bank and select beneficial micro-organisms, 2) Assess the effectiveness of mycorrhizalinoculation using legume cover crops for biomass production, N and P cycling and soil fertility, 3)Quantify the impacts of legume cover crop on maize and legume yield. 4) Evaluate the potential ofmycorrhiza on soil microbial activities and disease tolerance. 5) Create awareness, assess socio-economicbenefits at farmers’ level. 6) Build capacity on mycorrhizal technology through training. The work will be conducted in different agro-ecosystems in six Central, East, and Southern African countries on acid soils. The project will provide post graduate training in soil biological management and sustainable agriculture.In addition, good quality mycorrhizal bio-fertiliser are expected to be mastered during the project. The research is thought to provide scientific understanding of the functioning of key soil organisms and their potential for a better crop production management and also improve capacity building. Throughparticipatory approach, awareness will be created, and farmers’ socio-economic status will be improved.In addition, reports, workshops, brochures, and policy briefs and methods for legume micro-symbiontsmanagement to sustainable soil fertility and food quality will be recommended. It is thought that networkcollaboration among scientists interested in the biology and fertility of tropical soil management will be developed.
Establishme
Amycorrhizal fungi, rhizobia, and pseudomonad. Recently a new group, phosphorus solubilising micro-organism (PSM) was added to the previous ones. The arbuscular mycorrhiza fungi (AMF) collection wasset up from more than 200 soil samples collected in diverse agro-ecological zones of Cameroon (muchmore on humid forest acidic soils). Results from systematic sampling on land use systems (forest, fallow, plantations and farm soils) showed that direct evaluation on mycorrhizal diversity from spores isgenerally an underestimation. Trapping and repetitive sampling may be the best way to obtain a good evaluation of soil diversity of AMF species. More than 230 isolates of Glomalean fungi constitute the AMF resource bank, from which only about 50 % of isolates are identified (40 species) at species level and most at genus level using morphological methods. Non identified isolates could lead to new species. Their distribution is as follows and contains 5 genus out of 6 known in the world: Glomus (73%),Gigaspora (14%), Acaulospora (6%), Scutellospora (4%), Sclerocystis (3%). The most distributed
28
species are Glomus aggregatum, Glomus clarum and Glomus versiforme. From this collection, only 22isolates were screen for their efficiency for crop improvement. In order to have a good inoculum for large scale evaluation, it is useful to follow up successive steps such as: isolates characterization (root colonisation, spore number, infectivity,..), selection (plant growth increase, P & N uptake, mycorrhizaldependancy, yield, stress and disease tolerance, competitivity) before production at pilot scale. After this step, the inoculm produced on sterile substrate must be evaluated for biomass and yield improvementunder nursery and latter on farm conditions using specific crops. Also inoculum viability and efficiency should be checked during storage (1 to 3 years) in order to assess the best storage conditions and the loss on activity during storage and time. A strategy of inoculum improvement was set up by a regular selectionof the best mixture of strains. Preliminary isolation from 16 acid soils samples originating from 8 sites and 4 provinces (out of 10 in the country) under oil palm rhizosphere provided 230 isolates of PSM. The P solubilising activity were assessed under Petri dishes but a more complete characterisation andidentification of some strains is envisaged. Most isolates are microscopic fungi and rhizobacteria(Pseudomonas, Bacillus).
Arbuscular mycorrhizal fungi studies
s one of the main research theme, advanced studies were carried out to set up a good inoculum for the p project on acid soils. Soils from natural habitat (farm, fallow
cterization from soil samples
he number of infectious propagules (MPN test) from 5 soil sites (Bafia, Douala;, Edéa-Ndupe, h variation from one site to another. This number varied from
production
his study was carried out using cowpea, leek and millet under controlled conditions. Results shown in s, the most effective isolates for root colonization for cowpea are
o have enough inoculum of known quality (increased concentration
Anutrient cycling using legume cover croand forest) in more than 85% sites studied contain less than 10 spores/g soil. In some cases, this numbermay reach 48 to > 100 spores/g in farm soils but in few cases the number can be as low as 0 to 5 spores/gsoil. AMF studies also include diversity, morphological characterization of mycorrhizal spores and roots, physiological characterization of their infectivity, viability during storage, root colonization, root growth parameters, enzymatic activities, P and N uptake, plant biomass and yield increase under nursery or farm conditions.
AMF chara
TNgaoundéré and Yaoundé) reveal a very hig0.3 for Edéa-Ndupe forest soil, 5 for Douala farm soil, 17 for Bafia fallow soil, 43 for Yaoundé farm soil and 2783 for Ngaoundéré mixed farm and cattle rearing soil. This variation was also noticed on milletroot colonization by the same soils from 25% (Edéa-Ndupe soil) to 98% (Ngaoundéré soil). Nocorrelation was found between spore number and the number of infectious propagules. Another study to establish the influence of land use system (LUS) on AMF diversity microbial biomass was done on forest,fallow, plantations and farms in humid forest zone of Cameroon. The results will be available at the endof this cropping season.
Selection and inoculum
TTable 1 indicate that out of 10 isolateGIMNV, GIME13 and GIXYC, for millet GIMNV and GCDM, for leek GIME13 and GIXYC. For Puptake, theses isolates are also the best though we noticed preference of some crops for some isolates or mixtures of two isolates. In order to select some effective isolates, a certain number of other criteria wereassessed such as spore viability and germination, acidity tolerance, competitiveness under naturalconditions and activity during storage and according to environmental factors (temperature: 4 and 25°C, storage duration: 1, 2 and 3 years).
An assessment was made under controlled conditions in order to have some significant data oninoculum production. The aim was tof spores, assess the infectivity, high activity and viability of AMF). This was done using sterilised arable soil, on 10 litter pots using 2 plant/pot of millet (Pennisetum americanum) and 50 g/pot each of 5 isolates of AMF ( Glomus clarum, Glomus hoi*, Gigaspora margarita, Glomus sp., Glomus intraradices,Scutellospora gregaria and S. heterogama), the experiment was replicated 10 times for each isolate.
29
Table 1. Response of mycorrhizal fungi inoculation on phosphorus uptake (mg/plant) and root colonization (%) on millet (Pennisetum. americanum), cowpea (Vigna. unguiculata) and leek (Allium
porum.) under nursery conditions.
LSD at 5% significance. 1Harvest 90 days after planting, 260 Harvest days after planting (5 plants/ treatment)
In order to compare the effectiveness of different inoculants (Glomus clarum, Gigaspora
margarita and Myco 4, a mixture of 6 Glomus and Gigaspora species) on the same crops, onion and shallot were used and some parameters assessed: root colonisation, P uptake, phosphatase activity and plant growth were analysed. On both crops, the inoculum made by Glomus clarum provided a good rootcolonisation and was considered as the best for plant improvement compared to the others. (Table 2).
Table 2: Response of onion (Stuttgartter giant variety)and shallot (Allium cepa) inoculation using threearbuscular mycorrhizal fungi under controlled conditions (12 weeks after planting), a) Onion, b) Shallot.
a) Onion (Stuttgartter giant variety)
Inocula Root
colonisation
(%)
Biomass
(g/plant)
Bulb weight
(g/plant)
Acid Phosphatases activity
(unit/plant root)
Control 0 7.2 3.2 1.85
Glomus clarum 80 15.5 4.3 4.94
Gigaspora margarita 60 7.8 3.3 2.40
Myco 4 mixture 20 5.1 2.1 1.49
b) Shallot (local variety)
Inocula Root
colonisation
(%)
Biomass
(g/plant)
Bulb weight
(g/plant)
Acid Phosphatases activity
(unit/plant root)
Control 0 18.1 10.9 4.29
Glomus clarum (M1) 60 40.5 30.0 4.76
Gigaspora margarita 50 27.8 21.6 4.82
Myco 4 mixture 25 16.2 8.3 3.98
Strains Cowpea 2
P uptake Root col.
Millet1
P uptake Root col.
Leek1
P uptake Root col.
GCHX 11.00 65de 35.67 71f 2.29 24c
GISM 19.00 72f 38.13 78g 1.65 15ab
GABC2 13.20 46b 24.33 58d 0.76 20bc
GCDM 15.50 53c 116.8 90h 1.36 19bc
GANM1 11.78 62d 37.42 52c 4.20 24c
GiMNV 26.50 89g 237.74 98i 4.72 32d
GiME13 14.67 85g 27.81 76fg 14.10 52f
GiXYC 13.80 85g 17.29 65e 2.35 48e
GVAM 18.70 58bd 21.75 32b 1.62 24c
GGNR 13.52 23a 30.46 19a 1.45 24c
GISM+GABC2 38.70 69ef 47.78 70f 0.69 12a
Non mycorrhizal control 3.70 0 6.80 0 0.51 0
30
So as to understand the functioning of specific isolates during the course of symbiosisestablishment using onion, an investigation was done using the 5 isolates of AM fungi (Glomus clarum,
ase activity and th were analysed. The effect of AM fungi ranged from 34% to 126 %root surface occupation increase, 17% to 86 % incr tases days
o 88 % increase Some iso tter than others and significantion was obtained face occu oot colonisatio (+ 76 %), root
93 %), acid ph y (+ 94 % (+79 %), N u %) and onion(+ 91 %).
rhizobia symb nutrition
y studies were acterisati pecies of Cro heir symbiosisobia and mycor Ngaound esults indicated ersity of native
h de of cover crop legumes on rh mycorrhiza for velopment. A p tion of t molybdenum n and rhizobia
done u n two c sites (Bokito dé). For mostass, yield gen uptake) were significantly very high in
ehen the number of native rhizobia were low in Yaoundé site (100 cells/g) compared to Bokito one 0.000 cells/g). Results show the potential of molybdenum and rhizobia to increase the grain/pod ratio
52
andmycorrhizal fungi, a synergistic effect was noticed. An excellent example is the growing of cowpea in apoor ferralitic soil where results showed that the double rhizobial and mycorrhizal inoculation (R+M+)
eatments respectively compared to the control (R-M-). Beside, R+M+ treatment gave the best pod yield(3 nt (3.28 t.ha-1), R+M- treatment (1.51 kg.ha-1) and the R-M-
25 t.ha ). Ino g cowpea bia (m e two incr pea by 6non-inoculated control.
oil fertility management may also change AM i activity, for example Stylosanthes mulcholybdenum application may increase spore number and mycorrhiza
i farm.obial resourc k of bene organisms was initiated (this include AM
P-so lising micro-organisms). AM fungi studies have provided knowledge on the ctivities and limitations on these soil organisms. Most results clearly indicated that increasing the
ficantly improve crop yields in acidic soils conditions of Cameroon. The is regularly producing AM fu re t
stored for 3 years maint iti d manuscripts out o be submitted in refereed journals for pu on. The collection of plant beneficial micro-organisms under development
the most im rtant genetic resources in C Many graduate and PhD students o-friendly approach, but s ere is a hu d to involve more farmers’
r
cphosphat plant grow
ease for acid phospha activity and after 90from 0 t for onion biomass. lates are be . A positivecorrelat between root sur pation and r n by AMFlength (+ osphatases activit ), P uptake ptake (+ 76biomass
Legume- iosis and mineral
Preliminar done on the char on of some s talaria and twith rhiz rhizal fungi from éré zone. R a rich divspecimens and a hig pendency of some species izobia andtheir de reliminary evalua he effect of applicatioinoculation was sing groundnut i ontrasting and Yaounparameters tested (nodulation, plant biom and nitroYaounde site compared to Bokito site. Molybdenum application or rhizobia inoculation was effectivw(1from % to 73 % only in Yaoundé site, while in Bokito site this ration was high for the control and the treatments (74-75).
Combining Legumes-rhizobia-AM fungiMost field experiments in Cameroon indicated that when legumes are combined with rhizobia
increases flowering precocity of cowpea by 6 days compared to the non-inoculated control (R-M-). Increase of biomass yield from inoculation was about 4, 5 and 6 times higher for R+M-, R-M+ and R+M+tr
.58 t.ha-1), followed by R-M+ treatme-1control (0.
ixture of thculatin
eased the cowwith rhizopod yield
“Cynthia T.”), my.6, 14.3 and 15.6
corrhiza (“Myco 3”) and therespectively compared to the
S Fungincorporation, manure, rhizobia and mroot colonisation of ma
In summary, aze onmicr e ban ficial
fungi, rhizobia and lubiaactivities of AMF may signilaboratory ngi for mo
es. Preparehan 6 years at pilot scale, this bio-fertiliser may be
f these results willaining its activblicati
is certainly po ameroon. post-have been trained on this ec till, th ge neeorganisations in this wo k.
31
Site 2: Niger
Biological nitrogen fixation in Banizoumbou and Gaya, Niger
15N dilution technique was used to quantify the biological nitrogen fixation of three cowpea varieties (local, TN5-78 and Dan illa) under different soil fertility conditions (Photo 1). A non-fixing (NF) cowpea variety was used as non-fixing crop. The samples have been sent to JIRCAS laboratory in Japan for massspectrophotometer analysis of 15N in order to assess the biological nitrogen fixation.
Photo 1: Cowpeavarieties in N fixation trial at
Low N fixing cowpea varietyGaya, Niger.Different cowpeavarieties havedifferent capability in N fixation.
Interaction between Water management and nutrient management in African Dry Lands
Water harvesting techniques such as the tide ridges and the Zai system combined with the use of plant nutrient could be an excellent approach for a win-win situation where the nutrient use efficiency will be increased with the capture of water and also the water use efficiency will increase with the improvementof soil fertility. This win-win situation will result in higher and sTable crop production within the Africandesert margins.
Activities were implementation very successfully in Niger, Mali, Kenya and Burkina Faso. Thiswas done by AfNet sci
High N fixing cowpea variety
entists who had received training on additional methodologies for effective interven
be highlighted in this report will be from three sites (Niger, Kenyaand Ma
tion. The field activities were implemented in Niger, Mali, Kenya and Burkina Faso using appropriate water harvesting techniques and therefore facilitated comparisons across the desert margins of the African continent. The results to
li) where this experiment had been implemented by the end of 2003 but results from Burkina Fasosite where the trial was implemented in 2004 will be available at the end of this cropping season. Plansare underway to initiate the same field trial in Senegal.
Site 1: Niger
Combining water harvesting techniques and integrated nutrient management for sustainable food
production in the Sahel
Due to the increased population pressure and the limited availability of fertile land, farmers in the desertmargins increasingly rely on marginal or even degraded land for agricultural production. The farmers
habilitate these lands with different technologies for soils and water conservation. Among these is the zai (Photo 2), an indigenous technology for land rehabilitation, which combines water harvesting bymeans of small pits and hill-placed application of organic amendments.
re
32
Photo 2: TheZai system inthe Sahel.
To study the resource use efficiency of this technique in the context of the Sahel of Niger, anexperiment was conducted at two lo are lands in a farmer field from 1999 to 2000. Inthese experiments, the effect of organic amendment type (millet straw and cattle manure (3 t ha-1) and
ater harvesting (with and without water harvesting pit) on millet grain yield, dry matter production and
(zai) we
t was conducted at two lo are lands in a farmer field from 1999 to 2000. Inthese experiments, the effect of organic amendment type (millet straw and cattle manure (3 t ha-1) and
ater harvesting (with and without water harvesting pit) on millet grain yield, dry matter production and
(zai) we
cations on degraded bcations on degraded b
wwwwater use were compared.ater use were compared.
Results showed a high effect of Zai technique on yields response and plant establishment.Plant establishment: statistical analyses showed a high effect zai on plant establishment and it’s effecton organic fertilizer applied. Average number of successful hills was 4957 per ha for the zai plots significantly different from no zai plots with 1310 hills per ha (p=0.000). There was also an effect of organic matter ap
Results showed a high effect of Zai technique on yields response and plant establishment.Plant establishment: statistical analyses showed a high effect zai on plant establishment and it’s effecton organic fertilizer applied. Average number of successful hills was 4957 per ha for the zai plots significantly different from no zai plots with 1310 hills per ha (p=0.000). There was also an effect of organic matter application (manure) on number of hills per ha whether or not water-harvesting techniques
re applied (Table 3).
Table 3: means comparison for millet hills number per ha (Duncan test)
Treatments Mean number of hills per ha
plication (manure) on number of hills per ha whether or not water-harvesting techniquesre applied (Table 3).
Table 3: means comparison for millet hills number per ha (Duncan test)
Treatments Mean number of hills per ha
No zai + no manure 1310aNo zai + with manure 3331bZai + no manure 4957cZai + with manure 7572d
P=0.000
Table 4 below shows the effect of the zai system on millet and cowpea yields. It was observed that in an intercrop, pearl millet yields were about 273 kg/ha in zai compared to only 87 kg/ha from the plots with no zai system. There was no significant difference for the cowpea yields.
33
Table 4: Pearl millet and cowpea yields as influenced by water harvesting method
Organic matter/cropping system/water conservation Zai x Manure x IntercropZai x No manure x Intercrop No Zai x Manure x IntercropNo Zai x No manure x Intercrop
438104.59269
16.715.722.612
The use of the Zai system in the Sahel has proved to be a good technology for Pearl millet production.
Site 2: Mali
is exp
-legume rotation and iii) cereal and legume intercropped (Table 5). One yearf data c
Th eriment was setup in Mali in 2003 at Siribougou, a rural village located at about 35 km west of Ségou. The main research hypothesis this project aims to test is that combining water-harvestingtechniques (Photo 3) with the effective nutrient management will result in higher efficiency of resources and will increase the profitability of the investment in water harvesting. The experimental design allowsto compare the combined effects of water and nutrient management on three cropping systems, namely i)continuous cereal, ii) cereal
ollection has just been completed.o
Photo 3: Water harvesting through the use of ridge tillagealong contour lines in Siribougou, Mali, 2003.
34
Table 5: Treatment structure at Siribougou, Mali.
ns received in this site re was no significant eff ted due to waterof water harvesting and mineral fertilizer and manure application
00g/ha of pearl millet grain yields with application of water harvesting technology. This was only noted in
whereby mineral N was applied.
Figure 4: Pearl millet grain production as influenced by water harvesting, manure and mineral fertilizer application at SIRIBOUGOU, Mali in 2003.
The control treatment gave the lowest pearl millet grain yield (about 400 kg/ha). In plots whichhad no manure, there was response to N application regardless of whether there was water harvesting or
o. DescriptionTreatment n
1 Cereal + P + N
Due to the excessive rai , the ect noharvesting. Nonetheless, the integration proved superior in increasing millet grain yields in Mali (Figure 4). There was an increase of about 2kthe treatment
2 Cereal + P – N
Cereal - P – N
Cereal + P + N0
Cereal + P + N1
Cereal + P+ N2
Cereal + P+ N3
Cereal + Leg +P + N
Cereal + Leg + P –
Legume + P + N
Legume - P – N
3
4
5
6
7
8
9 N
10
11 Legume + P – N
12
35
not. With water harvesting and manure application, there was no N response noted. However, millet yieldresponse to N was observed in plots without water harvesting.
Pearl millet grain yield ob intercrop with beans was about 800 kg/ha with water harvesting while yield without water harvesting was about 600 kg/ha (Figure 5). This was only true with manure and mineral fertilizer appli
on beans as influenced by watern 2003.
Bean grain yield in an intercrop with pearl millet was also influenced by water harvesting (Figure 6). In the absence of mineral nitrogen, the yield from plots where water harvesting was about 1043 kg/hawhile only 709 kg/ha was obtained from plots where no water harvesting was practiced. This was onlytrue with the manure plots. There was no significant difference observed between water harvesting and nowater harvesting in plots which did not receive manure.
igure 6: Bean grain production in an intercrop with pearl millet as influenced by water harvesting, manure and mineral fertilizer applications at SIRIBOUGOU, Mali in 2003.
tained from an
cation.
Figure 5: Pearl millet grain production in aharvesting, manure and mineral fertilizer applications at SIRIBOUGOU, Mali i
n intercrop with comm
F
36
Figure 7: Bean grain production as influenced by water harvesting, manure and mineral fertilizer 3.applications at SIRIBOUGOU, Mali in 200
The application of manure coupled with water harvesting and mineral fertilizer application gavethe highest bean grain yield (Figure 7). This was about 1428 kg/ha compared to 962 kg/ha obtained fromlots which received manure and mineral fertilizer but no water harvesting. p
Although water harvesting technologies improved on the grain yields of both pearl millet andbeans, it could be noted from these preliminary results that the inclusion of external inputs was ineviTable in this region.
Site 3: Kenya
This study was started in the semi-arid areas of Makueni district in eastern Kenya during the long rains (LR) of 2003. The semi-arid area in Makueni district is in agro-ecologicqal zones (AEZ) 5 (Jaetzold andSchmidt, 1983). Rainfall is bi-modal and, as is typical of semi-arid areas, it is low and erratic. The shortrains (October to January) are generally have more rainfall and are more reliable than the long rains (March to June). Temperatures are high giving rise to high evapo-transpiration.
Experimental design and treatments
A split-split-split plot experimental design was used with water harvesting vs conventional tillage as themain treatments; and manure vs no manure application as the sub-plots. The sub-plots were split intothree crop management systems i.e. (1) Legume-cereal rotation, (2) legume-cereal intercrop and (3) continuous cereal. In each crop management system different fertilizer treatments was applied as indicated below;
Tied-ridges was used as the water harvesting method. Ridges (30 cm high) and ties (cross ridges, 20 cm high) was constructed using a oxen driven ridger to create a series of basins for storing water. The spacing of the ridges was 90 cm and the cross ridges were at 2.5m interval.
Goat manure at a rate of 5tha-1 was applied in the planting holes. Fertilizer was applied at 0 and40 kg P ha-1 in treatments having P; and 0, 40, 80 and 120 kg N ha-1 for plots receiving nitrogen. Tripple superphosphate (TSP) and Calcium ammonium nitrates (CAN) fertilizers were used as source of P and N respectively. Each treatment was replicated four times in a completely randomized block design.
37
The individual plot size ws 5 m long and 5 m wide. Maize (Katumani composite B) and cowpea 80) was planted on 9-10th April 2003 at 90 x 30 cm spacing in pure stands. Maize and cowpea was
Topsoil samples were taken at the start of the experiment from 0-30 cm depth at the main plot level for organic C, total N, available P, pH and texture determination. Weeding was done twice in theseason. Thinning was done 10-11th June 2003 (60 days after planting) to a single plant per hill. During the thinning, three cowpea and two thinned maize plants were sampled for dry biomass determination.Harvesting was done on 12-15th August 2003 (from a 3x1.8 m2 area at the middle of the plot) and plant samples taken for dry matter and yield determination.
From the general observation during germination period, it was noted that germination in tied-ridges appeared better than in plots where there were no tied ridges (Photo 4).
ertilizer application, thereas no significant effect of water harvesting on maize grain yield in the Kenyan site (Figure 8). The
h water harvesting was about 1.7 – 2.7 t/ha while in plots where
(Kintercropped in the same row but alternating planting holes.
Unlike in Mali where pearl millet responded to water harvesting and mineral f
No ridging
Ridging
RidgingPhoto 4: Use of tied ridges in Kiboko, Kenya.
waverage maize grain yield obtained witthere was no water harvesting the yiled ranged between 1.6 – 2.9 t/ha. This could be attributed to the relatively high rainfall received during the study period. The application of manure did not have any marked effect on maize grain yields in this site too. For plots which received manure, application of mineral N fertilizer beyond 80 kg N/ha seemed to reduce maize grain yield.
38
No water harvesting
Water harvesting3.0
3.5
Figure 8. Effect of water harvesting, manure and mineral ferti grain yield at Kiboko, Kenya 2003 rainy season.
Site 4: Burkina Faso
grain yield at Kiboko, Kenya 2003 rainy season.
Site 4: Burkina Faso
lizer application on maizezer application on maize
Activities in this site were initiated in 2004 and the data is not yet analyzed. This will be available at theend of this cropping season.
In summary, it was noted that in Niger, the proposed methodologies and approaches in soilfertility management are well appreciated by both farmers and NARES scientists in the Sahel. The use ofthe zai technology was a success story in this particular site. This technology is combined with the use ofplant nutrient situation where the nutrient use efficiency will be increased with the capture of water and also the water use efficiency will increase with the improvement of soil fertility. This win-win situation will result in higher and sTable crop production. In Mali the use of ridge tillage alongcontour lines proved to be superior to farmer practice and this technology will be tested further in on-farm trials. Although the use of tied ridges was noted to be the best technology for the drier areas in Kenya,this was not quite conclusive because the trial was affected by unevenly distributed rains received during the growing period. These results will be validated through the second year data. Activities in BurkinaFaso were begun in 2004 and analysis is yet to be concluded. These results will be available at the end of this cropping season.
TSBFI-Latin America
Published Work
The impact of soil organisms on soil functioning under neotropical pastures: a case study of a
opical anecic earthworm species
to create a win-win
tr
J.J. Jiménez1 and T. Decaëns2
1Centro Internacional de Agricultura Tropical (CIAT), AA.6713, Cali, Colombia2Laboratoire d’Ecologie, UFR Sciences et Techniques, Université de Rouen, F-76821 Mont Saint Aignan
Martiodrilus n. sp. (Oligochaeta, Glossoscolecidae) is a large native earthworm from the natural savannas of the Eastern Plains of Colombia. The description of the main biological, ecological and functional
0.0
Trt4 Trt5 Trt6 Trt7 Trt4 Trt5 Trt6
0.5
1.0
1.5
2.0
2.5
Trt7
yie
ld (
t/h
a
+manure -manure
Treatment
nM
aiz
e g
rai
39
attributes of this species in a natural savanna and several introduced pastures at the Carimagua ResearchStation (320 km east from Villavicencio) was the main objective in this study. Density and biomass ofthis species were significantly much higher in the introduced pastures compared with the savanna
(ANNOVA, P 0.01). Evidence of vertical migration during the year was observed, while it is active inthe topsoil during the beginning of the rainy season, it enters in a true diapause to withstand adverse environmental conditions before the onset of the dry period, being adults the last to enter into this phase(after reproduction period). Martiodrilus n. sp. seemed to select food substrates with high organiccontents since casts produced in the two systems had significantly higher total C and total N contents thanthe bulk soil. Besides, C content also increased significantly during ageing of casts (+100%), possiblybecause of CO2 fixation processes, accumulation of dead roots and/or macrofaunal activities. The effectsof earthworm activities on soil and cast seed banks were revealed in another experiment. The compositionof the above standing vegetation was relatively closer to that of the cast seed bank than that of the soilseed bank. The results obtained in this study support the general knowledge of how earthworms can affectsoil fertility and plant growth. Martiodrilus n. sp., through the production of casts affects the availability and nature of both the spatial and trophic resource in soil. This species certainly belongs to the functional group of “ecosystem engineers”, as it affects the availability of some resources for other organisms through the production of physical biostructures. The next step in research should be directed now to test whether Martiodrilus n. sp. is a keystone species within the soil community or not.
nities in permanent pastures derived from tropical forest or savanna
. Decaëns1, J.J. Jiménez2, E. Barros3, A. Chauvel 4, E. Blanchart5, C. Fragoso6, P. Lavelle4
a Tropical (CIAT), AA.6713, Cali, Colombia
478, 69011-970, Manaus AM, Brazil
6
reased macrofaunal activity with a high taxonomic diversity is expected to have y of pastures in Colombian savannas. In the Amazon basin, slashing
t for intensive pasture establishment resulted in more dramatic effects on nativeic diversity was particularly strongly affected. Native earthworm species were
t the expanse of exotic peregrine species like, e.g. Pontoscolex corethrurus. These
d on the sustainability of agropastoral systems in this area.
Soil macrofaunal commu
T1Laboratoire d’Ecologie, UPRES-EA 1293, UFR Sinces et Techniques, Université de Rouen, F-76821
Mont Saint Aignan Cedex, France2Centro Internacional de Agricultur3INPA/IRD-Ecología, CP 4Laboratoire d’Ecologie des Sols Tropicaux, IRD, 32 Av. H. Varagnat, 93143 Bondy Cedex, France 5IRD (Institut de Recherche pour le Développement), Laboratoire MOST, BP 64501, 34394 Montpellier
Cedex 5, France
Instituto de Ecología, km 2.5 Antigua Carretera a Coatepec, Xalapa 91000, Veracruz, Mexico
Soil macrofauna are sensitive to land use changes and this may have implications to soil functioning. Theimpact of the conversion of native ecosystems into extensive or intensive pastures on soil macrofaunawere assessed with a standardized methodology in two neotropical phytogeographical regions, i.e. atropical savanna area (Eastern Plains of Colombia) and a tropical rain forest area (Brazilian Amazon). Inthe savanna area, extensive cattle ranching only led to a slight enhancement of earthworm populations andto short-term fire-induced decreases of macrofaunal density. In intensive pastures, the initial taxonomicrichness and composition of soil macrofauna were maintained, while native earthworm biomass was strongly increased. This may be explained by the similar mesologic conditions between these systems(similar vegetation structure) and by the higher quality of the organic inputs in the pastures (roots, litter and cattle faeces). Incpositive impacts on the sustainabilitand burning of the foresmacrofauna. Taxonomlargely depleted aresults are probably bound to the deep environmental changes that follow the conversion of forest into grassland ecosystems. Such modifications of macrofaunal communities are known to have potential negative effects on soil functioning an
40
Condiciones hidrofísicas de suelos con alta saturación de magnesio en el Valle del Cauca, Colombia
efficient. From thisharacterization it is concluded that these soils, have constraints for crop production and must be managed
aterr root growth,
olombia
, T.J. Sampayo
onal de Agricultura Tropical (CIAT), AA.6713, Cali, Colombia
a, Facultad de Ingeniería. pp.39-50
(Hydrophysical conditions of soils with high magnesium saturation in the Cauca Valley of
Colombia)A. Torrente1, A. García-Ocampo2, C.A. Escobar2, E. Amézquita3, T.J. Sampayo4
1Student PhD, Ciencias Agropecuarias, Universidad Nacional de Colombia, Sede-Palmira2Associate Professors, Universidad Nacional de Colombia, Sede Palmira.3Centro Internacional de Agricultura Tropical (CIAT), AA.6713, Cali, Colombia4Consultant
Acta Agronómica 52(1-4): 29-37(2004)
In Cauca Valley of Colombia, there are 116,872 hectares of soils in which the dominant ion in the cationexchange capacity (>20 cmol(+) kg-1) is Mg+2 (>40%). The soils are Vertisols. High Mg++ saturation maycauses marked negative effects in the soil properties that are related to plant responses and cropproduction. The purpose of this study was to evaluate and characterize soil physical conditions in magnesic soils. It was found that the soils (dominated by vemiculites and esmectites) presented thefollowing general physical characteristics: clay content higher than 55%, plasticity index higher than45%, COEL index higher than 0.10%, very high bulk density (>1.7 Mg.m-3), and very low total porosity(<30%). They presented massive soil structure or it was very weak. From the point of view of water flow they showed great constraints. Basic infiltration varied from 1.19 to 0.34 cm.h-1, saturated hydraulic conductivity from 0.18 to 0.44 cm.h-1, sorptivity from 0.025-0.084 cm.S-0.05, water pressure for air entryvaried from 4.7 to 27.7 cm. The non-saturated hydraulic conductivity can be represented by an equationof the following form: ae0.05h, were h=matric potential and a is a soil cocto increase total porosity and macroporosity. If this is achieved it is possible to improve soil winfiltration, soil drainage and soil aeration, therefore, developing a better environment fowhich in turn will improve the general soil condition and its productivity.
Volumetric changes in magnesic soils as they dry in the Cauca River Valley, C4A. Trujillo1, A. García-Ocampo2, E. Amézquita3, C.A. Escobar 3
1Ph. D. Student, Ciencias Agropecuarias, Universidad Nacional de Colombia, Palmir, Colombiaa 2Associate Professors, Universidad Nacional de Colombia, Palmira, Colombia 3Centro Internaci4Consultant
Ingeniería y Región #3 – Editorial Universidad Surcolombian
An extensive area of loamy soils has been recognized in the Cauca River Valley to have high magnesiumsaturation values. They are called “Magnesic Soils”. These soils are of special interest because they are being used for intensive agricultural production. They require previous knowledge of their behaviour to define the soil management practices that have to be used in order to avoid degradation and to increase productivity. The purpose of this study was to evaluate the physical characteristics of these soils inrelation to changes in soil volume as they are getting drier. Thirteen soils profiles were selected, described and sampled for the study. The changes in soil volume of core samples taken in cylinders of knownvolume, were determined under laboratory controlled conditions as soil dried. The following contraction
indices were determined: specific volume ( ), specific volume full of air (P), moisture content ( ), normalshrinkage (n) and residual shrinkage (r). Soil shrinkage varied from 0.44 m3 Mg-1 to 0.27 m3 Mg-1,depending on the topographic position, with higher values at the flat position. In general, it was found that there was a volume reduction of around 28% as the soil dried from saturation to a suction of 1500 MPa.These volume changes were directly associated to clay content (r=0.53) and initial bulk density (r=0.52).Volume changes were higher at low water suctions. The slope of the normal shrinkage varied from 1.33to 0.63 and that of the residual shrinkage from –0.83 to –0.50, depending on Mg++ content. There was astrong association between Mg++ and the presence of esmectites and vemiculites. The change in soil volume as it dries, should be taken into account for developing soil management practices.
41
Root Distribution and Nutrient Uptake in Crop-forage Systems on Andean Hillsides
Q. Zhiping1, I. M. Rao2, J. Ricaurte2, E. Amezquita2, J. I. Sanz2 and P. C. Kerridge2
1Tropical Field Crops and Animal Husbandry Research Institute, Chinese Academy of Tropical
2
s on hillsides couldt effects on nutrient acquisition and plant growth as well as on soil loss. A long-term field
e Andean hillsides region of Cauca, Colombia. Soils at the site
rson and B. R. Singh Cali, Colombia
pical cropping systems.
eedings No. 114: 126-134. Australian Center for International Agricultural Research
M and soil Pould be more effective for detecting the impact of planted fallows on improving soil fertility than the
Centro Internacional de Agricultura Tropical (CIAT), A.A. 6713, Cali, Colombia.
Journal of Sustainable Agriculture 23 (4): 39-50 (2004)
Root growth and distribution of crop and forage components of production systemhave importanexperiment was established in 1994 in thare medium to fine textured Oxic Dystropepts derived from volcanic-ash deposits. Four treatments,cassava monocrop, cassava + cover legumes intercrop, elephant grass pasture, and imperial grass pasture, were selected to determine differences in dry matter partitioning, leaf area index, nutrient composition,root distribution (0-80 cm soil depth), nutrient acquisition and soil loss. Root biomass of the cassava + cover legumes intercrop was 44% greater than that of the cassava monocrop. The presence of coverlegumes not only reduced soil erosion but also improved potassium acquisition by cassava. Among the two pastures, elephant grass pasture had greater root biomass (9.3 t/ha) than the imperial grass (4.2 t/ha). The greater root length density (per unit soil volume) of the former contributed to superior acquisition of nitrogen, phosphorus, potassium and calcium from soil. In addition, the abundance of very fine roots in elephant grass pastures in the topsoil layers reduced the loss of soil from the steep slopes. These resultsindicate that (i) the presence of cover legumes can improve potassium acquisition by cassava; and (ii) elephant grass can be used as an effective grass barrier to reduce soil erosion in Andean hillsides.
Soil phosphorus dynamics, acquisition and cycling in crop-pasture-fallow systems in low fertility
tropical soils of Latin America
I. M. Rao1, E. Barrios1, E. Amézquita1, D. K. Friesen2, R. Thomas3, A. Obe 4 5
1TSBF Institute, CIAT, A. A. 6713,2IFDC-CIMMYT, P.O. Box 25171, Nairobi, Kenya (formerly CIAT-IFDC, Colombia) 3ICARDA, P. O. Box 5466, Aleppo, Syria (formerly CIAT, Colombia)4Swiss Federal Institute of Technology (ETH), Zürich, Switzerland 5Agricultural University of Norway, P. O. Box 5028, Aas, Norway
In: R. J. Delve and M. E. Probert (eds) Modelling nutrient management in tro
ACIAR Proc
(ACIAR), Canberra, Australia.
Knowledge of the P dynamics in the soil/plant system and especially of the short- and long-term fate of P fertilizer in relation to different management practices is essential for the sustainable management of tropical agroecosystems. Since 1993, CIAT researchers in collaboration with NARS partners haveconducted long-term field studies on soil P dynamics, acquisition and cycling in crop-pasture-fallowsystems of low fertility tropical soils of the savannas and hillsides agroecosystems of Latin America. Theprogress made from these long-term studies that were partially supported by special project funds fromACIAR (LWR2/1999/03) is described in this article. In tropical savannas in the Llanos of Colombia, soil P dynamics, acquisition and cycling were quantified in cereal-legume rotations (Maize-soybean or rice-cowpea) and ley pasture systems. Measurements of soil P fractions indicated that applied P movespreferentially into labile inorganic P pools, and then only slowly via biomass production and microbesinto organic P pools under both introduced pastures and crop rotations. Field studies conducted toquantify the residual effectiveness of P fertilizer inputs in crop rotations in terms of both crop growth response and labile P pool sizes indicated that soluble P applications to oxisols of Colombia remainavailable for periods of time which are much longer than expected for “high P-fixing”soils, such as the oxisols of Brazilian Cerrados. In Andean hillsides of Colombia, the impact of short-term planted fallowsto restore soil fertility in N and P deficient soils by enhancing nutrient recycling through the provision ofsoil organic matter (SOM) was investigated. Results indicated that the fractionation of SOc
42
conventional soil analysis methods. Litterbag field studies contributed to characterization of the rate ofserve as biofertilizers.
validation of APSIM model.
ts regenerating from degraded pastures in
o 50%f primary forest biomass in the region. Wood N and P concentrations decreased with forest age.
Although soil stocks of exchangeable Ca (207.0 ± 23.7 kg/ha) and soil to
ge (117.8 kg ha yr ), probably due to N fixation,ranged between 42
al C accrual (7.04 Mg C ha-1 yr-1) in reported in other studies. Tropical SFr C and rebuild total nutrient capital
for long-term C gains; however, soil nutrient deficits may limit future
decomposition and nutrient release from twelve different plant materials that couldThe data sets from these long-term experiments from the tropical savannas and hillsides agroecosystemsof Latin America could be valuable for further testing and
Carbon and nutrient accumulation in secondary fores
central Amazônia, Brazil
T.R. Feldpausch1 , M.A. Rondon2 E.C.M. Fernandes1 , S. J. Riha3 and E. Wandelli4
1Department of Crop and Soil Sciences, Cornell University, Ithaca, NY, 14853, USA2Centro Internacional de Agricultura Tropical, Apdo. Aéreo 6713, Cali, Columbia 3Department of Earth and Atmospheric Sciences, Cornell University, Ithaca, NY, 14853 USA 4Embrapa Amazônia Ocidental, C.P. 319, Manaus, AM, 69.000, Brazil
Ecological Applications 14: S164-S176 (2004)
Over the past three decades, large expanses of forest in the Amazon Basin were converted to pasture, many of which later degraded to woody fallows and were abandoned. While the majority of tropicalsecondary forest (SF) studies have examined post-deforestation or post-agricultural succession, weexamined post-pasture forest recovery in ten forests ranging in age from 0 to 14 yrs since abandonment.We measured aboveground biomass and soil nutrients to 45 cm depth, and computed total site C andnutrient stocks to gain an understanding of the dynamics of nutrient and C buildup in regenerating SF incentral Amazônia. Aboveground biomass accrual was rapid, 11.0 Mg ha-1 yr-1, in these young SF. After 12 to 14 yrs, they accumulated up to 128.1 Mg/ha of dry aboveground biomass, equivalent to 25 toAboveground P and Ca stocks accumulated at a rate of 2.4 and 42.9 kg ha-1 yr-1; extracTable soil P stocks declined as forest age increased.extracTable P (8.3 ± 1.5 kg/ha) were low in the first 45 cm, both were rapidly translocated from
-1 -1plant pools. Soil N stocks increased with forest aatmospheric deposition, and/or subsoil mining. Total soil C storage to 45 cm depthand 84 Mg/ha, with the first 15 cm storing 40 to 45% of the total. Totboth aboveground and soil pools was similar or higher than valuesregrowing on lightly to moderately-used pasture rapidly sequestefollowing pasture abandonment. Translocation of some nutrients from deep soil (>45 cm depth) may be important to sustaining productivity and continuing biomass accumulation in these forests. The soil poolrepresents the greatest potentialproductivity.
Completed Work
Effects of sample post harvest treatment on aerobic decomposition and anaerobic in-vitro digestion
of tropical legumes with contrasting quality
K Tscherning 123, E Barrios 2, C Lascano 1, M Peters a and R Schultze-Kraft 3
1 Tropical Forages Project, Centro Internacional de Agricultura Tropical (CIAT), AA 6713, Cali,
Colombia2 Tropical Soil Biology and Fertility (TSBF) Institute - (CIAT), AA 6713, Cali, Colombia3 University of Hohenheim, Stuttgart, Germany
The aerobic decomposition of plant materials is a slow process and thus methods used to estimatedegradation rates on the soil are time and resource consuming. Earlier studies have shown highlysignificant correlations between in-vitro dry matter digestibility (IVDMD) and plant decomposition under field conditions. The authors suggested the usefulness of applying time saving methods used to assessforage quality for ruminants to predict decomposition of plant material on the soil. Such a rapid
43
laboratory “test” could be useful for screening germplasm with potential contribution to soilimprovement, to reduce costs and contribute to higher research efficiency.
Three woody tropical legumes with contrasting qualities were used: Indigofera zollingeriana Miq. ndigofera), Cratylia argentea Benth. (Cratylia) and Calliandra houstoniana (Mill.) Stan. var.
order to estimate extents and rates of aerobic degradation in litterbags on the eriment during 144 h
me species.
(Icalothyrsus (Meiss.) Barn. CIAT 20400 (Calliandra) were used either fresh, freeze-dried, frozen, oven-dried (60 oC) or air-dried insoil during 140 days and anaerobic degradation in an in- vitro gas production exp(Table 6).
Table 6. Effect of post harvest treatments on initial chemical characteristics of the three leguValues are in % of mean dry weights.
Plant Post harvestC N ND sd AD sd IAD sd sC sd bC sd PP sd ligni Sd
Results showed, that aerobic decomposition rates of leaf tissues were highest for Indigofera (k=0.013 day-
1), followed by Cratylia (k=0.004 day-1) and Calliandra (k=0.002 day-1). Gas production rates evaluatedunder anaerobic conditions, were highest for Indigofera (k=0.086 h-1), intermediate for Cratylia (k=0.062
-1) and lowest for Calliandra (k= 0.025 h-1). Decomposition and gas production rates differed (p<0.001)ces between post harvest treatments were not statistically significant (p>0.05).
position was highest for Indigofera (82.5%, w/w), followed by Cratylia (44.6%) andalliandra (26.4%). The extent of gas production was highest for Indigofera (218.8 ml), followed by
. Highest gas production was
hamong species. DifferenThe extent of decomCCratylia (170.1 ml) and Calliandra (80.1 ml). Extent of decomposition and extent of gas production were significantly different (p<0.001) among species. In contrast to the extent of decomposition, the extent of gas production was affected (p<0.001) by sample post harvest treatmentsobserved for the fresh and frozen treatments (Figure 9).
44
time (hours)
Indigofera Cratylia Calliandra
Figure 9. a) Percentage of initial dry weight remaining of Indigofera, Cratylia and Calliandra residues as affected by 5 different post harvest treatments during 140 days (aerobic methods) of decomposition in a greenhouse litterbag experiment, b) extent of gas production (ml) of Indigofera, Cratylia and Calliandra residues as affected by 5 different post harvest treatments during 144 h (anaerobic method) of incubationin a gas production experiment
The forage quality parameters that best correlated with aerobic and anaerobic degradation werelignin+bound condensed tannins, lignin+total condens(IADF) and in-vitro dry matter digestibility (IVDMD). Results s
ed tannins/N, indigestible acid detergent fibre howed that differences in decomposition
and digestibility were more related to intrinsic plant quality parameters than to changes in tissue quality induced by post harvest treatments. In addition, we found that rate of aerobic degradation of legumeleaves on the soil was highly correlated to IVDMD (r>0.80, p<0.001) and gas production (r=0.53,p<0.001) (Table 7).
0 20 40 60 80 100 120 140
time (days)
0 20 40 60 80 100 120 140
time (days)
0 20 40 60 80 100 120 140
time (days)
0 20 40 60 80 100 120 140
time (hours)
0 20 40 6 120 140
100
20
40
60
80
dry
mat
ter
loss
(%
)
0
gas
pro
du
ctio
n (
ml)
0
50
150
100
200
250
300
0 80 100
time (ho )
0 20 40 60 80 100 120 140
urs
fresh
freeze-dried
frozen
oven-dried
air-dried
45
Table 7. Pearson correlation coefficients (r) between initial plant tissue quality and extent and rate of decomposition and gas production.
Decomposition1 Gas production1Plant tissue quality
*, **, *** = probabilities associated to Pearson correlation coefficients at p<0.05, p<0.01 and p<0.001, respectively.n.s. = p>0.051/ In parenthesis: number of observations, NDF=neutral detergent fibre, ADIF=acid detergent fibre, bCT=bound condensedtannins, IADF=indigestible acid detergent fibre, PP=polyphenols, IVDM=in vitro dry matter digestibility, CT=condensedtannins, N=nitrogen
These results indicate that plant measurements (IADF, IVDMD and gas production) used toassess forage quality in animal nutrition studies are more rapid and resource saving predictors for aerobic decomposition of tropical legumes than initial plant quality ratios (lignin+polyphenols/N and lignin+totalcondensed tannins/N) commonly used by many researchers. Furthermore, this study confirms the potential usefulness of IVDMD for screening tropical legumes for soil fertility management.
Soil crusting and sealing in Andean cropping systems: physical and chemical factors
C. Thierfelder1, E. Amézquita2 and K. Stahr1
1University of Hohenheim, Department of Soil Science and Land Evaluation (310); Emil-Woff-Str 27, D-
3 Stuttgart, Germany
de Agricultura Tropical (CIAT), A.A. 6713 Cali, Colombia
h chemical agents; and 3) both physico-chemical processes.
ents of penetration resistance were made in eight cassava-based cropping systemsnd one bare fallow treatment on 27 Erosion Experimental Plots according to Wischmeier and Smith
(1978) on slopes with an inclination of 7 to 13%. The plots had been in use since 1986 through a consecutive research project. They were designed as a completely randomized block with three repetitions. The randomized block design was selected to manage local soil heterogeneity
70592Centro InternacionalSoil erosion, run-off and its problematic consequences have been recognized by farmers in Latin America, but knowledge and means to combat this phenomenon are unavailable. Until now, soil crustingand sealing has received minimal scientific attention in the Andean zone of South America. Although the contribution of soil crusting and sealing to soil erosion are widely accepted, there have been longdiscussions of the causes such as 1) the splash impact of raindrops coupled with low aggregate stability;2) the dispersion of clays throug
Field research was conducted in Santander de Quilichao at the CIAT Research Station, Department of Cauca in southwestern Colombia (3°6'N, 76°31'W, 990 m.a.s.l). The area is characterizedby moderate to high erosion potentials due to its undulating relief with some steeper slopes, a strongeffect of soil and crop management, and due to an extreme climatic impact (mean annual rainfall: 1756mm, rain intensity: up to 330 mm h-1). Trials were installed in 1986 on an amorphous, isohyperthermicoxic Dystropept (US soil taxonomy), which is a ferralic Cambisol according to the WRB. It is developed from fluvially translocated, weathered volcanic ashes from the local volcanoes Puracé and Sotará.
The measurema
46
All nine treatments were grouped into three categories to evaluate the specific research questions, such as e impact of chicken manure on soil crusting, the influence of conservation systems on structural
effects of dif ctices on s il structure ility:
1. The manure gro uded cass t ha-1 chic e (T5), cassava 4 t ha-1 chicken manure (T2), and cassava monoculture (T3).
conservation group a chicken mhamaechrista ro ), a tio (
illage gro are ca a till cassavaintensive tillage (
of Penet d Torv emen 200 significantc tic influence on p stan r str oil enetrationr shear stre re w t, w dried outpenetration resistance and shear strength som his observation led to the d f four distinct ds h d -be ay strong
2000, theasons followed exactly this long-term trend whereas in 2001, the rain amount was
rthernces were noted. T6 (conservation group) presented a significantly higher shear strength
y in
he
ents with the
lower K was found in
om T8 and T1.
thdevelopment, and the ferent tillage pra o and system stab
up incl ava 8 ken manur
2. The C
consisted of cassava 4 t htundifolia (T7
-1 anure (Vetiver) (T6), cassava +T8).nd cassava rota n
3. The t up included b fallow (T1), ss va minimum age (T4), andT9).
Results rometer an ane measur ts in 2000 and 1 showed alima enetration resi ce and shea ength. In wet s conditions, pesistance and ngth generally mained at a lo
increased inlee
vel. In contrastreatments. T
hen the soil
ivision o climatic perio (January-Marc ry season, March ginning of Mrainy season, May-September strong dry season, September-December rainy season). Inclimatic seextraordinary low especially in the period from March to May. Concerning shear strength in 2000, T5 was significantly different in the rainy season from T2 but not from T3. In the dry season no fuignificant differes
onl the rainy season. The tillage group was characterized by the significantly highest shear strength of T4 followed by T1 in the rainy and dry season.
No significant differences were found in the year 2000 in the major aggregate classes (>6.3 mmand >2 mm) and in the three minor aggregate classes (>0.25 mm, >0.125 mm, and <0.125 mm). In theaggregate class >4 mm, the T3 and T1 treatments contained a significantly lower amount of aggregates
an T4. In the class >1 mm, a significant difference between T4 and T9 as well as T1 was found. In tthclass >0.5 mm, T3 presented significantly lower amounts of aggregates than T4.
y highest aggregate stability in the biggest aggregate class In 2000, T4 showed the significantl>6.3 mm (55.5 %) compared to the other treatments, with the exception of T5, T8, and T6.
Results of soil erosion and run-off obtained in both years revealed significant differences in 2000between treatments. T1 generated the significantly highest amounts of run-off in all treatmexception of T9 and T4. The run-off rate was also the highest in T1. Similar to run-off, was soil erosion higher in 2000 than in 2001 due to more erosive rainfalls in the year 2000 and due to lower precipitationin 2001. The highest amount of soil erosion was found in T1. It presented such a marked disparity to the other results that it had to be excluded from statistical analysis as normality criterion could not be reached.
In the year 2000, highest total nitrogen (N) was found in T4, whereas T1 revealed thesignificantly lowest N content. Highest potassium (K) was found in T4 and T2. Significantly
T8 and T3 and the lowest amount of K was found in T1. The analysis of calcium (Ca) showedthe highest rate in T4, followed by T2 and T8. The lowest Ca was found in T1. Similar results wereobtained for magnesium (Mg). The significantly highest amounts of aluminum (Al) were found in T1 and the lowest in T4. Iron (Fe) presented no real differences, and manganese (Mn) was significantly highest inT4, T2, and T5. In contrast, the significantly lowest Mn was found in T1. T4 presented the highest N content and was significantly different from T5. The highest soluble P was found in T1 which was significantly different from T3. Regarding soluble K, it was found out that T4 differed notably fr
Similar results were found in Ca and Mg where T4 showed markedly higher values than T1. The investigation of soil reaction revealed significant differences in most treatments with the exception of T5 and T8. The lowest pH was measured in T1 (pH 3.8) followed by T3, T5 and T8, T2 and finally T4 (pH5.2). The pH-values were higher in the cultivated treatments due to the application of dolomitic lime.Exceptional results showed T3 which presented only a pH of 4.3.
47
The influence of soil organic matter (SOM) on the development of soil crusting and sealing has
nic matterdepmat hSOM w
resistan ents. The overall EC was highest inT4within t ts, however T5 was significantly different from T8. Lowest EC was found in T1 (0
re treatments did not differ significantly from T4 in soil aggrega
ng systems towards the
sequence soil
l
tion was inversely correlated with soil
widely been investigated. Statistical analysis over the course of two years of investigation revealed a significantly lower SOM-content in T1. The mean annual soil loss of about 180 t ha-1 during the researchperiod from 1987 to 2001, and high surface run-off is the reason for this accelerated soil orga
letion. In contrast, T4, T8, and T7 maintained soil fertility owing to the contribution of organic erial, i.e. mulch, grass roots and legume parts, to t e SOM-pool. Therefore, the significantly highest
as measured in T4 (7,1 %) and T8 (7.0).
Results showed a significant correlation between Electrical Conductivity (EC) and penetration ce and shear strength, as well as some elements in the treatm
(0.61 mS cm-1), being significantly different from T5 (0.38 mS cm-1). No real differences were foundhe chicken manure plo.20 mS cm-1) followed by T3 (0.26 mS cm-1). A strong correlation between penetration resistance
and shear strength was found in February 2001 and in August 2001. Shear strength correlation to EC was higher in Feb 2001 which points to the importance of the date of application of fertilizers and manures forthe degree of correlation.
Results on soil physical characteristics showed marked effects of chicken manure on the croppingsystems. T5 and T6 demonstrated structural changes in both years. In the rainy seasons there were no realpenetration restrictions. In contrast, its superficial soil structure altered in both dry seasons, and changed from a well structured soil to a superficially crusted soil. This phenomenon can be attributed to the effects of chemical dispersion on the soil structure which led to a destabilization of the superficial aggregates dueto isomorphous replacement of elements of this nutrient rich manure. The development of soil crustingand sealing could be clearly distinguished from natural soil hardening due to aggregation by fieldobservations in both treatments. Chicken manu
tion but revealed notably lower amounts of aggregates in the class >6.3 mm and higher amountsof aggregates in the classes >1 mm, >0.5 mm and > 0.25 mm. The positive soil effects of chicken manureon soil fertility are counteracted by extreme structural degradation.Conclusions
Investigating the physical and chemical predisposition of Andean croppidevelopment of soil crusts and seals revealed that excessive organic manuring and tillagepractices negatively affected the soil’s physical and chemical status. As a concrusting and sealing occurred in these treatments.
Conservative soil treatments like minimum tillage and crop rotations improved the physical soilstructure and chemical fertility. Consequently, soil crusting and sealing was not observed in these treatments. Soil erosion as a final monitor was strongly reduced. Therefore, these treatments should be strongly recommended to the farmers by local extensionists.
There is still a need for additional research to find out appropriate amounts of organic and minerafertilizers on Andean hillside farming systems. Soil crusts and seals developed on steeper slopes in this research area should also be an important factor to be investigated in order to minimizesoil degradation in this area.
Wetting and drying processes in two textural savanna Oxisols in the Colombia Llanos
P. Hoyos, E. Amézquita and D.L. Molina 1Tropical Soil Biology and Fertility (TSBF) Institute of CIAT
It is generally believed that Oxisols have excellent structural conditions that give them a high infiltration capacity and good drainage. However, different studies conducted in the flat Colombian Savannas (Llanos) have shown that these soils after being disturbed by machinery lose part of their infiltration capacity, increase runoff, and lose nutrients. A study of water infiltration capacity in a wide range of soil textures showed that infiltration was closely related to the percentage of sand in these soils. Soils with sand content inferior to 50% presented low infiltration capacity, while those with more than 50% of sand had moderate infiltration capacity. In these studies water infiltra
48
strength
ohyperthermic kaolinitic. The soils are acid with Alsaturatio
nd content and 24.6% of clay) and heavy (29.7% of sand and 40.9% of clay).The eva
measured in the upper 0-3 cm of soil. Values that are higher than 45 KPa at field capacityshowed restrictions to water infiltration. Although there have been numerous studies on water infiltration, very few have documented the processes of wetting and/or drying of the soil over time. The purpose ofthis study was to evaluate during the dry season, how different amounts and frequencies of applyingwater, affects the distribution of water in the soil profile of two contrasting textural soils: heavy and light.The study was conducted on the Matazul Farm, township of Puerto López (lat. 4° 5' and long. 72° 58').The soils are classified as Typic Haplustox Is
ns higher than 80%, base-saturation percentage less than 15% and low phosphorus content (2.3ppm). The mean annual rainfall of the farm is 2251 mm, with a unimodal distribution from April-Nov.The potential evapotranspiration of the zone is 112 to 123 mm/mo for the rainy and dry seasons. Solar radiation varies from 4.47 to 4.77 Kw-h/m2, respectively.
The purpose of this research was to study how in a dry soil profile of a natural savanna, water is redistributed after irrigation. Different amounts of water were applied every day (continuous application)
or every other day (alternating application) to experimental units of 1 m 1 m of soils with different textures: light (58.6% of sa
luation was made during the dry period (11 Feb.-3 Mar.) after 45 dry days, having two fieldreplications in a completely randomized design. To each experimental unit different amounts of water were applied at a rate of 0.5 L/min. Nine treatments were used, they are presented in Table 8. The basic application rate for one day was 20 L/m2. The 20 liters were applied in four 5-L dosages, every 10 min, toprevent waterlogging and runoff.
Table 8. Treatments applied to the two soil textures of an undisturbed native savanna soil.
Treatments
Application on Continuous
Days
Application on Alternating DaysDetails of Treatments
ater applied (L/m2) 20 40 60 80 100 40 60 80 100l (T0): No water applied
correspoon altergrav e3, 4 ,samples
(metal cined a relatively constant value of about 2.62 Mg.m-3, showing no-
eavy soil hadost twice the OM content as the
Treatments 1-5 received 1, 2, 3, 4 and 5 basic rates, respectively, on continuous days,nding to 20, 40, 60, 80 and 100 L of water/m2. Treatments 6-9 received 2, 3, 4 and 5 basic ratesnating days, corresponding to 40, 60, 80 and 100 L/m2. After finishing each treatment, thetric moisture was measured at different depths (0-10, 10-20, 20-30 andim 30-40 cm) and days 1, 2,
, 6 8, 10 and 12, taking two samples of soil for each depth stratum in each experimental plot (i.e., 4/treatment and depth). An initial sampling was done to determine OM content, bulk density
ubes 10 10 10 cm) and particle density.Particle-density values mainta
differences for soil texture or depth in the soil profile. The bulk-density values of the light soil were in the heavy-textured soil. Therefore, the hsignificantly higher at all depths, than those
higher values of total porosity. On the other hand, the heavy soil had almlight soil.
Table 9 shows the percentages of gravimetric moisture content in the light soil one day (fieldcapacity) after the last application of water. It can be observed, that the maximum amount of water occurred when 100 L were applied in a continuous way. In this treatment moisture content was significantly higher than in the others treatments up to a depth of 20 cm. There were no significantdifferences with the application of 40, 60 or 80 L/m2. Moisture content values during the first day were higher than these of the control (6.54, 7.20, 7.52 y 8.56).
49
Table 9. Percent of gravimetric moisture content (%) in the light-textured soil 1 day after application of the rates in the respective treatments.
100 11.02 a 11.02 a 11.07 ab 10.08 ab Alternating 40 60 80 100
9.48 b 9.49 b 9.20 b 9.45 b
9.48 b 9.49 b 9.20 b 9.45 b
(7.54) d (7.90) d 9.57 c
10.03 bc
---(6.56) c (7.91) c 8.38 bc
Savanna (Control) 6.54 c 7.20 c 7.52 c 8.06 bc
10.67 ab 10.64 a
1 Means with the same letter in the same row are not significantly different (P<0.05) according to Duncan's test.---Samples could not be taken with the borer due to the hardness of the soil; also indicates that the waterwas not sufficient to wet the soil.
In general the continuous- eatments had higher gravimetric moisture contents thanthe alternating- application treatmen oil ha h sa transmit w he results from Table 9 also showed that some of the treatmentswhere less water was applied, did en te or n r so pt his ue to the fact that the amount of water used was no o pe etrate o the epths In th heavy textured soilt ric moisture content were higher than that of the li -tex e so 00-Lc tment ha ist o e t a pt t w so found
that the amount of wate l in some of the treatments was not enough toenetrat
( ) Gravimetric moisture values lower than the dry savanna (control).
application trts, which shows that if the s s igher moisture content, it also ha
n increased capacity to ater. Tnot p etra to m e tha 20 o 30 cm iulde h. T is d
t enough t n t se d . e -he percentages of gravimet ght tur il. The 1ontinuous-application trea d high rav tri
r used to moist the soier g ime c mo ure c nt nt a ll de hs. I as al
Figure 10. Percent gravimetric moisture by soil depth in a light-textured soil, 1, 4 and 8 days after applying five rates of water (20 L each) continuously or on alternating days.
Day 1 Day 4 Day 8
Continuous Alternating Dry savanna
50
Figure 11. Gravimetric moisture content (%) in y-texture y depth, 1, ys after app er (20 L ntinuousl alternati
tures,re atingap vimetric moisture content was observed
Greater differences were found in theravime
eveloping water-flow models in the soil profile; nevertheless, it
OM contentthan the h icropores, whichperm
he gravimetric mo ilarly, there was a great and in a volumetricmo
for the heavy and
developm.4 mm/day for
water than the alternatingtreatments.
0
2
4
6
10
12
18
0-10 10-20 20-30 0 -10 0- 30-40 0 20-30 30-40
Day
Gra
vim
etr
o)
20
8ic m
14
16
e(%
30-40 20 20-30 0-10 10-2
1 Day 4 Day 8
istu
r
Continous Alternating Dry savanna
a heav d soil, b 4 and 8 dalying 5 rates of wat each) co y or on ng days.
Figures 10 and 11 show the gravimetric moisture content for the light and heavy texspectively, for days 1, 4 and 8 after applying 100-L/m2 treatments with continuous and alternplications vs the savanna control. For both textures a higher grathe continuous treatments than in the alternating treatments.in
g tric moisture content between continuous vs alternating treatments in the heavy-textured soils than in the light-textured one. On day 8, the gravimetric moisture content in the light texture was lower than that for the savanna (control); while in the heavy texture a slightly higher gravimetric moisturecontent was maintained in the continuous treatment over the control. The data indicate clearly how the heavy-textured savanna maintains a higher gravimetric moisture content level over time than the lighttexture, which can be associated with a higher OM content, finer particles, greater capacity to store waterand less macroporosity.Conclusions
The methodology used was sufficiently sensitive to detect the dynamics of drying the soil and could prove useful for understanding and dis necessary to eliminate the loss of water due to the lateral flow in the adjacent zone that did notreceived water.The light-textured savanna soils had a higher bulk density, lower total porosity and lower
eavy-textured soils at all depths. The latter soils had a higher proportion of mitted more water retention, but their hydraulic conductivity was slower.
At the field level, the wilting point was higher in heavy textures than in light, at both tisture (12.7 vs 7.3%) and volumetric moisture content levels (16.5 vs 10.8%). Sim
er field capacity in heavy- than in light-textured soils: 17.5% and 10.9%isture content base 22.7% and 16.2%, respectively.
The available water for plants was fairly similar in the two textures (6.2 and 5.4%light textures, respectively). These values are considered limiting for adequate plant growth and
ent.The evapotranspiration rates in the 100-l/m2 treatment were estimated at 13.6 and 16the continuous and alternating systems, respectively.In the light-textured soil the available water was depleted in 4 days; in the heavy soils, after 8 days ofdrying. The treatments with continuous application had higher percentages of gravimetric moisturecontent and volumetric moisture content and theoretical available
51
Susceptibility to compaction of improved Oxisols in the Eastern Plains of Colombia
E. Amézquita, L.F. Chávez, D.L. Molina, P. Hoyos and J.H. Galvis
Tropical Soil Biology and Fertility (TSBF) Institute of CIAT Determining the degree of soil compaction is very important to define its quality in terms of its capacityfor crop production. It is necessary to use parameters that characterize it and that give values that can becompared among different soil types. In general, there is a scarcity of predictive methodologies capable of indicating to what extent a soil can be compacted without having an adverse effect on agricultural production. It is accepted that the methodology of determining relative bulk density (susceptibility to compacting or compacting level) satisfies this need. The “compacting level” is defined as the percentageof the ratio between the initial and the final bulk densities of a volumetric soil sample equilibrated to a suction of 7.5-10 KPa (field capacity), and subjected to an uniaxial confined pressure of 200 KPa. This
percentage expresses the maximum value of the ratio ( ai/ af – initial bulk density of the soil/ final bulk density) that a soil can reach and relates it, according to Häkansson (1986), to a critical good level of 87%. Soils with values higher than this critical level are less adequate for root growth and for crop
roduction. Values close to 100% indicate that the soil is already compacted and that the probabilities of
of 30 cm at different intensities: 1, 2 and 3 chisel passes with legs separated at5 m to obtain three degrees of soil loosening. These plots were sown in a rotation
grasendin th f residues for improving soil physical conditions.
the
und 10-20, 20-30 and 30-
evasatusub a Proctor apparatus (final volume). The ratio
to con to native savanna, no-intervened soil, that presented values ranging from 1.43-1.53
soil w bulk densities are of great importance for soil
watplan
pagricultural success are low. This methodology is based on the use of large soil samples, but it can alsobeen used with small samples. This article presents and discusses the results obtained in an Oxisol of the
astern Plains, when applying this methodology to a soil-improvement trial. E
The experiment was established on the Matazul Farm (4º 9’ 4.9” N, 72º 38’ 23” O), located in themunicipality of Puerto López, Meta Province, at an elevation of 260 m.a.s.l. The zone has two clearlydifferentiated climatic periods: a rainy season that goes from March until December and a dry seasonfrom December until the first week of April. The average annual temperature is 26.2ºC. The zone has an average annual rainfall of 2719 mm, a potential evapotranspiration of 1623 mm and a relative humidity of 81%. The soil is classified as Isohyperthermic Kaolinitic Typic Haplustox in USDA soil classificationsystem. This trial was initiated in 1996; the measurements determinations that correspond to this paper were made in 1999.
Susceptibility to compaction was made in plots of an experiment, designed to improving the soilphysical condition of soils with high bulk density. The following treatments were used: (i) vertical tillage (use of chisel) to a depth0.60, 0.30 and 0.1system of rice/soybeans. The other treatments involved the use of two chisel passes and were sown with
s alone pasture, legumes alone and a combination of grass + legume to be incorporated early (at theof the rainy season) or late (at the end of the dry season) into the soil, to study the effect of the season e incorporation o
Experimental plots of 30 50 m were established and were random distributed at the beginning of
experiment 1996A. After three years 1999B, in each plot three pits of 0.5 0.5 0.5 m were dug, and
isturbed soil samples were taken in cylinders (50 50 mm) at four depths: 0-10,40 cm using four replications. Twelve samples were taken per treatment per depth. The parameters
luated included bulk density (initial and final) and susceptibility to compaction. The samples wererated and then submitted to equilibrium at a suction of 75 cm (field capacity, initial volume) and then jected an uniaxial pressure equivalent to 200 KPa in
between the initial and final bulk densities permitted the determination of the percentage of “susceptibilityompaction” or “compacting level”.
In comparis(Mg.m-3) at the depths studied (Table 10), the values found in the treatments were lower, indicating that the
had improved as a result of the treatments. SuiTable lomanagement in this type of soil as they are indicative of factors that regulate root growth, infiltration, and
er movement in the soil, which in turn affects nutrient availability in soil and nutrient acquisition byts. Given that a good bulk density values for crop production in mineral soils ranges from 1.10-1.30
52
Table 10. Statistical comparisons among treatments based on depth of treatment with some physicalcharacteristics of the soil in the Cultural Profile trial, Matazul, 1998.
Late incorporation residue Grass (T7) Grass + legume (T8)Legume (T9)
Native savanna (T10)
1.57 a 1.49 ab
1.31 b 1.51 ab 1.49 ab
1.52 ab
1.63 a 1.60 a
1.52 a 1.61 a 1.62 a
1.63 a
96.20 a 92.86 ab
85.33 b 94.26 a 91.93 ab
93.00 ab
3.80 b 7.13 ab
14.66 a 5.73 b 8.06 ab
7.00 ab
LSD 0.05
1.44 ab
0.21
1.59 a
0.14
90.80 ab
7.03
9.20 ab
7.03
53
LSD 0.05LSD 0.05
Figure 12. Co in the rice gure 13. n levels at different soilrotation at diff epths in relation pths in the early incorporation treatments intillage and the critical level. lation to the critical level.
Mg.m-3, that 1.4-1.6 Mg.m inhibit root growth and values of about 1.8 Mg.m-3 suppress it, the valuesobtain d in th -10 cm) of the treatments were adequate for good root development. Thedifferences be ents and th a ere highl cant (LSD t there wasno sta stical d tments, therefore, it is necessary o implement vertical tillage in thesesoils in order to obtained sical conditions fo ctio
f ies are also in T 10. At al the fina ensity wasstatistically si nna. herefore, it can be affirmed that under the methodologicalconditions used, the treatments can reach values equivalent to those found in the n anna, thatrestrict root gr
The third colum ble 10 presents the suscep of the different treatments to compaction,expressed in t ge. The te uscept to comp mpactinglevel” or relative bulk d for determining the degree of com ion that a soilcan support without affecting significantl sical condition for producing crops. The values found under ield co important f parin actual ext soil compa in relation tothe obtained y condition ing i ble to j whether the soil under field conditions pre ent s sical ion for c ion. T ws being ina position to d sely the typ ysica ovement that the soil requ
a the results sho at th depth ( ), the values found in the treatments we to those found under the condition of native savanna (natural state).This indicates ents had i d the soil physical condition. For interpretation of the results it should be taken into account that a value of 1 dicates soil is alr mpacted, as the field bulk the bulk of th ubmitted to the confined pressure. In the case of the native savanna at this depth, the value was 95.1%, which indicates that rema 4.9% of the soil volume, to be totally co d.
In the native savan lues ways h than the l 87% level,indicating that sical condi these soils is not suitable for planting thatvertical tillage needs to be applied before these soils e used for agriculture (Figure 12). Under the late incorporation of residue treatm nt, biological tre ts with gr legumes o passes ofthe chisel, had lower values (Figure 13).
er of 20 there still a percentage of porosityas “residual p hese values are n in t t column ble 10. A parameter is complementar ting level, her i e, the so better ph condition forroot development and is more resistant to com action. The minimu15%. Values b tage indica the s usceptibl paction and that the support capacity (maximum loa t a soil at fie oisture tent can su t for preparation, without being
in the rice gure 13. n levels at different soilrotation at diff epths in relation pths in the early incorporation treatments intillage and the critical level. lation to the critical level.
Mg.m-3, that 1.4-1.6 Mg.m inhibit root growth and values of about 1.8 Mg.m-3 suppress it, the valuesobtain d in th -10 cm) of the treatments were adequate for good root development. Thedifferences be ents and th a ere highl cant (LSD t there wasno sta stical d tments, therefore, it is necessary o implement vertical tillage in thesesoils in order to obtained sical conditions fo ctio
f ies are also in T 10. At al the fina ensity wasstatistically si nna. herefore, it can be affirmed that under the methodologicalconditions used, the treatments can reach values equivalent to those found in the n anna, thatrestrict root gr
The third colum ble 10 presents the suscep of the different treatments to compaction,expressed in t ge. The te uscept to comp mpactinglevel” or relative bulk d for determining the degree of com ion that a soilcan support without affecting significantl sical condition for producing crops. The values found under ield co important f parin actual ext soil compa in relation tothe obtained y condition ing i ble to j whether the soil under field conditions pre ent s sical ion for c ion. T ws being ina position to d sely the typ ysica ovement that the soil requ
a the results sho at th depth ( ), the values found in the treatments we to those found under the condition of native savanna (natural state).This indicates ents had i d the soil physical condition. For interpretation of the results it should be taken into account that a value of 1 dicates soil is alr mpacted, as the field bulk the bulk of th ubmitted to the confined pressure. In the case of the native savanna at this depth, the value was 95.1%, which indicates that rema 4.9% of the soil volume, to be totally co d.
In the native savan lues ways h than the l 87% level,indicating that sical condi these soils is not suitable for planting thatvertical tillage needs to be applied before these soils e used for agriculture (Figure 12). Under the late incorporation of residue treatm nt, biological tre ts with gr legumes o passes ofthe chisel, had lower values (Figure 13).
er of 20 there still a percentage of porosityas “residual p hese values are n in t t column ble 10. A parameter is complementar ting level, her i e, the so better ph condition forroot development and is more resistant to com action. The minimu15%. Values b tage indica the s usceptibl paction and that the support capacity (maximum loa t a soil at fie oisture tent can su t for preparation, without being
mpaction levelsvels /soybean/soybean FiFi CompactioCompactioeerent soil drent soil d tto theo the dede
rere
-3-3
ee e first depth (e first depth (00tween the treatmtween the treatm e native save native sav nna wnna w y signifiy signifi 0.05), bu
titi ifference among the treaifference among the trea tta good phyensita good phyensit
r crop produr crop produ n.n.TheThe inal bulk dinal bulk d shownshown ableable l depths,l depths, l bulk dl bulk d
milar to that of savamilar to that of sava TTative sative savav
owth.owth.n of Ta
rms of percentan of Ta
rms of percentatibility
ilitytibility
ilityee rrm “sm “s ibib action,” also known as “coaction,” also known as “coensity, is a good parameter ensity, is a good parameter pactpact
y its phyy its phyff ndition are veryndition are very or comor com g theg the ent ofent of ction,ction,
under laboratorunder laborator , mak, mak t possit possi udgeudgesented asented a good or deficigood or defici oil phyoil phy conditcondit rop productrop product his allohis alloecide more preciecide more preci e of phe of ph l imprl impr ires.ires.
TheThe nalysis ofnalysis of w thatw that e firste first 0-10 cm0-10 cmre statisticare statistically inferiorlly inferior
that the treatmthat the treatm mprovemprove00% in00% in that thethat the eady coeady co
density is equal todensity is equal to densitydensity e soil se soil sinin
mpactempactecase of thecase of the na, vana, va were alwere al igherigher criticacritica
the original phythe original phy tion oftion of cash crops and cash crops and can bcan b
ee atmenatmen ass andass and with twwith tw
AftAft the confined pressurethe confined pressure 00 KPa,KPa, remains remains , referred here , referred here orosity.” Torosity.” T showshow he lashe las of Taof Ta s thiss thisy to the compacy to the compac the higthe hig ts valuts valu il has ail has a ysicalysical
pp m acceptable value could be around m acceptable value could be around elow this percenelow this percen te thatte that oil is soil is s e to come to com
d thad tha ld mld m concon pporppor
0.05), bu
Level o f co m pactio n (% )
75 80 85 90 95 100D
ep
th(c
m)
0
5
10
15
20
25
30
35
40
45
50
1 pass ch ise l
2 passes o f ch isel
3 passes o f ch isel
N ative savann a
C ritical level
LS D 0.05LSD 0.05
Level o f co m pactio n (% )
75 80 85 90 95 100D
ep
th(c
m)
0
5
10
15
20
25
30
35
40
45
50
1 pass ch ise l
2 passes o f ch isel
3 passes o f ch isel
N ative savann a
C ritical level
LS D 0.05
L e v e l c o m p a c tio n (% )
7 5 8 0 8 5 9 0 9 5 1 0 0
Dep
t h(c
m)
0
5
1 0
1 5
2 0
2 5
3 0
3 5
4 0
4 5
5 0
G ra s s
G ra s s + le g u m e s
L e g u m e s
N a tiv e s a v a n n a
E a io n *
* E a r ly i e m a in d e rs a re in c o rp o ra t
b e fo re s
r ly in c o rp o ra t
n c o rp o ra tio n : T h e r
e e d tim e (M a y )
e d
L e v e l c o m p a c tio n (% )
7 5 8 0 8 5 9 0 9 5 1 0 0
Dep
t h(c
m)
0
5
1 0
1 5
2 0
2 5
3 0
3 5
4 0
4 5
5 0
G ra s s
G ra s s + le g u m e s
L e g u m e s
N a tiv e s a v a n n a
E a io n *
* E a r ly i e m a in d e rs a re in c o rp o ra t
b e fo re s
C r itic a l le v e l
r ly in c o rp o ra t
n c o rp o ra tio n : T h e r
e e d tim e (M a y )
e d
54
deformed) of the soil is low. Values higher than 15% indicate that the soil is resistant to compaction and has a good machinery supporting capacity. The values for the native savanna were below this critical level to the depths studied. They ranged from 7.0% to 2.4%. The values found in the treatments werehigher to a depth of 30 cm, leading to the conclusion that vertical tillage is essential for correcting these soils.Conclusions
The Oxisols of the Colombian savannas in their natural condition have high compacting-level values,ranging from 93-97% (a value equal to 100 indicates that the soil is already too compacted forfarming and production of pastures), to a depth of 40 cm. Under these conditions, they are not apt for growing crops.
These values can be lowered to “adequate” levels by using vertical tillage (2 passes of the chisel) in
cator of the actual
Centro
tigate their influence on water infiltration. Field research was conducted in Santander de Quil
rainsimu
nfiltration were conducted in both rainy seasons (April/May and October
rface with a needle of about 4 cm. Penetration resistances weremeasure
combination with planting improved tropical forage grasses and/or legumes.
The methodology used in this research proved to be sensitive to the changes produced by verticaltillage in the soil physical conditions; therefore it is recommended as an indicondition of soil compaction.
Effects of soil crusting on infiltration measured by a mini-rain-simulator in Colombian hillside
cropping systems
C. Thierfelder1, E. Amézquita2, and K. Stahr1
1University of Hohenheim, Department of Soil Science and Land Evaluation, 70593 Stuttgart, Germany 2 Internacional de Agricultura Tropical (CIAT), A.A. 6713 Cali, Colombia
The aim of this study was to identify soil structural degradations in nine cropping systems of the Andean hillsides and to inves
ichao at the CIAT Research Station, Department of Cauca in southwestern Colombia (3°6'N, 76°31'W, 990 m.a.s.l). Santander de Quilichao is located at the southern end of the Cauca Valley. Trials were established on an amorphous, isohyperthermic oxic Dystropept, which is a ferralic Cambisol. It is developed from fluvially translocated, weathered volcanic ashes from the local volcanoes Puracé andSotará.
The measurements of penetration resistance were made in nine cropping systems on 27 StandardErosion Experimental Plots on slopes with an inclination of 7 to 13%, 14 years after the experiment wasestablish as a completely randomized block in three repetitions. Infiltration was measured using a mini-
lator described by Amézquita (1999), irrigating a defined soil surface area (32,5 cm 40 cm)with a distinct amount of rain (90 ± 5 mm h-1). The simulator was installed about one meter inside the plotboundary. Leaves, grass particles and weeds were carefully removed from the soil surface before measurement. After calibrating the simulator by collecting and measuring a defined rain period of 1 min,a specific rain event of 50 min was carried out. The construction of this simulator enabled the collection of run-off periodically (every 5 min). The difference between irrigated rain and run-off was defined as infiltration. Measurements of i
/November) in 2000 and 2001, respectively. Each measurement was repeated nine times per treatment (three time per plot) to account for the spatial variability. Field measurements of penetrationresistance were taken with a pocket Penetrometer. Six measurement points were established on each plot, two at each end and two in the middle part of the plot at a one-meter distance from the plot boundary. Thepenetrometer was inserted into the soil su
d by pushing the penetrometer vertically into the soil surface. Four readings were taken at eachmeasurement point and their mean noted.
Considering the varying results of penetration resistance in the year 2000 (Table 11), four distinct time periods could be observed (January-March, March-beginning of May, May-September, September-December). These periods obviously coincided with the rainy and dry seasons. The rainy seasonMarch/May 2000 and the strong dry season July/August 2000 were of special interest. When the soil was
55
wet, penetration resistance generally remained at a low level. In contrast, when the soil dried outpenetration resistance increased in some treatments.
In 2000, outstanding results in penetration resistance measurements were found in T4 revealing46.4 kg cm-2 in August (Table 11). The cassava chicken manure treatments (T2, T5 and T6) showed a similar -2trend in the rainy and dry season. Highest penetration could be measured in T6 (19.6 kg cm in
wed by T5 (16.2 kg cm-2 in July) and T2 (12.9 kg cm-2 in August). T7 and T8 showed
resunew(197 , results of T1 in September and October were not included in the analysis.
Tab g cm ) in the top 4 cm e
No b Mar April May June July Aug Sep Oct Nov
August), follosimilar results but had comparably lower penetration resistance in the major dry season. Exceptional
lts were found in T9 where seasonal changes had minimal effects. In September 2000, T1 had to be ly prepared to seedbed conditions according to USLE-recommendations of Wischmeier and Smith8) and, therefore
le 11: Influence of treatment on monthly averaged penetration resistance (k -2
lay r in 2000 and 2001, Santander de Quilichao.
2000 Fe
T1 Bare fallow3.6 a 3.9 a 2.8 b 8.3 b 8.4 bc
11.2ab
9.6ab NIL NIL 0.7 a
T2 Cassava 4 t ha-1 chicken manure2.2 ab 4.3 a 5.1 ab
8.6ab
12.9ab 4.1 a 4.8 a 3.7 bc
24.5 b 28.6 b 9.5 d
3.0 a 3.0 a T3 Cassava monoculture
2.7 a 3.0 a 1.8 a 4.4 a 4.3 ab 6.0 a 9.1ab 4.1 a 4.3 a 3.3 bc
T4 Cassava minimum tillage 8.3 b 4.4 a 2.9 b 8.4 b 12.4 c 22.3 c 46.4 cT5 Cassava 8 t ha-1 chicken manure 16.2 13.0
3.9 a 3.5 a 2.3 ab 4.5 a 7.6 ab bc ab 5.6 a 6.2 a 4.3 c T6 Cassava 4 t ha-1 chicken manure
(V) 3.4 a 3.1 a 2.4 ab 5.1 a 5.2 ab 8.7ab 19.6 b 5.0 a 6.3 a 4.2 bc
T7 Cassava +Ch. rotundifolia2.9 a 2.6 a 2.3 ab 5.3 a 5.5 ab
9.4ab
12,6ab 5.1 a 6.0 a 3.8 bc
T8 Cassava rotation2.4 a 1.9 a 1.6 a 4.0 a 4.8 ab
9.8ab
13.8ab 4.7 a 4.6 a 3.1 b
T9 Cassava intensive tillage 2.6 a 2.6 a 1.9 a 3.8 a 3.6 a 5.0 a 4.2 a 3.7 a 3.6 a 3.3 bc
No 2001 Feb Mar April May June July Aug Sep Oct Nov
T1 Bare fallow 2.4 a 1.6 a 1.5 a 2.0 a 1.8 a 3.9 a 5.1 a 4.1 a 2.7 a 3.0 ab T2 Cassava 4 t ha-1 chicken manure 3.0
ab 2.2 a 1.9 a 2.1 a 2.4 a 5.0ab 6.0 a 4.6 a 2.7 a 3.0 ab
T3 Cassava monoculture 3.0ab 2.3 a 2.0 a 2.3 a 2.1 a
4.4ab 5.9 a 4.3 a 2.9 a 3.1 ab
T4 Cassava minimum tillage 8.5 c 7.7 b 4.2 b 4.3 b 6.0 b 15.3 c 45.5 b 37.4 b 10.6 b 8.5 c T5 Cassava 8 t ha-1 chicken manure 4.0 b 2.5 a 2.0 a 2.5 a 2.6 a 7.4 b 12.3 a 6.6 a 3.3 a 3.2 ab T6 Cassava 4 t ha-1 chicken manure
(V)3.3ab 2.2 a 2.0 a 2.2 a 2.6 a
5.4ab 7.3 a 4.9 a 2.9 a 3.2 ab
T7 Cassava +Ch. rotundifolia4.1 b 2.8 a 2.2 a 2.5 a 2.6 a
5.0ab 6.5 a 5.1 a 2.7 a 2.6 a
T8 Cassava rotation 3.7ab 2.3 a 2.4 a 3.0 a 4.3 ab
6.6ab 10.8 a 7.9 a 4.9 a 5.4 b
T9 Cassava intensive tillage 2.5 a 2.1 a 1.7 a 2.0 a 2.0 a 3.8 a 5.0 a 3.8 a 2.3 a 2.9 ab
1means followed by the same letter in column are not significantly different at p 0.05 probability level, Tuckey’s-testNotes: Treatments with chicken manure in 2000 and 2001= T2, T5, T6; Treatments with mineralfertilizer = T4, T7, T8 and T9; Treatments without fertilizer, T1, and T3. Rototiller treatment (1x) was carried out in T1-T3, T5-T8; intensive rototiller (5x) in T9; no rototiller treatment was carried out in T4
Results of the two measurements in 2000 revealed that T4 and T8 showed the highest final infiltration after an
as well as T1 and T3. Statistical analysis at p 0.05 did not reveal significant differences because of high
averaged rain intensity of 90 mm h-1 (±5 mm), the lowest final infiltration was found in T5 and T3. The mean final infiltration reached only 42.2 mm h-1 in T5 and 42.7 mm h-1 in T3, respectively. Incontrast, T4 presented a mean final infiltration of about 76.2 mm h-1). Investigating the curves of all treatments in 2000 showed stronger decrease in slope in the chicken manure treatments (T2, T5, and T6)
56
spatial variability between measurement points (Tables 12 and 13). At a higher -level, p 0.10,significant differences between T4 and T5 were discovered. Additionally, final run-off was statisticallyanalyzed at p 0.10. In the above mentioned treatments, the significantly highest final run-off was measured in T5 and T3. In contrast, the lowest final run-off was observed in T4. Taking the lower -levelof p 0.05 into account, no further significant differences were found.
Table 12. Effect of treatment on final infiltration and final run-off, (Apr and October 2000, Santander de Quilichao.
1 Bare fallow 52.1 a1 18.2 38.3 a 17.6TT2 t ha-1 chicken man 38 1
T3 ssava monoculture 42 49 18
T minimum tillage 7 15 1
T manure 42 49 10
T6 -1 chicken man ) 4 41 1
T aecrista rotu lia 56.6 a 6 2
T 7 1
T 4 45 1
Cassava 4
Ca
ure 54.8 a
.7 a
19.1
16.2
.0 a
.2 a
9.5
.8
4 Cassava 6.2 a
.2 a
16.2
11.4
.6 a 3.2
.35 Cassava 8 t ha-1 chicken .6 a
.0 aCassava 4 t ha
Cassava + Cham
ure (V 9.6 a 15.9
.7 a
6.9
7 ndifo 23.2 3 1.6
8 Cassava rotation 0.9 a 16.4 19.7 a 4.9
9 Cassava intensive tillage 6.5 a 11.3 .3 a 1.3
a n in 2001 ar differenTuke
T l f treatment on inf tio d fi M d ber 1,Q i
1 means followed by the s me letter in colum e not significantly t at p 0.05,y’s–test.
ab e 13: Effect o final iltra n an nal run-off, ay an Octo 200 Santander de uil chao.
2001
nt
Final
f on
Standard Final
run
Standard
d nNo Treatme in iltrati deviation -off eviatio
(m -1) m -1
T 5 1 8
m h (m h )
1 Bare fallow 4.2 ab 6. 36.4 cde 8,9
T a 6 cd .
T3 3 2 .2
T illage 87.4 d 6.5 .9 a 1,8
T -1 chicken ma 3 . .6
T6 Cassava 4 t ha-1 chicken ma (V) 5 c . 33.9
T crista rot oli 78.0 cd 9 8
T
T ntensive tillage 43.2 ab 12.6 50.7 def 13,2
2 Cassava 4 t ha-1 chicken m
Cassava monoculture
nure 3.9 b 15 2 28.1 bcd 13,6
8.8 a 6. 52 ef 5,1
4 Cassava minimum t 4
5 Cassava 8 t ha nure
nure
6.1 a 15 2 59 f 15,7
9.3 ab 11 9 cde 12,5
7 Cassava + Chamae undif a 9. 14. abc 10,3
8 Cassava rotation 83.9 d 4.5 10.1 ab 3,7
9 Cassava i
T
1 Means followed by the same letter in column in 2001 are not significantly different at p 0.05,ukey’s–test.
Soil structural degradation and consequently reduced water infiltration as found in the cropping systems of Santander de Quilichao were attributed to the application of chicken manure (T2, T5, and T6)and destructive soil use such as bare fallow or cassava monoculture treatments (T1 and T3). Beneficial effects of chicken manure on soil fertility were neutralized due to the higher amounts of manure. The application time had a remarkably great impact on superficial soil structure. The favorable growthconditions during rainy seasons on one hand alternated with periods of severe physical restrictions for
57
plant development due to soil crusting and sealing on the other hand. Although final infiltration was comparably high in T5, the risk of higher surface run-off was increased due to extremely high rain events and high rain energies reported for this region. Superficial soil crusts are known to cause a decrease in infiltration. The crusts act as natural barriers against local water infiltration. Thus, as a consequence of long-term manuring, all chicken manure treatments were characterized by a strong decrease in final
filtration.
on of organic manuring and intensive tillage practices leads to higher soil crusting and onsequently lower infiltration especially in fragile landscapes such as the Andean hillsides. Hence,commendations to farm findings that conservative management practiceske minimum tillage or crop rotations are high pted b dev and
ng is reduced, ical and chem s im d in is mai
ogi n fixation by common beans (Phaseolus vulgaris L.) increases charcoal
itio
on .A. Ramirez1 and M.P Hurtado1
F
rne
er esen articles of black carbon originated as residues fromodi harc itions hav wn a p impact on several soility on plant yields. The document se is ck Ama n earths,opo n their high pro ty after ce s of us ck carbo has been
nd nodulation as well as occurrence of nodulating plants were significantly greater in
fixation (BNF) is enhanced by charcoal. Possible explanation for this include: reducedva bility of N due to mobilization associated with the high C/N ratio; higher pH and availability of
other nutrients such as P; higher mycorrizal infection prom r ions. Th k ofstudies relating BNF with black carbon and this research w ent at assessing the effect
f re sing charc n nitrog by 15N isotope dilution niqu
blished d l rtility cla y aplustox frommb e pots, the air dried soil r
lize 0 kg ha-1 of li kg P , and 20 k to enable proper growth omm ts per nt were filled with 2 kilogram soil and finelynd n four rates: 0, 30 nd 90 g charcoal kg-1 il. The appliedcoa liptu ta ontrolle on ºC during oner) at in Bogota. The pots were arranged in a completelyom bean advanced AT4 aving go ng cteristics and a nod 7NN) were pla r being inoculated ap iate Rhizobium
een 50-60% field capacity. Five days after germination, a solution of N labeled mmonium sulfate (AS) containing 10% at 15N was applied at a dose of 0.026 g AS. pot-1. At harvest,
plants w
inConclusions: Due to the overall degradation of soil structure and soil aggregation, an
intensificaticre ers should include the researchli ly ada ecause the elopment of soil crustingseali the soil phys ical status i proved, an filtration ntained.
Biol cal nitroge with
add ns to soil
M. R don1, J. Lehmann2, J1 TSB –CIAT Cali ,Colombia2 Co ll University, Ithaca, USA.
Num ous soils from the tropics show pr ce of pperi c fires. In nutrient limited soils, c oal add e sho ositivequal parameters and best ed ca the bla zoniaanth genic soils that maintai ductivi nturie e. Bla n (C)identified as a key component in these soils. However, N availability was found to be lower on the blackC rich Amazonian Dark Earths than adjacent soils. This N limitation in black C-rich soils was not found or legumes, af
forests on Amazonian Dark Earths than adjacent soils. Legumes also performed better on N-limited soilsthan grasses after charcoal applications (Rondon et al. unpubl. data). These results suggested that
iological Nba ila im
oted by cha coal addit ere is a lacas consequcom on beans using
ly aimedo inc a oal additions o en fixation mtech e.
A greenhouse study was estaul farm). Before filling th
using aci ow fe y-loam Teceived a basal dose of
pic HColo ian Savannas (Matazferti r at rates equivalent to 30 me, 20 ha-1 g N ha-1
of c on beans. Four replicated po treatme s ofgrou charcoal was mixed with the soil i , 60 a of sochar l was produced from logs of Euca
ory from National Universitys deglup under c d conditi s (350
hou the fuels laboratrandnon
ized design. A commonulating isoline (BAT 47
line (Bnted afte
77) h od N-fixiwith the
charapropr
strain (CIAT 899). Plants were allowed to grow for 75 days until pod filling. Moisture was maintained in the pots betw 15
aere carefully removed from the soil, washed and separated into leaves + stems, roots and pods.
Dry biomass was determined and then a finely ground subsample was used to reconstitute a compositeplant sample for analysis of various nutrients, determined by Inductively Coupled Plasma AtomicEmission Spectroscopy (ICP-AES). Another subsample was used for analysis of total N and 15N content by Isotope ratio Mass Spectrometry.
58
As can be seen in Table 14, soil pH is increased by increasing the additions of charcoal as well as the cation exchange capacity of the soils. This resulted in a net increase in the availability of some soilnutrients such as potassium which increased linearly from around 100 mg.kg-1 up to 490 mg.kg-1 with the higher additions of charcoal. Magnesium also increased from 25 to 85 mg.kg-1. Nitrogen clearly limitedplant performance as indicated by the low plant biomass in the non nodulating plants. Likely as a result of higher pH and higher availability of some soil nutrients, total plant biomass, nitrogen uptake and yieldalso inc
n.
gen uptake by nodulating and non nodulating common beans.
Soil pH CEC (mmolc-1
Total plant Total plant N
reased with low to medium additions of charcoal. Increments up to 40% were possible by theaddition of 60 g of charcoal kg –1 soil. Nevertheless, the highest dose of charcoal did not have an effect onplant biomass of fixing beans and had a negative effect on biomass and total N uptake of the nonnodulating bean isoline. The reason for a drop in BNF as well as biomass production (though not yield)at high charcoal application rates is not clear but may be related to nutrient unbalances, low N availability due to adsorption phenomena on the charcoal surface, and consequently low photosynthate productio
Table 14. Effect of increasing charcoal additions to a low fertility soil, on some soil properties and total biomass and nitro
Genotype Charcoal
dose
(g.kg soil-1)
kg ) biomass
(g.pot-1)
uptake
(mg. pot-1)
BAT 477 0 5.04 e 108.2 a 4.40 a 82.65 a
30 5.08 de 118.5 ab 5.59 b 97.13 ab 60 5.24 c 131.7 b 6.12 b 107.81 b90 5.41 b 131.5 b 4.63 a 74.49 a
BAT477NN 0 5.13 cde 102.5 a 3.43 c 39.6630 5.17 cd 103.4 a 3.79 c 46.5460 5.34 bc 117.0 ab 3.78 c 39.7090 5.62 a 129.0 b 2.64 d 33.96
In Figure 14, values obtained for the proportion of total nitrogen derived from Biological nitrogenfixation are presented, as well as the partitioning of plant nitrogen from the soil and from the atmosphere.Nitrogen fixation was increased significantly with additions of charcoal, from around 50% in the soilalone to 72% with the highest dose. Most of the increase is reached with even low doses of charcoal.
derived from soil (NdfS) and from biological fixation (NdfA) byplants of common beans.
a. Fraction of nitrogen derived
from biologican fixation
40
45
50
55
60
65
70
75
80
0 20 40 60 80 100
C h a r c o a l d o s e ( g / k g s o i l )
b. Nitrogen uptake from soils and
biological fixation
0
40
80
120
160
0 30 60 90
Charcoal dose ( g/kg)
Pla
nt
N (
mg
/po
t)
mgNdfS
mgNdfA
a. Fraction of nitrogen derived
from biologican fixation
40
45
50
55
60
65
70
75
80
0 20 40 60 80 100
C h a r c o a l d o s e ( g / k g s o i l )
b. Nitrogen uptake from soils and
biological fixation
0
40
80
120
160
0 30 60 90
Charcoal dose ( g/kg)
Pla
nt
N (
mg
/po
t)
mgNdfS
mgNdfA
Figure 14. (a) Effect of increasing doses of charcoal addition on the proportion of nitrogen derived fromBNF (%NdfA) and (b) plant nitrogen
59
This pro
ee inhibitory effect on nitrification in soil (IP-5 Annual Report, 2003). We have tested the stability,
to the soil with 182 ppm
f N as (NH4) 2 SO and incubated at 20 C and 95% RH. Sequential sampling was done at 25 d intervals
cess could be associated with increased levels of both Molybdenum and Boron in the soils that received charcoal. Nitrogen total uptake from soils decreased with increasing charcoal doses. These results demonstrate the potential for increasing the N input by BNF into agroecosystems in highlyweathered and acid soils by using charcoal applications. Future studies should include field experimentation to optimize BNF and explore the sustainability of BNF improvement by charcoal.
Stability, persistence and effectiveness of Brachiaria humidicola root exudates in inhibiting
nitrification in soil
G.V. Subbarao1, H. Wong1, T. Ishikawa1, O. Ito1, M. Rondon2 and I.M. Rao2
1 JIRCAS, Tsukuba, Japan2 Tropical Soil Biology and Fertility (TSBF) Institute of CIATThis year, we have improved further the protocols in processing and testing of root exudates to determinthpersistence and effectiveness of the inhibitory effect from root exudates of B. humidicola on nitrificationin soil. NI activity of 10 AT units g-1 soil (Soil from Tsukuba, Japan) was added
o 4
a bati tinu d of 10 AT units g-1 soil tive ininhibiting nitrate 70 bition) and r ffective in nitrification(about 50%) unt substantial portion of the inhibito rom NI act t between7 days incubation in
The synthetic nitrificat t pyrin did not inhibit nitrification effectively (onlyabout 20% inhib n on nitrate n under these conditions and lost its effectiveness after 30 days of incubation (Fig u demonstrat ot exudates f idicola are e is and sTable t ication in soil (up to 75 days at least). Our results indicate that two humidicola plants of 60 to 70 d old can re to 100 AT units of NI activity (in 24 h period) under optimum . lts also indicate that the NI release ratesm ntioned above can be maintained for lo s of time ( tested up to ys and that the
lease rates were maintained).
-1
nd the incu on was conformation in soil (about
ed for 100 ays. NI activity% inhi
was very effecinhibitingemained e
il 75 days. A ry effect f ivity was los5 and 100 of soil.
ion inhibi or, Nitraitio formatio ) at 4.5 ppm
ure 15). O r results e that ro rom B.hum
ffective, pers tent in inhibi ing nitrifB. lease up
conditions Our resu activitye ng period we have 15 da
re
0
20
40
60
80
so
il
0 25 50 75 100
Incubation time (d)
Inh
ibit
ion
on
nit
rate
form
ati
on
in
(%) Root exudates
Nitrapyrin
Figure 15. Inhibitory effect from root exudates (10 AT units NI activity g soil) and nitrapyrin (4.5 ppm)on nitrate formation in soil during 100 d incubation period (Note: In control, nearly 90% of the addedNH4-N was nitrified by 75 days).
60
This is the first time that we have demonstrated the effectiveness, stability and persistence ofexudates (from B. humidicola) inhibitory effect on nitrification in soil.
root
nfluence of NH -N on expression/regulation and release of NI activity in root exudates of B.
ong , T. Ishikawa , O. Ito , K. Nakahara , M Rondon and I.M. Rao
d Fertility (TSBF) Institute of CIAT
3-N) can influence the release of NI
e of NH4-N (i.e. when root exudates are collected using distilled water).
Figure 16. Influence of NH4-N in the root exudates collection medium on the release of NI activity into root exudates from B. humidicola roots (Specific NI activity = NI activity g-1 root dry weight).
Our results support the hypothesis that presence of NH4-N stimulates the synthesis and release of NI activity from roots (data not presented on the root tissue NI levels). The release of NI activity fromroots appears to be a highly regulated phenomenon and NH4-N in the rhizosphere is certainly one of the
portant regulating factors for the release of NI activity. Also, regulatory role of NH4-N in the
I 4
humidicola
G.V. Subbarao1, H. W 1 1 1 1 2 2
1 JIRCAS, Tsukuba, Japan2 Tropical Soil Biology anWe have tested the hypothesis that nitrogen forms (NH4-N vs NOactivity from roots in B.humidicola. Plants of B. humidicola were grown hydroponically with two sources of nitrogen – 1 mM N as (NH4) 2SO4 or KNO3 for 70 days. Root exudates were collected bykeeping intact plant roots in distilled water, 1 mM NH4Cl or 1 mM KNO3 for 24 h. NI activity of rootexudates was determined with the NI bioassay. Root exudates of NH4-N grown plants showed NI activity,whereas NI activity was completely absent in the root exudates of NO3-N grown plants (data not shown for NO3-N grown plants as there was no NI activity detected in root exudates).
Presence of NH4-N in the root exudates collection solutions further stimulated the release of NI activity in NH4-N grown plants (Figure 16). The NI activity released in the presence of NH4-N was several-fold higher than in the absenc
Root exudates collected using distilled water or 1 mM NH4Cl
RE-water RE-NH4-N
Sp
ecific
NI a
ctivity (
AT
unit
0
2
4
6
8
10
12
14
16
18
s)
of ro
otexu
date
s
imrhizosphere for the release of NI activity from roots further indicates the functional significance of NIactivity in protecting NH4-N in soil from nitrification.
61
Screening for genetic variability in the ability to inhibit nitrification in accessions of B. humidicola
M. Ron
Tropical Soil Biology and Fertility (TSBF) Institute of CIATpan
and reduces the emission of nitrous oxide into the atmosphere. Given these findings withf nitrification
ent tropical grasses, there is a need to determine the extent of genetic variationrmplasm bank. This information will
en nitrification inhibitionand roo
P, 100 K, 66 Ca, 28.5 Mg, 20 S and micronutrients at 2 Zn, 2 Cu, 0.1 B and 0.1 Mo. A total often accessions were used (accessions CIAT 679, 6133, 6369, 6707, 16866, 16867, 16886, 16888, 26149, 26159). A control without plants was also included. The experiment was arranged as a completelyrandomized block design with four replications. Each pot contained four plants. After sowing, plants were allowed to grow for 15 weeks and were cut to 10 cm height to simulate grazing effects under fieldconditions. Plant tissue was dried and saved.
Plants were allowed to re-grow during 5 weeks more to promote a well developed root systemand then ammonium sulfate was applied in solution at a rate of 38.5 mg N-NH4/kg soil (equivalent to 100kg N-NH4 per hectare). Five weeks later plants were harvested (at 25 weeks after sowing). At the end of the experiment, plants were carefully removed from soil minimizing mechanical damage to the roots. Soiladhered to the fine toots was removed and the roots were rinsed with deionized water. Once clean, theroots were fully immersed in 1 liter of deionized water and were allowed to produce root exudates during24 hours. Collected root exudates were kept in the refrigerator and were reduced in volume toapproximately 100 ml using a freeze drier.
Harvested plants were separated into shoot and roots. Root length was measured using a root length scanner. Dry matter content and N status of both shoot and root biomass was determined. At harvest time, soil samples were extracted with KCL and analyzed for nitrate and ammonium levels. Theconcentrated root exudates were further concentrated using a rotovapor using protocols that were developed for this purpose. The final concentrate was tested for its nitrification inhibitory activity using a
ecific bioassay developed at JIRCAS.
l biomassroduction among most of the CIAT accessions except for the accessions of 16866 and 16867, which
were lo
level of NI (nitrification inhibitory) activity in theot exudates of most of the accessions tested (Table 16). However a range in NI activity was found
among the tested accessions.
dón1, I.M. Rao1, C.E. Lascano1, J.A. Ramírez1, M.P. Hurtado1, J. Ricaurte1, G.V. Subbarao2, T. Ishikawa2, K. Nakahara2 and O. Ito2
1
2 JIRCAS, Tsukuba, Ja
Collaborative research with JIRCAS, Japan, has shown that B. humidicola CIAT 679 inhibits nitrification of ammoniumthe commercial cultivar of B. humidicola CIAT 679, and the fact that a range of inhibition owas observed among differamong the 69 accessions of B. humidicola that are part of CIAT gebe extremely useful to develop screening methods to select genetic recombinants of Brachiaria grassesthat not only are resistant to major biotic and abiotic stress factors but also can protect the environment.Given the vast areas under B. humidicola in the tropics, reductions in net emissions of N2O could alsohave important environmental implications.
The main objective was to quantify differences among 10 accessions of B. humidicola regardingthe nitrification inhibition activity of root exudates collected from plants grown under greenhouseconditions using infertile acid soil. Also we intend to test the relationship betwe
t production in terms of biomass and length. A sandy loam Oxisol from the Llanos (Matazul) of Colombia was used to grow the plants (4 kg
of soil/pot) under greenhouse conditions. A basal level of nutrients were applied before planting (kg/ha):40 N, 50
spResults on dry matter partitioning among shoot and root biomass from the comparative evaluation
of the ten accessions are presented in Table 15. No significant differences were found in totap
wer than the rest of the accessions. However, significant differences among accessions werefound in root biomass production. The commercial cultivar, CIAT 679, which has been used in most of the previous work, seems to have root biomass around the average value for the group tested. The accession 6707 produced the highest root biomass among the tested accessions. Values of root biomass of this accession were more than twofold greater than the value for the lowest in the group, the accession 26149.
Results from the bioassay indicated substantialro
62
Table 15. Dry matter partitioning differences among ten accessions of B. humidicola grown in pots under greenhouse conditions. Plants were harvested at six months after planting.
Dry matter (g/pot)CIAT
Accession Number Root biomass Shoot biomass Total biomass
CIAT 679 4.29 (1.19) a 14.76 (3.76) d 19.05 (3.68) fCIAT 6133 4.14 (1.65) a 15.06 (1.90) d 19.20 (3.49) fCIAT 6369 4.77 (1.58) b 14.35 (1.59) d 19.12 (2.52) fCIAT 6707 4.92 (0.72) b 17.84 (2.75) d 22.75 (2.61) fCIAT 16866 3.52 (0.89) a 13.45 (0.96) e 16.97 (0.95) gCIAT 16867 3.50 (0.38) a 14.70 (1.65) e 18.20 (1.56) gCIAT 16886 4.48 (1.09) b 15.53 (4.56) d 20.01 (5.12) fCIAT 16888 3.26 (0.72) a 16.97 (1.40) d 20.22 (1.17) fCIAT 26149 2.39 (0.30) c 17.31 (3.20) d 19.70 (3.09) fCIAT 26159 2.96 (1.43) c 16.15 (2.09) d 19.10 (2.20) f
Numbers in parenthesis indicate standard deviation. In a given column, data followed by the same letter indicatenon- significant differences (LSD, p<0.05).
Accessions could be grouped in 3 classes in relation to their specific NI activity. Group 1 with the accession CIAT 16867 showed no NI effects, behaving similarly to other grasses such as Panicum
maximum, which also lack the NI activity. Group 2 that included accessions CIAT 6133, 6707, 16866, 26149, 6369, and 6707 showed similar levels of NI that was observed with the commercial cultivar CIAT 679. Group 3 that included the accessions 16886, 16888, and 26159 showed significantly higher levels ofNI than the accession 679. The accession 16888 was outstanding in its NI activity with a value of morethan three times to that of the value of CIAT 679.
Table 16. Nitrification inhibitory activity (total NI activity pot-1 and specific activity g-1 root dry weight) of the root exudates from ten accessions of B. humidicola grown under glasshouse conditions. Plants were grown for six months before the collection of root exudates.
CIAT
Accession Number
NI activity
(in AT units pot-1)
Specific NI activity
(in AT units g root dwt-1)
CIAT 679 681
.84 (24.1) cd 7.48 (8.4) c CIAT 6133 51.58 (16.9) cd 12.24 (2.83) c CIAT 6369 86.94 (14.3) c 20.72 (4.2) c CIAT 6707 69.68 (5.5) cd 14.86 (1.2) c CIAT 16866 41.48 (6.9) d 11.26 (2.9) c CIAT 16867 -48.55 (18.1) e * -13.42 (3.35) dCIAT 16886 128.05 (15.3) ab 27.95 (5.8) bc CIAT 16888 160.95 (6.08) a 53.76 (17.45) aCIAT 26149 33.5 (39.8) d 15.22 (18.15) cCIAT 26159 126.17 (19.9) b 46.33 (19.0) ab
Note: Numbers in parenthesis indicate standard deviation. In a given column, data followed by the same letterindicate non-significant differences (LSD, p<0.05). NI activity is expressed as AT units; One AT unit is defined
as the inhibitory activity caused by the addition of 0.44 M of allylthiourea (AT) in the bioassay medium. Thus,the inhibitory activity of the test samples of root exudates is converted into AT units for the ease of expression innumerical form.*Negative activity indicates that nitrification was stimulated by the root exudates.
63
Results on NI activity indicate that wide genetic variability exists among accessions of B.
ypes with different vels of NI activity. Once all the accessions in the gene bank are tested, accessions with superior NI
activity could be used as parents to regulate NI activit ombinants together with otherdes its.
ce of sub er level in the root ex two CIATaccessi and 2615 tion to dy these acces etail. Theimmed o continu g of othe B. humidicola bank andto initi g of oth lly imp and crops fonitrific continua ork, thi e initiated the nother 11access midicola material fied as putativ additionalexperim conducte d test N ot exudates fro , sorghum,soybean, cowpea and comm be reported ne r researchwork i determin e importance of total NI activity vs activity in in
On-goin
ia, Sede Palmira.arlier studies have shown that AMF fungal hyphae is fundamental in soil aggregation because greater
ry in their association with AM fungi ander time to soil aggregation ics
of externa o further unction in a betterunderstand capacity o ferent AM stabilizedegraded soils in this study we compare th ee AMF species (Entrophospora colombiana,Gigaspora mar Glomus manihot elinis minutiflora cs of external mycelium deve
Field validati enon of nitrification inhibition from Brachiaria humidicola
M. Rondón1, I . Lascano1, M icaurte1, G.V. Su awa2 and O. Ito2
1 Tropical So d Fertility (TS f CIAT2 JIRCAS, Tsu
arch conducted at JIRCAS and CIAT for the past three years using B s shown thatrothofamsoils incubated with root exudates of B. humidicola and soybean have shown that root exudates from B.
u ion process, while those ofoybean seem to stimulate the nitrification process in soils. Soybean (usually in rotation with maize) is
becoming increasingly important as a crop not only in Latin America but also in many tropical and
humidicola in relation to the effectiveness of root exudates to inhibit nitrification in soils. This genetic variability for NI activity could be exploited in a breeding program to select for genotle
y in the genetic recirable agronomic tra
The presen stantially high s of NI activity udates of theons (16888 9) draws atten the need to stu sions in more diate task is t e the screenin r accessions of from the geneate screenin er commercia ortant grasses r their ability to inhibit ation. As a tion of this w s year we hav screening of a
eions of B. hu including all s that are classi ly sexual. Anent will be d to obtain an I activity of ro m maize, rice
on bean. Results from this study will xt year. Furthes needed to e the relativ . specific NI
fluencing the nitrification process (i.e. inhibition) in a soil environment.
g Work
Dynamics of external mycelium development of three AMF species in symbiosis with Melinis
minutiflora and its impact on water stable soil aggregation
L. Zarate12, E. Barrios1, J. Quintero1 and M. Sanchez2
1Tropical Soil Biology and Fertility (TSBF) Institute of CIAT, Centro Internacional de Agricultura
Tropical (CIAT), ), 2Universidad Nacional de ColombEhyphal lengths significantly favored a greater percentage of water stable aggregates. Our studies also indicate that host plant can lead to differences in soil aggregation potential with both native and a mixedinoculant AM fungi. Because different host plants may vadifferentially contribute ov processes, we need to study the temporal dynam
l hyphae growth ting of th relative
understand their ff hyphae from dif
soil. In order to getfungi to aggregate ande
e impact of thrgarita and is) hosted by M on the dynamilopment and water sTable soil aggregation.
on of the phenom
.M. Rao1, C.E .P. Hurtado1, J. R bbarao2, T. Ishik
il Biology an BF) Institute okuba, Japan
. humidicola haReseot exudates from this tropical grass have the capability to inhibit/suppress the nitrifying populations ine soil. Factors such as presence of NH4-N in the soil seem to have a stimulating effect on the expressionnitrification inhibition (NI) activity in the root exudates of B. humidicola. Differences have been foundong accessions of B. humidicola with regard to their NI activity. Also, our recent studies involving
h
smidicola have suppressed the N2O emissions and inhibited the nitrificat
64
tempera
need to validate some of these findings under field conditions. This year acollabor
oil is fertile with a pH of 6.9. wo accessions of B. humidicola were included: the reference material (CIAT 679) that has been usedr most of our previous studies, and the high NI activity germplasm accession (CIAT 16888). The
s included as a moderate NI and Panicum maximum var. common was included as a egative non-inhibiting control. A crop rotation (maize-soybean) was included to assess under field
the rotation we used maize variety (ICA re removed manually is used as an absolute control.
next year.
f
ios1 and I. M. Rao1
te regions. Other grasses such as Panicum maximum lack the NI activity, while the Brachiaria
hybrid cv. Mulato was found to have a moderate level of NI activity. The use of this hybrid is expandingrapidly in Latin America due to its high productivity and forage quality.
All these above studies were conducted either using hydroponic systems or soil in pots undergreenhouse conditions to test and verify the concept of the biological phenomenon of nitrificationinhibition. There is a clear
ative (CIAT-JIRCAS) long-term experiment was initiated to validate the phenomenon of NI under field conditions and to monitor whether the NI activity is a cumulative process in the soil.
Given the vast areas currently grown in the tropics on tropical grasses, an understanding of the NI process and the possibility of managing it to improve fertilizer N use efficiency, reduce nitrate pollutionof surface and ground waters as well as reduce net impact on the atmosphere through reduced emissionsof nitrous oxide, could have potential global implications for sustainable agricultural development and environmental protection.
The field experiment was established on 31 August 2004 at CIAT-Palmira on a Mollisol (TypicPellustert) as a randomized complete block (RCB) design with six treatments and 3 replications. Annual
rainfall at this site is about 1000 mm with a mean temperature of 25 C. STfoHybrid Mulato wancondition the recent finding that Soybean lacks NI ability (indeed accelerate nitrification), while maizeshows some degree of inhibitory capability. As first crop ofV109). A plot without plants where emerging weeds a
Plot size for each treatment was 10m x 10m. Irrigation will be provided if necessary. Maize was planted from seeds and the tropical forage grasses were propagated from vegetative cuttings. Fertilizer will be applied (broadcast) for every crop cycle, consisting of (kg/ha) 96 N (as urea), 48 K, 16 P, 0.4 Zn,0.4 B and 8 S. The fertilizer is split into two equal applications: one at 20 days after sowing of each crop(either maize or soybean) and the other at flowering time at approximately 60 days after sowing.
A number of soil and plant parameters will be measured at every four months. These includenitrate and ammonium availability in the soil, dynamics of nitrifier organisms in soil, plant nitrogen uptake and nitrous oxide (N2O) emissions. The NI activity of soil water extracts will be measured using the bioassay. Soils samples will be periodically collected and sent to JIRCAS to assess changes in inhibitory compounds in the soil. Gas samples for measuring N2O fluxes will be collected every month.Once a year, soil incubation studies will be conducted using rhizosphere soil, to monitor nitrogendynamics and fluxes of N2O. Currently plants are growing well and the initial sampling is expected inJanuary 2005. Results from this field study will be reported
Use of APSIM to simulate rotations of maize and bean with inputs of chicken manure and soluble
phosphate ertilizer in Tropical Hillsides of Colombia
J. G. Cobo1, M. Rivera1, J. Ricaurte1, R. Delve1, M. Probert2, E. Barr1TSBF Institute of CIAT 2CSIRO Sustainable Ecosystems, St Lucia, Queensland, Australia
Crop production on Andosols in the tropics is limited primarily by availability of phosphorus (P). The high allophane contents of these volcanic ash soils strongly sorb phosphates. To maximize P fertilizer useefficiency it is necessary to quantify the residual value of previous P fertilizer applications.
The APSIM model (Agricultural Production Systems Simulator; www.apsim.info) simulates theeffects of management or nutrient availability on soil quality and crop growth. Recently a phosphoruscapability has been added to APSIM. This study extends the testing of the P capability to a wider rangeof soils and crops. APSIM can be used for farming systems where both organic and inorganic sources of nutrients are supplied. In this study, two experiments were carried out to evaluate APSIM for rotations of
65
maize and beans, responding to different rates of chicken manure and soluble phosphate fertilizer appliedas annual inputs or residual effects from an initial application.
The experiments were established on farm in Pescador, Cauca, Colombia (2 48’N, 76 33’W,1500 m
(CHME)were es
h two more cycles. Basal nutrients (N, K, Ca, Mg, and micronutrients)were ap
.a.s.l.). The area has a mean temperature of 19.3°C and 1900 mm of annual rainfall. Soils arederived from volcanic ash depositions and classified as Oxic Dystropepts, with a bulk density close to 0.8Mg.m-3, pH-H2O 5.1, total C > 52 g kg-1, effective CEC of 6.0 cmolc kg-1 and P availability (BrayII) of < 11 mg kg-1.
Residual Phosphorus Response experiment (RPRE) and chicken manure experimenttablished as random complete block designs with four replications. RPRE consisted of nine levels
of P (as triple superphosphate) while CHME had four levels of chicken manure (local organic fertilizer) (Table 17). Experiments started with planting of maize (Zea mays L. cv Cresemillas) in September 2001.Bean (Phaseolus vulgaris L. cv ICA Caucayá) was planted in March 2002. The rotation of maize andbean crops was continued throug
plied to all treatments in RPRE but not in CHME.To predict the response to P and chicken manure additions in both experiments, daily
temperature, radiation and rainfall were generated using Marksim. Soil characteristics (i.e., nutrient contents, P fractions, plant available water content) were measured in the field at the start of theexperiments. Crop parameters (i.e., time to flowering, time to maturity and nutrient concentrations) were measured and used as inputs for the model. For practical purposes, only the first two cycles of maize andbean are reported For which measured yield data were available.
Table 17. Phosphorus and chicken manure amounts applied annually to maize in a maize-bean rotation in Pescador, Cauca, Colombia.
2 12 12 12CH12 11 Annual application of P (kg ha-1) to maize as triple superphosphate, 2 Annual application of Chicken manure (t ha-1) to maize. * A= annual, R= residual, ** Nutrient content of chicken manure varied fromyear to year; average values were 37% C, 3.3% N, 1.5% P, 2.0 K, 3.8% Ca, 0.9 % Mg.
Measured data: For RPRE in the first cycle the highest yields of biomass and grain were obtained at the highest rates of P application (P160R and P80R) (Figure 17). In the second cycle however, yields forP80R declined but P40A increased relative to P160R. For CHME, yields of biomass and grain increasedwith application rate of chicken manure in both cropping cycles (Figure 18). Bean shoot biomass and
66
yield in the second cycle, particularly in RPRE, was very low because plants were severely affected bydiseases caused by Rhizoctonia solani and Colletotricum lindemuthianum.
12
14
16 8
Figure 17. Predicted and observed yields of shoot biomass and grainfor maize/bean rotation withdifferent applications of triple superphosphate in Pescador, Colombia.
0
2
4
6
8
10
0
2
4
6
1st cycle 1
st cycle
ass P
roduction (
T h
a-1
)
ield
(T
ha-1
)
Maiz
eB
iom
0
2
16
2
4
6
8
4
6
8
10
12
14
0
Maiz
e Y
2nd
cycle 2nd
cycle
0
500
1000
1500
2000
2500
0
200
400
600
800
1000
1200
P0P10A 0A R P80R
P160RP4 P40
0
500
1000
1500
2000
2500
P0P P40A
P40R P80RP110A 60R
0
200
400
600
800
1000
1200
Be
an
Bio
ma
ss
Pro
du
ctio
n(k
gh
a-1
)
Bea
nY
ied
(kg h
a-1
)
2nd
cycle 2nd
cyc
1st cycle
le
1st
cycle
Predicted Observed
Treatments
67
0
2
4
6
8
10
12
14
16
0
2
4
6
8
Maiz
e B
iom
ass P
roduction (
T h
a-1
)
0
2
4
6
8
10
12
14
16
0
2
4
6
8
0
1000
2000
3000
4000
5000
0
200
400
600
800
1000
1200
1400
1600
CH0 CH3 CH6CH12
0
1000
2000
3000
4000
5000
CH0 CH3 CH6CH12
0
200
400
600
800
1000
1200
1400
1600
1st cycle
Bea
nB
iom
ass P
rod
uctio
n (
kg
ha
-1)
Maiz
e Y
ield
(T
ha-1
)B
ea
n Y
ied
(kg
ha-1
)
1st cycle
2nd
cycle 2nd
cycle
2nd
cycle 2nd
cycle
1st cycle 1
st cycle
Predicted Observed
Treatments
Figure 18. Predicted and observed yields of shoot biomass and grain for maize/bean rotation with ifferent rates of chicken manure (CHME) in Pescador, Colombia.
In the first cropping cycle, yields obtained with the higher rates of superphosphate (P80R andyields
The results suggest that the P inputs in RPRE are inadequate to maintain sustainable yields or there is some other limiting factor that is being corrected by chicken manure additions.
d
P160R) or chicken manure ( 6 and 12 tha-1) were similar, but for the lower rates of applicationdeclined markedly in the second season.
68
Simulated data: There are numerous reasons why the model might fail to adequately predict the observed pattern of response. These include: 1) insufficient crop parameterization because maize and beanvarieties used were not adequately characterized. This was the first ever attempt to model a P response for beans using APSIM; 2) generated data from MarkSim apparently overestimated total rainfall for 2001and 2002 when compared with meteorological data measured at the site. This results in APSIM predicting that the site is very wet with leaching of nitrate N from the root zone (data not shown); and 3)APSIM does not consider pest and disease problems, which clearly affected bean yields for the second cropping cycle in RPRE.
Nonetheless there was a fair degree of conformity between the predictions and the observed data.For the maize crops, the highest yields obtained at the high rate of chicken manure and the response to the lower rates were predicted reasonably well by the model. For RPRE, the model tended to overpredict theeffectiveness of the P40 treatments in the first cycle and the residual effects of the initial P treatments inthe second cycle.
The agreement is sufficiently encouraging to undertake further measurements to better specify the crop parameters for the cultivars grown and to revisit the simulations when crop yield data for the third cycle become available. Opportunities also exist to evaluate model performance in terms of soil P status (i.e., compare soil P test data with model predictions of the labile P pool).
1.2. Impact of within-farm and within landscape soil fertility gradients on the functioning of the
most relevant soil based processes understood
TSBFI-Africa
Published Work
Optimizing Soil Fertility Gradients in the Enset Systems of the Ethiopian Highlands: Trade-offs
and Local Innovations
T. Amede1 and E. Taboge2
1Tropical Soils Biology and Fertility Institute of CIAT/ African Highlands Initiative2Areka Research Centre, Southern Regions Agricultural Research Institute
In: Bationo, A., Kimetu, J. and Kihara, J., 2004. Improving human Welfare and Environmental
Conservation by Empowering farmers to Combat Soil Fertility Degradation, Yaounde’, Cameroon,
may 17-21, 2004.
Enset ventricosum is a perennial, security crop that feeds about 13 million people in Ethiopia. It is grownin the homesteads, covering about 18% of the farm, in mixture with Coffee, kale, and other vegeTables.The recent shift from enset to cereals and continual soil fertility decline in the outfields caused fooddeficit for at least 3 months in a year. The objective of this work was to evaluate the effect of soil fertility gradients on enset growth, identify the major growth limiting nutrients, and identify farmers’ decisionmaking criteria in allocating resources to various enterprises. The research was conducted on farmersfields of resource rich (G1) and poor (G3) for four years (2001-2004). Enset transplants were planted inhomestead and outfields. Application of fertilizers by farmers to different units over seasons and years
as recorded. Enset growth and nutrient content was measured. The results showed that the G1 grouproduced about 2xs more organic waste than G3, and purchased chemical fertilizers 5xs more than the G3
e enset field in the homestead. Thereas significantly higher N, P, K and Ca contents in the home stead soils than in the outfield, regardless of
farmers
nced about 90% height reduction and 50% reduction in pseudostem dia
mestead. We thus
wpfarmers. About 80 % of the organic resource produced was allocated for maintaining soil fertility, while 20% being allocated as cooking fuel. Of this 65% is allocated for thw
’ resource endowment. The P content of the outfield was the lowest, less than 25% of the P content of the homestead. Similarly organic matter in the outfield was only about 40% of the homestead.Enset plants grown in the outfields experie
meter, regardless of resource categories, while the NPK content of the plant tissues grown in the outfield was significantly higher, in some case up to 150% than those planted in ho
69
concluded that growth reduction in the outfield was not directly related to NPK deficiency, but it couldhave been caused by off-season moisture stress in the outfields, manifested by low soil organic matter.The attempt to attract resources to the outfield using enset as an attractant crop failed, not because oflabour shortage but because of unavailability of enough organic resources in the system. Hence on spot management of nutrients was initiated by farmers.
e farm. Nutrient use efficiencyaries strongly along these gradients of soil fertility in African smallholder farms. Targeting soil-
ertility gradients within smallholder farms must be onsidered when designing integrated soil fertility management strategies, aiming at an improved
e overall nutrient dynamics within the farm system. Here, we quantify the magnitude andtudy the origin of farmer-induced, within-farm soil fertility gradients as affected by biophysical and
nditions, and investigate farmers’ perceptions of such heterogeneity. Farm transects forrm management assessment, participatory resource flow mapping, and soil sampling for both chemical
esenting the variability found in the highlands of western Kenya. Within-farmed by defining field types, considering distance from the homestead and
ment practices, crop for different field types and
N balances and general soil fertility status varied between field types, though not
ng diversity in soil fertility management of smallholder farms in western Kenya. II Within-
farm variability in resource allocation, nutrient flows and soil fertility status
P. Tittonell, B. Vanlauwe, P. A. Leffelaar, K. D. Shepherd and K. E. GillerNational Agricultural Research Organisation, Kampala, Uganda; Kenya Agricultural Research Institute,
Strong gradients of decreasing soil fertility are found with increasing distance from the homestead intropical farming systems, due to differential resource allocation within thvimproving technologies to the more degraded soils as a means for restoration of agricultural productivityis often unsuccessful. The existence of soil fcefficiency for thssocio-economic cofaand spectral reflectance analyses were performed across 60 farms in three sub-locations (Emuhaia,Shinyalu, Aludeka) reprheterogeneity was classifidifferences in resource allocation, and according to farmers’ perceptions. Manageproductivity, nutrient balances and soil fertility status were documentedfarmers’ land classes within the farms. Both field typologies were in agreement, as farmers classified thehome fields commonly as ‘fertile’. Despite strong differences across sub-locations, input use, food production, C andalways correspondingly. Concentration of nutrients in the home fields was verified for the averageextracTable P levels and secondarily for exchangeable K, whereas the spatial heterogeneity in soil C andN contents were only important at individual farm scale. Farmers managed their fields according to their perceived land quality, varying the timing and intensity of management practices along soil fertilitygradients. The internal heterogeneity in resource allocation varied also between farms of different socialclasses, according to their objectives and factor constraints. The interaction of these with the sub-location-specific, socio-economic and biophysical factors, had important implications for farming systemcharacterisation necessary to facilitate targeting research and development interventions to address the problem of poor soil fertility.
On-going Work
Quantification of the range of within-farm soil fertility gradients and identify the major biophysical
and socio-economic factors driving their generationA Muriuki and B. Vanlauwe TSBF Institute of CIAT
That declining soil fertility and resultant land degradation are the causes of the ever decreasingagricultural production in East Africa is now widely acknowledged. The need to rectify the problem is
70
pertinent if the region is to become self sufficient in food production. Crops grown on depleted soilstypically respond to N and P fertilizers, but fertilizer recommendations, where they exist, cover large areas and ignore within-farm soil fertility gradients, which have become a common feature of smallholderfarms. The Farm Gradients Project (FG) reported here is attempting to develop site-specificrecommendations for Integrated Soil Fertility Management (ISFM) based on local soil fertility lassification schemes. It is hypothesized that within-farm soil fertility gradients are large enough to be
hen planning the allocation of scarce nutrient inputs at the farm level.The project characterized 240 smallholder farms located in 3 benchmark sites in East Africa
ved characterization ofs, agro-ecological zones and
namely in Vihiga and Siaya districts in western Kenya, in Tororo and Mbale districts in eastern Ugandaand in Meru South and Mbeere districts in central Kenya. Farm selection involbenchmark sites using secondary data, superimposition of GIS layers for soiladministrative boundaries, and random selection of 4 sub-locations (Kenya) or parishes (Uganda). In the final stage, a ‘Y’ sampling frame was used to select 10 farms in each sub location/ parish. The ‘Y’ framewas considered to be most efficient for quantifying spatial correlation between sampling units and forremoving spatial correlation effects when inv
Seven forms were prepared to capture the administrative, biophysical and socio-economiccharacteristics of each farm. Administrative information was used to identify each farm from country to the village level. Socioeconomic information included a farm map, information on the household head,the farm’s labor structure, inputs used, off farm income, food security, livestock, and links to nearby markets while biophysical information was collected on a field by field basis and included fieldcharacteristics e.g. slope, landscape position, flooding, erosion, hard-setting, rock/stone cover etc andmanagement information e.g. fallow, nutrient input use, conservation, farmer soil fertility assessment etc.Soil samples were taken to 50 cm soil depth, from a 5m by 5m quadrant placed at random locationswithin each field and the auger holes geo-referenced. The field corners were also geo-referenced. The samples were analyzed for diffuse reflectance spectra (0.35 to 2.5 µm). A corresponding soil fertilityindex (SFI) was assigned and used to estimate corresponding soil organic carbon (SOC) and extracTableP values. A database was been set up and efforts to transfer all the data from hard copy to electronic formare well advanced.
Preliminary analyses of the SOC and organic P variance structures (Table 18) using a mixedmodel approach, confirm the existence of large soil fertility variation at all levels, but particularly within farms. The variation increased, district < sub-location < farm < within farm for SOC and sub-location < district < farm < within farm for extractable P. These results show that soil managementrecommendations made at the district or higher levels will not allow farmers to manage this variabilityadequately. Field covariates such as distance from the homestead, number of years cultivated, number of seasons that fields have been fallowed etc. were used to explain this variability. Position on the landscape and distance from the homestead significantly contributed to the variability of SOC and extracTable Pvalues (Table 19).
Table 18: Overall variance structure for (SOC) and extracTable P in East African smallholder farms
Farm 7.36 19.5 12.57 27.8Within farm 21.43 56.7Overall mean (mg kg-1)Within farm range (mg 9.3 - 10.4 + 9.0 -
71
Table 19: Significance of covariates in overall variance structure of soil organic C (SOC) and available Olsen-P.
Covariate SOC
(p values)
Olsen P
(p values)
Distance from homestead <0.001 <0.001Seasons of fallow 0.002 0.864Farm size 0.710 0.545Presence/absence of flooding 0.724 0.319Years of cultivation 0.110 0.010Land use 0.086 0.808Position on landscape <0.001 <0.001
When covariates such as position on the landscape, land use and distance from the homesteadwere used simultaneously in the model (Table 19), their inclusion did not change the previous variancestructure (Table 18) considerably. Position on the landscape and land use are commonly used whenmaking agro-ecological zone based fertilizer recommendations while distance from the homestead has been observed to influence fertility in smallholder African holdings. Evidently, identifying the majorcontributors to this variability at the global (regional) scale is not easy. Exploration at lower scales couldyield more meaningful results, thus data analyses will be initiated at these scales.
Table 20: Effects of position on landscape, land use and distance from homestead in the overall variance structure for SOC and ExtracTable P
The project also explored whether farmers were aware of the existence of soil fertility gradientsin their farms. They were asked to rate the fertility of fields into three classes: low, medium and high, and their responses compared to measured values of SOC and extracTable P in soil samples taken from those fields. Farmer perceptions were fairly agreeable with measured values. For example, of the 510 fields rated low, 378 had low SOC and low extracTable P, 110 had low SOC but medium values of extracTable P, while 22 had low SOC and high values of extractable P (Table 20). Fields rated low but with medium
ersted 333 fields as having high so lity and of these, 222 had high m extracTable P
and SOC. Clearly, farmers can id elds with differing fertility levels fairly accurately. In the comingy dies will be car xp edge il quali
As a follow up to the farm char z , two field experim re laid out in April2 sub-locations per district in 5 districts (Vihiga, Siaya, Meru South, Mbale, Tororo). The first e s at diagnosing th st limiti ong N , and S for e productionwhile the second will determine specific site responses to N and P fertilizer for a maize/bean intercrop(
SOC values and low P were 113, while those which had low extractable P but high SOC values were 19.Of the 716 fields rated medium, 514 corresponded to medium values of extracTable P and SOC. Farmra il ferti
entify fieasured values of
ear, two MSc stu ried out to eacteri
lore farmer knowlation work
of local soents we
ty indicators.
004 in 2xperiment aim e mo ng nutrients am , P, K maiz
Table 21).
72
Table 21: Farmers’ assessment of the soil fertility status versus measured values of SOC and extractable
Within-farm soil fertility gradients on soil-based processes underlying ISFM practices P.
Extractable P (num f fields)ber o
Farmer rating: Low M High aledium Grand totLowOrganic C 378 110 22
dium 113 514 89High 19 92 222
510 716 333 1559
510Me(number of 716
333fields)Grand Total
-locations were selected on the basis of w ariation of SOC and m trasting meanSOC. As far as possible, the experiments were laid out s that had been previo racterized by
is project. Where new farms were included, preparations are underway to characterize them followingthe Farm
L
(all data below in kg/ha)
SITE-SPECIFIC RESPONSE TRIAL
(all data below in kg/ha)
Sub idest v ost conin farm usly cha
th Gradients Project protocol. All new farms are located within the Y in affected districts. Each
experiment was laid out in 5 randomly selected farms per sub-location and within each farm, in two fields following a paired plot design. The selected fields represent the extremes of soil fertility status for potential cereal fields, one field having the highest SOC value, the other the lowest. Potential cereal fields located in the bottomland and drainage positions on the landscape were automatically disqualified as werehomestead fields, fields under perennial crops and those under fallow. Treatment layout in bothexperiments was completely randomized.
Table 22: Treatment structure of the limiting nutrient and site-specific response trials.LIMITING NUTRIENT TRIA
Treatment N K Treatm P SP S ent N K
1 0 0 1 0 0
80 60 60 24 2 80 60 60 24
80 60 3 0 22 0 0
80 60 4 20 22 0 0
5 80 60 0 24 5 40 22 0 0
6
0 0 0 0
2
3 60 24
4 60 0
80 0 60 24 6 80 22 0 0
7 0 60 60 24 7 80 0 0 0
8 80 40 0 0
9 80 60 0 0
The experiments will continue throughout 2004. Data from the Limiting Nutrients trial (Table 22) will be used to determine the relative importance of missing nutrients, the potential yield of maize under NPKS application and under inherent nutrient supply, as well as to estimate the recovery fractions ofapplied nutrients using the QUEFTS model. The output from the Specific Site Response trial will be asub-location based yield response curve to N and P application.
Influence of spatial farm variability on Soil Organic Matter and Nitrogen dynamics in Farmer
Field School generated PracticesPeter Ebanyat, Rob Delve, Mateete Bekunda
The broad objective of this Ph.D. research is to increase understanding and enhance use of ISFM practices by targeted application taking into account within and between smallholder farm variability in soilcharacteristics. The specific objectives to be researched are:
73
o To understand the impacts of long-term farm management practices on creation and/or reinforcement of within-farm soil fertility gradients
o To understand the need for targeted ISFM practices within-farmso T on ecological and socio-economic
s ar eTo develop guidelines for implementation of targeted ISFM practices taking into account existing soil fertilit ients
n the fi r the focus s been on c ing the 10 fa n each of villages andunderstanding the term utrient bal , mean partia nces acros llages for N,
and K are shown in Figure 19 (a). N balances were most negative for Keria village (-2.3 kg ha-1). Both P and K
o evaluate the impact of targeted ISFM practicesustainability at f m scal
o
Iy grad
rst yea ha lass rms i threeir systems in s of n ances l bala s the vi
Pbalances at village level were positive although there were variations at farm level in each of the
villages of Onamudian (b), Chelekura (c) and Keria (d). Mineral fertilizer is hardly used in farms across the villages. Equally, the use of organic manures is very low. Grazing and atmospheric deposition contribute a substantial inflow of nutrients to farms at the village level. The greatest losses of N occur through leaching while for P and K from manure dropped outside (Table 23).
Figure 19. Mean partial nutrient balances by village (a), and farm level in the villages of Onamudian (b), Chelekura (c) and Keria (d)
Farm code
AK
010
AK
009
AK
008
AK
006
AK
005
AK
003
AK
002
AK
001
Pa
rtia
l b
al
ha
)
5
0
-
AK
007
AK
004
an
ce
(kg
/
15
10
-5
10
Nitrogen
Phosph
Potassi
orus
um
Farm code
CH
10
CH
009
CH
008
CH
007
CH
006
CH
005
CH
004
CH
003
CH
002
CH
001
Fa
rm p
art
ial b
ala
nc -5
-10
-15
-20
e(k
gh
a-1
)
10
5
0
-25
Nitrogen
Phosphorus
Potassium
Farm code
0987
g h
a-1
)
10
KE
00
6
KE
00
5
KE
00
4
KE
00
3
KE
00
2
KE
00
1
KE
01
KE
00
KE
00
KE
00
Fa
rm p
art
ial b
ala
nce
(k
5
0
-5
-10
25
20
15
Nitrogen
Phosphorus
Potassium
KerCheleOnamu
Fa
ial b
al
10
0
-5
25
20
15
iakuradian
rm p
art
-10
KE 010
KE 007
AK004
KE 010
KE 007
AK004
KE 007
an
ce
(kg
ha
-1)
5
CH001
CH003
KE 010
AK
AK004
CH001CH003
009
CH008
CH005
Nitr
Phosphorus
Pot
-15
-20
-25
ogen
assium
74
Table 23. Major nutrient flows in the at village scale (kg ha-1).Village
A selection criteria for the farms, in terms of socio-economic and biophysical characteristics was thenused to develop a farm typology through Principal Cluster Analysis (Figure 20)
Farm classification
Figure 20. Average linkage dendrogram of farm data using the ochai coefficient
Distance Cluster Combine
C A S E 0 5 10 15 20 25
Label Num +---------+---------+---------+---------+---------+
AK007 6
AK010 9
CH009 18
CH010 19
CH007 16
KE001 20
CH001 10
KE006 25
AK006 5
KE 009 27
AK008 7
KE002 21
CH004 13
KE005 24
CH003 12
KE 008 26
AK002 2
CH002 11
KE004 23
AK001 1
AK009 8
KE003 22
CH006 15
AK004 4
CH008
CH005
17
14
75
Data collected using the NUTMON tool were used in agglomerative cluster analysis using SPSSa er Z score similarity of farms was derived using the using the Ochai coefficient (van Tongeren, 2002) leading to the generation of ogram (Figure 20) above. Cutting off point from c dista yield three clusters. Two far s were cluded in e analy epeculiarity t ded er ne l ac e n s. oc v i.e r e f m y , o o acapital were to r clas h ar ed ta u
re e e to ca ck u incomes (F a lt ta t b s o ff tc a r F h st e e 2 sre o s ne b F re e
rm s ne r o r P and K i Ffollowed by a n n by inp le 24
T
Farm class
ft standardization. (Di) the dendr
luster nce of 22.5 will m ex th sis because therhat ten to clust 28 in o c ass and e h of them into diff re t classe The maj r highly
orrelated ariables . total fa m area, n t arm inco es, famil earnings t tal livest ck units nd totalselected define th ee farm ses whic e inclin wealth s t s (Table 24).
The HRF a very few but hav th highest tal tropi l livesto nits and net farmigure 21 & b). A hough to l farm area is an impor ant varia le it doe n t well di erentiate he farm
lasses becut
use the MRF rathe than HR ave large farm siz s (Figur 2 ). Acros the farm classesnting o f land i gligible ut the LR nt-in som land.
Fa nutrient balances were les gative fo N and p sitive fo n the HR farmsthe MRF nd is mai ly drive grazing ut from TLU (Tab )
Family earning (Ush/yr) 134,201 (-142,100 –778,724)
725,605 (99,467 –1,608,760)
254,447 (1,800 –490,066)
Off farm income (ush/yr) 33,947 (0 - 150,000) 283,000 (0 - 900,000) 40,639 (0 -160,000)
Tropical Livestock UTotal capital (Ush)
(Values in brackets are minimum -maximum)
Figure 21. Farm clusters as determined by plots of (a) total tropical livestock units and total farm area and (b) net farm incomes and total farm area.
Total farmarea (ha)
76543210
To
tal T
rop
ica
l L
ive
sto
ck
Un
its
20
15
10
5
0
Class
MRF
HRF
LR
Total farm area (ha)
76543210
Ne
t fa
rm in
co
me
(in
Ush
)
1200000
1000000
800000
600000
400000
200000
0
-200000
-400000
Class
MRF
HRF
LRF
76
Are
a (
ha
)
7
6
5
4
Figure 22. Total farm sizes ) land utilization ) farm nutrient balances by farm class.
repre ples from all Y samplingf illage, d all fi because the
ssing gr e idand out fields will likely b relation t oil analysis data (200 samples from both
alsed on the main able influen radients within his studies aim at
s emethodology as other Soil adient (SFG) SBF and Nea Spectroscopy will
, S 0 cted for
Activity 1.3 Improved understanding of the relationship between agricultural intensification and
the abundance, diversity and function of tropical soil biota
TSBFI-Africa
On-going work
Standard method for land use inventory and classification (including land use intensity) for
adoption in the BGBD project definedJ.J. Ramisch, J. Huising, P. Okoth, CSM-BGBD partnersAt the annual meeting of the CSM-BGBD project, held in Embu, Kenya, it was agreed that the countryteams would apply a minimum set of standard questions for conducting their baseline surveys of socio-economics, land-use history, current practices and awareness of BGBD in their sites. This set of topics would, at a minimum, include background information on the respondent (i.e.: the land users responsible for the sites at which each of the BGBD inventory sampling activities was taking place + respondents from the broader community to establish how representative the BGBD sample sites were of the urrounding practices), the respondent’s land holdings, current land management practices, and land-useistory, and finally the current awareness of the respondent of below-ground organisms or processes.
e “pre-contact” perceptions of respondents of below-groundrganisms, such as whether or where their influences were strongest or weakest, or whether impacts of
Y samplingf illage, d all fi because the
ssing gr e idand out fields will likely b relation t oil analysis data (200 samples from both
alsed on the main able influen radients within his studies aim at
s emethodology as other Soil adient (SFG) SBF and Nea Spectroscopy will
, S 0 cted for
Activity 1.3 Improved understanding of the relationship between agricultural intensification and
the abundance, diversity and function of tropical soil biota
TSBFI-Africa
On-going work
Standard method for land use inventory and classification (including land use intensity) for
adoption in the BGBD project definedJ.J. Ramisch, J. Huising, P. Okoth, CSM-BGBD partnersAt the annual meeting of the CSM-BGBD project, held in Embu, Kenya, it was agreed that the countryteams would apply a minimum set of standard questions for conducting their baseline surveys of socio-economics, land-use history, current practices and awareness of BGBD in their sites. This set of topics would, at a minimum, include background information on the respondent (i.e.: the land users responsible for the sites at which each of the BGBD inventory sampling activities was taking place + respondents from the broader community to establish how representative the BGBD sample sites were of the urrounding practices), the respondent’s land holdings, current land management practices, and land-useistory, and finally the current awareness of the respondent of below-ground organisms or processes.
e “pre-contact” perceptions of respondents of below-groundrganisms, such as whether or where their influences were strongest or weakest, or whether impacts of
and (a and (b
In the 2004b season sentative soil sam were be taken fields (followinglds (followingprocedure) of selected 10procedure) of selected 10 arms in each varms in each v ata collection fromata collection from elds is necessaryelds is necessarystudies aim at exprestudies aim at expre adients at farm scale. In
e defined inadients at farm scale. Ine defined in
this area, average numbo distance. S
this area, average numbo distance. S
r of fields is 10. Infields, mr of fields is 10. Infields, m
villages taken at depth ofstudies bavillages taken at depth ofstudies ba
0-20 cm) of the fieldssoil vari
0-20 cm) of the fieldssoil vari
will be used for selectiocing the g
will be used for selectiocing the g
n of fields for experimentfarms. T
n of fields for experimentfarms. T
obtaining gradient at farmobtaining gradient at farm cale through simple agfertility Grcale through simple ag
fertility Grgregation. Soil samples wprojects n T
gregation. Soil samples wprojects n T
ill be sampled using the samr Infra-redill be sampled using the samr Infra-red
be used for analysis soilsbe used for analysis soils and data added to theand data added to the FG database. During 2FG database. During 2 05 ISFM options sele05 ISFM options seletesting by farmers will be evaluated.testing by farmers will be evaluated.
sshhSince the project is expected to have greatest impact on awareness and understanding, it was felt that themost important element of the baseline was thSince the project is expected to have greatest impact on awareness and understanding, it was felt that themost important element of the baseline was thoo
10513 10513 10513 10513 10513 10513N =
MRFHRFLRF
0
Class
3
2
1
Total
Rented in
Ow ned
Cultivated
Fallow area
Rented out
105 1010
Class
MRF
0
Fa
rm n
utr
ien
t
-20
-30
-4
ba
lan
ce
(kg
/ha
)
20
10
0
-10
Nitrogen
13 513 513N =
HRFLRF
-50
Phosphoru
Potas sium
77
these organisms were largely beneficial, negative, or neutral as far as local priority crops or other land use activities were concerned.
The standard set of methods was developed and circulated in mid-2004. However, it is not clearto what extent this set has actually been incorporated into the actual baselines conducted within the teams,as the expected inter-team communication and sharing of both survey instruments and preliminary results has not taken place. Repeated efforts at stimulating such interactions using the project listserve and directe-mailing have not been successful. The greatest exchanges so far have been from direct, personalinteraction, which typically only involves one country team at a time, usually during field visits by theproject coordination.
TSBFI-Latin America
Published Work
A global assessment of mycorrhizal colonization of Tithonia diversifolia
. A. Sharrock1, F. L. Sinclair1, C. Gliddon2 , I. M. Rao3, E. Barrios3, P. J. Mustonen4, P. Smithson5 D. L.
gricultural and Forest Sciences, University of Wales Bangor, LL57 2UW, UK. School of
rhizas was found. The degree of colonisation by AM fungi was on verage 40%, but ranged between 0 and 80%. No mycorrhizal colonisation was found in the samples
s, Mexico, Kenya and Rwanda), Tithonia
rms mainly associations with Glomaceae. Only in one location in Nicaragua were associations withaceae) found.
positive feedback cycle. In marginal farming environments, such an increase in soil quality could have
RJones1 and D. L. Godbold1
1School of A 2
Biological Sciences, University of Wales Bangor, LL57 2UW, UK 3Centro Internacional de Agricultura Tropical (CIAT), A. A. 6713, Cali, Colombia.4Centro Agronómico Tropical de Investigación y Enseñanza (CATIE), Apdo. 7170, Turrialba, Costa Rica. 5International Centre for Research in Agroforestry (ICRAF), PO Box 30677, Nairobi, Kenya.
Mycorrhiza 14: 103-109 (2004)
Tithonia diversifolia (mexican sunflower), is a shrub commonly used as a green manure crop in Central and South America, Asia and Africa, as it accumulates high levels of phosphorus and other nutrients, even in depleted soils. In root samples collected from the global distribution of Tithonia we examined the degree of mycorrhizal colonisation and estimated the families of associated arbuscular mycorrhizal (AM)fungi. No colonization by ectomycoracollected from the Philippines or in one each of the Rwandan and Venezuelan samples. Throughout its global distribution (Costa Rica, Nicaragua, Indonesia, Hondurafoother families (Acaulospor
On-going Work
The Effects of the Quesungual Agroforestry System of Western Honduras on Soil Macrofauna and
Soil Quality
N. Pauli1,2,3, E. Barrios1, T. Oberthur2 and A. Conacher3
1Tropical Soil Biology and Fertility (TSBF) Institute of CIAT 2Land Use Project, CIAT 3University of Western Australia, (UWA), Perth, Australia.
Soil contains one of the most diverse assemblages of organisms of any habitat on earth and still soil biota remains largely unexplored. Although soil biota performs crucial ecological functions in natural andagricultural ecosystems, the relationships between soil macrofauna diversity, soil characteristics and land-use are poorly understood, as are the mechanisms that govern these interactions. To date, little attentionhas been paid to the potential of agroecosystems to conserve and manage biological diversity within soil. Because soil macrofauna can have positive influences on soil fertility due to the effects of their activities on soil physical, chemical and biological properties, agricultural practices that promote diversity andabundance of soil macrofauna may actually promote improvements in soil quality and productivity in a
78
important ramifications for food security, income and quality of life. The overall objective of this study is to determine the effects of the Quesungual agroforestry system on the diversity, distribution andabundan
y. The exploration of spatial and temporal hetereogeneity in soil properties and soiluna communities relative to patterns of vegetation and land usewill be part of this study.
recognition that the integration of local knowledge and scientific knowledge canad to insights into sustainable management and reduce risks associated with farming difficult
as hillsides. There has been relatively little research into farmers’ perceptions, values nd observations of soil macrofauna diversity and community composition, although some traditional
species, such as earthworms,
be, used as an indicator of soil fertility.
lity and pest management (ISFPM)
dnut (Arachis hypogea) on succeeding sorghum weretudied during three years (2000 to 2002) in a weakly acid Ultisol of the agronomic research station of
West, 11o 6’ North and 405 m altitude), located in the Guinean zone of Burkina Faso. wo field agronomic experiments were used. The first experiment was a factorial design in a split plot
trogen fixation (BNF), legume effects on succeeding sorghum yields, N recovery anderiment, Nitrogen Fertiliser Equivalencies (NFE)
0), a simple randomised block experimentndnut-sorghum, cowpea-sorghum, maize-sorghum and sorghum-sorghum) and
rghum was sown on all plots and each main
ce of soil macrofauna and the implications for soil quality.The Quesungual agroforestry system presents a prime opportunity for studying the relationships
and feedback mechanisms among land use, soil characteristics and plant biodiversity and soil macrofauna,and for examining whether this system can benefit both farmers and biodiversity conservation. This research project will concentrate on relationships between soil quality and the Quesungual system,focusing on the diversity, abundance and ecological functions of soil macrofauna as a component and indicator of soil qualitfa
There is growingleenvironments suchafarmers in areas of the tropics are known to regard the presence of particularas indicators of soil fertility. This study will examine farmers’ perceptions of soil biodiversity, and investigate whether soil macrofauna is, or could
Activity 1.4 Development of an integrated approach to soil ferti
TSBFI-Africa
Published Work
Nitrogen contributions of cowpea and groundnut to soil nitrogen, N fertiliser recovery and
nematode infections in legume-sorghum rotations in the Guinean zone of West Africa
B. V. Bado1, A. Bationo2; M. P. Cescas3; A. Sawadogo1 and B. Thio1
1Institut de l’Environnement et de Recherche Agricoles (INERA), Centre Régional de Recherche
Agronomique de Farakô-Ba, P. O. Box 910 Bobo-Dioulasso, BURKINA FASO 2The Tropical Soil Biology and Fertility Institute of CIAT, P. O. Box 306773Département des Sols et Génie Agroalimentaire (FSSA), 2219 Comtois, Université Laval Ste Foy Québec
(QC) G1K 7P4 CANADA
The effects of cowpea (Vigna unguculata) and grounsFarakô-Ba (4o 20’Tarrangement with four replications using crop rotations as first factor and fertilizers as second factor. Biological ninematode infections were measured. In the second expof groundnut and cowpea were studied. In the first year (200with four treatments (groufour replications was used. During the next year (2001), soplot was split into five subplots and five rates of N fertiliser (0, 20, 40, 60 and 80 kg N ha-1)appliedsubplots. Then, the experiment became a factorial 4 x 5 design in a split plot arrangement withfour replications. The results show that compared to continuous cultivation of sorghum, cowpea andgroundnut increased succeeding sorghum yields. Cowpea was the most efficient in increasing the yield ofthe succeeding sorghum. Legume-Sorghum rotations increased sorghum grain yields by 60 to 300 %compared to continuous sorghum. The N fertiliser equivalency of groundnut (35 kg N ha-1) was higher than that of cowpea (25 kg N ha-1), indicating that using these legumes like precedent crop may involvean economy of 25 to 35 kg N ha-1 in mineral fertilisers. Groundnut fixed 8 to 23 kg N ha-1 and the percentage of N derived from the atmosphere varied from 27 to 34 %. Cowpea fixed 50 to 115 kg N ha-1
79
and the percentage of N derived from the atmosphere varied from 52 to 56 %. Compared to the mineralNPK fertilizer alone, legumes fixed more nitrogen from the atmosphere when phosphate rock (PR), dolomite or manure was applied with mineral fertilizers. Compared to continuous sorghum, Legume-Sorghum
. Barrios , G. Mahuku , N. Asakawa , C. Jara , J. Navia and L. Cortés
cional de Colombia, Palmira,Colombia
del Valle, Cali, Colombia.
ocietal demands for agricultural sustainability and biodiversity conservation has been ached in the past decade (UNCED-1992). New approaches to continuing problems, like soil
nt approachesowing a better control of soil
soil biota. Use of greening from (i) protection of the
soil biological activity and diversity of microorganisms, which in turn can lead
rotations increased soil mineral nitrogen. The soils of Legume-Sorghum rotations providedmore N than those of continuous cultivation of sorghum. A better use of N fertiliser was also observed inlegume-sorghum rotations. In continuous sorghum, fertiliser N use efficiency (NUE) was 20%. But in Cowpea-Sorghum and Groundnut-Sorghum rotations, NUEs were 28 and 37% respectively and thehighest total N uptake by sorghum was observed in legume-sorghum rotations. Compared to continuoussorghum, groundnut-sorghum rotations decreased soil and sorghum infection by nematodes whilecowpea-sorghum rotations increased nematode infections.
TSBFI-Latin America
On-going Work
Integrated Soil Fertility/Pest and Disease Management approaches to address root-rot problems in
common beans1 2 1 2 3 4E
1Tropical Soil Biology and Fertility (TSBF) Institute of CIAT 2Bean Project (CIAT) 3Universidad Na4Universidad
Consensus about sredegradation and soil pest and diseases, are then needed in order to achieve agricultural sustainability. Our overall working hypothesis in this study is that combining soil fertility and pest managemewould provide a unique opportunity to exploit synergies allfertility/pest&disease limitations to crop productivity than either approach alone.
The management of organic matter is crucial to the activities of themanures can have a multi-faceted beneficial effect on crop productivity arissoil from erosion; (ii) increased nutrient cycling; (iii) synchronized nutrient release and uptake by theplants; and (iv) increase into minimized damage and loss from soil borne pathogens, and increased activity of beneficialmicroorganisms. However, different sources of green manure can have different effects on the balancebetween populations of harmful and beneficial organisms because they have different rates ofdecomposition and nutrient release as well as different impact on soil moisture and temperature thatinvariably affects relative population sizes. For this reason, we considered important to evaluate the effect of different sources of green manure on three key functional groups of soil biota: 1) pathogens, 2)microregulators and 3) microsymbionts. We are studying the population dynamics of soil pathogenic fungi (Fusarium, Sclerotium, Macrophomina, Rhizoctonia and Pythium), soil nematodes (discriminatedby feeding habit), soil microsymbionts (mycorrhiza, rhizobia) during cultivation of common bean in soils infested with pathogenic fungi. Evaluations were carried out by: a) directly identifying and quantifyingdifferent soil biota from functional groups mentioned above and by quantifying growth of external hyphae as a measure of AMF activity and b) indirectly, by evaluating the incidence of disease on susceptibleplant genotypes and by plant infection test for determining the native rhizobia symbiotic potential. The relative position of these three groups in the soil food web suggests the potential for soil organic mattermanagement to reduce soil pathogenic fungi populations and incidence in bean plants by change inducedin soil moisture and temperature, nutrient availability and interaction with other soil organisms.
An experiment was established in CIAT’s Santander de Quilichao Research Station, using a plotthat has a history of high incidence of root rot pathogens. The plots were planted with a root rot susceptible bean variety A 70. Immediately after planting, the plots were covered with three green
80
manures treatments: (1) rapidly decomposing Tithonia diversifolia(TTH); (2) intermediate rate ofdecomposition (but greater soil cover due to leaf morphology) by Cratylia argentea(CRA); (3) slow decomposing (Calliandra calothyrsus (CAL) at a rate of 6 ton ha-1; and (4) control (no green manureadded). The experiment was replicated five times. Soil samples (0-10 cm) collected during the croppingseason included at least planting and harvesting time. Samples were collected within rows and betweenrows, to measure the effect of the rhizosphere of bean plants on the soil biota studied.
Diversity of soil pathogenic fungi: Preliminary data revealed that plots receving CRA had asignificantly less fungal diversity (p<0.05) than plots receiving the other sources of green manure or the control (Figure 23). No significant differences were observed between the other treatments and the control. However, since this is the second season after initiation of the experiment, it is still too early to
ake sound conclusions.m
12
14
10H
8
6
0
2
4
CAL CRA TTH CON
Treatments
16
18
20
Figure 23. Diversity of soil-borne fungi in plots receiving or not receiving different sources of greenmanure. H represents the Shannon Wiener diversity index.
The most frequently isolated fungus was Aspergillus (A) in all treatments, while Macrophomina(Ma) and Rhizoctonia (R) were the least isolated fungi (Figure 24). Other fungi that were isolatedincluded Fusarium (F), Penicillium (P), Humicola (H) and Mucor (M). The presence of Penicillium is interesting, as some species of this fungus are known to solubilize phosphorus. Humicola is a fungus that has been found to be involved in decomposing organic matter, and this was found in abundance in plots receiving Calliandra. Several fungi were isolated that are currently being classified. These weretentatively placed under the “unknown” group (D). It is possible that some of these fungi could be potential biological control agents. Although Macrophomina has been observed in the past in highfrequencies and incidence on infected plants, this fungus was not detected in the soil samples analyzedthus far. It is possible that the method of analysis that is used leads to the exclusion of this fungus, or thehigh incidences observed under field conditions results from seed-borne inoculum.
81
0
100
200
300
400
500
600
Nu
mb
er o
f co
lon
ie
700
800
900
F P A H M Ma R D
Fungi
s
CAL
CRA
TTH
CON
Frequency of different fungi isolated from plots receiving none (control)and slow decomposing green manure or the control.
soil nematodes: Total number of soil nematodes was always higher in the row thlighting the importance of the bean plant rhizosphere effect (Figure 25). On a
atodes were found when Tithonia was applied to the soil and the overall order was TTH>CRA>CON=CAL . Taxonomic identification of nematodes and classification into feeding gro
nd should help in the interpretation of abundance trends observed.
Figure 24. or a fast,intermediate
Abundance of an betweenthe rows high verage greaternumber of nem
upsis on going a
igure 25. Total number of nematodes from plots receiving a fast, intermediate and slow decomposinggreen manure or the control
Incidence of root rot pathogens: Significant differences were observed in the incidence of root rots insome treatments when compared to the control (Figure 26). Application of Calliandra, and Tithonia
significantly reduced disease incidence (p<0.05), while a slight increase in disease incidence was
200
250
0
50
100
150
CAL CRA TTH CON
Treatments
300
350
# N
em
ato
de
s /
Kg
So
il
In row Between rows
F
82
observed in plots receiving Cratylia. Analysis of the samples collected from these plots revealed that mostof the root rot symptoms were caused by Macrophomina phaseolina and Fusarium solani, while Rhizoctonia solani was occasionally isolated. Significant yield increases were observed for plots treatedwith Calliandra (10%) and reduction for plots receiving Tithonia (-29%) (Figure 26). Although a slight increase in yield was observed (1.2%) for plots receiving Cratylia, this was not significantly different from the control plots.
Figure 26.
ments someinitial trends can be identified. Compared with the control application of Calliandra resulted in increased bean yield, reduced incidence of root rots and low nematode abundance. In the case of Cratylia, there were minor differences in root rot incidence, yield and nematode abundance (in row) when compared tothe control. Although disease incidence was low in plots receiving Tithonia, bean yield was alsonegatively affected. Taxonomic identification of nematodes would help to understand if high nematodepopulations in TTH were involved in reducing bean yield. In addition, the impact of treatments on thebean plant symbiosis with mycorrhiza and rhizobia needs to be included for a more complete explanationof yield differences encountered. Nevertheless, yield differences were likely also influenced by acombination of physico-chemical factors including differences in nutrient release by the three greenmanure sources.
While at this early stage application of Calliandra seems to offer the best results we need to xamine how transient or cumulative these effects are and the mechanisms of action involved. The
y been grouped under the “Unknown” group for potential
-20
-15
-35
-30
-25
Treatments
-10
-5
0
5
10
15
CAL CRA TTH CON
% D
iffe
ren
ce
Incidence Yield
Incidence of root rots and yield of the bean genotype A 70, grown in plots with or withoutdifferent types of green manures expressed as a percent of control treatment.
First results indicate that despite the relatively limited time of green manure treat
epotential exists that unknown beneficial microorganisms are promoted in the soil by green manures andthus can potentially be used to manage root rot pathogens and/or for promoting plant growth. We are urrently evaluating fungi that have tentativelc
antagonistic effects, as well as Penicillium species for their ability to solubilize phosphorus.
83
Assessing the effects of Bt Crops and Insecticides on Arbuscular Mycorrhizal Fungi and Plant
Residue Carbon
M. Devare1, J. Thies1, J. Duxbury1, E. Barrios2, W. Wu3, L. Allee4 and J. Losey4
1Department of Crop and Soil Sciences - Cornell University, Ithaca, USA 2Tropical Soil Biology and Fertility (TSBF) Institute of CIAT 3Department of Microbiology, Zhejiang University, China,
of Entomology, Cornell University, Ithaca, USA
market for transgenic crops is expected to be US$ 8 billion by 2005, increasing to US$ 25 billion by 2010. This new technology has been most rapidly deployed in industrialized countries, but the proportion of transgenic crops grown in developing nations has increased steadily each year, from 14% in1997 to 24% in 2000. The global area planted with these crops increased more than 25-fold between 1996and 2000, to about 44 million ha, with plants engineered to express Cry insecticidal proteins from the bacterium Bacillus thuringiensis (Bt) representing about 25% of these crops. Estimates indicate that Bt technology products could save farmers about US$ 2.7 billion of the US$ 8 billion or so spent annually on insecticides worldwide.
The enormous progress made in developing and disseminating insect-resistant Bt crop varieties isexciting from the perspective of increasing productivity, but worldwide public opinion is still veryreserved regarding the acceptability of Bt crops. The greatest constraint appears to be the uncertain risks toenvironmental and human health posed by these crops compared to the insecticides normally used tocontain pest damage. This study addresses the lack of knowledge concerning the potential environmentalimpact of Bt technology vs. insecticides on non-target organisms and soil biology, biochemistry andecology. There have been few assessments to determine if Bt crops pose any risk to the abundance and diversity of detritivore soil arthropods and microorganisms in the soil. Further, it is not known whether potential variations in the dynamics of carbon (C) allocation and in-field rates of residue decompositionbetween transgenic and non-transgenic plants will alter C turnover and/or sequestration in soil.
Recent results suggests that a number of Bt crops exhibit slower residue decomposition rates than their non-Bt counterparts; however, this research is being conducted with finely chopped residue under ontrolled laboratory conditions, and is not directly applicable to the field. It is important to know if rates
n the engineered plant or Btxin-mediated effects on soil organisms such as the arthropods that initiate residue degradation in soil. If
the dec
Activity
ublished Work
4Department
The world
cof Bt and non-Bt residue decomposition do indeed vary consistently during multiple years of field trials,and to determine if observed differences are a result of inherent changes ito
omposition rate of Bt and non-Bt crops does differ, and Bt crops use significantly less insecticidethan their non-Bt isolines, then the potential for decreasing greenhouse warming potential (GWP) throughincreased C sequestration in soil by the slower-degrading Bt residues and decreased CO2 and carbonmonoxide emissions through reduced use of insecticides should be assessed.
The objective of this project is to determine the effect of Bt corn (US), cotton (Colombia), and rice(China) on soil organisms, with an emphasis on the symbiotic association between plant roots andarbuscular mycorrhizal (AM) fungi and on soil arthropods important in the primary decomposition of cropresidues. We will also compare the rates of decomposition and the fate of Bt vs. non-Bt residue C andevaluate the potential for increasing C sequestration in soil using Bt crops. The crops have been chosen sothat we can evaluate effects on soil organisms under both aerobic and anaerobic conditions:
1.5 Improved understanding of scaling–up and out processes for improving soil health and
fertility
TSBFI-Africa
P
84
Estimating yields of tropical maize genotypes from non-destructive, on-farm plant morphological
measurements
P Tittonell, B Vanlauwe, PA Leffelaar and KE GillerAgriculture, Ecosystems and Environment, 2004, In Press
Maize is the main grain crop grown in the highlands of sub-Saharan Africa, on a broad range of soilability has been reported at different scales,
iting and growth-reducing factors. Maize
urate to estimate both total above ground dry matter and grain yields per plant (r 0.76
P. Titto
ified using information on product
ieces of landnd relied on low wages derived from working for wealthier farmers. Farms of types 3 and 4 were
es in household wealth and production orientation between farm types were reflected in the atterns of resource flow at farm scale. Nutrient resources and land management practices (e.g. fallow)
rmously between sub-locations. Both inherent soil properties and management explainede variability found for soil fertility status. Texture explained the variation observed for soil C and lated total N between sub-locations, whereas P availability varied mainly between farm types as
se.
fertility and management conditions. Important yield varireflecting the intensity and spatial distribution of growth-limyield estimation represents a valuable tool to assess within-farm variability in soil fertility through crop performance. The objective of this study was to develop mathematical relationships between plant morphological attributes and grain yield of tropical maize genotypes, based on plant allometriccharacteristics. These models were used to estimate maize yields and the estimates were validated against independent data collected from experimental and farmers’ fields in western Kenya. Three commercialhybrids and three local varieties were considered. Multiple linear regression models including plant heightand cob length and diameter as explanatory variables, and simple linear regressions including only plantheight, were the most acc
2 to 0.91). Average values for the harvest index ranged between 0.34 and 0.42, describing a curvilinear relationship with total aboveground biomass per plant. Yield estimations on ground area basis for farmers’ fields were somewhat less accurate due to the variability in plant density. Plant height measurements can be easily taken at any moment after maize flowering, and used in simple linear regression models, providing acceptably accurate estimations of maize yield.
Completed Work
Exploring diversity in soil fertility management of smallholder farms in western Kenya. I.
Heterogeneity at region and farm scalenell, B. Vanlauwe, P. A. Leffelaar, E. Rowe, K. E. Giller
The processes of nutrient depletion and soil degradation limiting productivity of smallholder Africanfarms are spatially heterogeneous. Causes of variability in soil fertility management at different scales of analysis are both biophysical and socio-economic. Such heterogeneity is categorised in this study,quantifying its impact on nutrient flows and soil fertility status at region and farm scales, as a first step in identifying spatial and temporal niches for targeting of soil fertility management strategies andtechnologies. Transects for soil profile observation, participatory rural appraisal techniques and classical soil sampling and chemical analysis were sampled across 60 farms in three sub-locations (Emuhaia,Shinyalu, Aludeka) representing the variability found in the highlands of western Kenya. Farm systemmodels were developed for five representative farm types that were ident
ion components of the farm system, farm assets, family structure, labour and income sources, and considering household objectives and main constraints faced by farmers. Soil fertility management andnutrient resource flows were studied for each farm type and related to differences in soil fertility status atfarm scale. The farm system models were consistent across sub-locations. Farm types 1 and 2 were the wealthiest, though the former relied on off-farm income and farmed small pieces of land while the latterfarmed large land areas mainly with cash crops. The poorest farm type 5 also farmed small paintermediate representing diverse crop production strategies for self-consumption and the market.Differencpalso differed enothreaffected by input u
85
On-going Work
Construction of wealth classes and farm typologies to guide the implementation of site-specific
ganda and Western Kenya
to manage their soils. Such formation will also guide future activities aiming at developing and testing farm class-specific soil
It is envisaged that the study will involve socio-economic surveys, farm mapping, participatory
l be to test the robustness of farmer classification across theganda (Tororo and Mbale) and western
that the study will involve construction and interpretation of resource flow mapsand documentation of local plants and soil characteristics commonly used by farmers as indicators of soil quality, backed up by conventional soil analyses, identification of common soil fertility management
integrated soil fertility management options in Eastern U
J Ogada, G Okello, A Muriuki, and B Vanlauwe In East Africa, decades of nutrient mining without adequate nutrient replenishment have taken their toll on the soil’s nutrient stocks, usually resulting in declining crop yields and land degradation. The need toreplenish soil fertility is pertinent, but is no mean task because of the financial implications required to rectify the problem. The ‘Farm Gradients’ project, is attempting to tackle the problem and its goal is to develop a common framework for farmers, researchers and extension agents to assess and manage within-farm soil fertility gradients in an effort to develop more relevant fertilizer recommendations assuming thatwithin-farm soil fertility gradients exist and vary according to site, inherent soil properties, farmermanagement style and farmer resource endowment.
In 2003, the Farm Gradients project characterized 250 farms in 3 benchmark sites located in 6districts East African: western Kenya (Siaya and Vihiga), eastern Uganda (Tororo and Mbale), and central Kenya (Meru South and Mbeere). Soil analyses revealed that within farm soil fertility variation iswidespread in East Africa’s smallholder farms and that there are large differences between districts. One of the next logical steps in order to explain the main drivers for the creation of this variability in soil fertility status at the farm level is to construct wealth classes or farm typologies, knowing that farmers’access to resources is likely going to influence the options that farmers haveinfertility management options.
wealth class identification, and multivariate analysis to cluster various households along similar classes. Another important aspect of the study wilvarious target districts. The studies will be carried out in eastern UKenya (Vihiga and Siaya) districts and will commence immediately.
Understanding field-specific soil fertility management based on resource flow analysis and
identification of local soil quality indicators in Eastern Uganda and Western Kenya J Ogada, G Okello, A Muriuki, and B Vanlauwe In East Africa, decades of nutrient mining without adequate nutrient replenishment have taken their toll on the soil’s nutrient stocks, usually resulting in declining crop yields and land degradation. The need toreplenish soil fertility is pertinent, but is no mean task because of the financial implications required to rectify the problem. The ‘Farm Gradients’ project, is attempting to tackle the problem and its goal is to develop a common framework for farmers, researchers and extension agents to assess and manage within-farm soil fertility gradients in an effort to develop more relevant fertilizer recommendations assuming thatwithin-farm soil fertility gradients exist and vary according to site, inherent soil properties, farmermanagement style and farmer resource endowment.
In 2003, the Farm Gradients project characterized 250 farms in 3 benchmark sites located in 6districts East African: western Kenya (Siaya and Vihiga), eastern Uganda (Tororo and Mbale), and central Kenya (Meru South and Mbeere). Soil analyses revealed that within farm soil fertility variation iswidespread in East Africa’s smallholder farms and that there are large differences between districts. The next logical step to tackle is to try to understand how field-specific soil fertility management hascontributed to the generation of this variation. This study will be linked with identification of local soil quality indicators (LSQI) underlying the field-specific management practices. Such information wouldthen allow all stakeholders to assess, discuss, and manage within-farm soil fertility gradients to enhance the use efficiency of applied inputs.
It is envisaged
86
practices and farmer perceptions on linkages between soil management practices and soil quality. Thetudies will be carried out in eastern Uganda (Tororo and Mbale) and western Kenya (Vihiga and Siaya)
ling Rural Innovation in Africa: Lessons from multi-
national agricultural research institutes, extension services
training events and joint field visits, regular communication andinforma
itutionalizing partnerships beyonddividual personalities. Overcoming the challenges of quality public-private partnerships between
markets.
alait, Tororo District; Busumbu and Mbale, MbaleDistrict
have been randomly selected from each wealth class to carry out a resourc
sdistricts and will commence immediately.
Building and Sustaining Partnership for Enab
institutional partnership that links smallholder farmers to markets
Draft journal paper
Agricultural research and development organizations are increasingly under pressure to build partnerships with a range of stakeholders, institutions and organizations of different characteristics, sizes, levels and objectives. What is not obvious however, is how to build such partnerships, and to cope with obstaclesand challenges to effective partnerships to make small-scale farming more market orientated. This papersreflects on partnership experience of Enabling Rural Innovation (ERI), a multi-institutional and multi-stakeholder partnership between international and
, non governmental organizations, farmers’ organizations, and the private sector for linkingfarmer participatory research and market research in a way that empowers farmers to better manage theirresources and offers them prospects of an upward spiral out of poverty. The paper highlights several important factors that contribute to the success of partnership, and discusses strategies used for coping with the obstacles to quality partnerships. Critical success factors include a shared vision and belief incommunity-based participatory approaches, strong and consistent support from senior leadership, jointresources mobilization and resources sharing, evidence of impacts and mutual benefits, and sharing credit and recognition. Other important factors include building human and social capital through interpersonalrelationships and friendships,
tion sharing. The changing policy environment, and current reforms in agricultural researchemphasizing partnerships and participatory approaches, provides a conducive environment for qualitypartnership. However, sustaining quality partnerships is challenging. This requires creative strategies for coping with some obstacles such as staff turnover and over commitment, expectations of individualbenefits, sustainable funding mechanisms, and challenges of instinagricultural research institutions, government services and private sector, especially business services andmarket institutions, will be critical for achieving success in linking smallholders farmers to
Typologies developed to relate household resource endowments to on-farm soil fertility gradients
and their management
J.J. Ramisch1, A. Muriuki1, B. Vanlauwe1, I. Ekise1; M.T. Misiko2; J. Okello3; J. Ogada4
KenyaTo study the social aspects of within-farm soil fertility gradients, a survey was conducted in eight
sub-locations in Western Kenya (Ebusiloli and Emusutswi, Vihiga District; Nyalgunga and Nyabeda,Siaya District) and Eastern Uganda (Kayoro and K
), using participatory methods (facilitated community meetings and small group work with key informants) to be followed up with formal interview schedules. The study provides a baseline forcharacterizing the reasons underlying the differential management of local farms (various fields), addressing both internal (e.g., resource endowment), and external (e.g., access to input/output markets)factors. The indicators of wealth and soil fertility management practices identified are now being used toboth a) determine the degree to which the households identified through the spatially-guided “Y-sampling” process are representative of their communities (i.e.: the sub-locations the Y’s are designed to characterize) and b) to provide a resource-endowment basis on which to stratify the sample population.On this second point, ten informants
e flow mapping exercise after the survey. Many of the wealth indicators mentioned were common to all sites. These included livestock,
farm size, access to transport; use of hired labour; use of rented land, use of inorganic fertilizers, the food
87
security afforded by the crops harvested from the farm, reliance on off-farm income, and reliance on-farmincome such as cash crops or the sale of milk. In general, the community members who met in each ofthe study sites provided very comprehensive lists of criteria that would distinguish three wealth classes
igh, medium, and low) relevant to the ability to manage agricultural land. Examples of these criteria are (hgiven in Tables 25a and b for Ebusilloli sub-location in Kenya, and are typical of the criteria andsubsequent partitioning of households generated in the other sites.
Table 25a: Indicators of the various wealth strata, Ebusiloli sub-location.
3+ meals a day, balanced diets, meat 3+ meals a day, balanced diets, meat 2 meals a day, usually. Few only haveis frequently part of diet is not frequently part of diet dinner (s. potatoes), not balanced
diets
1-2 acres of Tea and other cash crops Appx. ¾ acres of tea, other cash crops Not tea or other cash crops
Off-farm income: pension, rental Off-farm income: few have low- Wage labour, few chouses, salary, remittance, business(retail shtea, etc.
paying-job: pension, salary, boys, maids, few can sell milk from1op); On-farm income: milk, remittance, small rental houses or
Transport – wheelbarrows, donkeycarts, hired labourers
Transport – few have wheelbarrows,mostly family labour, bicycles
Transport – family labour
Seek veterinary services for mostlivestock diseases
Seek veterinary services dependingon type of livestock diseases,sometimes rely on herbalists
Mostly rely on herbal livestockdoctors
Sell surplus FYM, @ 50 perwheelbarrow
Buy FYM. Some buy and sell (trade)FYM
Do not buy FYM. Some rely onokhwechekhwa animals, gift fromclass I.
Buy Napier, @ 20 per bundle (local cows would need 6/day)
50-50, sell or buy Napier Sell Napier for income, do not givetheir livestock
Means “to give out livestock” under an agreement that allows the keeper to derive all the benefits, including sale ofmilk, except selling the animals.
1
88
Table 25b: Distribution of households in social strata, Ebusiloli.
ClassesSite (Village)
Class 1 (10%) Class 2 (61%) Class 3 (29%) Total
Emanyonyi 9 96 22 127
Mwilonje 10 65 42 117
Mukhombe 18 57 25 100
Wobaria 10 54 39 103
Total 47 272 128 447
Per cent 10 61 29 100
stingly, inIntereidentified as
all of the e v be Class 1 (usually a t “r hly
s about whss 4 to refle s
“lazy”, “drunkards”, or other dev xpected norm of rural behaviour. Inevitably thesemately include
While there is great disp the extremes of “high” (wealthy) and “low” (poor)y given site, there is eight
study sites. This is also true for t ical data being collected, and complicates the potential for vi to
egra between wealth class, soil fertility status, and nt the ithout being too
xplana
scaling
mpo
ha
researchers and farmers have battled to arrest soil fertility degradation. Over the last decade, this battle
ers in gm -based initiative called “Strengtheningn tio pal
in the learning and adap udies have been undertaken to identifyIn s pread, theyb ect sites.
SF edge-ISFM
herefore invo sses, su dialogue over long periodstion an ssingwith re
This review of ISFM technologies, with regards to the poss scaling up shows two vitaldifferent w
process amongst farmers, by building on t the natural sciences. Secondly, it is difficult to generate and extrapolate knowledge-generation processes for scaling up.Farmers based their knowledge generation processes on the balance of possibilities after evaluation of the
discussions there tended to berm translated as “wealthy” or
ery few households that couldich”) and there were often hig
contentious discussionwhether to allow a Cla
o qualified as Class 2 or 3. There were also intense debates about ct socially problematic householdiations from the e
whose members were perceived as
households were ulti d in Class 3. arity between
resource in an also extreme variation between thehe bio-phys
averages endowments of the
cross-site comparisons of behameaningfully abstract and int
our and performance. The chate the relationships
llenge for the coming year is
management practices to presesimplis
findings that are relevant totory pow
studied areas wtic or dilute in their e er.
Challenges to successfully
M.T. Misikoup knowledge-intensive ISFM re
2
gimes1; J.J. Ramisch2
1 ersWageningen Agricultural Univ
Paper presented at AFNET Sy
ity; TSBF-CIAT
sium in Yaoundé, 17-21 May, 2004
Smallholder farmers in Sub-SaNevertheless, these livelihoods
aran Africa significantly depenre constrained by inherent low
d on land for their livelihoods.soil fertility. For many decades,
has resulted in the development of Integrated Soil Fertility Management (ISFM) technologies. Between2001 and now, TSBF researchthese technologies to local circuFolk Ecology”. This initiative imethods
and local smallholder farmersstances under the communityvolved participatory demonstratation process. Follow up stitial results showed that al
western Kenya have been adaptin
n-trials and dialogue as princi
successful cases of this process.are promising and benefits are to
thoughe scaled up for wider use by farmers
uch cases are not widesin areas beyond the proj
Nevertheless, scaling Iintensive and demanding, andtechnologies should t
M technologies is complicated. Itheir adaptations and applicationlve simple practical proce
SFM technologies are knowls are diverse. Scaling upstained
aimed at knowledge generaselected ISFM technologies
d sharing. This paper provides ingards to their inherent scalability.
sights into this topic by discu
ibility oflessons. Firstly, those ISFM technknowledge generation
ologies were applied in ays; their use results in a complexhe power of
available evidence and on the basis of longterm experience. Therefore, scaling up ISFM technologiesshould focus on mastering soil ecological processes rather than the “facts” of yield data generated in
89
experimentation events, which lead to the impression that research is about certainties. Scaling up ISFMof ractical processes that farmers can understand, adapt and share with other
farmers while interacting with researcher be done -farm ents, suchme s
resid and interactive effects of the legumes with rest of the system h time, localgener seful knowledge regarding how these legu respond to their h .rch pr s needs long-term er empowerment a ialogue that leads to demystification
from “known certainties and facts”, to continuous processes that generate better opportunities.
atin America
Publish
Tropica
rvations and refers to local knowledge about soils, whichhows that the classes identified in the local soil quality classification are consistent with results obtained
ess of ecological processes tionships between key soil characteristics and management options. It is
e with uncertainty introduced by a rapidly changingforces and climate change. We
should consist simple ps. This can still
as promiscuouslyin “classical” on
g soybeans, but needs to focuexperim
as simple plots of screeningmore on the
grain legu s such nodulatintheual
ate u. Wit
farmers willSuch a resea
mes ighly varied soilsoces farm nd d
of science
TSBFI-L
ed Work
Increasing the relevance of scientific information in complex hillside environments through
understanding of local soil management and agronomic uncertainty
T. Oberthür1, E. Barrios2, S. Cook1, H. Usma1 and G. Escobar1
1Land Use Project,CIAT2 l Soil Biology and Fertility (TSBF) Institute of CIAT
Soil Use and Management 20: 23-31
This article explores the question of how scientific information can improve local agronomic managementusing concepts of uncertainty classification and uncertainty management. Information and data on local soil fertility management based on a local classification system of soil quality were collected from a smallwatershed in Cauca (Colombia). The analyses suggest that farmers hold local knowledge about soils at two levels. The first is based on empirical obsesusing measured soil parameters. At a second level, farmers have some awarenand appropriate use of relaargued that local knowledge is not sufficient to copagriculture, including, increasing land pressure, unpredicTable markethave suggested how scientific knowledge can contribute to the solution, based on an analysis that relates Cohen’s (Hueristic reasoning about uncertainty: an artificial intelligence approach. Pitman London, 1985) and Rowe’s (Risk Analysis 14, 743-750, 1994) uncertainty concepts to local knowledge.
Activity 1.6 Methods for integrating and strengthening local and technical knowledge of soil
processes, soil quality, ecosystem services and BGBD developed
TSBFI-Africa
Completed work
Interactive Techniques Manual: Tools, methods and lessons for Integrated Soil Fertility
Management research and dialogue applied and adapted under the ‘Folk Ecology’ Project
M.T. Misiko1; J.J. Ramisch2; J. Mukalama2
1Wageningen Agricultural University; 2TSBF-CIAT
This manual presents and discusses methods and tools applied under the“Strengthening Folk Ecology” project. It is a descriptive and analytical summaryof how those methods and tools were developed, applied, and how they have continued to be adapted and combined for different circumstances. Rather thansimply offering another “toolkit” for practitioners and farmers, the maindiscussions focus on key lessons learned about the application of those tools andmethods under the project.
90
The “Folk” Ecology project was a community-based interactive learning initiative. Its focus wasto broaden farmers’ soil fertility management strategies by incorporating scientific insights of soil biologyand fertility into their repertoire of folk knowledge and practical skills. The major objective of the “folk” ecology project is to develop innovative and interactive learning tools that facilitate the exchange of knowledge and skills between farmers, scientists and other agricultural knowledge brokers.
To achieve its goals, the project first undertook community-level studies on local soil fertilitypractices and perceptions using several mainly qualitative methods and tools. These methods and tools have been described and discussed in section two of this manual. The third part provides “folk” ecology
teractive learning approaches and experiences. This manual is divided into four parts: part one, retical background relevant to “folk” ecology; part two, tools for community-
ased studies; part three, the “folk” ecology interactive approaches and experiences; and part four, anual.
University; TSBF-CIAT
, Kenya, 27 Sept – 4 Oct, 2004
to manage their agro-ecosystems is “dynamic” in that it responds
ncreasing understanding of local ecological knowledge and strengthening interactions with formal
ened.
.J. Ramisch ; M.T. Misiko1; I. Ekise2; J. Mukalama2; C. Simiyu2
ultural University; 2TSBF-CIAT
munities in four sites of western Kenya since 2001 has established that these communities
is “folk”d has evolved with the local environment to provide locally
system. A community-based learning process helpedto make the assumptiofarmers within farmer rStrengthening Folk Ecolis providing opportunitito improve the commun
For a number oknowledge is an extrem cess. We used integrated soil fertility management
insummary on useful theobapplication of the m
Generating “dynamic expertise”: Strengthening “Folk Ecology” and Integrated Soil Fertility
Management
M.T. Misiko1; J.J. Ramisch2
1Wageningen Agricultural 2
Poster presented at the Eco-agriculture Conference, Nairobi
The expertise small holder farmers useto local logic and ever-changing bio-physical, climatic, and economic environments. “Dynamicexpertise” is thus rooted in the local knowledge system (“Folk Ecology”) that smallholder farmers use tointerpret new ideas and research findings. Participatory research methods integrate local knowledge withthe knowledge of outsiders (researchers, other experts) to build the “dynamic expertise” that empowersfarmers to apply knowledge to practical situations.
This poster presents experience with generating dynamic Integrated Soil Fertility Management(ISFM) expertise among farmers in rural western Kenya. This process formed part of the Strengthening“Folk Ecology” project, a community-based interactive learning initiative of the Tropical Soil Biologyand Fertility Institute (TSBF). The “Folk” Ecology project generated dynamic expertise through dialogue and hands-on strategies to understand how farmers’ local logic would influence outcomes of projectwork, such as the incorporation of elements of new technologies into the farming system. Evidence ofdynamic expertise included: new farmer experiments, enhanced capacity for local institutions and networks, and new “language” for new knowledge and skills.
On-going Work
I
science strength2J
1Wageningen Agric
Work with comdo indeed possess and use a functioning local ecological knowledge system, which we have designated a“folk” ecology to distinguish it from the “formal” or systematized “science” of ecology. Thecology follows its own consistent logic anrelevant concepts and understanding of the agro-eco
ns and gaps of folk ecologies apparent through an iterative dialogue betweenesearch groups (FRGs) and between farmers and researchers (see Figure 27 –ogy). Making “folk” ecology more accessible both to its users and to researchers
es to improve the utility of local knowledge for making agricultural decisions andication of new ideas between actors.f reasons, understanding (and then enriching and broadening) “folk” ecological ely long and complex pro
91
(ISFM)
hat” (i.e.: toidentify
e project or of PhD-level researchers.
igure 27. The Strengthening Folk Ecology process. Dialogue and group activities that form part of
as an entry point for community activities largely because TSBF’s strength is in improving soil management. However, because of the embedded nature of “folk” ecology, the activities and innovationsof the community-based learning process have extended well beyond purely addressing “soil fertility”.The depth and quality of “folk” ecological knowledge varies widely between actors, even withinrelatively homogenous communities, such that it is difficult to generalise “who” knows “w
“women’s knowledge” as such, etc.) The local institutions involved (FRGs, kinship and marriagenetworks, etc.) are themselves also extremely complex and often volatile, with memberships, priorities, and motivations that can change substantially over time. Similarly, “folk” ecological knowledge relating to soil management is rarely conceived of separately from broader livelihood concerns and priorities. The goal throughout will be that “folk” ecology is strengthened through processes rooted in local institutions,actors and processes, ensuring that the co-learning activities are not (either in perception or reality) overlylinked to the presence of th
ContinuousCommunity based
DynamicTechnology
testing
F
the “Integration of local and insiders’ knowledge” feed into an iterative process of collective andindividual technology design and testing, which leads to the generation of local “dynamic expertise” for managing agro-ecosystems. However, understanding the processes that lead to the evolution of this “dynamic expertise” is as important as the expertise itself. Continuous community-based studies inform researchers’ contributions to the integrated knowledge activities, while documentation helps both farmersand researchers share knowledge with each other, with other communities (scaling up activities), and withother knowledge brokers.
Future work will build on the achievements of the first phase by documenting the dynamics bywhich “folk” ecological knowledge is generated, shared, or withheld in the institutions involved in theresearch so far. These institutions include the formally constituted groups (i.e. FRGs, women’s groups,etc.) as well as informal community networks such as those of kinship, marriage, or friendship, commercial or patron-client relationships. Participant observation of key informants and of thefunctioning of the FRGs demonstrated that “folk” ecology is learned and modified through a variety of learning styles, and that no single approach is fully sufficient for building farmers’ confidence with new or unfamiliar topics. For example, many of the FRGs used fairly researcher-designed demonstration orexperimentation activities of soil fertility management as a starting point but have since evolved their own unique sets of activities incorporating local logics and priorities. The experimentation is now much more
(New)
Technology
design
expertise studies
Integratinglocal & outsiders’
knowledge
Docu-
mentation
Knowledge
sharingUp-scaling to
other communities
92
distributed to multiple individuals within the FRGs with various ways of sharing findings within eachcontext. The emphasis of activities has also shifted from “purely” soil improvement to food securityissues, and test crops now cover everything from local vegeTables to root crops to legumes and cereals. In all the sites, FRGs now engage in various co-learning activities such as drama groups, small discussioncircles, and self-help financing.
The increasing diversity of activities requires substantial follow-up, which will be implementedthrough a participatory monitoring and evaluation (PM&E) process that will both: a) determine how FRGs’ innovations can be supported and enriched with inputs from partners or each other and also b) feedthe FRGs’ lessons into on-going farmer-researcher dialogue. Combining the outputs of the farmer-drivenPM&E and more researcher-driven documentation process will generate appropriate co-learning activities,experiments, and materials to support improved decision-making for managing the local agro-ecosystems.
Finally, we are reinforcing the successes of the first phase by following the transmission of knowledge within FRGs, and also the modes in which technical people and farmers interact, with the goalof comparing the information content and outcomes that result from different generations of interactions.This component of the project will allow us to derive general principles about how to “unbundled” complex knowledge (such as t ed in il-germplasm livelihood technologies)and how to better communicate ments to that knowledge.
Do farmers really manage soil fertility?M.T. Misiko1, J.J. Ramisch2, J. Mukalama2, Ken Giller1; Paul Richards1
1Wageningen Agricultural Unive 2TSBF-CIA
Paper in preparation
This paper analyses farming practices among smallholder farmers of Butula, Chakol, Emuhaya andMatayos in western Kenya. It assesses the soil fertility worth of these practices that included use of different organic manures (compost, FYM, mulches) of varying qualities and traditional systems (such ascrop rotation, natural fallows, intercropping) that depended on complex local logic. This local logic was not by and large geared tow , rather the u g factors inc : available materials;tradition and traditional economic needs and abilities; land size, labour, newknowledge, and the differ f it, which shaped new dynamism. New dynamism resultedin strengthened ecological knowledge of few local farmers, which nevertheless, did not qualitativelypercolate out to other individuals within and outside the sites. This paper points out that acceleratingdynamism (i.e. strengthening positive vitality of) local logic is the best approach to enhance soil fertility
ers can offer many insights into the sustainable management ofopical soils. In order to capture this local knowledge and link it with technical knowledge systems, a
particip
hat involvimprove
managing so -climate-
rsity; T
ard soil fertilityknowledge; food;
ent interpretations o
nderlyin luded
management among smallholder farmers of western Kenya.
A South-South development of a methodological guide for linking technical and local soil
knowledge for designing Integrated Soil Fertility Management optionsBarrios, E., Delve, R.J., Bekunda, M., Mowo, J., Agunda, J., Ramisch J., Thomas, R.J.Draft journal paper
The increasing attention paid to local soil knowledge in recent years is the result of a greater recognition that the knowledge of smallholder farmtr
atory approach in the form of a methodological guide has been developed to identify and classifylocal indicators of soil quality related to technical soil parameters. This methodological guide wasinitially developed and used in Latin America and the Caribbean (Honduras, Nicaragua, Colombia, Peru, Venezuela, Dominican Republic), and was later improved during adaptation and use in the East Africancontext (Uganda, Tanzania, Kenya, Ethiopia) through a South-South exchange of expertise andexperiences. Valuable contributions from collaborators in Africa have now been incorporated into a newSpanish version of the methodological guide via a full reciprocal South-South exchange cycle. This methodological tool aims to empower local communities to better manage their soil resource throughbetter decision-making by fostering the development of a local soil quality monitoring systems. It is alsodesigned to steer soil management towards developing practical solutions to identified soil constraints, as
93
well as, to monitor the impact of management strategies implemented to address these constraints.Farmers become aware that some local and technical indicators can provide early warning aboutunobservable changes in soil properties that later lead to visible soil degradation. The methodologicalapproach presented here constitutes one tool to capture local demands and perceptions of soil constraints as an essential guide to relevant research and development activities. A considerable component of thisapproac
dlandscap
tandard methods was mandatory, were learly defined and assigned to all the participating countries. A list of optional functional groups, with all
as developed in consultation with the partners.
eloped and circulated to projectnts. The countries are Brazil, Cote d’Ivoire, India,
nya, Mexico and Uganda. The functional groups whose inventories were
k areas. Taxa have been determined for 8
h involves the improvement of the communication between the technical officers and farmers andvice versa by jointly constructing an effective communication channel. The participatory process used is shown to have considerable potential in facilitating farmer consensus about which soil related constraints should be tackled first and what potential soil management options could be used. Development of local capacities for consensus building is presented as a critical step prior to collective action by farmingcommunities resulting in the adoption of integrated soil fertility management strategies at the farm an
e scale.
CSM-BGBD project - methodology and inventory
This year, significant progress was made in the GEF funded CSM-BGBD project in all the participatingcountries in terms of methodology development and inventory of below-ground organisms. Functionalgroups of soil organisms, for which the inventory by prescribed scthe attendant methods for their inventory, w
Standard methods for the inventory of the soil organisms devpartners in seven countries in three contineIndonesia, Keconsidered manadatory include: legume nodulating bacteria (LNB), Arbuscular MichorrhizalFungi (AMF), Phytopathogenic Bacteria (i.e. Pseudomonas, Ralstonia, Erwina, Xanthomonas),Ectomycorrhizae, Soil Borne Fungi (i.e. Phythium, Fusarium, Rhizoctonia), EntomopathogenicNematodes, Nematodes (i.e. plant pathogens and free-living pathogens), Mesofauna, Macrofaune (i.e. ants, beetles, termites, and earthworms) and finaly palnt pests (i.e white grubs or commonlyknown as fruit flies.
Collecting samples for inventory of BGBD and site characterization of benchmark sitescompleted in Brazil.
Fieldwork for first project phase completed in Mexico. Sample analysis is underway. First results of the inventory of earthworms and nematodes presented to a stakeholders workshop.
Indonesia completed field work for two benchmargroups of soil biota. Inventory of pests and disease is underway.
Uganda has completed fieldwork for site characterization and BGBD inventory.
Activity 1.7 Participatory and formal economic methods of valuating soil management practices
developed and tested
TSBFI-Africa
Completed work
Financial benefits of Crotalaria grahamiana and Mucuna pruriens short-duration fallow in easternUgandaJ.B. Tumuhairwe, B. Jama, R.J. Delve, M.C. Rwakaikara-SilverRevised article submitted to African Crop Science Journal
Crotalaria grahamiana and Mucuna pruriens improved fallows are gaining popularity amongsmallholder farmers in Uganda to address soil fertility decline. The technology supplies nutrients and increases crop yields but its economic viability is uncertain in eastern Uganda. Therefore, two researcher-
94
managed experiments were established in Tororo District, eastern Uganda to determine the financial benefits of the C. grahamiana and M. pruriens improved fallow compared to farmers’ practices of naturalfallow, compost manure and continuous cropping. Higher returns to land were obtained from improvedfallow compared to farmers’ practices. C. grahamiana realized US$267.4 (Dina’s site) and $ 283.2(Geoffrey’s site), and M. pruriens had $284.1 (Dina’s site) and $248.7 (Geoffrey’s site) compared to natural fallow $223.3 (Dina’s site) and $274.3 (Geoffrey’s site), compost manure $70.9 (Dina’s site and114.2 (Geoffrey’s site) and continuous cropping $314.2 (Dina’s site) and $314.2 (Geoffrey’s site) per hectare. Improved fallows saved on labor compared with continuous cropping and compost manureexcept for natural vegetation fallow. Higher returns to labor were obtained through use of improvedfallow than compost manure and continuous cropping. Returns to labor of $0.54 day-1 were obtained forcompost manure (at Dina’s site), which is less that the wage rate at $0.57 day-1 indicating a loss in labor invested.
Profitability analysis and linear programming to optimize the use of biomass transfer and
l tools, whilststudperennidetermiinorganimprovespeciesSIP weespecialfound 5 Mucuna application. Under the optimal solution 0.81 ha, 218.1 labor daysand188,867 r three cropping seasons would require For BT the application of 0.91 t haof T owith a 1day hof sm ll
ete m ecies in eastern
ganda
production in sub-Saharan Africa is declining due to increasing populationland. A resultant feature is the dependence on external inputs to attain crop yields at andnce level. This paper evaluates the acceptance of one low cost approach to overcome high
of green manure and legume species in Eastern Uganda. The eight shrubs of maincus were Mucuna pruriens, Canavalia ensiformis, Tithonia diversifolia, Sesbania sesban, Crotalaria
nts of decisions to utilize these technologies and farmer perceptions of the management of these focus group
a were subjected to descriptive statistics
improved fallow species for soil fertility improvement
P.N. Pali, B. Bashaasha, R. Delve, R. MiiroSubmitted to African Crop Science Journal
Studies that have focused on the economics of integrated soil fertility management technologies have predominantly used the partial budgeting and Economic Rate of Return (ERR) analytica
ies that have used the linear programming (LP) technique have been restricted to the evaluation ofal cropping systems including agroforestry. This paper uses a partial budget analysis and LP tone the optimal combination of management practice and profitability of using organic and ic soil improvement options. The incorporation of 100% or 50% of the above-ground biomass ofd fallow (IF) species Mucuna pruriens and Canavalia ensiformis and the biomass transfer (BT) Tithonia diversifolia are the focal soil improvement practices (SIP) considered in this study. Allre more profiTable then farmers existing practice, with BT being more profiTable than IF,ly when BT was used in combination with inorganic N fertilizers. For IF the optimal SIP was0% Mucuna and 100%
an investment of 327,150 Uganda Shillings would be required to obtain the optimal benefit ofUganda Shillings ove -1
ith nia with 30 kg N ha-1 would produce the highest net benefits of 445,744 Uganda shillings ha-1,6% lower optimal net benefit solution of 372,069 Uganda Shillings, on 0.83ha, using 105 labor
s. T e IF and BT options considered were all profiTable and the production objectives and constraints a holder farmers is the only constraint to their adoption.
D r inants of the adoption potential of selected green manure and legume sp
U
P.N. Pali, R. Miiro, R. Delve, B. Bashaasha, E. Bulega.
Submitted to African Crop Science Journal
bstract: AgriculturalA
pressure on thebove a subsistea
input costs, the usefoochroleuca, Calliandra calothrysus, Dolichos lablab, and Tephrosia vogelli. It focuses on thedeterminainnovations. A survey of 108 farm households using a structured questionnaire and
e datdiscussions (FGD’s), were the main data collection tools. Thand Probit regression modeling analytical techniques. The factors that explained technology acceptance were insecticide use, household size, cultivated area, perception of soil improvement technology following use, education, and wealth. Sesbania and Mucuna were found to be the most popular and
95
problematic tree and shrubs respectively. Reported benefits related to sustainable utilization and improvedlivelihoods through shrub and tree technologies included increased yields, soil texture, soil structureimprovement, erosion control and alternative uses of shrubs and trees
Competitiveness of agro-forestry based soil fertility management technologies for food production:
the case of small holder food production in western Kenya
Maithya, J.M1, Kimenye, L.N1, Mugivane, F. 1, Ramisch, J.21Department of Agricultural Economics, University of Nairobi; 2TSBF-CIATPaper submitted to African Crop Science Journal
Persistent food insecurity accompanied by low and declining farm house hold incomes are a commonfeature of many small holder maize and bean producers. This has been largely attributed to soil nutrientdepletion among other factors. One way of addressing soil fertility problems in many maize-basedropping systems is the use of agro-forestry based technologies. A survey was carried out in Vihiga and
n systems which were categorized on the basis lity. Farm budgets were first formed and in turn used to s namely: maize-bean intercrop without any inputs, maize-
cSiaya districts of western Kenya. The Policy Analysis Matrix (PAM) method was used to determine the social and financial competitiveness of different productioof the technology used to address soil ferticonstruct the PAMs for six production systembean intercrop with chemical fertilizers only, maize-bean intercrop with chemical fertilizers and improvedfallows, maize-bean intercrop with improved fallows only, maize-bean intercrop with improved fallows and rock phosphate, and maize-bean intercrop with farm yard manure (FYM) only (see Table 26 and 27).
Table 26. Financial profitability.
Production system Revenue Tradable inputs Domestic factors Profits
M/B+0 15,226 0 8,200 7,026
M/B+F 18,300 1,430 7,549 9,321
M/B+F+IF 19,443 802 8,603 10,038
M/B+IF 13,099 0 9,101 3,997
M/B+IF+RP 14,870 330 8,884 5,657
M/B+FYM 16,990 0 8,600 8,390
Table 27. Social profitability
Production system Revenue Tradable inputs Domestic factors Profits
M/B+0 10,926 301 5,609 5,016
M/B+F 12,667 807 5,099 6,761
M/B+IF+F 15,991 1,210 7,411 7,370
M/B+IF 11,000 580
1,001
7,789 2,631
6,161 5,044M/B+IF+RP 12,210
M/B+FYM 13,100 701 5,422 6,977
Note: M/B=maize-bean intercrop; M/B+0= maize-bean intercrop with no external inputs; IF=Improvedfallows; F=Chemical fertilizers; RP=Rock Phosphate; FYM=Farm Yard Manure; M/B=maize-beanintercrop
Use of the combination of chemical fertilizers with improved fallows was the most financially and socially profiTable production system, with profits of Ksh 10,038 and Ksh 7,370 respectively. Use ofFarm Yard Manure (FYM) gave the third highest financial profits of Ksh 8,390 and also the secondhighest social profits (Ksh 6,977). One thing which is clearly observable from the production systems is that use of chemical fertilizers enhanced the financial profits gained from use of improved fallows. However, due to price constrains in relation to chemical fertilizers, it can be concluded that use of FYM can be both an affordable and profiTable technology package for the production of maize and beans.
96
There is need for retailers selling chemical fertilizers to consider repackaging it into small quantities (like 100g, 200g and 300g) which can be affordable to farmers. Also, farmers should be encouraged to use Farm Yard Manure (FYM) though it ranked third in terms of private profitability and second in terms ofocial profitability.
systems of central Kenya:
ropping systems of central Kenya into different inter- and within-farm recommendation domains.ticipatory Learning and Action Research (PLAR) for classification of
t soil anageme u sse ding onorganic and inorg ilizers, soil conservation structures and depth of tillage, three classes of merged: class I managers II (medium anagers) and cl (poor SF
orrelation co (r) and Ana f variance (ANOVA) were then employed to validateSQI-based c tion. Corre coefficient (r ndicated a posi tionshipand wealth-endowment variables. Results depicted significant differences (P<0.05) in mean
hosphorous within and between different classes. Carbon ranged frominyaga to 2.1 aragwa, w le Nitrogen rang m 0.06-0.17 % districts
spectively. Kirinyaga had highest Phosphorous levels (649 ppm) while Maragwa had the lowest (45 therefore, help develop more participatory and targeted ISFM technologies
men ains, for v gro ms.
a. Wealth ranking in Kariti and Mukanduini study sites.
cator C ass II Class III
s
On-going Work
Characterization of smallholder farm typologies in maize-based cropping
use of local and technical soil quality indicatorsJM. Macharia1, SK. Kimani1, LN. Kimenye2, RA. Nyikal2, J. Ramisch3, AO. Esilaba1
1Kenya Agricultural Research Institute (KARI), 2University of Nairobi (UON), 3TSBF-CIAT.Paper presented at the Soil Science Society of East Africa (SSSEA) conference, 29 Nov-3 Dec, 2004,
Arusha, Tanzania
In recent years, integrated soil fertility management (ISFM) paradigm has emerged as best strategy for resource-poor smallholders to mitigate food insecurity and poverty problems. Such farmers areheterogeneous in terms of resource endowments and therefore pursue different soil fertility strategies tocombat nutrient depletion. However, hunger, malnutrition and poverty have escalated in most smallholdercropping systems. This makes characterisation and evaluation of ISFM technologies under differentsocio-economic and biophysical farmers’ circumstances more imperative. The study examined how local and technical soil quality indicators (LSQI and TSQI) could be used to delineate farmers in maize-basedcMethodologies used included Parfarmers into differen fertility m nt (SFM) and reso rce endowment cla s. Depenlevels of anic fertfarmer e (good SF ), class
oSF m ass III
managers). Cd T
efficient lysisionLSQI- an
between Slassifica lat =0.5) i tive rela
FM% Carbon, % Nitrogen and ppm P1.4% in Kir % in M hi ed fro in tworeppm). The study results couldto suit different recom dation dom enhanced producti ity of smallholder a -ecosyste
Table 28
Wealth Indi lass I Cl
Level of Education Cel
Primary education and below
ollege and above Secondary schoollev
Off-farm Income P te ent
all Business Casual, no of ncome
Houseivestock Type and # > 2 Cows 1 cow None
ermanenmploym
Sm f-farm i
Land Size > 2 acres 1.5 – 2 acres < 1.5 acres Type of Farmhouse Permanent House Semi-permanent Mud house
L
Class 1 uses highest levels of manures and commercial fertilizers, constructs soil conservation structures and practices deep tillage. Class 2 farmers uses manures and fertilizers but at lower levels than class1 andhave some soil conservation structures, while class 3 uses least fertilizers and manures levels and have poorly maintained soil conservation structures. Also different farm portions were classified as fertile, medium or poor depending on farmer-perceived local soil quality indicators (LSQI).
97
Table 28b: Correlation of SFM and Wealth endowment in Kariti and Mukanduini
Site Class I Class II Class III Corr. Coeff. (r) t0
KARITI 44 55 194 0.46 9.2
MUKANDUINI 7 74 192 0.63 14.3
Corr. Coeff. = Correlation Coefficient, t0 = Observed t value
mic circumstances,Classification of farmers in study sites based on their wealth status resulted also in three classes.
This classification was paramount as it identified important farmers’ socio-econowhich are critical determinants in adoption of soil fertility management technologies.
Average correlation coefficient (r) in both sites (0.5), indicated a positive correlation between soilfertility management and wealth endowment variables. T-test on r-values ( = 0.05) led to rejection of null hypothesis that there is no relationship between farmers’ wealth endowment and their soil fertilitymanagement status. This result therefore, indicates that wealthy farmers are also good soil fertility, thusconfirming PLAR classification.
Table 29: Technical Soil Quality Indicators (TSQI) for different classes in Kariti and Mukanduini sites
Site Class pH % C % N ppm P Ppm K CEC
KARITI I 5.5 2.0 0.17 64 672 6.8 II 5.6 2.1 0.14 101 606 6.6 III 5.4 1.8 0.13 45 362 6.4 LSD (0.05) 0.04 0.32 0.02 26.6 228.1 1.72MUKANDUINI I 5.6 1.6 0.09 441 410 7.2
II 5.8 1.5 0.07 632 385 7.9 III
LSD (0.05)
5.80.66
1.40.46
0.060.07
649100.3
428241.9
6.81.43
Results indicated significant differences in some technical soil quality indicators (TSQI) between classes andwithin different portions of same farms. However, some TSQI did not show such significant differences.
Participatory models in fostering farmer innovation to minimize trade-offs and induce win-win
benefits: The case of Organic Resource Management
T. Amede
inuati lier investigation evealed that th strong trade-off foriomass (i.e. crop residue, man
scales am usesise and ity restorer. A unt of or
to sat erent needs robablymade based needs. The this work nderstand farmer
esse ass c , to armer innovationsblem e guides to mmunityfa ape systems tification of nich major steps considered
rrent mass at plot, farm and mini-watershed-
Tropical Soils Biology and Fertility Institute of CIAT
This work is a cont on of ear s which r ere is verythe limited organic bat farm and landscape
ure, stubble, weeds, grasnamely, as a cooking fuel, as livestock feed, as
ses and underground biomass)cashong various
generation enterprvery much limited
as soil fertilisfy these diff
ty
nd yet, the amo, which are all p
ganic biomass in the system is important but the household
decision is on priori objective of were to uexperimentation proctowards solving the pro
s to overcome biom and to develop farm
onstraint in the systemr-friendly tools &
document fimprove farmer-co
understanding of theirdate were: a) Participato
rm & landscry mapping of the cu
for idensources of bio
es. Thetolevel including crops, forages, trees, valley bottoms, homestead crops and other niches b) participatoryestimation of biomass yield per time and space in selected farms c) Monitoring resource flows andproduction fluctuations at household level in selected farms d) Participatory identification of possible nichesfor growing more biomass in the system, e.g. integration of high biomass producing, promiscus type legumes,(e.g. Climbing beans, Soybeans) and fast growing and browsing resistant forages (e.g. napier grass).