106


4. RESULTS
4.1. TREE INVENTORY
Mature tree species diversity
The diversity of mature trees (2 30 cm gbh) in the total 8-ha area totaled 78
species in 61 genera and 36 families. Species richness of the four study plots varied
from a lowest value of 39 species in disturbed plot MS to a highest value of 58
species in undisturbed plot PS (Table 5). It can be deduced from Table 5 that the
mean species richness (41 species) of disturbed plots (KS and MS) was 25.6 % lower
compared to that (55 species) of undisturbed plots (PS and VS). The higher taxa
(genus and family) richness of disturbed study plots KS and MS was also lower by
24.5 %, compared to the mean values of undisturbed study plots PS and VS. Diversity
indices (except Simpson's) were greatest for undisturbed plot PS and lowest for
disturbed plot MS (Table 5).
Among the four 2 ha study plots, 20 species (25.6 %) were common to all of
them. Of the total 78 species, 12 species (15 %) were deciduous or brevideciduous,
while the remaining 62 species (85 %) were evergreen. The number of buttressed
trees was greater (44 %) in plot KS (with a steep slope of 25 % to 30 %) and lesser (7
%) in plot MS (with a slope of 10 % to 15 %). This indicates that tree buttressing in
the evergreen forests of the Kolli hills increases with increasing slope.
Species -area curves
The species-area curves of the four 2 ha contiguous plots rapidly increased
until 0.5 ha (Fig. 5). The curves continued to increase, but in slow pace, till 1.5 ha and
thereafter species addition was almost none. However, a light spurt: at the end of the
curves in the study plots VS and MS can be noticed. In general, the species-area

Table 5. Consolidated details of matclre tree diversity inventory (stems 2 30 crn gbh) in
the four 2 ha plots in four srudy sites, Perurnakkai shola (PS), Vengodai shola (VS),
Kuzhivalavu shola (KS) and Mottukkadu shola (MS) in the tropical evergreen forest of
the Kolli hills, Eastern Ghats, south India
Undisturbed Disturbed Variable Total
PS VS KS MS
Species richness
Species has'
Genus richness
Family richness
Diversity index
a) Shannon (H')
b) Simpson's (D)
c) Hill diversity @TI)
d) Evenness index (El)
Stand density (stems ha-l)
Stems ha-'
Mean density (stems ha-')
Stand basal area (m2 ha-2)
Mean basal area (m2hd')
Number of multi-stemmed trees
Number of cut trees (stumps)
Number of dead trees
Number of thorny trees
Number of trees buttressed

Fig 5. Species-area curves of mature trees in the four study plots of the Ko!li hills.
60
50 a, .-
40 F: "3 2 30 + ii
9 20
10
0
0 0.2 0.4 0.6 0.8 1 1.2 1.4 1.6 1.8 2
Cumulative area (ha)
Fig. 6.
120
V1
100 a, . - 8 80 2
60 4 4 ru 0
40 z
20
0
Species richness estimator curves of trees in the Kolli hills.
2.0 4.0 6.0 8.0 Cumulative area (ha)

acccsnulation curves approach asyrnptore, indicating near adequate sampling for each
study site in the Kolli hills. The non-parametric species richness estimators for the 8-
ha area yielded an overestimated diversity, ranging from 87 species of abundance-
based coverage estimator (ACE) to 101 species of Jacknife 2 (Table 6). The ACE and
Bootstrap best satisfied the pooled data of 8 ha samples than the other estimators. The
observed curve (Sobs) raises more slowly than the expected curves of ACE and ICE
(Fig. 6). The observed curve lags behind the expected curve of ACE by 9 species for
8-ha sample size, and lags behind the expected curve of ICE by 17 species for the
same sample size.
In the total 8 ha sample of lropical evergreen forest in the Kolli hills, there
were 12 singletons (species with only one individual in the pooled sample) and 4
doubletons (species with only two individuals in the pooled sample). Uniques (species
that occur in only one sample) and duplicates (species that occur in only two samples)
were 23 and 18 species respectively.
Species population density and basal area
In all, 3825 trees 1 3 0 cm gbh were enumerated in the 8 ha sample. The
population density of individual tree species varied considerably in undisturbed and
disturbed study plots (Table 7). By examining Tables 8 to 11, it is clear that a single
species Memecylon umbellafum of Melastomataceae dominated study plots MS (39
%) and VS (26 %), while two sets of three different species codominated study plots
PS and KS. They include Nofhopegia heyneana (12 %), Memecylon umbellafum (9.8
%) and Diospyros ovalifolia (9 %), together sharing a majority (3 1 %) of tree density
in plot PS; and Meliosma simplicifolia (16.7 %), Myristica dactyloides (12.6 %) and
Phoebe wightii (9.6 %), together formed 39 % of the forest stand in plot KS.

Table 6. Results of species richness estimators for mature trees (2 30
cm gbh) inventoried in the 8 ha plot in the Kolli hills.
Diversity value (f SD) for cumulative area Variable
Sobs 46 1- 7 63 f 5 72 i 3 78 t 0
Individuals
ACE
ICE
Chao 1
Chao 2
Jacknife 1
Jacknife 2
Bootstrap

Table 7. Population densirj of marue :ree species 2 30 cm gbh encountered in each
2 ha plot of PS, VS, KS and MS, and total 8 ha ir. the tropical evergreen forest of the
Kolli hills, Eastern Ghats, south India.
Density (no. of trees) Species Family PS VS KS MS Total
1 . Memecylon umbellaturn Burm.f. Melastomataceae 104 300 26 378 808
2. Phoebe wightii Meisner Lauraceae 6 107 63 54 230
3. Olea paniculata R.Br. Oleaceae 12 159 19 - 190
4. Neolitsea scrobiculata (Meisner) Lauraceae 8 19 10 149 186 Gamble
5. MyristicadactyloidesGaertn. Myristicaceae 41 35 82 13 171
6. Mallotusphilippensis (Lam.) Euphorbiaceae 13 70 46 34 163 Muell.- Arg. var. philippensis
7. Syzygium cumini (L.) Skeels Myrtaceae 12 66 2 71 151
8. Scolopia crenata (Wight & Arn.) Flacourtiaceae 85 5 53 - 143 Clos var. crenata
9. hTothopegia heyneana (H0ok.f.) Anacardiaceae 128 8 - 1 137 Gamble
10. Meliosma simplicijblia (Roxb.) Sabiaceae - - 109 - 109 Walp. subsp. simplicfolia
1 1. Diospyros ovalfolia Wight Ebenaceae 97 2 - 7 106
12. Persea macrantha (Nees) Kosterm. Lauraceae 10 32 33 29 104
13. Artocarpus heterophyllus Lam. Moraceae 44 36 8 10 98
14. Alseodaphne semecarpfolia Nees Lauraceae 84 5 2 - 91 var. angustfolia Meisner
15. Elaeocarpus serratus L. Elaeocarpaceae 2 59 16 11 88
16. Litsea oleoides (Meisner) H0ok.f. Lauraceae - 7 57 14 78
17. Prunus ceylanica (Wight) Miq. Rosaceae 17 31 1 16 65

19. Canariutn striclum Roxb. Barseraceae 10 4 16 - 60
20. Ficus virens Ait. var. virens Moraceae 6 1 23 16 46
2 1. ,Weliosmapinnata (Roxb.) Walp. Sabiaceae 23 8 2 12 45 Subsp. arnottiana (Walp.) Beus.
22. Drypetes sepiaria (Wight & Am.) Euphorbiaceae 1 - - 42 43
Pax & Hoffm.
23. BischoJia javanica Blume Bischofiaceae 4 12 11 14 41
24. Diospyros angustfolia (Miq.) Ebenaceae 37 4 - - 41 Kosterm.
25. Ligustrum robustum (Roxb.) Oleaceae 19 19 1 - 39 Blume subsp. walkeri (Decne.) P.S. Green
26. Lifsea insignis Gamble Lauraceae 23 6 7 - 36
27. Memecylon edule Roxb. Melostomataceae 11 21 - 4 36
28. Callicarpa tomentosa (L.) Murr. Verbenaceae 5 16 - 13 34
29. Cinnamomum malabatrum (Bum. Lauraceae 5 25 2 - 32 F.) Blume
30. Mimusops elengi L. Sapotaceae 28 2 - - 30
3 1. Celtis timorensis Spanoghe Ulmaceae 14 14 1 1 30
32. Celtis tetrandra Roxb. Ulmaceae 12 - 1 15 28
33. Ficus microcarpa L. Moraceae 12 2 11 1 26
34. Toona ciliata M. Roem. var. ciliata Meliaceae 2 6 10 6 24
35. Aglaia jainii Viswa. & Ramachan. Meliaceae 13 5 2 - 20
36. Cipadessa baccifera (Roth) Miq. Meliaceae 7 - - 11 18
37. Ligustrumperrottetii A.DC. var. Oleaceae - - 1 16 17 obovatum Gamble
38. Canthium dicoccum (Gaertn.) Rubiaceae 2 , s 1 5 16 Teijsm. & Binn. var. dicoccum

39. h.4angifira indicu L. Anacardiaceae
40. Euonymus indicus Heyne ex Roxb. Celzstraceae
41. Polyalthia cerasoides (Roxb.) .?anonaceas Bedd.
42. Miliusa tomentosa (Roxb.) Sinclair Annonaceae
43. Eryfhrina stricta Roxb. Papilionaceae
44. Ficus nervosa Heyne ex Roth var. Moraceae nervosa
45. Ficus tsjahela Burm. f. Moraceae
46. Pavetta indica L. var. indica Rubiaceae
47. Murrayapaniculata (L.) Jack Rutaceae
48. Vernonia arborea Buch.- Ham. Asteraceae
49. Terminalia paniculuta Roth. Combretaceae
50. Glochidion malabaricum Bedd. Euphorbiaceae
5 I . Ficus talbotii King Moraceae
52. Allophylus serratus (Roxb.) Kurz Sapindaceae
53. Solanum erianthum D. Don Solanaceae
54. Mallotus stenanthus Muell.- Arg. Euphorbiaceae
55. Ficus benghalensis L. var. Moraceae benghalensis
56. Macaranga indica Wight Euphorbiaceae
57. Oreocnide integrfolia (Gaudich.) Urticaceae Miq.
58. Chukrasia tabularis A.Juss. Meliaceae
59. Albizia odoratissima (L.f.) Benth. Mimosaceae
60. Ficus beddomei King Moraceae

61. Chionanthus ramgora Rosb. Ojeaceae
62. Synzplocos cochinchii7ensis (Lour.) Synlplocaceae Moore subsp. laurina (Retz.) Nooteb.
63. Breynia vitis-idaea (Bum, f.) Euphorbiaceae Fischer
64. Litsea deccanensis Gamble Lauraceae
65. Ficus exasperata Vahl Moraceae
66. Maesa indica (Roxb.) DC. Myrsinaceae
67. Scheffleru stelluta (Gaertn.) Harms Araliaceae
68. Caryota urens L. -4recaceae
69. hfaytenus rothiana (Walp.) Celastraceae Ramam.
70. Croton malabaricus Bedd. Euphorbiaceae
71. Ficus mollis Vahl Moraceae
72. Ochna obtusata DC. var. obtusata Ochnaceae
73. Canthium rheedii DC. Rubiaceae
74. Atalantia racemosa Wight & Am. Rutaceae
75. Salix tetrasperma Roxb. Salicaceae
76. Chrysophyllum lanceolatum Sapotaceae (B1urne)A. DC.
77. Debregeasia longifolia (Burm.f.) Urticaceae Wedd.
78. Gmelina arborea Roxb. Verbenaceae
Total 1054 1151 651 969 3825
Dashes indicate species absence.

Overall, in the 8 ha area sampled, l.Yi"ernecylon umbe!latum alone was
represented by 808 individuals (20 %) out of 3825 trees of the total population (Table
7) . Hence, on the basis of species abundance, the tropical evergreen forest in the Kolli
hills of Eastern Ghats can be classified as Memecylon-Phoebe-Olea association with
Neolitsea and Myristica as codominants.
The basal area contribution by individual tree species varied greatly (Tables 8-
11). Species dominating each 2 ha plot include: Alseodaphne semecarpifolia of
Lauraceae (12.87 % basal area) in plot PS (Table 8); Olea paniculata of Oleaceae
(33.13 %) in plot VS (Table 9); Meliosma simplicfolia of Sabiaceae (1 6.92 %) in plot
KS (Table 10); and Syzygium cumini of Myrtaceae (19.29 %) in plot MS (Table 11).
Importance value index (IVl)
The species IVI depicts the sociological structure of a species in its totality in
the community. In Kolli hills, the varying top 10 tree species (in terms of IVI) of each
study plot are shown in Fig. 7. The IVI of species flattened in plot PS, while it
decreased smoothly in plots VS and KS, and decreased rapidly in plot MS. The first 5
species in plot PS scored an IVI ranging from 21 to 29 (Table 8). In plot VS, the IVI
of the first four species evenly decreased by a score of around 10 at every level (Table
9). Whereas in disturbed plot KS, the first species scored 47, the second 40 and the
third 32 (Table 10). In the other disturbed plot MS, the first species scored 70, and the
second and third species scored 43 and 37 respectively (Table 11).
The IVI-dominant species in each study plot (and thereby in each study site)
for a score of 300 include Nothopegia heyneana (IVP29.0) and Alseodaphne
semecarpifolia (28.8) in plot PS. Olea paniculata (60.0) and Memecylon umbellatum
(46.6) in plot VS. Meliosma sirnplicifolia (46.9) and Myristica dactyloides (40.2) in
plot KS. Memecylon urnbellatum (69.8) and Neolitsea scrobiculata (42.6) in plot MS.

Tab!e 8. Absolute density (D), relative density (rD), relative freqaency (rF), relative
basal area (rBA) and impoltance value index (IVI) of mature tree species with IVI
score of 2 5 in the 2 ha study plot PS in the Kolli hills, Eastern Ghats. south India.
Species D rD rF rBA IVI -
1 . Nothopegia heyneana 128 (12 %)
2. Alseodaphne semecarprjblia 84 (8 %)
3. Memecylon umbellatum 104 (9.8 %)
4. Diospyros ovulijolia 97 (9 %)
5. Scolopia crenata 85 (8%)
6. Canarium strictum 40 (3.8 %)
7. Artocarpus heterophyllus 44 (4 %)
8. Myristica dactyloides 41 (3.9 %)
9. Ficus microcarpa 12 (1.1 %)
10. Diospyros angust$olia 37 (3.5 %)
1 1. Prunus ceylanica 17 (1.6 %)
12. Syzygium cumini 12 ( 1.1 %)
13. Antidesma menasu 29 (2.7 %)
14. Mimusops elengi 28 (2.6 %)
15. Litsea insignis 23 (2.2 %)
16. Meliosmapinnata 23 (2.2 %)
17. Mangifera indica 11 (1 %)

Table 9. Absolute density (D), relative density (rD), relative frequency (rF), relative
basal area (rBA) and importance value index (IVI) of mature tree species with IVI
score of 2 5 in the 2 ha study plot VS in rhe Kolli hills, Eastern Ghats, south India.
Species D rD r F rB.4 IVI
1. Oleapaniculata 159 (14 %) 13.51 13.08 33.13 60.03
2. ~Memecylon umbellaturn 300 (26 %) 26.06 13.21 7.32 46.59
3. Phoebe wightii 107 (9.3 %) 9.29 10.10 15.49 34.89
4. Syzygium cunzini 66 (5.7 %) 5.73 7.64 12.50 25.87
5. ~MaZlotus philippensis 70 (6 %) 6.08 6.08 3.10 15.27
6. Elaeocarpus serratus 59 (5.1 %) 5.12 6.21 2.45 13.80
7. Artocarpus heterophyllus 36 (3.1 %) 3.12 3.75 4.75 11.64
8. Prun~ls ceylanica 31(2.7%) 2.69 3.10 3.54 9.34
9. Myristicu dactyloides 35 (3 %) 3.04 2.84 1.37 7.26
10. Persea macrantha 32 (2.8 %) 2.78 3.62 0.80 7.21
11. Cinnamomum nzalabatrum 25 (2.2 %) 2.17 3.23 1.26 6.67
12. Antidesma menasu 25 (2.2 %) 2.17 2.84 0.63 5.66
13. Memecylon edule 21 (1.8 %) 1.82 2.46 0.77 5.06

Table 10. Absolute density (D), relative density (rD). relative frequency (rF), relative
basal area (rBA) and importance value index (IV1) of mature tree species with IVI
score of 2 5 in the study 2 ha plot KS in the Kolli hills, Eastern Ghats, south India.
Species D rD rF rBA IVI
1. Meliosma simplicfolia
2. Myristica dactyloides
3 . Phoebe wightii
4. Scolopia crenata
5 . Litsea oleoides
6 . Mallotusphilippensis
7. Ficus virens
8. Oleapaniculata
9. Persea macrantha
10. Memecylon umbellatum
1 1 . Elaeocarpus serratus
12. Canarium stricturn
13. Ficus microcarpa
14. Toona ciliata

Table 11. Absolute density (D), relative density jrD), relati\ e frequency (rF), relative
basal area (rBA) and importance value index (IVI) of mature tree species with IVI
score of 2 5 in the 2 ha study plot MS in the Kolli hills, Eastern Ghats, south India.
Species D rD rF rB.4 IVI
1. Memecylon umbellaturn 378 (39 %) 39.00 17.61
2. Neoiitsea scrobiculata 149 (15.4 %) 15.37 17.44
3. Sywgium cumini 71 (7.3 %) 7.32 10.19
4. Phoebe wightii 54 (5.6 %) 5.57 7.25
5. Drypetes sepiaria 42 (4.3 %) 4.33 6.04
6. Mallotusphilippensis 34 (3.5 %) 3.50 5.00
7. Prunus ceylanica 16 (1.7 %) 1.65 2.59
8. Persea macrantha 29 (3 %) 2.99 4.31
9. Bischofia javanica 14 (1.4%) 1.44 1.55
10. Ficus virens 16(1.7%) 1.65 1.55
1 1. Litsea oleoides 14(1.4%) 1.44 1.89
12. Elaeocarpus serratus 11 (1.1 %) 1.13 1.89
13. Ligustrum perrottetti 16 (1.7 %) 1.65 2.76
14. Callicarpa tomentosa 13 (1.3 %) 1.34 1.89
15. Myristica dactyloides 13 (1.3 %) 1.34 1.55
16. Artocarpus heterophyllus 10 (1 %) 1.03 1.55
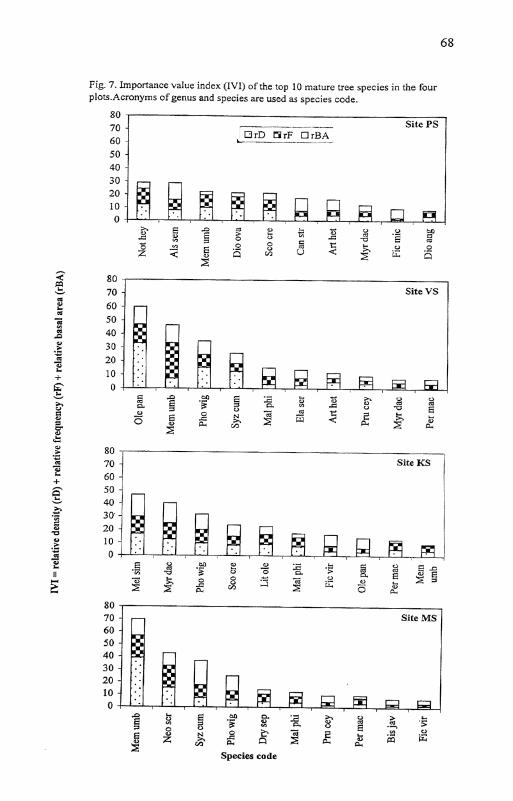
F!g 7 Importance \ d u e ;ndex (IVI) of the top 15 nature tree specles In the four p1ots.Acronyms of genus and specles are used as species code.
80 70 ----- - - site PS 1
DrD CrF O r B A - -
40 , I I
Site KS i
80 70 60 50 40 30 20 10 0
Species code

Dorrzinunce and rarity
Tree species, on the basis of their abundance in each 2-ha study plot, were
classified into very rare, rxe, common, dominanr and predominant groups (Table 12).
Plot-wise rarity (rare + very rare) ranged from a low value of 53.4 % (31 species) of
plot PS, to 53.8 % (21 species) of plot MS, 64.7 % (33 species) of plot VS, and 69.0
% (29 species) of plot KS. In the entire 8 ha area, rare tree species were 16 (species
with 9 to 30 individuals) and very rare were 28 (species with I to 8 individuals)
together contributing a site rarity of 57.6 %. Based on frequency classes of tree
individuals (Table 12), 30 % of species was found in category A (species occurring in
only one plot). The remaining percentage of trees was equally distributed among the
other categories.
Family diversity and densiiy
Of the total 36 plant families encountered in the 8 ha sample, 3 1 families were
represented in undisturbed plot PS; whereas only 22 families were encountered in
disturbed plot MS (Table 5). Plant families Moraceae (10 species from 2 genera),
Euphorbiaceae (8 species from 7 genera) and Lauraceae (8 species from 6 genera)
were the well represented families (Table 13). Oleaceae comprised 4 species and
Rubiaceae 3 species. While 12 families (33.3 %) contained 2 species each and the
remaining 18 families (50 %) had only single species in the whole of 8 ha.
Melastomataceae was the top ranked family in terms of in the forest stand
population density, i.e. with 844 stems (Table 13), followed by Lauraceae (759
stems), Euphorbiaceae (286), Oleaceae (249), and Moraceae (205). Families with
single individual in the entire 8 ha pooled samples include Araliaceae, Ochnaceae,
Salicaceae and the only monocot tree family Arecaceae represented by the fishtail
palm Caryota urens.

Table 12. Abundance and frequency based classification of mature trees 2 30
cm gbh and species richnesslpercentage of them in the four study plots of
tropical evergreen forest in the Kolli hills.
Number of species Group
PS VS KS MS
Abundance (trees ha-2)
>I01 Predominant 2 3 1 2
5 1-100 Dominant 3 3 4 2
21-50 Common 22 12 8 14
3 to 20 Rare 17 14 8 8
1 to 2 Very rare 14 19 21 13
Total 5 8 5 1 42 39
Frequency Category Total species (%)
1-25 % A 23 (30 %)
26-50 % B 18 (23 %)
51-75 % C 18 (23 %)
76-100 % D 19 (24 %)


Girth class diversity, density and basai urea
Species richness decreased with increase in girth class (Table 14). It can be
derived from the Table 14 that the contribution of lower girth class (30 - 60 cm g'oh)
to tree species richness ranged from a value of 57.1 % in disturbed plot KS to 90 % in
undisturbed plot VS. In the case of greater girth class (2 210 cnl gbh) trees, the values
ranged from 11.7 % of plot VS to 36.2 % of plot PS. Notably, in plot KS, the greater
species richness (64.2 %) was recorded from 60 - 90 cm girth class and not from the
lower girth class (30 - 60 cm gbh) trees.
Conformity with species richness trend, tree density too decreased with
increase in girth class (Table 14). Nevertheless, plot KS had lesser tree density (103
trees, 15.8 %) in the lower girth (30 - 60 cm) class than the density (150 trees, 23 %)
in the next higher girth (60 - 90 cm) class. Other three study plots showed maximum
density in the lower girth (30 - 60cm) classes itself. The contribution of the latter
ranged from 45.4 % of plot PS to 64.4 % of plot MS. The contribution of greater girth
(> 210 cm) class trees to density was a prominent 9.9 % in plot KS compared to 1.2 %
of density in plot MS, 3.5 % in plot VS and 5.8 % in plot PS.
Basal area contribution by different tree girth classes exhibited a reverse trend
to that of species richness and density (Table 14). Except for the study plot MS,
maximum basal area contribution by a girth class for any plot was that of > 210 cm
girth class and minimum basal area contribution was that of 30 - 60 cm girth class.
While the contribution of the former ranged from 22.8 % of plot VS to 43.1 % of plot
PS, and that of the latter ranged from 1.9 % of plot KS to 9.0 % of plot VS. In the
case of plot MS, which contrasts the above scenario, greater basal area contribution
(20.5 %) was from 30 - 60 cm girth class and lesser basal area (13.4 %) was from >
21 0 cm girth class.

Tab
le 1
4. R
esul
ts o
f gir
th c
lass
ana
lysi
s of
mat
ure
tree
s in
the
four
stu
dy p
lots
PS,
VS,
KS
and
MS
in th
e K
olli
hills
.
Gir
th -
clas
s (c
m)
30-6
0
Spec
ies r
ichn
ess
PS
VS
KS
MS
50
46
24
32
Shan
non
(H')
indc
x
PS
VS
KS
MS
3.00
2 2.
435
2 66
1 1.
741
Den
sity
(tre
es h
j2)
PS
VS
KS
MS
479
536
103
625
Bas
al a
rea
(m2 h
a")
PS
VS
KS
MS
--
7.55
8.
43
I.
9.5
8

Stand density and stand structure
The stand density and basal area of mature trees at 1 ha and 2 ha levels varied
widely (Table 5). Stand density ranged from 266 trees hdl of disturbed plot KS to 632
trees ha-' of undisturbed plot VS. On plot (2 ha), the stand density ranged from 651
trees plof' of KS to 115 1 trees plot-1 of VS. The mean stmd density for 8 ha sample
was 478 trees h i ' . The mean basal area of forest stand was lower in disturbed plot
MS (23.3 rn2 ha-') and greater in undisturbed plot PS (53.0 rn2 ha-:). The mean basal
area of the 8- ha sample was 43.6 m2 ha" (Table 5).
Forest stand structure of the four study plots as depicted by girth frequency
and basal area varied (Fig. 8). Plots PS, VS and MS contained maximum number of
individuals in lower girth (30 - 60 cm) class, while plot KS had maximum number of
trees in the second'higher girth (60 - 90 cm) class.
A step-wise decline in frequency of individuals with increase in girth class is
evident in undisturbed plots PS and VS. A sudden deciine (> 50 %) in the frequency
from the second girth class onwards in disturbed plot MS, and with almost equal
frequency of different girth classes in plot KS can be noticed (Fig. 8). Basal area
contribution by different girth classes to stand structure also varied. With increase in
girth class, the basal area increased progressively in plots KS, PS and VS, while in the
disturbed plot MS, different girth classes shared almost equal basal area (Fig. 8).
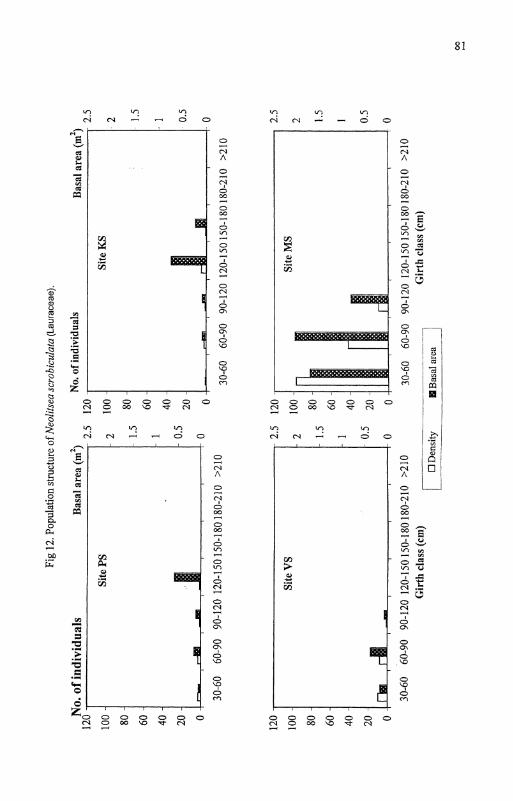
Speciespopulntion structure
The population structure of top five abundant tree species in the total
inventory exhibited a great variation among the four study plots (Figs. 9 to 13).
Memecyclon umbellaturn (Fig. 9 ) and Neoiitsea scrobzculata (Fig. 12) were denser up
to 90 - 120 cm girth class in all the four study plots. On the other hand, Phoebe
wighlii (Fig. 10) and Myristica dactyloides (Fig. 13) were well represented in all girth

Flg. 8. ForesP stand struclure based on tree girth freqLi::lc> and basal area In the
four study plots PS, VS, KS and MS of the Kolli hills.
No. of trees Basal area jm3) 700 600 500 400 300 200 100
0
600 Site VS 500
40
400 30 300 20 200 100 10
0 0
Site MS
400 300 200 100
0
700 - 50
30-60 60-90 90-120 120-150 150-180 180-210 >210
Girth class (cm)
600 - 500 -
E No. of trees Basal area
400 - n - 3 0
Site KS - 40

A s 2 .= 0* c-i - A m

Fig
10. P
opul
atio
n st
ruct
ure o
f Pho
ebe
wig
htii
(Lau
race
ae).
No.
of in
divi
dual
s 35
30
25
20
15
10 5
-
0
Bas
al a
rea
(m2)
N
o. o
f ind
ivid
uals
B
asal
are
a (m
2)
5 35
5
. 30
Si
te K
S
30-6
0 60
-90
90-1
20
120-
150
150-
180
180-
210
>210
30
-60
60-9
0 90
-120
12
0-15
0 15
0-18
0 18
0-21
0 -'2
lO
Gir
th c
lass
(em
) G
irth
cla
ss (
cm)
-
' OD
ensi
ty
Bas
al a
rea - I
- -
--
---
- - -
1

'? r . 4 N - . - 2 0 ? - "E - 2 3 N L.
A CO - m 2 V2 (5 T s 0
00 ?... C "0 & 'I) - 0 Ln - d 2 C r.! .... d
V1 - m m
0
z 0: .- 0
'P w
.- C 0
6 Z m Z 0 0 0 0 0 0 0 Z Z W W U N
t 0 2 is- .... 0 C G "
2 5 z 2 G m 2 "u d 9 N .k - u 0 N - d m
.-. z - - E d Y 'I) yl
2 rn T 3
( 5 s .b - u 0 2 d Q\


classes and in almost all the study plots. Oleapaniculara (Fig. 11 j was abundant in all
the girth classes of undisturbed plot VS, while it was totally absent in the liaman-
impacted plot MS. Although basal area contribution by different girth classes of
individual species in the four plots varied widely, the disturbed plot MS contributed
relatively little to basal area share in the greater girth class.
Tree distribution patterns
The density of trees analyzed by considering 20 rn x 20 m quadrats within the
2-ha plot varied considerably (Fig. 14). The disturbed plots KS and MS, together
housed more number of quadrats (76%) with sparse population of trees (i 20 trees
quadrat-'), while undisturbed plots PS and VS had more number of densely populated
(21 to 40 trees quadrat") quadrats (53%).
The dispersion patterns (at 1, 0.5 and 0.25 ha scale) of tree species with more
than 10 individuals in a hectare of each plot were examined using standardised
Morisita's index (Tables 15 to 18). Tree species in the Kolli hills exhibited either
clumped or uniform patterns of dispersion. Majority of them, at all the scales tested
for each plot, excluding plot KS, was clumped. Trees in plot KS were mainly of
uniform dispersion at all scales tested. The abundant tree species of individual plots,
except plot KS, were mostly clumped: 62 - 80 % were clumped at 1-ha and 60 - 93 %
clumped at 0.5-ha in plots PS, VS and MS. At 0.25-ha clumped pattern accounted for
36 % in plot PS, 53 % in plot VS and 60 % in plot MS. Uniform dispersion of
abundant tree species was predominant in plot KS: 86 % at 1-ha scale, 89 % at 0.5-ha
and 100 % at 0.25-ha scale.
/3 diversity
The P or differentiation diversity between the four study plots, as measured by
Sorenson similarity (qualitative) index, revealed that the four study plots exhibited a


Table 15. Standardised h4orisita's index value (Ipj aiid spatial pattern iP) of mature
tree species with > 10 individuals in ha # 1, tested at I , 0.5, and 0.25 ha scales in the
study plot PS (c = clumped, u = uniform, *species with 2 40 stems in ha k 1, and
numbers in parentheses indicate the subplots in which such pattern prevailed).
1 ha 0.5 ha 0.25 ha Species Ip P Ip P Ip P
2. Antidesma menasu 0.308 c(i) 0.024 4 2 ) 0.195 c(3)
3. Artocarpus heterophyllus -0.21 u(2) -0.11 u(4) -0.345 u(7)
4. Canarium strictum -0.16 u(2) -0.17 u(3) -0.315 u(5)
5. Diospyros angustifolia 0.448 c(1) -0.03 u(3) -0.043 u(6)
6. Diospyros ovaIifolia 0.229 c(2) 0.275 c(3) 0.308 c(5)
7. Euonymus indicus -0.19 u(1) -0.14 u(2) -0.043 u(4)
8. Lifsea insignis 0.506 c(1) 0.261 c(2) -0.129 u(3)
9. Meliosma pinnata 0.328 c(2) 0.199 c(2) -0.216 u(3)
10. Memecylon umbellatum * -0.03 u(1) 0.196 c(2) -0.309 u(5)
1 1. Myristica dactyloides 0.511 c(2) 0.505 c(2) 0.437 c(3)
12. Nothopegia heyneana * 0.357 c(2) 0.145 c(3) 0.504 c(5)
13. Prunus ceylanica 0.442 c(1) -0.2 ~ ( 2 ) -0.129 u(3)
14. Scolopia crenata* 0.274 c(2) -0.08 u(2) -0.115 u(4)

Table 16. Standardised h/lorisita's index value (12) aild spatial pattern (P) of mature
tree species with > 10 individuals in ha ~ 1, tes~ed at 1; 0.5, and 0.25 ha scales in the
study plot VS (c = clumped, u = uniform, *species with 2 40 stems in ha 1 , and
numbers in parentheses indicate the subplots in which such pattern prevai!ed).
Species 1 ha 0.5 ha 0.25 ha
Ip P Ip P Ip P
1. Antidesma menasu 0.146 c(1) -0.02 4 2 ) -0.032. u(3)
2. Artocarpus heterophyllus 0.501 c(2) 0.314 c(2) 0.195 c(3)
3. Olea paniculata * 0.389 c(2) 0.272 c(3) 0.059 c(5)
5. Cinnamomum malabatrum -0.33 u(2) -0.29 u(3) -0.216 u(6)
6. Elaeocarpus serratus* 0.196 c(1) -0.07 u(3) -0.46 u(4)
7. Ligustrum walkeri 0.505 c(1) 0.425 c(2) 1 c(3)
8. Mallotusphilippensis* 0.503 c(2) 0.501 c(3) 0.235 c(5)
9. Memecylon umbellaturn * 0.068 c(2) 0.135 c(2) -0.183 4 4 )
10. Myristica dactyloides 0.509 c(2) 0.505 c(2) 0.411 c(3)
11. Neolitsea scrobiculata 0.505 c(1) 0.407 c(1) 0.476 c(2)
12. Persea macrantha 0.027 c(1) -0.08 u(3) -0.129 u(4)
13. Phoebe wightii* 0.442 c(1) 0.234 c(3) 0.049 c(5)
14. Prunus ceylanica 0.509 c(2) 0.534 c(3) 0.509 c(3)
15. Syzygium cumini -0.21 u(2) -0.29 u(4) -0.345 u(7)

Table 17. Standardised Morisira's index value (Ip) and spatial pattern (P) of mature
tree species with > 10 individuals in ha # 1, tested at 1, 0.5, and 0.25 ha scales in the
study plot KS (c = clumped, u = uniform, "species with 2 40 stems in ha # 1, and
numbers in parentheses indicate the subplots in which such pattern prevailed)
Species Ip P Ip P Ip P
1. Canarium strictum -0.18 u(2) -0.14 u(3) -0.086 u(5)
2. Elaeocarpus serratus -0.21 u(2) -0.23 u(3) -0.172 u(4)
3. Ficus virens -0.08 u(2) -0.08 4 2 ) -0.129 u(3)
4. Mallotus philippensis 0.111 c(2) -0.01 u(2) -0.216 u(4)
5. Meliosma simplicifolia * -0.28 u(2) -0.45 u(1) -0.172 u(3)
6 . Memecylon umbellatum -0.14 u(1) -0.06 u(2) -0.032 u(5)
7. Myristica dactyloides* 0.083 c(2) 0.153 c(3) -0.099 u(5)
9. Phoebe wightii* -0.27 u(1) -0.36 u(3) -0.345 u(5)

Table 18. Standardised Morisita's index va!ue ( lp j and spatial pattern (P) of tree
species with > 10 individuals in ha # 1, tested at l i 0.5. and 0.25 !la scales in the study
plot MS (c = clumped, u = uniform, *species with 2 40 stems in ha d 1, and numbers
in parentheses indicate the subplots in which such pattern prevailed).
Species 1 ha 0.5 ha 0.25 ha
Ip P Ip P Ip P
1. Artocarpus heterophyllus 0.187 c(1) 0.073 c(1) -0.086 u(1)
2. Bischofia javanica 0.517 c(1) 0.507 c(1) 0.504 c(1)
3. Callicarpa tomenrosa 0.448 c(1) 0.503 c(1) 0.379 c(1)
4. Ficus virens 0.553 c(1) 0.553 c(l) 0.585 c(1)
5. Drypetes sepiaria -0.18 u(1) -0.03 u(2) -0.086 u(3)
6. Litsea oleoides 0.509 c(1) 0.501 c(1) -0.086 u(l)
7. Mallotusphilippensis 0.17 c(2) 0.073 c(4) -0.129 u(4)
8. Meliosma pinnatn 0.448 c(1) 0.503 c(1) 0.476 c(2)
9. Memecylon umbellafum * 0.5 c(2) 0.307 c(3) 0.016 c(5)
10. Myristica dactyloides 0.509 c(1) 0.501 c(1) 0.266 c(2)
11. Neolitsea scrobiculata* 0.5 ~ ( 1 ) 0.51 c(3) 0.539 c(4)
12. Persea macrantha 0.176 c(2) 0.123 c(2) 0.5 c(2)
13. Phoebe wightii* 0.344 ~ ( 1 ) 0.054 c(2) -0.259 u(4)
14. Prunus ceylanica -0.01 u(1) 0.024 c(1) 0.108 c(1)
15. Syzygium cumini -0.0s u(1) 0.073 c(2) -0.032 u(6)

62 % to 77 % similarity for the mature tree species (Table 19). Of the 78 trer: species
encountered in the 8 ha sample, 42 species were shared by undisturbed plots PS and
VS (similarity index value 0.77), and 25 species were common to disturbed plots KS
and MS (similarity index value 0.62). Morisita-Horn index of similarity (quantitative)
showed an index value of 0.434 between undisturbed plots PS and VS, and 0.234
between disturbed plots KS and MS (Table 19). However, greater Morisita-Horn
index (0.79) was evident between plots VS and MS.
Cluster analysis
The overall comparison among the four plots made by cluster analysis using
single linkage clustering revealed that undisturbed plots PS and VS are the most
similar as seen by the shortest linkage (Euclidean) distance between them, and form a
single cluster (Fig. 15). The next most similar sample is plot KS, and joins the first
cluster KS and VS). The first cluster now has three plots combined in it. Finally, plot
MS joins the first cluster since it is the farthest sample with less similarity.
4.2. REGENERATION INVENTORY
Diversity of regeneration tree species
The diversity of regeneration trees (1 3 cm girth and < 30 cm gbh) in 0.4 ha
pooled sample from the four 2-ha study plots totaled 46 species in 38 genera and 25
plant families with a density of 1937 individuals (Table 20). Plot-wise, taxa diversity
was greatest with 36 species in 3 1 genera and 21 families in undisturbed plot PS, and
lowest with 12 species, 12 genera and 10 families in disturbed plot MS. Thus,
disturbed plot MS was 67 % species-poor as compared to undisturbed plot PS.
The diversity indices varied widely among the four plots (Table 20). The
Shannon diversity index ranged from a lowest value of 1.80 of disturbed plot MS to a
highest value of 3.29 of undisturbed plot PS. While Simpson's index, the reverse of

Table 19. Similarity between the four study plors for mature trees in the Koili
hills, as measured by using Sorenson sirnilaritq and 3forisi:a-Hom indices
(values in parentheses indicate the nun~ber of coinnlon species).
Index Study plot PS VS KS MS

Fig. 15. Dendrogram for mature trees of the four s r ~ d y plots using Single Linkage
Euclidean distances
p 0.5 - ' i 1
5 0.45 } 1
r:
3 0.4 1 1
0.35 j
i i
MS KS VS PS

Tabie 20. Consolidated details of diversity inventory of regeneration trees (5 3 cm
girth to < 30 cm gbh) in undisturbed (PS, VS) and disturbed (KS, MS) plots in the
Kolli hills.
Undisturbed Disturbed Variable Total
PS VS KS MS
Species richness (no.) 36 30 23 12 46
Number of genera 3 1 27 23 12 38
Number of families 2 1 16 17 10 25
Density (stems) 525 536 624 252 1937
Diversity index
Shannon (H') 3.29 2.86 2.50 1.80 3.14
Simpson (D) 0.04 0.07 0.10 0.25 0.06
Stand basal area (m2) 0.47 0.43 0.42 0.44 1.75

the Shannon, was lowest (0.04) for undisturbed study p!ot PS md was grcatest (0.25)
for plot MS. Species-area curves for regeneration trees of the study plots. except plot
KS, did not stabilize (Fig 16).
The density of regeneration plots ranged from 252 stems of plot MS to 624
stems of plot KS; a record of both lowest and greatest density from disturbed plots.
However, basal area of regeneration plots was lowest (0.42 m2) in disturbed plot MS
and greatest (0.47 m2) in undisturbed plot PS (Table 20).
Species density, dominance and rarity
The population density of individual tree species in the regeneration stand of
the Kolli hills varied greatly between undisturbed and disturbed plots.(Table 21). In
the total 0.4 ha regeneration study plots, four species, viz., Memecylon umbellaturn,
Neolitsea scrobiculata, Myristica dactyloides and Phoebe wightiii dominated the
stands. They scored an IVI of greater than 15 (Table 21). However, based on
abundance, the set of dominant species in undisturbed plots was different from that of
disturbed plots. Memecylon umbellaturn (120 stems), Myristica dactyloides (99) and
Antidesma menasu (83) were dominant in undisturbed plots. Memecylon umbellatum
(210 stems), Maesa indica (1 13) and Neolitsea scrobiculata (94) dominated disturbed
plots.
Based on abundance, the regeneration tree species encountered in the total 0.4
ha sample could be classified into 5 groups: very rare (species with density < 5
stems), rare (5 to 20 stems), common (21 to 80 stems), dominant (81 to 60 stems), and
predominant (> 160 stems). The very rare group constituted 9 species (20 %) and rare
group 16 species (35 %). The common group was composed of 12 species (26 %),
while dominant 8 species (17 %). Only one species (2.2 %) represented predominant
group. And the dominant group shared 50% per cent of density (Fig. 17).

Fig. 16. Species-area curves of the regeneration tree species inventoried in four
study plots PS, VS, KS and MS in the Kolli hills.
Cumulative area (ha)

Table 21. Population density of regeneration tree species i> 7 cxn gbh and < 30 cm
gbh) encountered in undisturbed (UDP;] and disturbed (DP) plots, their total basal
area (BA) and importance va!ue index (IVI) in the pooled 0.4 ha sample.
Densit? Species Family Be IVI
(m-)
UDP DP Total
1. Memecylon umbellaturn Burn~.f. Melastomaraceae
2. Neolitsea scrobiculata (Meisnerj Lauraceae Gamble
3 . Canthiurn dicoccum (Gaertn. j Rubiaceae Teijsm. & Binn. var. dicoccum
4. Myristica dactyloides Gaertn. Myristicaceae
5. Mallotusphilippensis (Lam.) Euphorbiaceaz Muel1.- Arg. var. philippensis
6. Maesa indica (Roxb.) DC. Myrsinaceae
7. Phoebe wightii Meisner Lauraceae
8 . Persea macrantha (Nees) Lauraceae Kosterm.
9. Antidesma menasu Miq. Euphorbiaceae
10. Cipadessa bacc@a (Roth) Miq. Meiiaceae
1 1. Oleapdniculata R. Br. Oleaceae
12. Nothopegia heyneana (H0ok.f.) Anacardiaceae Gamble
13. Elaeocarpus serratus L. Elaeocarpaceae
14. Ligusbumperrottetii A.DC. var. Oleaceae obovatum Gamble
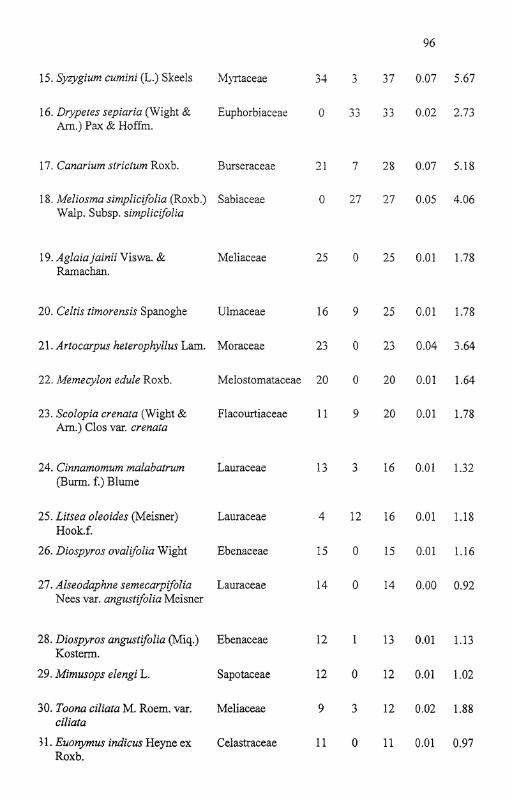
15. S y ~ g i u r n cumini (L.j Skeels l\-Iyr:aceae e - 34 3 1 0.07 5.67
16. Drypetes sepiaria (Wight & Euphorbiaccae 0 33 33 0.02 2.73 Am.) PLY & I-Ioffn~.
17. Canarium sfrictunz Roxb. Burseraceae 21 7 28 0.07 5.18
18. Meliosma simplic~oIia (Rosb.) Sabiaceae 0 27 27 0.05 4.06 Walp. Subsp, simplicifolia
19. -4glaia jainii Viswa. & Meliaceae 25 0 25 0.01 1.78 Ramachan.
20. Celtis tinzorensis Spanoghe Ulmaceae 16 9 25 0.01 1.78
21. Artocarpus heterophyllus Lam. Moraceae 23 0 23 0.04 3.64
22. Memecylon edule Roxb. Melostomataceae 20 0 20 0.01 1.64
23. Scolopia crenata (Wight & Flacourtiaceae 11 9 20 0.01 1.78 Am.) Clos var. crenata
24. Cinnamomum malabatrum Lauraceae 13 3 16 0.01 1.32 (Burm. f.) Blume
25. Litsea oleoides (Meisner) Lauraceae 4 12 16 0.01 1.18 H0ok.f.
26. Diospyros ovalifolia Wight Ebenaceae 15 0 15 0.01 1.16
27. Alseodaphne semecarpvolia Lauraceae 14 0 14 0.00 0.92 Nees var. angustifolia Meisner
28. Diospyros angustifolia (Miq.) Ebenaceae 12 1 13 0.01 1.13 Kosterrn.
29. Mimusops elengi L. Sapotaceae 12 0 12 0.01 1.02
30. Toona ciliata M. Roem. var. Meliaceae 9 3 12 0.02 1.88 ciliata
3 1. Euorpmus indicus Heyne ex Celastraceae 11 0 11 0.01 0.97 Roxb.

32. Jdar?gfera indica L. Xnacardiacrae 10 0 10 O.OE 0.81
33. Litsea insignis Gamble Lauraceae 9 0 9 0.01 0.93
34. Murrayupanicuiata (L.) Jack Rutaceae 9 0 9 0.00 0.63
35. ,!4allotus stenanthus Muel1.- Euphorbiaceae 7 0 7 0.00 0.46
36. Ligustrurn robusturn (Roxb.) Oleaceae 6 0 6 0.00 0.71 Blume subsp. walkeri (Decne.) P.S. Green
37. Meliosmapinnatu (Roxb.) Walp. Sabieceae 6 0 6 0.01 0.82 subsp. arnottiana (Wdp.) Beus.
38. Callicarpa tomentosa (L.) Murr. Verbenaceae 0 4 3 0.01 0.58
39. Syrnplocos cochinchinensis Syniplocaceae 3 i 4 0.00 0.27 (Lour.) Moore subsp. laurina (Retz.) Nooteb.
40. Allophylus serratus (Roxb.) Sapindaceae 3 0 3 0.00 0.19 Kurz
4 1. Cellis tetrandra Roxb. Ulmaceae 3 0 3 0.00 0.18
42. BischoJia javanica Blume Bischofiaceae 0 2 2 0.01 0.45
43. Glochidion malabaricum Bedd. Euphorbiaceae 2 0 2 0.00 0.13
44. Litsea deccanensis Gamble Lauraceae 2 0 2 0.00 0.33
45. Pavetta indzca L. liar. indica Rubiaceae 2 0 2 0.00 0.1 1
46. Miliusa tomentosa (Roxb.) Annonaceae 1 0 1 0.00 0.07 Sinclair
Total 1061 876 1937 1.75 200

Fig. 17. Per cent composition of predominant to rare groups of
regeneration tree species and their abundance (%) in the Kolli hills
-
I
Very rare 1 - !I
Rare
p=j, Common
Abundance
: Svecies
Dominant
Predominant
Composition (%)

Diversip ofseedlings and saplings
The species richness of seedlings (28 to 35 species) and saplings (23 species)
enumerated in the undisturbed plots PS and VS was greater t h ~ ~ those of seedlings (8
to 19 species) and saplings (12 to 19 species) in the disturbed plots KS and MS (Table
22). From this, it is derived that mean species richness of disturbed plots, compared to
undisturbed plots, was lower by 56 % of seedlings and 33 % of saplings.
The density of seedlings and saplings in the study plots varied widely (Table
22). An overall density of seedlings was 1227 individuals (63 %j and that of saplings
710 individuals (37 %). Plot-wise lowest density (61 individuals) as well as greatest
density (465 individuals) of seedlings was recorded from the disturbed plots, MS and
KS respectively. Although the sapling density did not vary much between the plots,
the lowest and greatest densities of saplings (159 and 191 individuals) were recorded
from the disturbed plots KS and MS respectively. In the case of mature trees (2 30 cm
gbh) enumerated in the whole plot, their diversity (51 and 58 species) and density
(1054 and 1151 stems) were greater in the undisturbed plots PS and VS.
Comparatively the mature tree diversity (39 and 42 species) and density (651 and 969
stems) of the disturbed plots KS and MS were lower (Table.22).
The total basal area of entire regeneration plots contributed by seedlings was
0.37 m2 (21 %) and that of saplings 1.3 m2 (79 %). Among the individual plots,
greatest basal area contribution by seedlings (0.14 m2, 34 %) was from disturbed plot
KS and that of saplings (0.41 rn2, 94 %) from the other disturbed plot MS.
Family diversity and density
The diversity of plant families in regeneration plots was 25 families with 38
genera and 46 species. Undisturbed plots harbored 22 plant families with 34 genera
and 40 species; while disturbed plots 18 plant families with 25 genera and 25 species


(Table.23). In the pooled 0.4 ha samples, species-rich farniiies of regeneration trees
include Lauraceae (with 8 species from 6 genera) and Euphorbiaceae (4 species from
3 genera); and the most abundant families were Lauraceae (420 stems. 22 % j and
Melastomataceae (350 stems, 18 %). 002615 Girth-class diversity and stand strucrure
The species richness and density of both undisturbed and disturbed plots, in
general, decreased with increase in girth class. However, the 5 - 10 cm class of
undisturbed plots, and 5 - 15 cm classes of disturbed plots had greater diversity and
density than the preceding girth (3 - 5 cm) class (Table 24). Basal area contribution
by different girth classes ranged from 0.66 m2 of 3 - 5 cm girth to 0.48 m2 of 15 - 20
cm girth. The basal area contribution progressively increased with girth class increase
up to 15 - 20 crn girth. Later on, it decreased with increase in girth class (Table 24).
The regeneration stand structure based on per cent density and basal area
contribution by different.girth classes (Fig. 18) revealed the following. The pooled 0.4
ha sample of the four plots as well as the individual disturbed and undisturbed plots
harboured greater density in 5 - 10 cm girth class, and greater basal area in 10 - 20 cm
size class (Fig.18).
P diversity and cluster analysis
The Sorenson similarity (qualitative) for the regeneration between the study
plots revealed that there existed a similarity ranging from 38 % to 79 % between them
(Table 25). Of the 46 tree species, recorded in the regeneration stands, 26 species
were shared by undisturbed plots PS and VS (similarity index 0.79), and 10 species by
disturbed plots KS and MS (similarity index 0.57).
Cluster analysis, by single linkage clustering, used to compare the four study
plots revealed that undisturbed plots PS and VS are the most similar with shortest

Tabie 23. Family diversity and densir! of rege~leratic~? trees in unilstlirbcd (L'DI')
and disturbed (DP) plots in the Kolli hills (G - genera; S - species; D - density).
UDP D ? Total Family
G S D G S D G S D
1. Lauraceae 6 8 236 5 5 184 6 8 420
2. Melastomataceae 1 2 140 1 1 210 1 2 350
3. Euphorbiaceae 3 4 139 3 3 98 4 5 217
4. Rubiaceae 2 2 36 1 1 87 2 2 123
5. Myristicaceae 1 1 99 1 1 22 1 1 121
6. Myrsinaceae 0 0 0 1 1 113 1 1 113
7. Meliaceae 3 3 57 2 2 58 3 3 115
8. Oleaceae 2 2 69 1 1 37 2 3 106
9. Anacardiaceae 2 2 55 0 0 0 2 2 55
10. Elaeocarpaceae I 1 40 1 1 4 1 1 43
11. Myrtaceae 1 1 3 4 1 1 3 1 1 3 7
12. Sabiaceae 1 1 6 1 1 2 7 1 2 3 3
13. Burseraceae 1 1 2 1 1 1 7 1 1 2 8
14. Ebenaceae 1 2 2 7 1 1 1 1 2 2 8
15. Ulmaceae 1 2 1 9 1 1 9 1 2 2 8
16. Moraceae 1 1 2 3 0 0 0 1 1 2 3
17. Flacourtiaceae 1 1 11 1 1 9 1 1 20
18. Sapotaceae 1 1 1 2 0 0 0 1 1 1 2
19. Celastraceae 1 1 1 1 0 0 0 1 1 1 1
20. Rutaceae 1 1 9 0 0 0 1 1 9
21. Verbenaceae 0 0 0 1 1 4 1 1 4
22. Symplocaceae 1 1 3 1 1 1 1 1 4
23. Sapindaceae 1 1 3 0 0 0 1 1 3
24. Bischofiaceae 0 0 0 1 1 2 1 1 2
25. Annonaceae 1 1 1 0 0 0 1 1 1
Total 34 40 1061 25 25 876 38 46 1937

Table 24. Species richness (S), population density (Dl. and basal area in m' (BA)
of different girth classes of regeneration trees in the Kolii bills
Girth class Undisturbed Disturbed Total
Total 40 1061 0.892 25 876 0.855 46 1937 1.747

Fig. 18. Regeneration stand structure based oil per cent dsnsir! arid basal area of differan:
girth classes in (a) the total, (b) undisturbed and (c) distarkd study plots of :he Kolli hi!ls.
Girth class (cm)
r Q Density BA i

Table 25. Similarity between the four study plots for regeneration trees in the
Kolli hills, as measured by using Sorenson similarity index (values in parentheses
indicate the number of common species).
Index Study plot PS VS KS MS

linkage distance and hence formed a single cluster (Fig 1'31. The text most similar
sample is plot KS, which joins the first cluster (PS-VS) at a distancc of 0.6. Finally.
plot MS joins the first cluster, at a wide distance of 0.7 Euclidean distance.
4.3. LIANA INVENTORY
Liana species diversity
The diversity of lianas (2 5 cm gbh) in the Koili hills for the pooled 8 ha
sample totaled 26 species in 24 genera and 18 families (Table 26). The range of
species, genera and family richness in the four 2-ha study plots was 9 to 21, 9 to 19
and 7 to 15 respectively. The four study plots shared five (19 %) species. It can be
deduced from the Table 26 that the richness of liana taxa was 35 % lower in disturbed
study plots than in undisturbed plots.
The diversity indices of Shannon (H') and Hill @I), like the taxa richness,
were also lower in disturbed study plots than in undisturbed study plots, but Simpson
(D) and evenness (El) indices were similar for both disturbed and undisturbed plots
(Table 26). The indices of H', D, N1 and El for the pooled 8 ha sample of the Kolli
hills were 2.89,0.06, 18.04 and 0.88 respectively.
The liana density in the 8 ha sample was 384 individuals with a mean density
of 48 individuals ham1. The density per plot ranged from 25 to 156 individuals. The
basal area of lianas (2 5 cm gbh) in the 8 ha sample was 0.23 m2ha-'. Basal area of
lianas in disturbed plots was 78 % lower (0.02 and 0.1 5 m2 haq1) than in undisturbed
plots (0.40 and 0.37 m2 ha-').
The species-area accumulation c w e s stabilized for the plots PS and KS.
While for the other two plots VS and MS, the curves did not stabilize (Fig. 20). Of the
two estimator curves for the pooled 8 ha sample, ACE best satisfied the liana data of
the Kolli hills. The observed curve (Sobs) lags behind the expected c w e s of ACE and

Fig. 19. Dendrogram for regeneration trees of the four plots using Single Linkagz
Euclidean distances

Table 26. Consolidated details of quantitalive biodiversity inventory of lianas 2 5 cm
gbh in four 2 ha plots of tropical evergreen forest in tile Kolli hiiis.
Variable Undisturbed Disturbed 8 ha
PS VS ICS 34s Totai
Species richness per plot 2 1 16 9 I? 26
Species richness ha-' 21; 17 16; 14 9; 2 14; 10
Genus richness 19 15 9 13 24
Family richness 15 14 7 12 18
Diversity index
Shannon (H') 2.60 2.44 2.02 2.3 1 2.89
Simpson (D) 0.09 0.10 0.12 0.11 0.06
Hill (NI) 13.41 11.48 7.55 10.02 18.04
Evenness (El) 0.85 0.88 0.92 0.88 0.89
Density hd1 (stems) 56.5 78 12.5 45 48
Basal area (m2 ha-') 0.40 0.37 0.02 0.15 0.23

Fig. 20. Liana species-area curves for the study plots PS, VS, KS and MS in the
Kolli hills.
2 5
0 0.2 0.4 0.6 0.8 1 1.2 1.4 1.6 1.8 2 Cumulative area (ha)
Fig. 21. Species richness estimator curves of lianas in the Kolli hills
2 4 6 8 Cumulative area (ha)

ICE by 2 species and 4 species respectively (Fig. 21). The non-parametric species
richness estimators yielded an overestimate. The estimated liana species richness
ranged from 28 species of Chao 1 and Chao 2, to 3 1 species of Jacknife 1 (Table 27).
There were 3 singletons, 2 doubletons, 6 uniques and 1 lduplicates of lianas in the 8
ha sample.
Speciespopulation density and basal area of lianas
The population density of individual liana species varied considerably in the
disturbed and undisturbed study plots (Table 28). The set of abundant liana species of
individual study plot varied. Hiptage benghalensis (Malphighiaceae, 14 %),
Diploclisia gIauscescens (Menispermaceae, 14 %) and Morinda umbellata
(Rubiaceae, 12 %) were abundant in the undisturbed plot PS. Hiptage benghalensis
(15%), Jasminurn azoricum (Oleaceae, 12 %) and Zanthoxylum tetraspermurn
(Rutaceae, 10 %) together dominated the other undisturbed plot VS. Whereas in the
disturbed plots KS and MS, stragglers Zanthoxylum tetraspermum (28%) and
Toddalia asiatica (Rutaceae, 16 to 19 %) were predominant. In the total 8 ha area,
Hiptage benghalensis (12 %) and Zanthoxylum tetraspermurn (1 1 %) shared major
liana stand density.
The contribution of individual liana species to stand basal area varied greatly
(Table 28). Hiptage benhalensis (0.238 m2, 13 %), Gnetum ula (0.203 m2, 11 %) and
Eelaeagnus indica (0.194 m2, 10 %) together contributed maximum basal area (34 %)
to the total stand.
Species IVI, dominance and rarity
Importance value index (IVI) of individual liana species in the 8 ha (Table 28;
Fig. 22) showed that Hiptage benghalenis was the dominant species with an IVI of
25.0, followed by Elaeagnus indica (IVI 17.1) and Gnetum ula (IVI 16.9).

Table 27. Results of species richness estimators for lianas (2 5 crn gbh)
inventoried in the 8 ha plot of the Kolli hills.
Diversity value (+ SD) for cunlulative area Variable
2 ha 4 ha 6 ha 8 ha
Sobs 1 5 2 4 21 t 3 24 t 1 26 k 0
Individuals 97 1- 46 195 + 58 281 + 46 384 + 0
ACE 161-5 23 t 4 2 7 F 2 28 + 0
ICE 0 4 7 + 17 3 7 i 6 30 + 0
Chao 1 1 7 + 3 24 1- 5 2 7 k 3 28 i 3
Chao 2 0 31 F 7 32 F 6 2 8 k 2
Jacknife 1 1 5 + 0 27 k 3 31 + 3 31 + 2
Jacknife 2 0 27 34 30
Bootstrap 14.7 23.8 27.9 28.6


oze sey
pad Lea

Species ranking of Iianas in the 8 ha sampie analyzed on thz basis of IVI and
(Table 28) showed a great variation. For instance, the second most
abundant species Zanthoxylum tetraspermurn ranked fourth in IVI (14.6). On the other
hwAd, the fourth abundant species Elaeagnus indica was ranked second in IVI (17.1).
Similarly, the seventh abundant species Gnetum ula ranked third (IVI 16.9) due to its
greater basal area (0.238 m2).
Lima species based on their abundance in the 8 ha area could be classified
into very rare, rare, common and dominant species (Table 29). Rare and very rare
categories together possessed 17 species, accounting for 65 % of liana species rarity
in the Kolli hills. Frequency based categories of liana individuals (Table 29) revealed
42 % of species to be found in category B (species occurring in two plots only), 23 %
of category B (species occurring in only one plot) and 16 % of category C and 19 %
of category D followed this.
Family diversity and density
A total of 18 liana families were encountered in the 8 ha sample. Of them, 15
families were dicots, 2 families were monocots and one family (Gnetaceae) of
gymnosperms. Undisturbed plots (PS and VS) harbored 16 families comprising 20
genera and 22 species; whereas the disturbed plots (KS and MS) harbored 14 families
with 16 genera and 17 species (Table 30).
The species-rich liana families include Mimosaceae (3 genera, 3 species) and
Vitaceae (2 genera, 3 species). Rutaceae, Oleaceae, Rubiaceae and Menispemaceae
were represented by two species each, while the other 12 families (67 %) were
represented by single species in the whole inventory. Rutaceae was the densest (64
individuals, 17 %) liana family followed by Oleaceae (13 %) and Malpighiaceae (12

Table 29. Abundance and frequency based classification of lianas 2 5 cm gbh, liana
species richness and density of each group recorded in the 8 ha sample of the Kolli
hills.
Abundance Species richness Lima density Group (individuals in 8-ha) Number % Number %
> 41 Dominant 02 7.7 8 9 23.2
21 to 40 Common 07 26.9 174 45.3
5 to 20 Rare 10 38.5 108 28.1
1 to 4 Very rare 07 26.9 13 3.4
Total 26 100 3 84 100
Frequency Category Total species (%)

Table 30. Liana family diversity in the undisturbed plot (UDP) and disturbed plot
(DP) in the Kolli hills (G -No. of genera; S - No. of species; D - Density).
UDP DP Total Family
G S D G S D G S D
1. Rutaceae 1 1 18 2 2 4 6 2 2 6 4
2. Oleaceae 1 2 4 2 1 2 9 1 2 5 1
3. Malpighiaceae 1 1 4 3 1 1 4 1 1 4 7
4. Vitaceae 2 3 2 4 1 1 4 2 3 2 8
5. Rubiaceae 2 2 2 3 2 2 5 2 2 2 8
6. Elaeagnaceae 1 1 14 1 1 1 2 1 1 2 6
7. Menispermaceae 1 1 22 1 1 2 2 2 24
8. Myrsinaceae 1 1 1 5 1 1 9 1 1 2 4
9. Gnetaceae 1 1 12 1 1 1 1 1 1 2 3
10. Mimosaceae 3 3 1 6 1 1 3 3 3 1 9
11. Apocynaceae 1 1 1 4 1 1 1 1 1 1 5
12. Passifloraceae 1 1 1 4 0 0 0 1 1 1 4
13. Moraceae 1 1 5 1 1 1 1 1 6
14. Asclepiadaceae 1 1 5 0 0 0 1 1 5
15. Rharnnaceae 0 0 0 1 1 5 1 1 5
16. Liliaceae 0 0 0 1 1 3 1 1 3
17. Ranunculaceae 1 1 1 0 0 0 1 1 1
18. Araceae 1 1 1 0 0 0 1 1 1
Total 20 22 269 16 17 115 24 26 384

%), while a single liana individual in the entire 8-ha represented Ranuncuiaceae and
Araceae (Table 30).
Girth class diversity and density
The diversity and density of different liana girth classes in undisturbed and
disturbed plots varied (Table 31). Species richness and density of lianas were greater
in 5 - 10 cm girth class in the disturbed plots KS and MS than in the undisturbed plots
PS and VS, while lianas > 10 cm girth were with lower diversity and density in the
disturbed plots than those in the undisturbed plots.
The maximum liana diversity contributed by a particular girth class varied
between study plots. In plot PS, the lianas of 10 - 15 cm girth class formed the
maximum diversity (14 species), while in plot VS, the 20 - 25 cm girth class showed
maximum diversity (12 species). Whereas, the disturbed plots KS and MS had
relatively greater diversity (9 species) in the 5 - 10 cm girth class (Table 3 1).
The maximum density attained by a particular girth class in the four study
plots also varied. In the undisturbed plot PS, > 30 cm gbh class was most abundant
(30 individuals). Whereas, 15 - 20 cm girth class was denser in plot VS (35
individuals), and in plot MS (26 individuals). In the disturbed plot KS, 5 - 10 cm girth
class was abundant with 16 individuals. In the entire 8-ha area, greatest liana diversity
(19 species) and density (79 individuals) were found in 15 - 20 cm girth class.
Liana stand structure
The stand structure of lianas based on density and basal area contribution (in per
cent) by different girth classes (Fig. 23) revealed the following: the undisturbed plots
PS and VS contained greater percentage of individuals and basal area in larger girth
classes (> 20 cm); whereas, the disturbed plots KS and MS had greater percentage of
liana density and basal area in smaller girth classes (< 20 cm).

Table 3 1. Girth class species richness (R) and density (D) of lianas in the four 2 ha
plots of tropical evergreen forest sites (PS, VS, KS & MS) in the Kolli hills.
Girth class Undisturbed Disturbed PS V S KS MS Total
Total 21 113 16 156 9 25 14 90 26 384

Fig. 23. Liai~a stand structure in the four plots ofthe Kolli hills.
1 Site VS 50 4 40
3 0
20
10
0
5 to 10 10to 15 15 to20 20 to25 25 to 3 0 1 3 0
Girth class (cm)
1 Density I Basal area 1
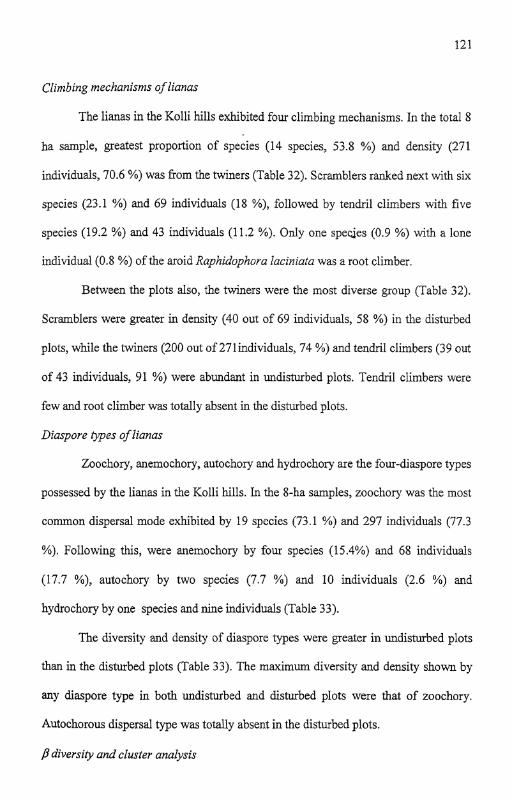
Climbing mechanisms of lianas
The lianas in the Kolli hills exhibited four climbing mechanisms. In the total 8
ha sample, greatest proportion of species (14 species, 53.8 %) and densiry (271
individuals, 70.6 %) was from the twiners (Table 32). Scramblers ranked next with six
species (23.1 %) and 69 individuals (18 %), followed by tendril climbers with five
species (19.2 %) and 43 individuals (1 i.2 %). Only one specjes (0.9 %) with a lone
individual (0.8 %) of the aroid Raphidophora laciniata was a root climber.
Between the plots also, the twiners were the most diverse group (Table 32).
Scramblers were greater in density (40 out of 69 individuals, 58 %) in the disturbed
plots, while the twiners (200 out of 27lindividuals, 74 %) and tendril climbers (39 out
of 43 individuals, 91 %) were abundant in undisturbed plots. Tendril climbers were
few and root climber was totally absent in the disturbed plots.
Diaspore types of lianas
Zoochory, anemochory, autochory and hydrochory are the four-diaspore types
possessed by the lianas in the Kolli hills. In the 8-ha samples, zoochory was the most
common dispersal mode exhibited by 19 species (73.1 %) and 297 individuals (77.3
%). Following this, were anemochory by four species (15.4%) and 68 individuals
(17.7 %), autochory by two species (7.7 %) and 10 individuals (2.6 %) and
hydrochory by one species and nine individuals (Table 33).
The diversity and density of diaspore types were greater in undisturbed plots
than in the disturbed plots (Table 33). The maximum diversity and density shown by
any diaspore type in both undisturbed and disturbed plots were that of zoochory.
Autochorous dispersal type was totally absent in the disturbed plots.
p diversity and cluster analysis

Table 32. Lima diversity and density of various climbing mechanisms recorded in the
undisturbed plot (UDP) and disturbed plot JDP) of the Kolli hills (S - number of
species; D - density).
UDP DP Total Climbing mechanism
S D S D S D
Twiners 11 200 12 7 1 14 27 1
Scramblers 4 29 4 40 6 69
Tendril climbers 5 3 9 1 4 5 43
Root climber 1 1 0 0 1 1
Total 22 269 17 115 26 3 84
Table 33. Liana diversity and density of various diaspore types recorded in the
undisturbed plot (UDP) and disturbed plot (DP) of the Kolli hills (S -number of
species; D - density).
Diaspore type UDP DP Total
S D S D S D
Zoochory 15 190 14 107 19 297
Anemocliory 4 63 2 5 4 6 8
Autochory 2 10 0 0 2 10
Hydrochory 1 6 1 3 1 9
Total 22 269 17 115 26 384

The Sorenson similarit) iqilalitative) index revealed that the liana study plots
possessed 40 % to 81 % similarities monp them. Of the total 26 liana species,
tundisturbed plots (PS and VS) shared 15 species and disturbed plots (RS and MS)
shared 6 species between them. Morisita-Horn iildex of simiiarity (quantative)
showed an index value of 0.65 beween undisturbed plots PS and VS, and 0.71
between disturbed plots KS and MS (Table 34).
Cluster analysis by single linkage clustering (Fig. 24) revealed that
undisturbed plots PS and VS are the most similar pair with shortest Iinlcage distance
(0.28) between them, forming a single cluster. The next most similar sample is plot
MS, which joins the first cluster PS-VS at a distance of 0.57. Finally, plot KS joins
the cluster at 0.75 linkage distance.
Host free diversity and liana-host relationships
In the total 8 ha study plots, 39 tree species (50 %) hosted the 26 liana species
(Table 35). These tree species comprised 336 individuals and were fiom 34 genera
and 22 families.
By examining Table 35, it is derived that the liana species . host species ratio
was 2 : 3 (26 : 39) and the liana individuals : host individuals ratio was 1 : 1 (345 :
336). Of the 39 host trees, Mernecylon umbellaturn (Melastomataceae) with 64
1 individuals (19 %) and Olea paniculata (Oeaceae) with 54 individuals (16 %) were
1 the most frequent host trees. They were followed by Mallotus philippensis
(Euphorbiaceae) and Syzygium cumini (Myrtaceae), each with 23 host individuals in
the forest stand.
The number of trees hosting lianas gradually decreased with increase in tree
girth class in all the four study plots (Table 36). Though the host density varied with
increase in trellis height class, the host density increased progressively up to 4 - 6 m

Table 34. Similarity between the four study plots for llanas in the Kolli hills, as
measured by using Sorenson similarity and Morisita-Horn indices (values in
parentheses indicate the nunber of common species).
Index Study plot P S VS KS MS
PS 1 0 81 (15) 0.40 (06) 0.63 (1 1)

Fig. 24. Dendrogram for liana species of the four plots using Single Linkage
Euclidean distances

Table 35. Population density (PD) of iaost tree species 2 30 cm gbh rccorded in the 8
ha study area, maximum gbh (MG) recorded in the plots. Inzan trellis height (MT), and
number of individuals hosting lianas (Hi) obsetvec! and expected (in parcnthescs) in
the Kolli hills. -- -
Species
- -
PD MG MT HI X 2
(no.) (cm) (4 (no.) value
Mernecylon urnbellaturn Burm. f.
Phoebe wightii Meisner
Olea paniculata R.Br.
Neolitsea scrobiculata (Meisner) Gamble
Myristica dactyloides Gaertn.
Mallotusphilippensis (Lam.)
Muel1.- Arg. var. philippensis (Lam.) Muell.- Arg.
Syzygium cumini (L.) Skeels
Scolopia crenata (Wight & Am.) Clos var. crenata (Wight & Am.) Clos
Nothopegia heyneana (Hook. f.) Gamble
Meliosma sirnplicifolia (Roxb.) Walp. subsp. simplicifolia (Roxb.) Walp.
Diospyros ovalifolia Wight
Persea macrantha (Nees)
Kosterm.
Artocarpus heterophyllus Lam.
Other 26 species
Total 3396 408.1 5.1 336 127.02
Values significant at p < 0.05, after Bonferroni correction
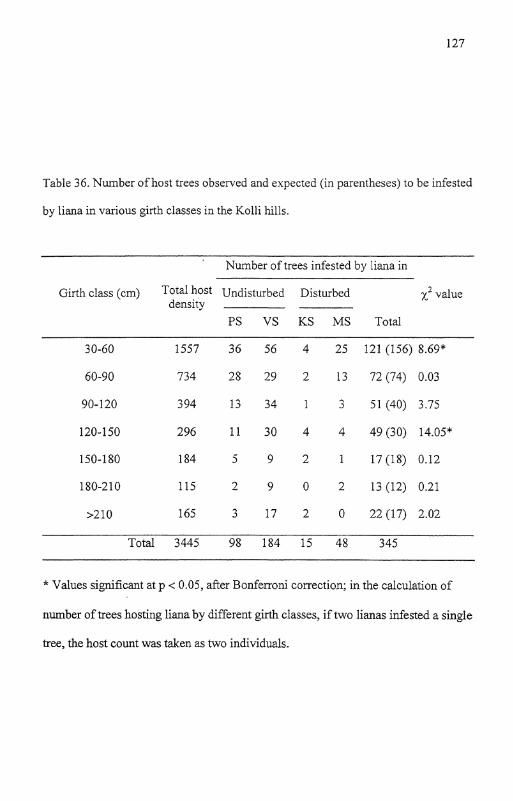
Table 36. Number of host trees observed and expected (in parentheses) to be infested
by liana in various girth classes in the Kolli hills.
Number of trees infested by liana in
Girth class (cm) Total host Undisturbed Disturbed X 2 value densiry
PS VS KS MS Total
30-60 1557 36 56 4 25 121 (156) 8.69*
60-90 734 28 29 2 13 72 (74) 0.03
90-120 3 94 13 34 1 3 51(40) 3.75
120-150 296 11 30 4 4 49 (30) 14.05*
150-180 184 5 9 2 1 17 (18) 0.12
180-210 115 2 9 0 2 13(12) 0.21
>210 165 3 17 2 0 22 (17) 2.02
Total 3445 98 184 15 48 345 -
* Values significant at p < 0.05, after Bonferroni correction; in the calculation of
number of .trees hosting liana by different girth classes, if two Iianas infested a single
tree, the host count was taken as two individuals.

height and later, it increased (Table 37). The ;:' lest dezonstrated that the number of
host trees of particular gbh and trellis height differed significantly from what was
expected. By studying the histograms in Figs 25 and 26, it is evident that the lianas in
the Kolli hills frequently infested host trees of 120 - 150 cm gbh classes (Fig. 25) and
4 - 6 m trellis height classes (Fig. 26).
3.4. UNDERSTORY PLAVT INVENTORY
Species diversity of understory plants
The understory plant diversity sampled in the 8-ha study plots of tropical
evergreen forest in the Kolli hills totaled 52 species, 49 genera, and 35 families, with
a population density of 9680 individuals (Table 38). Species richness of individual
study plots varied from a lowest value of 19 species of disturbed plot MS to a highest
value of 42 species of undisturbed plot PS. However, the mean population density
(2093 individuals) of undisturbed plots was lower than the mean population density
(2748 individuals) of disturbed plots (Table 38).
The mean species richness (22 species) of disturbed plots KS and MS was
46.4 % lower than that (41 species) of undisturbed plots PS and VS. The richness of
genus and family of disturbed plots was also lower by 43 % and 38 % respectively,
compared to the mean values of undisturbed plots. The diversity indices, Shannon
(H'), Simpson @), Hill (NI) and evenness (El) index marginally varied for the four
study plots.
Species-area curves of the four 2-ha study plots stabilized at 1.2 ha to 1.4 ha
scale (Fig.27). The asymptote curves suggest that the samples captured most of the
species in the study plots. The estimator diversity values (Table 39) and the curves for
the pooled 8 ha sample indicate that ACE best satisfied the data (Fig.28). The
observed curve (Sobs) and the expected curves of ACE were similar; but Sobs lags

Table 37. Number of host trees observed and expected (in parentheses) to be infested
by liana in various trellis height classes in the Kolli hills
Number of trees infested by liana in Trellis height class
Total host Undisturbed Disturbed X 2 value (m) density
PS VS KS MS Total
0- 1 368 1 1 23 2 13 49 (37) 4.45
Total 3445 98 184 15 48 345
* Values significant at p < 0.05, after Bonferroni correction; in the calculation of
number of trees hosting liana by trellis height classes, if two lianas infested a single
tree, the host count was taken as two individuals.

Fig. 25. Relative frequency of individuals of the t h e e statistically significant host
tree species and all species combined ploted against gbh classes.
60 Olea paniculata 50 Neolitsea scrobiculata
$. 40 Fl Phoebe wightii All species combined
& 30 C)
.2 20 .cI
4 10 cC
0
30-60 60-90 90-120 120-150 150-180 180-210 > 210
Girth class (cm)

Fig. 26. Mean trellis hieght of individuals of the three statistically significant host
tree species and all species combined ploted against gbl~ classes.
E OIea paniculata El Neolitsea scrobiculata
Phoebe wightii All species combined I
Girth class (cm)

Table 38. Consolidated details of understory plant inventory in each 2 ha plot of sites
Perurnakkai shola (PS), Vengodai shola (VS), Kuzhivalavu shola (KS) and
Mottukkadu shola (MS) in the tropical evergreen forest of Kolli hills.
Variable Undisturbed Disturbed
Total P S VS Mean KS MS Mean
Species richness
Number of genera
Number of families
Population density
Diversity index
Shannon (H')
Simpson (D)
Hill (N1)
Evenness (El)

Fig. 27. Species-area curves of understory plants in study plots PS, VS, KS and
MS in the Kolli hills.
0.2 0.4 0.6 0.8 1 1.2 1.4 1.6 1.8 2
Cumulative area (ha)
Fig. 28. Species richness estimator curves of understory plants in the Kolli hills.
2 4 6 8 Cumulative area (ha)

Table 39. Results of species richness for understory plants inventoried
in the 8 ha plot of the Kolli hills.
Diversity value (2. SD) for cumulative area Variable
2 ha 4 ha 6 ha 8 ha
Sobs 2 9 t 10 41 f 7 47 f 3 52 1.0
Individuals 2440 + 336 4830 + 431 7322 + 335 9680 t 0
ACE 30 -t 10 41 f 7 47 +- 3 5 2 f 0
ICE 0 74+-16 6 8 + 4 66 f 0
Chao 1 27 f 2 42 + 1 47 f 1 5 2 f 0
Chao 2 0 5 2 + 6 6 4 k 10 64 +- 7
Jacknife 1 29 t 0 51 t 6 60 + 8 65 f 7
Jacknife 2 0 5 1 64 69
Bootstrap 29.2 46.1 53.2 58.2


16. P
eper
omia
tetr
aphy
lla (F
orst
. f.)
Hoo
k. &
Am
.
17. P
ilea
mel
asto
moi
des
(Poi
r.) B
lum
e
18. C
ynog
loss
um z
eyla
nicu
m (
Vah
l ex
13or
nem
.) T
hunb
. ex
Leh
m.
19. P
assi
jlora
edu
lis S
ims
20. P
teri
s gu
adri
auri
ta R
etz.
21. P
assi
flora
sub
pell
afa
Ort
ega
22. S
olan
um n
igru
m L
.
23. A
niso
mel
es i
ndic
a (L
.) K
uniz
e
24. E
lato
stem
a lin
eola
tum
Wig
ht va
r.lin
eola
furn
Iioo
k. f
.
25. J
ustic
ia g
labr
a K
oen.
ex P
oxb.
26. C
ansj
era
rhee
di G
mcl
.
27. C
omm
elin
a be
nghu
lens
is L
.
28. A
rgyr
eiap
ilos
a &
TI.
Pug
ill.
29. A
spar
agus
rac
emos
us W
illd
.
30. G
ymne
ma
sylv
eslr
e (R
etz.
) R. B
r. e
x Sc
hultc
s
3 1.
Hyd
roco
tyle
java
nica
Thu
nb.
32. L
anta
na c
amar
a L
. var
acu
leal
ea (I
,.)
Mol
d.
33. A
d~.n
oste
mm
a lave
nia
(L.)
Kul
itze
var.
retic
ulur
un7
(DC
.)
Pan
igra
hi
34. C
rola
lari
a lo
ngip
es W
ight
&A
m.
35. C
assi
ajor
ibun
da C
av.
Pip
erac
eae
Urt
icac
eac
Bor
agin
acea
e
Pas
siflo
race
ae
Pte
rida
ceae
I'ass
iflor
acca
e
Solm
acea
c
Lam
iace
ae
Urt
icac
eae
Aca
ntlla
ceae
Opi
liace
ac
Col
ll~ne
linac
cae
Con
volv
ulac
eac
Asp
arag
acea
c
Asc
lcpi
adac
eac
Api
acea
e
Ver
bc~l
acea
e
Ast
erac
eae
Pap
ilion
acea
c
Cac
salp
inia
ccac

36. B
egon
ia m
alab
aric
a L
am.
Bcg
onia
ceae
12
-
2 -
14
12
0.46
37. D
iosc
orea
opp
ositi
folia
L. v
ar. o
ppos
tifol
ia
Dio
scor
eace
ae
6 7
- -
13
11
0.51
38. X
enac
anth
uspu
lney
ensi
s (C
lark
e) B
rem
ek.
Aca
ntha
ccac
13
-
13
10
0.45
39. A
syst
asia
cri
spat
a B
enth
. A
cant
hace
ae
- 12
-
- 12
10
0.
41
40. M
urda
nniu
esc
ulen
ta (
Wal
l. ex
Cla
rke)
Rai
zada
ex
R. R
ao &
C
omm
elin
acea
c -
12
- -
12
9 0.
38
Kam
mat
hy
4 1.
Sol
ena
amp1
exic
auli.
s (L
am.)
Gan
dhi
42. N
ican
drap
hysu
lode
s (L
.) G
aert
n.
43. D
orst
enia
ind
ica
Wal
l. E
x W
ight
Cuc
urbi
tacc
ae
11
- 11
8
0.46
Sola
nace
ae
11
- -
11
8 0.
37
Mor
acea
e 11
-
11
7 0.
24
44. B
alan
opho
ra~f
ungo
sa J.R
. & G
. For
st. s
ubsp
. ind
icu
(Arn
.)
Ral
anop
hora
ceae
5
4 -
- 9
6 0.
28
Han
scn
45. P
ogos
tem
onpa
nicu
latu
s (W
illd.
) B
cilth
.
46. C
arex
late
ralis
Kue
k.
Lam
iace
ac
8 -
- 8
6 0.
30
Cyp
erac
eae
8 -
8 4
0.21
47. A
cant
heph
ippi
urn
bico
lor
Lin
dl.
Orc
hida
ceae
6
- 6
5 0.
35
48. S
cute
llari
a vi
oluc
ea I
leyn
e ex
Ben
th.
Lar
niac
cae
- 6
- 6
5 0.
22
49. C
hrom
olue
nu o
dora
ta (
L.)
Kin
g &
Rob
inso
n A
ster
acea
e 5
- -
5 4
0.21
50. A
niso
chilu
s ca
rnos
us (L
.f.)
Wal
l. ex
Ben
th.
1,am
iacc
ae
3 -
3 3
0.13
5 1. P
iper
nig
runz
L.
Pipe
racc
ac
2 -
2 2
0.08
52. O
xalis
lut$
oliu
H.B
.K. N
ov.
Oxa
lidac
eae
2 -
2 1
0.05
--
-
Tot
al
2158
20
27
2865
26
30
9680
31
57
200
+-4 L>
m
Das
hes
indi
cate
spe
cies
abs
ence
.
1: but 5 8 individuals) were eight ("i.4 $6). The rarity (rare + very rare) of understory
plants was 75 %.
Frequency distrzbution of understoly speczes
The overall trend in the distribution of species and their per cent abundance
against frequency class of individua!~ was juxtaposed (Fig. 29). About 65 % of
species, each with 40 or fewer individuals (density 5 5 individuals) shared only 8 %
of total density, while just five species (9.6 %), each with > 160 individuals per
species accounted for 67 % of total understory plant density.
The species rank-abundance description for the pooled 8 ha sample (Fig. 30)
showed species one with two-fold density greater than the succeeding species two.
From species three onward the population density fell sharply, declining to 100
individuals at species 13. Species 14 to species 23, the population density was around
50 individuals per species. At last, species 52 ended with two individuals in the 8 ha
sample.
Family diversity and density
There were totally 35 families of understory plants in the four study plots
together (Table 41). Of them, 33 families (94 %) were angiosperms and two families
(6 %) were pteridophytes. The angiosperms composed of 25 dicot families with 37
species (76 %) and 8 monocot families with 12 species (24 %).
The species-rich families of understory plants include Lamiaceae (4 species),
Acanthaceae (3 species), and Asteraceae (3 species). Ten families were represented by
two species each, while the other 22 families were represented by single species.
The density based dominant families include Poaceae with 3895 individuals
(40 %) and Araceae with 1879 individuals (19 %). Family importance value (FIV)

Fig. 29. Per cent occurrence of species and abudance in various freq.uency classes
of individuals in the Kolli hills.
60
Frequency class of individuals


Table 41. Famiiy diversit.; (species richnsss and gznemj. iier:sity and family
importance value (FIV) index of understory plants in the taiai 8 ha plot of Kolli hilis.
Family Species Genera 1)cnsily 17iV
1. Acanthaceae
2. Apiaceae
3. Araceae
4. Asclepiadaceae
5. Asparagaceae
6. Asteraceae
7. Balanophoraceae
8. Begoniaceae
9. Boraginaceae
10. Caesalpiniaceae
1 1. Cornmelinaceae
12. Convolvulaceae
13. Cucurbitaceae
14. Cyperaceae
15. Dioscoreaceae
16. Euphorbiaceae
17. Papilionaceae
18. Haemodoraceae
19. Lamiaceae
20. Malvaceae

1 2 1. Moraceae 11 2.0
22. Opiliaceae 1 ! 34 7.3
23. Orchidaceae 1 1 6 2.0
24. Oxalidaceae 1 1 2 1.9
25. Passifloraceae 2 1 113 5.0
26. Piperaceae 2 2 6 8 4.5
27. Poaceae 2 2 3895 44. I
28. Polypodiaceae 1 1 501 7.1
29. Pteridaceae 2 2 650 10.6
30. Rubiaceae 1 1 141 3.4
3 1. Solanaceae 2 2 61 4.5
32. Thunbergiaceae 1 1 106 3.0
33. Urticaceae 2 2 112 5.0
34. Verbenaceae 1 1 19 2.1
3 5. Vitaceae 1 1 134 3.3
Total 52 49 9680 200

index was greatest for Poaceae (sccre 44.11, follotvrd by Araceae (23.31,
Euphorbiaceae (1 1.7) and Pteridaceae (10.6) (Table 41).
Life-form diversity of understory plants
The 52 species of understory plants with 9680 individuals could be classified
into nine life-forms. The contribution of these nine life-forms to species richness and
population density varied (Fig 3 1). Species richness of the life-forms ranged from just
one to 21 species and density ranged from eight to 3895 individuals.
Herbs constituted the species-rich life-form with 2 1 species (40 %). Following
this, were the other diverse life-forms such as herbaceous climbers (12 species; 23 %),
shrubs (6 species, 11.5 %) and undershrubs (4 species, 8 %). Grasses and aroids were
represented by two species each, while sedges and root parasites by just one species.
Pteridophytes were represented by three species. The population density was
maximum (3895 individuals, 40 %) for the grasses, followed by aroids (1879
individuals, 19 %), herbs (171 5, 18 %) and pteridophytes (1 15 1, 12 %).
Diversity ofpuit types and plant longevity
The fruit types among the understory plants in the Kolli hills were diverse.
Thirteen species (25 %) bore capsules, 12 species (23 %) berries and five species (9.6
%) schizocarps. The drupes, nutlets and dust diaspores (of pteridophytes) were
produced by three species each (5.7 %), while grains (caryopsis) and pods by two
species each (3.8 %). The pepo, nut-like and follicle types were represented by just
one species each (2 %).
Based on the longevity of the understory plants, 22 species (42 %) of non-
perennating annuals, six species (12 %) of perennating annuals and 24 species (46 %)
of perennials were recognized in the Kolli hills.
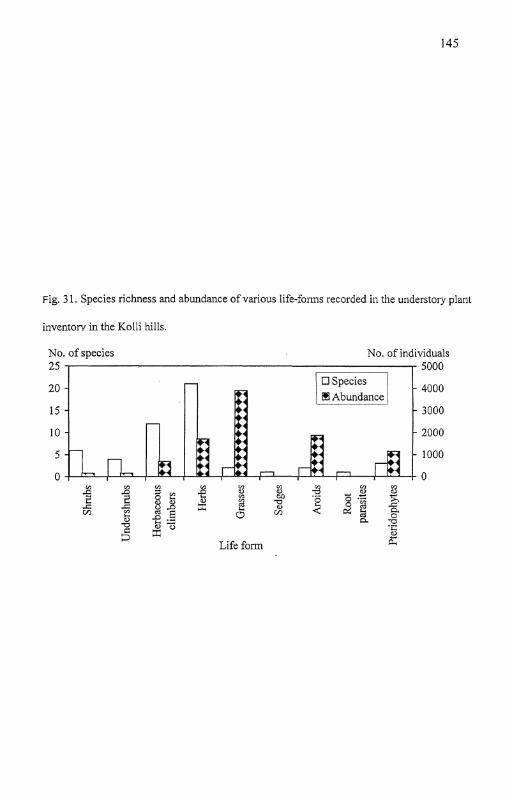
Fig. 3 1. Species richness and abundance of various life-forms recorded in the understory plant
inventow in the Kolli hills.
No. of species 25
No. of individuals 5000
3 V1 V1 p g + 3 2 3 10 -0 0 .z 5 s 2 2 s E @ 5 3
8 S E (n
-a 8% x 2 b.. 3 G)
Life form G

$'d~versi@ and cluster analysis
The Sorenson similarity (quaiitalive) index revealed thar the four study plots
showed 57 % to 74 % similarity for understory plants between then. Of the total 52
understory plant species, the undisturbed plots PS and VS shared 30 species, with a
similarity index 0.74. While, the disturbed plots shared 15 species, with a similarity
index 0.70 (Table 42). Morisita-Horn index of similarity (qua~titative) showed index
values of 0.95 between undisturbed plots PS and VS, and 0.77 between disturbed
plots KS and MS (Table 42).
Cluster analysis by single linkage clustering revealed that undisturbed plots PS
and VS were the most similar pair with shortest linkage distance (0.38) between them,
forming a single cluster. Disturbed plots KS and MS formed a second cluster with
linkage distance 0.43 between them. These two clusters join together at a distance of
0.51 (Fig. 32).
4.5. TOTAL PLANT INVENTORY
Species diversity
The total species richness of plant communities investigated in the 8 ha sample
of tropical evergreen forests in the Kolli hills was 156 species in 134 genera and 74
families (Table 43). Among the four sites, undisturbed plot PS was species-rich site
with 121 species and the disturbed plot MS was species-poor with 78 species.
Fig. 33 illustrates the contribution of mature trees, regeneration trees, lianas
and understory plants to the total diversity and density of tropical evergreen forests in
the Kolli hills. As the mature tree species (2 30 cm gbh) composition includes the
regeneration tree species (1 3 cm girth to < 30 cm gbh) encountered in the inventory,
the contribution of the latter to the total species diversity was nil. Nevertheless, the
mature trees contributed 50 % to the total plant diversity. Whereas, the lianas (2 5 cm

Table 42 Similarity between the four study plots for cndsrstori plants :II the Kol l~
hills, as measu~ed b) using Sorenson si~niial~t! and Marisita-Iiorr: :ndices (~a iues 111
parentheses :nd:cate the number of common species
Index Stud\ plot PS V S KS 41 S

Fig. 32. Dendrogram for understory plants of the four study plots using Single Linkaze
Euclidean distances
0.48 .- . - v
3 0.44 j ;i -
0.42 - I i
t 0.4 r
0.38
0.36 MS KS VS PS

Table 43. Total plant diversity and density enunera~ed in the four 2 ha study plots of
the Kolli hills.
Variable Undisturbed Disturbed
Total PS VS KS MS
Species richness
Trees (2 30 cm gbh) 58 51 42 39 78
Regeneration trees (2 3 cm and < 30 cm gt 36 30 23 12 46
Lianas (2 5 cm gbh) 21 16 9 14 26
Understory plants 42 39 24 19 52
Total 121 106 75 72 156
Genus richness 106 90 67 64 134
Family richness 65 59 43 41 74
Shannon diversity index (H')
Trees (2 30 cm gbh) 3.29 2.79 2.87 2.51 3.34
Regeneration trees (2 3 cm and < 30 cm gbh) 3.29 2.86 2.50 1.80 3.14
Lianas (2 5 cm gbh) 2.60 2.44 2.02 2.31 2.89
Understory plants 2.33 1.93 1.86 2.23 2.51
Population density
Trees (2 30 cm gbh) 1054 1151 651 969 3825
Regeneration trees (2 3 cm and < 30 cm gbh) 525 536 624 252 1937
Lianas (2 5 cm gbh) 113 156 25 90 384
Understory plants 2158 2027 2865 2630 9680
Total 3850 3870 4165 3941 15826

Fig. 33. Per cent contribution of various life-forms to total plant diversity
and density in the 8 ha plot of the Kolii hills.
Diversity
Understory plants 33%
Mature trees 50%
Lianas 17%
Density
Mature trees 24%
Understory Regeneration
plants trees
62% 12%
Lianas 2%

gbh) contributed 17 % and the unde~story plants (slt-ubs, undershrubs, herbaceous
climbers and herbs) 33 % (Fig. 33).
A total population density of 15,826 individuals was recorded from all the
plant communities studied in the 8-ha area of the Kolli hills (Table 43). Fig. 33
illustrates the per cent contribution of plant conlnlunities to the total population
density in the Kolli hills. It is evident from the Table 43 and Fig. 33 that the
understory plants shared a maximum of 62 Yc density (9680 individuals), while
mature and regeneration trees shared 24 % (3825 individuals) and 12 % (1937
individuals) respectively. Lianas were the least populated, 2 % (384 individuals) in
the whole inventory.
The Shannon diversity index (H') for the plant communities ranged from a
lowest value of 2.51 for the understory plants to a highest value of 3.34 for the mature
trees (Table 43). The H' for regeneration trees was 3.14, a value closer to mature tree
diversity index, while for lianas it was 2.89. Table 44 summaries the results of species
richness estimators for the whole plant diversity inventory in the Kolli hills. The
various species richness estimators overestimated the diversity value of the study area.
It ranged from a richness score of 165 of Abundance-based Coverage Estimator
(ACE) to 200 of Jacknife 2. The number of unique species (species that occur in only
one sample) was greater (46 species) than the singletons (species with only one
individual in the pooled 8-ha data), which was 15 species in number. So also the
duplicates (species that occur in only two samples) were greater (42 species) than the
doubletons (species with only two individuals in the pooled 8-ha data), which was 8
species in number (Table 44).

Table 44. Summary results of species richness estimators (using
estimates) for the total plant diversity inventories in the Kolli hills.
Variable Diversity value
Observed species richness 156
Estimated species richness
Abundance-based Coverage Estimator (ACE)
Incidence-based Coverage Estimator (ICE)
Chao 1
Chao 2
Jacknife 1
Jacknife 2
Bootstrap
Singletons
Doubletons
Uniques
Duplicates

153
Species population density an^ dominance
The varying population density of plmt species enumerated in the inventory is
evident from the Table 7 of mature trees, Table 21 of regeneration trees, Tabie 28 of
lianas, and Table 40 of understory plants. The p:edominanr species of the plant
communities inventoried in the entire 8-ha sample are listed in Table 45. The top most
abundant tree species was Memecylon umbellatum (Meiastomataceae) with mature
and regeneration individuals totaling 808 and 330 stems respectively. In the case of
lianas and understory plants, Hiptage benghalensis (Mdpighiaceae) with 47
individuals and Cyrtococcum trigonum (Poaceae) with 3363 individuals dominated
the study area (Table 45).
Family diversity
There were totally 74 families in the total 8 ha inventory. The most diverse
plant families of the Kolli hills can be deduced from the Tables listing family
diversity. They comprised: Moraceae, Lauraceae and Euphorbiaceae among the
mature trees (Table 13); Lauraceae and Euphorbiaceae among regeneration trees
(Table 23); Mimosaceae, Vitaceae and Rutaceae among the lianas (Table 30); and
Lamiaceae, Asteraceae and Acanthaceae among the understory plants (Table 41).
Frequency distribution
Based on frequency classes of plant individuals (Fig. 34), 30 % of species was
found in category A (species occurring in only one plot). Category B (species
occurring in two plots) was 27 %, Category C (species occurring in three plots) was
19 %, and category D (species occurring in all the four plots) was 24 %. Greater the
percentage of species in the categories C and D than the earlier classes would indicate
more homogeneity. Conversely, if the categories A and B occur in greater percentage,

Table 45. Predominant (top 5) plant species of various life forms inventoried in the 8
ha plot of the Kolli hills (value in parenthesis indicates family richness).
Life Predominant species form
Family Abundance
Memecylon umbellatum Burm.f. Melastomataceae 808 (2)
- Phoebe wightii Meisner Lauraceae s 230 (8) P
m C O Olea paniculata R.Br. 8 f J Oieaceae 190 (4) F= 0
Neolitsea scrobiculata (Meisner) Gamble Lauraceae V
186
Myristica dactyloides Gaertn. Myristicaceae 171 (1)
Memecylon umbellatum Burrn.f. Melastomataceae 3 30 (2)
fl a D
VJ ~ J I iVeolitsea scrobiculata (Meisner) Gamble Lauraceae 158 (8) 8 &
Canthiurn dicoccum (Gaertn.) Teijsm. & Rubiaceae .- 4-2 v
121 (2) , Binn. var. dicoccum ' Myristica dactyloides Gaertn. Myristicaceae 121 (1)
ED g d m
& Mallotusphilippensis (Lam.) Muell.- Arg. Euphorbiaceae 11 8 (5) var. philippensis
Hiptage benghalensis (L.) Kurz Malpighiaceae 47 ( I )
3 Zanthoxylum tetraspermum Wight & Am. Rutaceae 9
42 (2)
E Jasminum azoricum L. var. azoricum L. Oleaceae .- 0 3 1 (2)
y, Elaeagnus indica Servattaz Elaeagnaceae 26 (1) V
Morinda umbellata L. Rubiaceae 26 (2)
Cyrtococcum trigonurn (Retz.) A. Camus Poaceae 3363 (2) VJ
Arisaema leschenaultii Blume Araceae - 1540 (2) a
Dryopteris concolor Langsd. & Fisch. Pteridaceae 590 (2) 4-2 V1
Paspalum conjugaturn Berg. Poaceae 532 C - 3
Leptochilus decurrens Blume Polypodiaceae 501 (1)

Fig. 34. Distribution of plant species within different frequency
classes.Category A corresponds to occurrence in 1-25% of the plots,
category B to 26-50%, up to category D, i .e occurrence in 76-100%
of the plots.
0 1-25% 26-50% 5 1-75% 76-100% ('4) (B) (C> (D)
Frequency class

then it indicates greater heterogeneity. In Kolli hills, categories A and B together
share a 57 % of totd frequency, indicating a moderate heterogeneity.
p diversiv and cluster analysis
The ,B or differentiation diversity for the plant species recorded among the
study plots in the Kolli hills was measured using Sorenson similaity index. The whole
plant diversity similarity between plots ranged from 53 % (VS and KS) to 88 % (PS
and VS) (Table 46). The similarity was less between undisturbed and disturbed plots
of PS and KS (54 %), and VS and KS (53 %). Whereas the diturbed plot MS showed
a notable greater similarity with undisturbed plots PS (80 %) and VS (87 %). Between
the disturbed plots (KS and MS), the similarity was 71 % (Table 46).
Cluster analysis by single linkage clustering revealed that the undisturbed
plots PS and VS were the most similar pair with shortest linkage distance (0.18), and
formed a single cluster (Fig. 35). The undisturbed plot MS was the next similar
sample for the whole plant diversity with a short distance (0.28) from the cluster PS-
VS. The plot KS was the farthest sample with wide distance (0.7) from the earlier
cluter PS-VS-MS (Fig. 35).

Table 46. Similarity between the four study plots for total plant species recorded
in the 8 ha plot of the Kolli hills, as measured by using Sorenson similarity index
(values in parentheses indicate the number of common species).
Index Study plot P S VS KS MS

Fig. 35. Dendrogram for the whole plant diversity of the four study plots using
Single Linkage Euclidean distances


