28
1 Company Company Presentation Presentation
| Date post: | 01-Jan-2016 |
| Category: |
Documents |
| Upload: | gladys-bradford |
| View: | 217 times |
| Download: | 1 times |
1
Company PresentationCompany PresentationCompany PresentationCompany Presentation

2
3
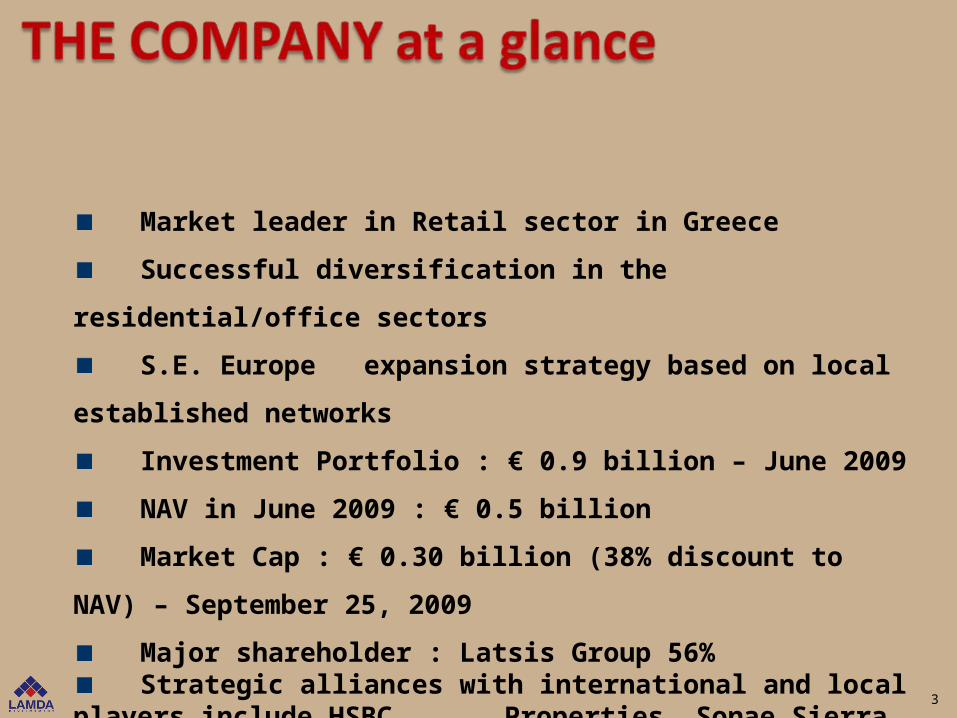
Market leader in Retail sector in Greece
Successful diversification in the residential/office sectors
S.E. Europe expansion strategy based on local established networks
Investment Portfolio : € 0.9 billion – June 2009
NAV in June 2009 : € 0.5 billion
Market Cap : € 0.30 billion (38% discount to NAV) – September 25, 2009
Major shareholder : Latsis Group 56% Strategic alliances with international and local players include HSBC
Properties, Sonae Sierra, ECE, J & P Avax, GEK, Reds

4
5
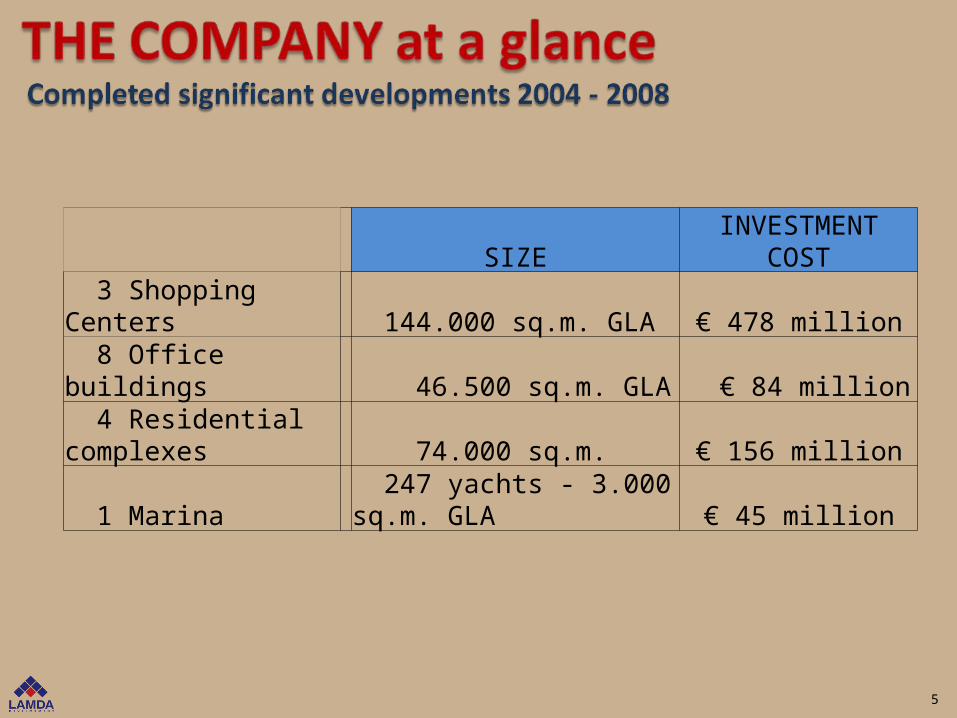
SIZE INVESTMENT COST
3 Shopping Centers 144.000 sq.m. GLA € 478 million
8 Office buildings 46.500 sq.m. GLA € 84 million
4 Residential complexes 74.000 sq.m. € 156 million
1 Marina 247 yachts - 3.000 sq.m. GLA € 45 million

• June09 vs June08 +4%
• Treasury shares 3.007.380 (7% of share capital)
• Total value of treasury shares € 16,8 m. at average cost of € 5,60/share
• Market price on 25/09/2009 € 6,85
• Total market cap € 302 m. as of 25/9/09
6
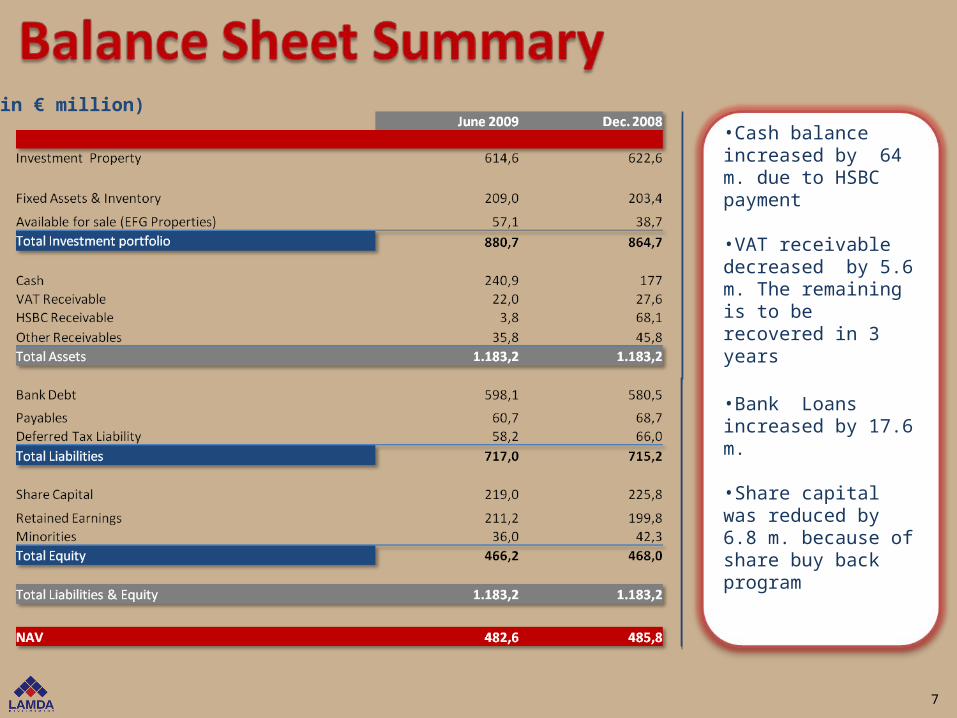
7
•Cash balance increased by 64 m. due to HSBC payment
•VAT receivable decreased by 5.6 m. The remaining is to be recovered in 3 years
•Bank Loans increased by 17.6 m.
•Share capital was reduced by 6.8 m. because of share buy back program
(in € million)

8

9
% Yields
Name Value LAMDA Dev. % Balance Sheet Value
Valuation Method Jun.09 Dec.08 Jun.08
Retail The Mall Athens 539,6 49,24 265,7 Fair Value 6,5 6,4 5,5Mediterannean Cosmos 169,5 60,1 169,5 Fair Value 8,7 8,3 7,8Golden Hall 120,5 100 120,5 Fair Value 7,1 7,6 -
Total Retail 829,6 555,7 7,2 7,2 6,4
Offices
Cecil 27,6 100 27,6 Fair Value 7,1 6,7 6,2Kronos 12,5 80 12,5 Fair Value 7,9 7,3 7,2Othonos 8,8 100 8,8 Fair Value 7,7 7,4 7,1Ploesti Building 10,9 40 4,4 Fair Value 8,5 8,3
Total Office 59,8 53,3 7,5 7,2 6,6
Income Generating Assets
Kronos Parking 8,1 100 8,1 Fair Value 7,5 7,3 7,3Koropi 7,7 80 7,7 Cost Flisvos Marina 34,9 47,11 34,9 NBV Metropolitan Expo 29,1 11,67 3,2 NBV
EFG Properties Shares 433,1 13,18 57,1 Market price@7,1
Total Income Gen. Assets 512,9 111,0
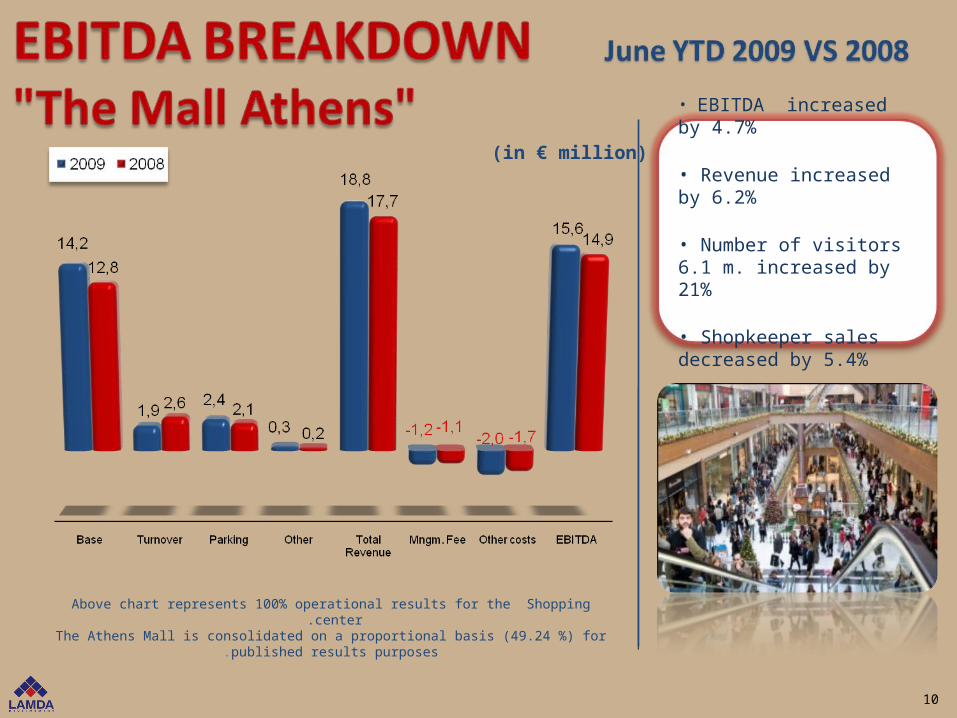
Above chart represents 100% operational results for the Shopping center .The Athens Mall is consolidated on a proportional basis (49.24 %) for published results
purposes.
• EBITDA increased by 4.7%
• Revenue increased by 6.2%
• Number of visitors 6.1 m. increased by 21%
• Shopkeeper sales decreased by 5.4%
10
(in € million)
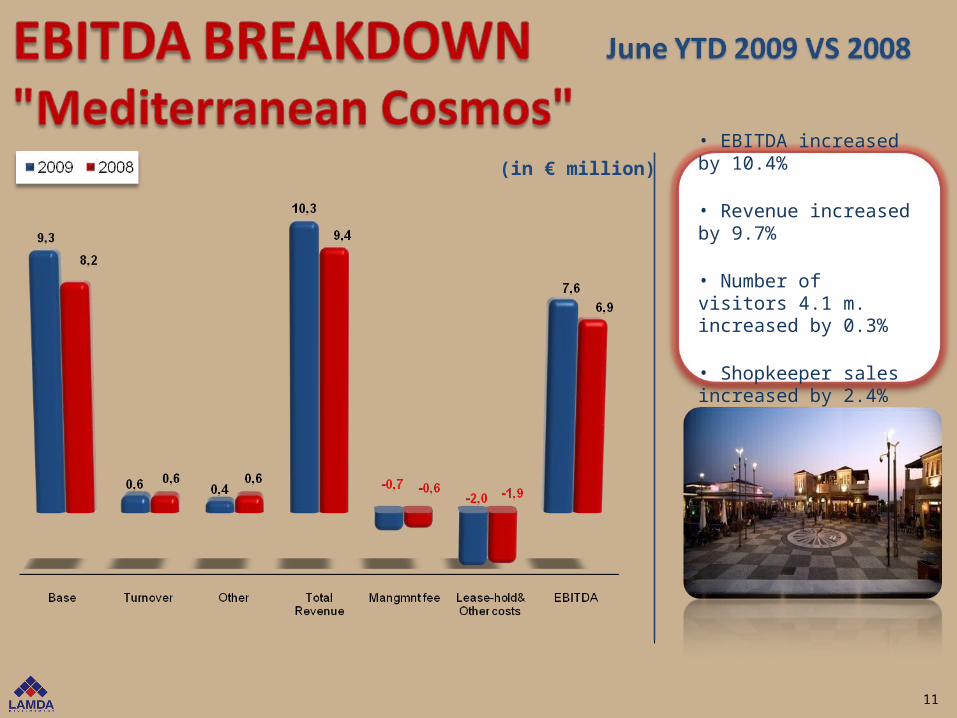
• EBITDA increased by 10.4%
• Revenue increased by 9.7%
• Number of visitors 4.1 m. increased by 0.3%
• Shopkeeper sales increased by 2.4%
11
(in € million)

Above chart represents the operational results for the Shopping center that started operating on November 28, 2008
•Shopkeeper sales 57.8 m.
•Number of visitors 1.5 m.
•Annual target is attainable.
12
(in € million)

13
CECIL
• Luxurious office building – 6.000m2 NLA• Fully renovated in 2002• Developed in five levels and one underground level• 100% occupancy
KRONOS Business Centre
• High standard office building – 4.000m2 NLA• Developed in 2003 – 4 levels• 3 underground levels of total surface 12.000 m2 with 438 parking spaces• 100% occupancy

14
• First VIP marina in Greece• 40 years concession• 47% participation• Investment of € 45 million• 3.000 sq.m. commercial & recreational facilities• Construction completed Dec. 2006
Bucharest Office Building
• High standard office building – 4.700m2 NLA• Developed in 2008• 8 floors, retail ground floor & 39 underground parking spaces• 100% leased
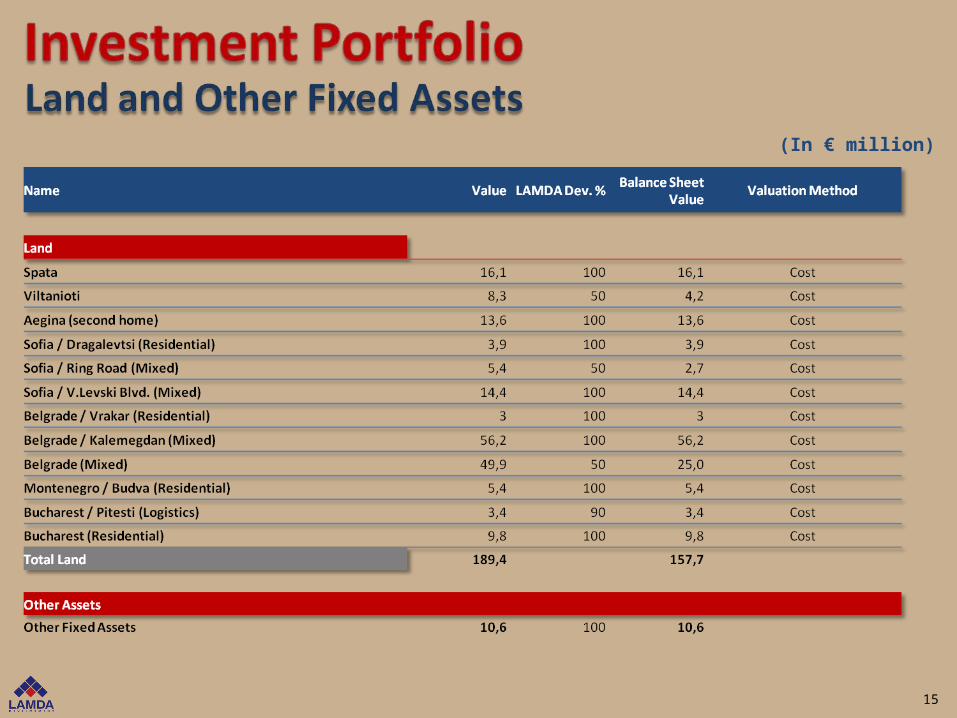
(In € million)
15

16
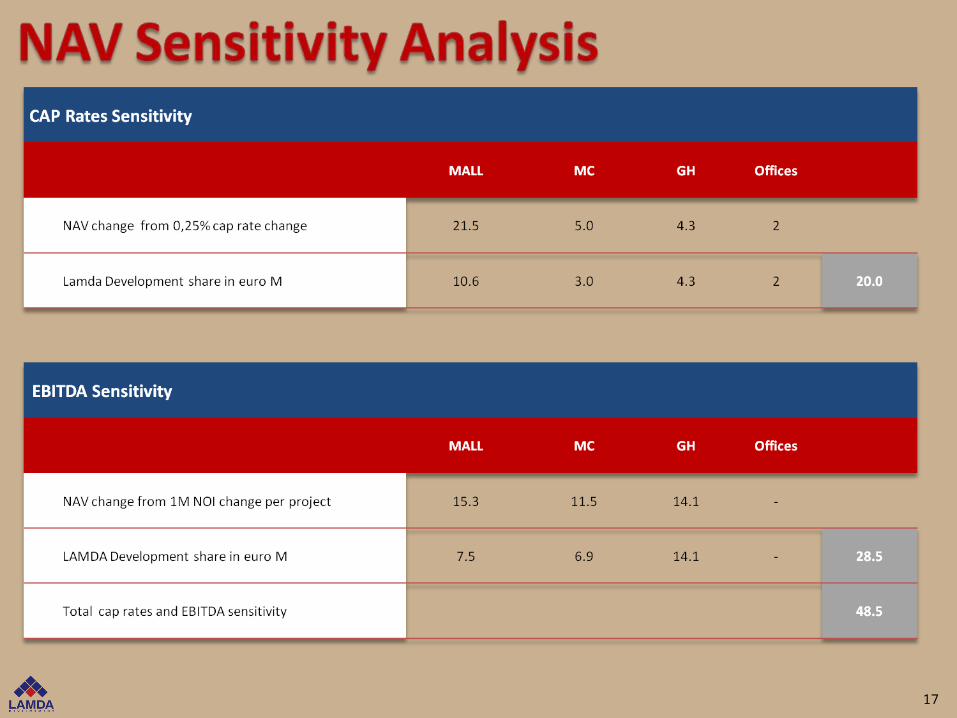
17

18
19
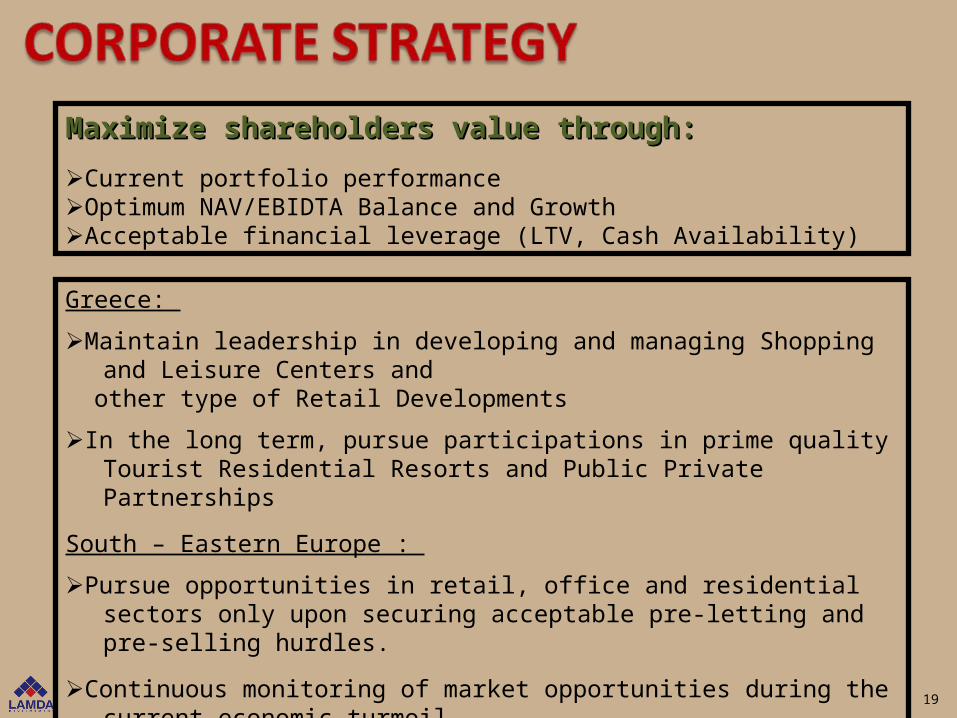
Maximize shareholders value through:Maximize shareholders value through:
Current portfolio performanceOptimum NAV/EBIDTA Balance and GrowthAcceptable financial leverage (LTV, Cash Availability)
Greece:
Maintain leadership in developing and managing Shopping and Leisure Centers and other type of Retail Developments
In the long term, pursue participations in prime quality Tourist Residential Resorts and Public Private Partnerships
South – Eastern Europe :
Pursue opportunities in retail, office and residential sectors only upon securing acceptable pre-letting and pre-selling hurdles.
Continuous monitoring of market opportunities during the current economic turmoil
20

21
22

23
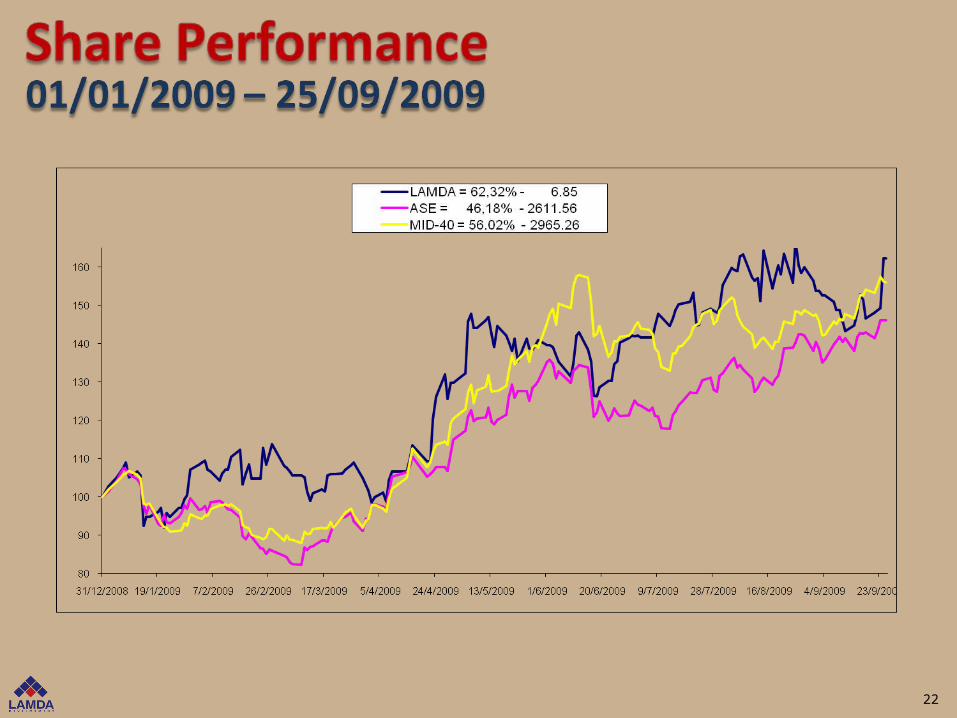
Total number of shares : 44.029.950
24
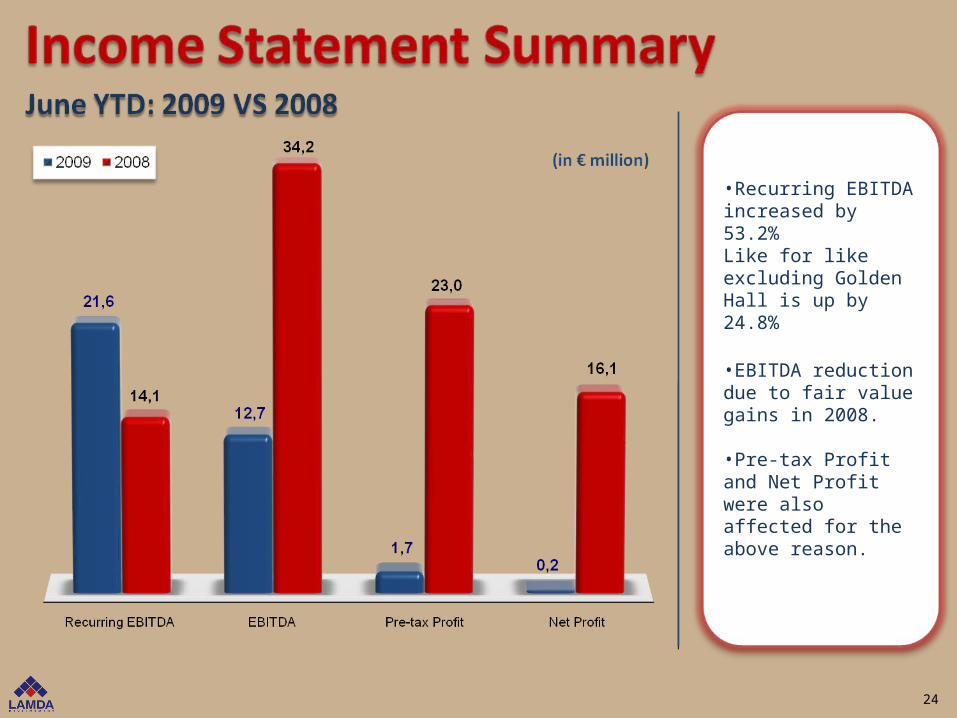
•Recurring EBITDA increased by 53.2%Like for like excluding Golden Hall is up by 24.8%
•EBITDA reduction due to fair value gains in 2008.
•Pre-tax Profit and Net Profit were also affected for the above reason.
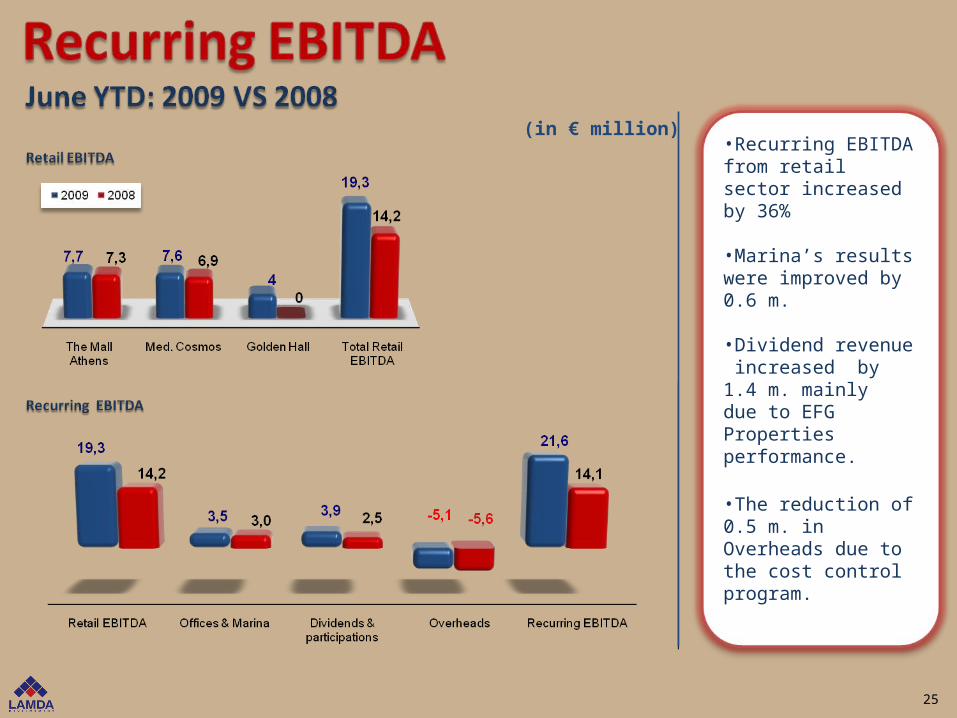
25
•Recurring EBITDA from retail sector increased by 36%
•Marina’s results were improved by 0.6 m.
•Dividend revenue increased by 1.4 m. mainly due to EFG Properties performance.
•The reduction of 0.5 m. in Overheads due to the cost control program.
(in € million)
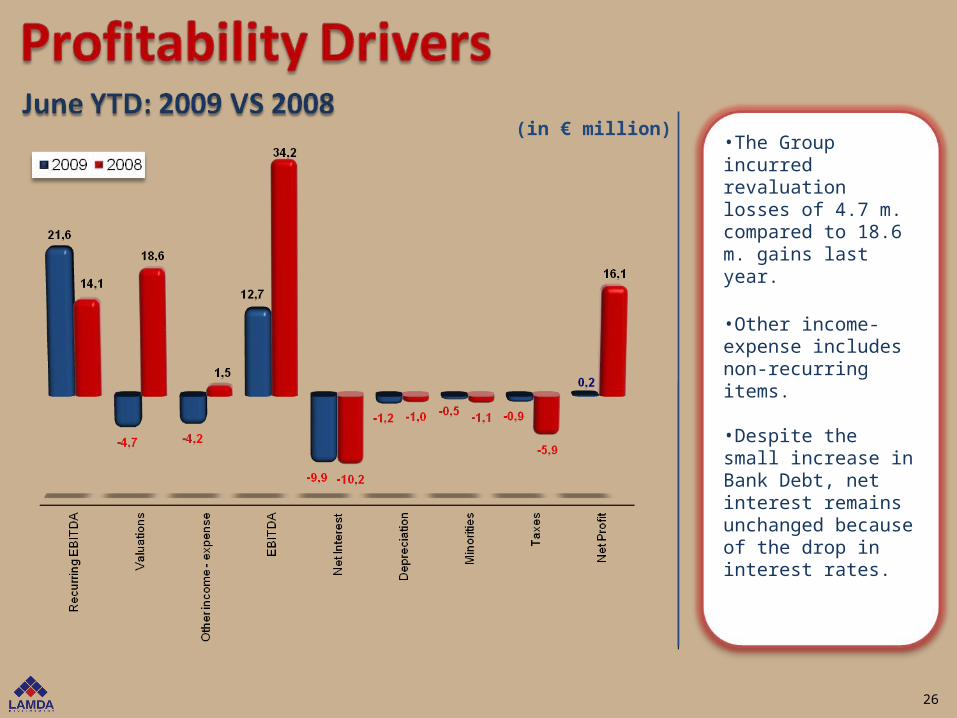
26
•The Group incurred revaluation losses of 4.7 m. compared to 18.6 m. gains last year.
•Other income-expense includes non-recurring items.
•Despite the small increase in Bank Debt, net interest remains unchanged because of the drop in interest rates.
(in € million)
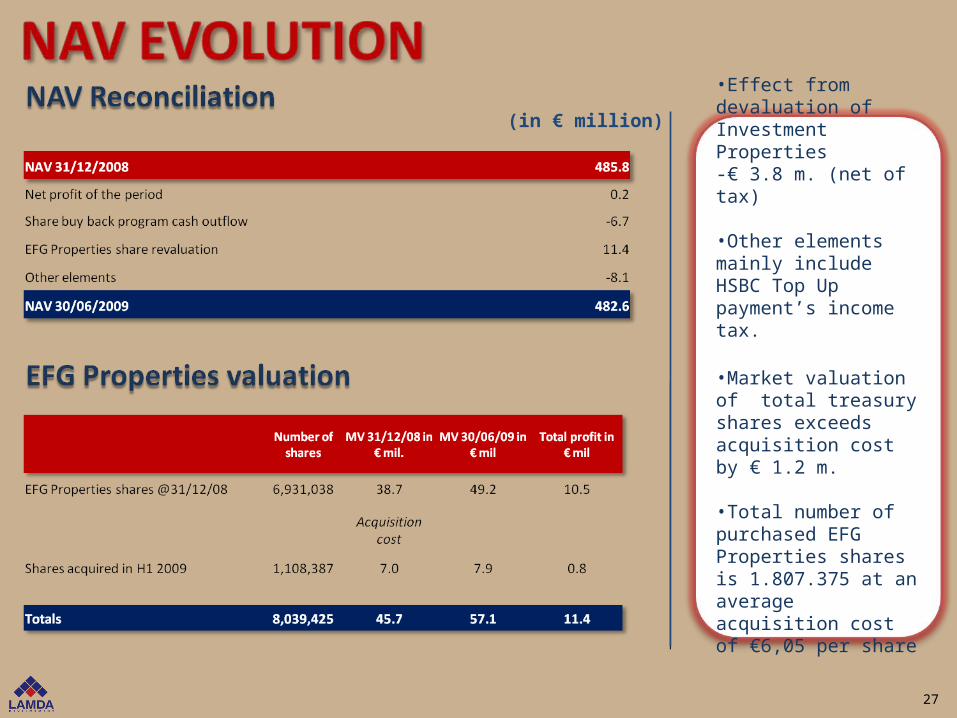
27
•Effect from devaluation of Investment Properties -€ 3.8 m. (net of tax)
•Other elements mainly include HSBC Top Up payment’s income tax.
•Market valuation of total treasury shares exceeds acquisition cost by € 1.2 m.
•Total number of purchased EFG Properties shares is 1.807.375 at an average acquisition cost of €6,05 per share
(in € million)

28
DISCLAIMERThis presentation has been prepared by Lamda Development S.A. (the “Company”). The information contained in this presentation has not been independently verified and no representation or warranty, express or implied, is made as to, and no reliance should be placed on, the fairness, accuracy, completeness or correctness of the information or opinions contained herein. None of the Company, shareholders or any of their respective affiliates, advisers or representatives shall have any liability whatsoever (in negligence or otherwise) for any loss howsoever arising from any use of this document or its contents or otherwise arising in connection with this document.Unless otherwise stated, all financials contained herein are stated in accordance with International Financial Reporting Standards (‘IFRS’). This presentation does not constitute an offer or invitation to purchase or subscribe for any shares and neither it or any part of it shall form the basis of, or be relied upon in connection with, any contract or commitment whatsoever. The information included in this presentation may be subject to updating, completion, revision and amendment and such information may change materially. No person is under any obligation to update or keep current the information contained in the presentation and any opinions expressed in relation thereof are subject to change without notices. This presentation is subject to any future announcements of material information made by the Company in accordance with law.This presentation is only for persons having professional experience in matters relating to investments and must not be acted or relied on by persons who are not Relevant Persons (as defined below). Solicitations resulting from this presentation will only be responded to if the person concerned is a Relevant Person.This presentation and its contents are confidential and must not be distributed, published or reproduced (in whole or in part) or disclosed by recipients to any other person, whether or not they are a Relevant Person. Nor should the recipient use the information in this presentation in any way which would constitute "market abuse". If you have received this presentation and you are not a Relevant Person you must return it immediately to the Company. This presentation does not constitute a recommendation regarding the securities of the Company.
FORWARD LOOKING STATEMENTS This document contains forward-looking statements. Except for historical information, the matters discussed in this presentation are forward-looking statements that are subject to certain risks and uncertainties that could cause the actual results of operations, financial condition, liquidity, performance, prospects and opportunities to differ materially, including but not limited to the following: the uncertainty of the national and global economy; economic conditions generally and the Company’s sector specifically; competition from other Companies. Although the Company believes the expectations reflected in such forward-looking statements are based on reasonable assumptions, it can give no assurance that its expectations will be attained. The forward-looking statements are made as of the date of this presentation, and we undertake no obligation to publicly update or revise any forward-looking statement, whether as a result of new information, future events or otherwise.By attending this presentation, you agree to be bound by the foregoing limitations.
LAMDA Development S.A. ● 37Α Kifissias Ave. (Golden Hall) ● 151 23 Maroussi ● Greece Tel: +30.210.74 50 600 ● Fax: +30.210.74 50 645
Web site : www.lamda-development.net
CEO : Mr. Odisseas Athanassiou ● E-mail : [email protected] Investor Relations : Mr. Alexandros Kokkidis ● E-mail : [email protected]


