1 The Effects of Two Shaft Gas Turbine Operating Conditions on the Overall Performance Rehab Noor Mohammed Babylon University / College of Engineering / Mechanical Department Ali Meer Ali Jasim Babylon University / College of Engineering / Mechanical Department Dr. Ahmed Khadem Babylon University / College of Engineering / Mechanical Department ABSTRACT: In this research, we study the effect of the some parameters (gas turbine speed, power turbine speed, mass flow rate of air, mass flow rate of fuel, compression ratio, air to fuel ratio and inlet compressor temperature) on the overall system efficiency, alternator efficiency and the overall heat efficiency of the two shaft gas turbine system, the working fluid was propane. Firstly we checked the experimental results by plotted the (T-S diagram) between the experimental and analytical solution and then we study the effect of the above parameters on the overall system efficiencies. Also we checked the effect of the inlet compressor temperature on the overall gas turbine performance .From these results, we can notes the increasing of the compression ratio and the power turbine speed will increase the overall efficiency, overall heat efficiency and decreasing the alternator efficiency, at the same time is increase the gas turbine efficiency. Keyword: Gas Turbine, Power Turbine, Inlet Temperature, Compressor, Experimental ﺘﺄﺜﻴﺭﺍﺕ ﻅﺭﻭﻑ ﺍﻟ ﺘﺸﻐﻴل ﺍﻟﻌﻤﻭﺩﻴﻥ ﺫﺍﺕ ﺍﻟﻐﺎﺯﻱ ﺍﻟﺘﻭﺭﺒﻴﻥ ﻟﻤﻨﻅﻭﻤﺔ ﺍﻟﺤﺭﺍﺭﻱ ﺍﻻﺩﺍﺀ ﻋﻠﻰ د. آﺎﻇﻢ اﺣﻤﺪ ﺑﺎﺑﻞ ﺟﺎﻣﻌﺔ- اﻟﻬﻨﺪﺳﺔ آﻠﻴﺔ– ﻗﺴﻢ اﻟﻤﻴﻜﺎﻧﻴﻜﻴﺔ اﻟﻬﻨﺪﺳﺔ ﺟﺎﺳﻢ ﻋﻠﻲ ﻣﻴﺮ ﻋﻠﻲ ﺑﺎﺑﻞ ﺟﺎﻣﻌﺔ- اﻟﻬﻨﺪﺳﺔ آﻠﻴﺔ– ﻗﺴﻢ اﻟﻤﻴﻜﺎﻧﻴﻜﻴﺔ اﻟﻬﻨﺪﺳﺔ ﻣﺤﻤﺪ ﻧﻮر رﺣﺎب ﺑﺎﺑﻞ ﺟﺎﻣﻌﺔ- اﻟﻬﻨﺪﺳﺔ آﻠﻴﺔ– ﻗﺴﻢ اﻟﻤﻴﻜﺎﻧﻴﻜﻴﺔ اﻟﻬﻨﺪﺳﺔ اﻟﻤﻠﺨﺺ: اﻟﺒﺤ ﺧﻼل ﺚ ﺗﻢ اﻟﺤﺎﻟﻲ در ا ﺳ ﺔ اﻟﻤﺘﻐﻴﺮاتﺾﻌ ﺑ ﺗﺄﺛﻴﺮ ﻣﺜﻞ) ، اﻟﻘﺪرة ﺗﻮرﺑﻴﻦ دوران ﺳﺮﻋﺔ، اﻟﻐﺎزي اﻟﺘﻮرﺑﻴﻦ دوران ﺳﺮﻋﺔ ﺟﺮﻳﺎن ﻣﻌﺪل اﻟﻬﻮاء و ﺟﺮﻳﺎن ﻣﻌﺪل اﻟﻮﻗﻮد ﻧﺴﺒﺔ، اﻻﻧﻀﻐﺎط اﻟﻮﻗﻮد آﻤﻴﺔ وﻧﺴﺒﺔ إﻟﻰ اﻟﻬﻮاء اﻟﻬﻮا ﺣﺮارة ودرﺟﺔ اﻟﻀﺎﻏﻂ اﻟﻰ اﻟﺪاﺧﻞ ء) Compressor ( ( ﻋﻠﻰ اﻟﻜﻔﺎءة ﱢ اﻟﻌﺎﻣ ﺔ ﻟﻠﻤ ﻨﻈ ﻮ ﻣ ﺔ اﻟﻐﺎزﻳﺔ اﻟﻜﻬﺮﺑﺎﺋﻲ اﻟﻤﻮﻟﺪ وآﻔﺎءةﺔ ﻟﻠﻤﻨﻈﻮﻣ اﻟﺤﺮارﻳﺔ اﻟﻜﻔﺎءة، اﻟﺘﻲ اﻟﺒﺮوﺑﺎن ﺗﺴﺘﻌﻤﻞ آ ﻮﻗﻮد أوﻻ، ﺗﻢ أﺟﺮاء ﺑﻴﻦ ﻣﻘﺎرﻧﺔ اﻟ ﻨﺘﺎﺋﺞ اﻟﻤﺨﺘﺒﺮﻳﺔ اﻟـ ﻣﺨﻄﻂ رﺳﻢ ﻋﻠﻰ ﺑﺎﻻﻋﺘﻤﺎد) T-S ( واﻟﺘﺤﻠﻴﻠﻲ اﻟﻨﻈﺮي وﺑﻌ ذﻟﻚ ﺪ در ﺗﻢ ا ﺳﺔ ﺣﺴﺎب اﻟﻤﺘﻐﻴﺮات ﺗﺄﺛﻴﺮ ﱢ اﻟﻌﺎم اﻷداء ﻋﻠﻰ اﻟﻐﺎزﻳﺔﺔ ﻟﻠﻤﻨﻈﻮﻣ. ﻟﻠﻀﺎﻏﻂ اﻟﺪاﺧﻞ اﻟﻬﻮاء ﺣﺮارة درﺟﺔ ﺗﺎﺛﻴﺮ اﻳﻀﺎ ﺗﻢ اﻟﻤﻨﻈﻮﻣﺔ ﻓﺎﻋﻠﻴﺔ ﻋﻠﻰ دراﺳﺘﻬﺎ. زﻳﺎدةﻼﺣﻆ ﻧن أﻦﻜﻤ ﻳﺞﺘﺎﺋ اﻟﻨ هﺬﻩﻦ ﻣ ﻧﺴﺒﺔ اﻻﻧﻀﻐﺎط ﻳﺆدي اﻟﻐﺎزي اﻟﺘﻮرﺑﻴﻦ دوران وﺳﺮﻋﺔ إﻟﻰدﺎ زﻳ ﱢﺔ اﻟﻌﺎﻣ اﻟﻜﻔﺎءة ة ﻳﺆدي اﻟﻮﻗﺖ ﻧﻔﺲ وﻓﻲ اﻟﻜﻬﺮﺑﺎﺋﻲ اﻟﻤﻮﻟﺪ آﻔﺎءة وﺗﻘﻠﻴﻞﺔ ﻟﻠﻤﻨﻈﻮﻣ اﻟﺤﺮارﻳﺔ اﻟﻜﻔﺎءة و اﻟﻐﺎزﻳﺔﺔ ﻟﻠﻤﻨﻈﻮﻣ إﻟﻰ ﺗﻮرﺑﻴﻦ دوران ﺳﺮﻋﺔةدﺎ زﻳ اﻟﻘﺪرة.
Transcript
1
The Effects of Two Shaft Gas Turbine Operating Conditions on the Overall Performance
Rehab Noor Mohammed Babylon University / College of
Engineering / Mechanical Department
Ali Meer Ali Jasim Babylon University / College of
Engineering / Mechanical Department
Dr. Ahmed Khadem Babylon University / College of
Engineering / Mechanical Department
ABSTRACT: In this research, we study the effect of the some parameters (gas turbine speed, power turbine speed, mass flow rate of air, mass flow rate of fuel, compression ratio, air to fuel ratio and inlet compressor temperature) on the overall system efficiency, alternator efficiency and the overall heat efficiency of the two shaft gas turbine system, the working fluid was propane. Firstly we checked the experimental results by plotted the (T-S diagram) between the experimental and analytical solution and then we study the effect of the above parameters on the overall system efficiencies. Also we checked the effect of the inlet compressor temperature on the overall gas turbine performance .From these results, we can notes the increasing of the compression ratio and the power turbine speed will increase the overall efficiency, overall heat efficiency and decreasing the alternator efficiency, at the same time is increase the gas turbine efficiency. Keyword: Gas Turbine, Power Turbine, Inlet Temperature, Compressor, Experimental
على االداء الحراري لمنظومة التوربين الغازي ذات العمودين تشغيلال ظروفتأثيرات
احمد آاظم. د قسم –آلية الهندسة -جامعة بابل
الهندسة الميكانيكية
علي مير علي جاسمقسم –آلية الهندسة -جامعة بابل
الهندسة الميكانيكية
رحاب نور محمدقسم –آلية الهندسة -جامعة بابل
الهندسة الميكانيكية
:الملخص
سرعة دوران التوربين الغازي ، سرعة دوران توربين القدرة ، ( مثل تأثير بعض المتغيرات ةسادر الحالي تم ثخالل البح
ء الداخل الى الضاغط ودرجة حرارة الهوا الهواء إلىونسبة آمية الوقود االنضغاط، نسبة الوقودمعدل جريان والهواء معدل جريان )Compressor(( تستعمل البروبان التي، الكفاءة الحرارية للمنظومة وآفاءة المولد الكهربائي الغازية ةمونظللم ةالعامالكفاءة علىسة اتم درد ذلك وبعالنظري والتحليلي ) T-S(باالعتماد على رسم مخطط الـ المختبرية نتائجال مقارنة بين أجراءتم ، أوال وقود آ
على فاعلية المنظومة تم ايضا تاثير درجة حرارة الهواء الداخل للضاغط .للمنظومة الغازية على األداء العامتأثير المتغيرات حساب ة الكفاءة العامة زياد إلىوسرعة دوران التوربين الغازي يؤدي االنضغاطنسبة من هذه النتائج يمكن أن نالحظ زيادة .دراستها
زيادة سرعة دوران توربين إلىللمنظومة الغازية و الكفاءة الحرارية للمنظومة وتقليل آفاءة المولد الكهربائي وفي نفس الوقت يؤدي .القدرة
2
NOMENCLATURE Cp Constant pressure mass heat capacity (kJ/kg.K) HCV Heat calorific value (kJ/kg) R Gas universal constant (kJ/kg.K) T Temperature (K) Cv Constant volume mass heat capacity (KJ/Kg.K) t Temperature (°C) ρ1 Air mass density in the measured upstream of the diaphragm (kg/m3) I Current (A) ∆h Differential alcohol manometer reading subscript (mm) V Voltage (V) ftb Flowmeter correction factor for the feed pressure value of the used fuel N Velocity (rpm) Q1 The heat power supplied to the fuel in the heater (kW) m Mass flow rate (kg/s) S Entropy (kJ/K) rc Compression ratio p Pressure (pa) Greek γ Isentropic index η Efficiency ρ Density (Kg/m3) Subscript a Air f Fuel max Maximum value min Minimum value st Stoichiometric h Heater fb Fuel in bottle s System s,TP System turbine Overall System overall alt Alternator id Ideal gt Gas turbine opt Organic pt Power turbine Superscript
′ Exhaust gases - Average
INTRODUCTION Power generation is an important issue today, The gas turbine unit is extensive use for electrical power generation, the gas turbine may be operated by the remote control and need little or no attendance while operating and no attendance when shutdown, [1]. Brayton cycle is the backbone of power generation, and then we must have deepened knowledge of how the Brayton cycle is applied at power generation plants, [2]. Gas turbine (GT) engines in power plants across the world provide much of the power used in commercial electrical grids. Depending on the operating environment, fuel quality, maintenance considerations, loading, and many other parameters, turnover maintenance intervals on GT engines can range in length from 6 months to 5 years or more. The thermodynamic analysis of the ideal gas turbine was analyzed in many researches and textbooks, [3], [4], [5], [6], [7], [8]. Daycock and et al, [9], demonstrates how this new method has been implemented across a board range of gas turbine plant to improve profits. It is also described the benefits that have been achieved on the non-regulated side of the market by utilizing this approach to better predict production costs. Albert J. J. and Jerzy T. S., [10], presented a concept for evolutionary development of power plants. Starting with a 20 kW Closed Brayton Cycle system for an initial lunar outpost connecting multiple modular units to a single for lunar bases, and the eventual deployment of multi-megawatt systems for lunar colonies is discussed. Frank J. Brooks, [11], presented reviews some of the basic thermodynamic principles of gas turbine operation and explains some of the factors that affect on its performance. Dipippo, R., [12], discussed the design, performance and economics procedures for the small power plant. Much research has been done to characterize the degradation in performance of turbine system and especially the turbine blades, [13]. In the present study, we used the experimental results and data to study the performance of the two shaft gas turbine and also we compared it with the ideal Brayton Cycle. In order to study the effect of the variation inlet compressor temperature, we designed a small heat exchanger to heat the inlet air, this heat exchanger is made from a two concentric steel pipes , the annulus area fill by water and electrical heater is immersed inside the water in annulus area. The schematic diagram for the heat exchanger is shown in the following figure:
3
Fig. (1), Schematic Diagram of The heat exchanger EXPERIMENTAL STUDY: The apparatus which are used in the present study is called (T200D) “Two Shaft Gas Turbine Unit”, this apparatus shown in the figure below:
4
A= Differential Manometer I,L,M,N= Thermometer U= Gas Exhaust B= Gas Feeding Flowmeter O=Power Generation Electronic Instrument V= Oil Filter C= Gas Turbine P= Adjustment of Alternator Extension W= Pushbutton for the Intake Air Temperature Reading D= Power Turbine R= Oil Heat Exchanger Z= Gas Bottle E,F,G,H= Pressure Gauges S= Static Centrifugal Fan J= Turbocharger T= Combustion Chamber
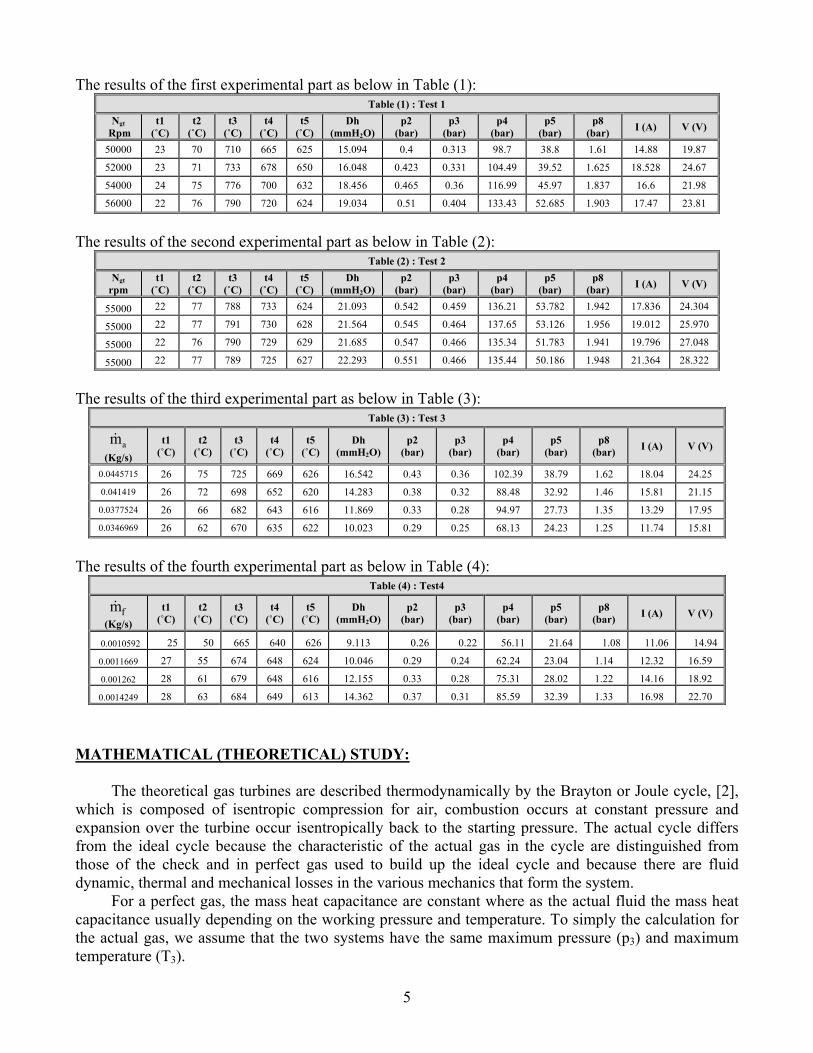
Fig. (2), Schematic Diagram of The Two Shaft Gas Turbine Apparatus This apparatus consists of three parts, the apparatus main parts include: the starting centrifugal fan, turbocharger, power turbine and alternate current generator with ohmic load; the apparatus secondary parts include: the transducer and gauges for temperature and pressure, while the third part is auxiliary parts which consist of lubrication circuit with oil pump, tank and the cooling circuit with oil water heat exchanger. The temperatures reading are measured by thermocouples where all the temperature is in Celsius degree (˚C). During the experiment, in order to specify rotation speed of the turbine connected to the compressor (gas turbine), we changed the rotation speed of the power turbine by means the fuel and load commands, and we carry out the test. Then we can change the speed of rotation of gas turbine and repeat the test so as to be able to compare the results obtained in different operating conditions. Our experimental study is divided mainly into two sections: the first section is divided into four parts, the first part is concerned with the change of gas turbine speed and keeps the speed of the power turbine constant, the second part is concerned with keeps the speed of the power turbine constant and change of gas turbine speed, the third part was kept the mass flow rate of fuel and changing the mass flow rate of air while in the fourth part we changed the mass flow rate of fuel and kept the mass flow rate of air is constant. The second section is concerned with the changing of the compression ratio with the same previous experimental data (parts). During the experiment, we took the following constant values: pa = 101.325 kpa, HCV = 46400 kJ/kg The experimental results are shown below:
5
The results of the first experimental part as below in Table (1): Table (1) : Test 1
MATHEMATICAL (THEORETICAL) STUDY: The theoretical gas turbines are described thermodynamically by the Brayton or Joule cycle, [2], which is composed of isentropic compression for air, combustion occurs at constant pressure and expansion over the turbine occur isentropically back to the starting pressure. The actual cycle differs from the ideal cycle because the characteristic of the actual gas in the cycle are distinguished from those of the check and in perfect gas used to build up the ideal cycle and because there are fluid dynamic, thermal and mechanical losses in the various mechanics that form the system. For a perfect gas, the mass heat capacitance are constant where as the actual fluid the mass heat capacitance usually depending on the working pressure and temperature. To simply the calculation for the actual gas, we assume that the two systems have the same maximum pressure (p3) and maximum temperature (T3).
6
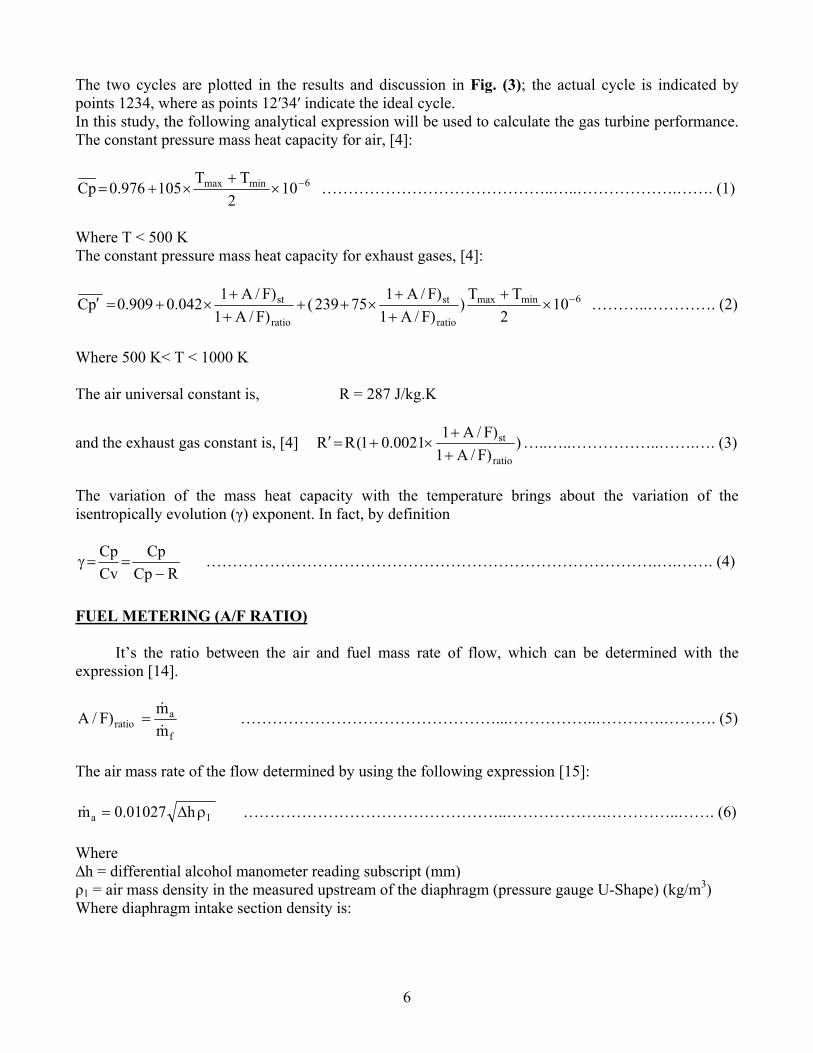
The two cycles are plotted in the results and discussion in Fig. (3); the actual cycle is indicated by points 1234, where as points 12′34′ indicate the ideal cycle. In this study, the following analytical expression will be used to calculate the gas turbine performance. The constant pressure mass heat capacity for air, [4]:
6minmax 102
TT105976.0Cp −×
+×+= ……………………………………..…..……………….……. (1)
Where T < 500 K The constant pressure mass heat capacity for exhaust gases, [4]:
6minmax
ratio
st
ratio
st 102
TT))F/A1)F/A175239(
)F/A1)F/A1042.0909.0pC −×
+++
×++++
×+=′ ………..…………. (2)
Where 500 K< T < 1000 K The air universal constant is, R = 287 J/kg.K
and the exhaust gas constant is, [4] ))F/A1)F/A10021.01(RRratio
st
++
×+=′ …..…..……………..…….…. (3)
The variation of the mass heat capacity with the temperature brings about the variation of the isentropically evolution (γ) exponent. In fact, by definition
RCpCp
CvCp
−==γ ………………………………………………………………………….….……. (4)
FUEL METERING (A/F RATIO) It’s the ratio between the air and fuel mass rate of flow, which can be determined with the expression [14].
f
aratio m
m)F/A&
&= …………………………………………...……………..………….………. (5)
The air mass rate of the flow determined by using the following expression [15]:
1a h01027.0m ρ∆=& …………………………………………..……………….…………..……. (6) Where ∆h = differential alcohol manometer reading subscript (mm) ρ1 = air mass density in the measured upstream of the diaphragm (pressure gauge U-Shape) (kg/m3) Where diaphragm intake section density is:
7
1
11a1 TR
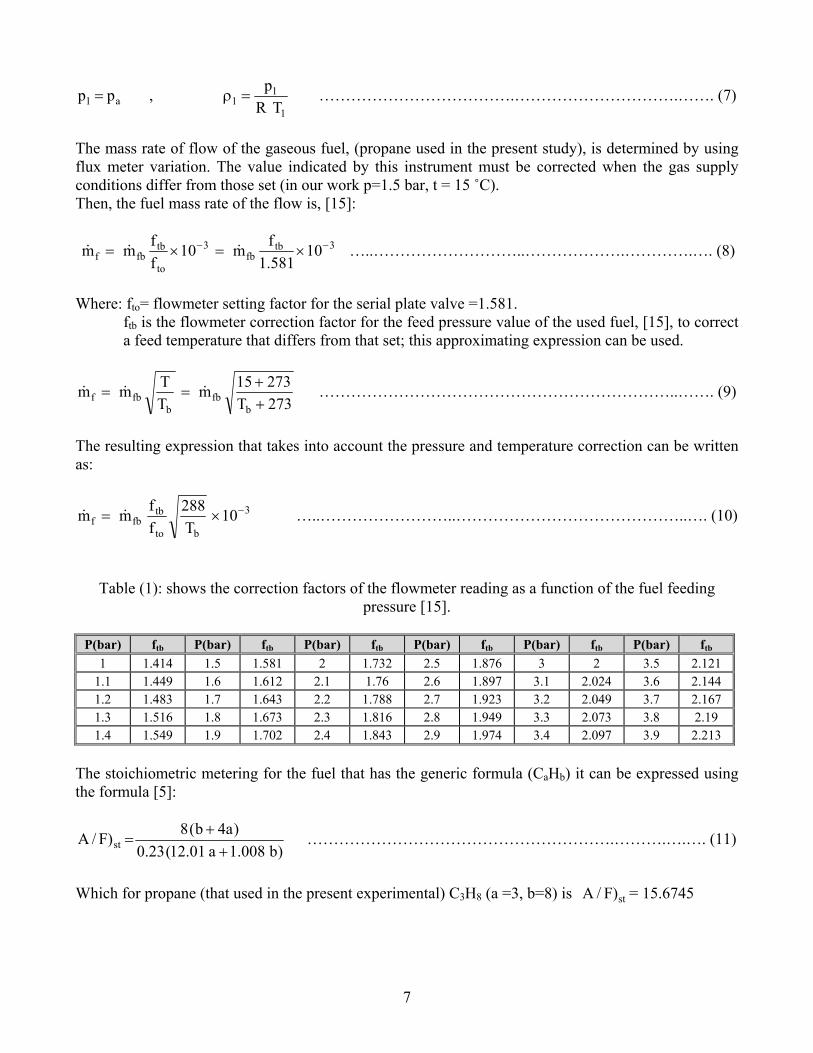
p , p p =ρ= ……………………………….………………………….……. (7)
The mass rate of flow of the gaseous fuel, (propane used in the present study), is determined by using flux meter variation. The value indicated by this instrument must be corrected when the gas supply conditions differ from those set (in our work p=1.5 bar, t = 15 ˚C). Then, the fuel mass rate of the flow is, [15]:
3tbfb
3
to
tbfbf 10
581.1fm10
ffmm −− ×=×= &&& …..………………………..……………….………….…. (8)
Where: fto= flowmeter setting factor for the serial plate valve =1.581.
ftb is the flowmeter correction factor for the feed pressure value of the used fuel, [15], to correct a feed temperature that differs from that set; this approximating expression can be used.
273T27315m
TTmm
bfb
bfbf +
+== &&& …………………………………………………………..……. (9)
The resulting expression that takes into account the pressure and temperature correction can be written as:
3
bto
tbfbf 10
T288
ffmm −×= && …..……………………..……………………………………..…. (10)
Table (1): shows the correction factors of the flowmeter reading as a function of the fuel feeding pressure [15].
The stoichiometric metering for the fuel that has the generic formula (CaHb) it can be expressed using the formula [5]:
)b008.1a01.12(23.0)a4b(8)F/A st +
+= ………………………………………………….……….….…. (11)
Which for propane (that used in the present experimental) C3H8 (a =3, b=8) is st)F/A = 15.6745
8
PERFORMANCE OF THE GAS TURBINE SYSTEM From the experimental results data that obtained, it’s possible to determine the overall efficiency of the heater as following, [6]:
ratio
233T2Theat
)F/A(1HCV
)TT(pC
+
−′=η + …………………………………………………..….……………. (12)
The system efficiency is given as
1
TP,tTPO
1
TP,ss Q
PQ
P&&
η==η ……………………………………………….....………..………………. (13)
Where, 1Q& is the heat power supplied to the fuel in the heater, it’s given as following:
)TT(pC)F/A
)F/A1mQ 233T2T
ratio
ratioa1 −′+
= +&& ……………………………………..….………………. (14)
, TP,tP is the internal power supplied, which is given as following:
)TT(pC)F/A
)F/A1mP 545T4Tratio
ratioaTP,t −′+
= +& ………….……………………..……………….…... (15)
and TPOη is the organic efficiency of the turbine, in the present experimental apparatus, it’s within the range (0.9-0.94), [15]. The system overall efficiency is given as sheatoverall ηη=η ….…..……….…….………….…. (16)
The alternator efficiency is given as TP,tTPO
alt
TP,s
altalt P
PPP
η==η …..………..……….….… (17)
Where the alternator electrical power is Palt = V I ……….………………….………….. (18) COMPARISON BETWEEN THE T-S DIAGRAM FOR ACTUAL AND IDEAL CYCLE Firstly, we must check the experimental data by plotting the (T-S) diagram for both ideal and actual cycle and then we made comparison between them. The mathematical formulations that used to find the (T-S) diagram for ideal and actual systems as mentioned below, where the actual cycle is indicated by points 1234, where as points 12′34′ indicate the ideal cycle. We assumed the maximum and minimum temperatures and pressures are same (points (1) and (3)) for both theoretical and experimental study. The state of the fluid in the points (2′) and (4′) is determined as following, [2]:
9
The value of ( ) γ−γ
=′1
c12 rTT …………….…….……………………………..…. (19)
Where rc is the compression ratio 1
2c p
pr
′= , 32 pp =′ and 12 S S =′ ………………….….……….…. (20)
The value of ( ) γ
−γ=′ 1
c
34
r
TT , 14 pp =′ and 34 S S =′ ………...……………….……………..….… (21)
In order to plot the actual cycle on the (T-S) diagram, it is necessary to determine the entropy state function for the air at the termination of compression, [5]
)pp(LnR)
TT(LnCpSS
1
2
1
22T1T12 −=− − ……………………………………………….………. (22)
And for the exhaust gas at the heater outlet
)pp(LnR)
TT(LnpCSS
2
3
2
33T2T23 ′−′=− − ……………….………………….……..………….…. (23)
Finally, the ideal cycle efficiency (ηid) can written as, [2]
)1T/T(T)1T/T(T1
QQ1
232
141
added
remveid −
−−=−=η ………….………….……………….…………….…. (24)
Then in order to check the accuracy of the experimental study, we plotted the (T-S) diagram for both ideal and actual cycle in Fig. (3), we can notes the experimental data are approximately accepted and accurate. RESULTS AND DISCUSSION The effects of the power turbine speed on the overall system efficiency for different values of compression ratio are shown in Fig. (4). We can notes the increasing of the power turbine speed will increase the overall efficiency by increasing the generated power, and then increase the useful power, A/F ratio. The increasing of the compression ratio will increase the overall system efficiency because the increasing of the compression ratio will increase the maximum pressure, the heat added and then the overall system efficiency. From this figure also we can notes, for small values of the compression ratio, the increasing of the power turbine speed will increase the overall system efficiency sharply at small and large values of the power turbine speed but the increasing of the power turbine speed at large values of the compression ratio will become not noticeable effect on the overall system efficiency at large values of the power turbine speed. Also, the effect of the fuel flow rate on the overall system efficiency for different values of the gas turbine speed are plotted in the Fig. (5), the increasing of the fuel flow rate will increase the heat added and then increase the overall system efficiency, but for the large values of the fuel rate, the increasing in the fuel flow rate will cause lower and not noticeable increasing in the overall system efficiency because it is increased the consumable fuel and then increase the heat in the combustion chamber. Also, from this figure, the increasing of the fuel flow rate
10
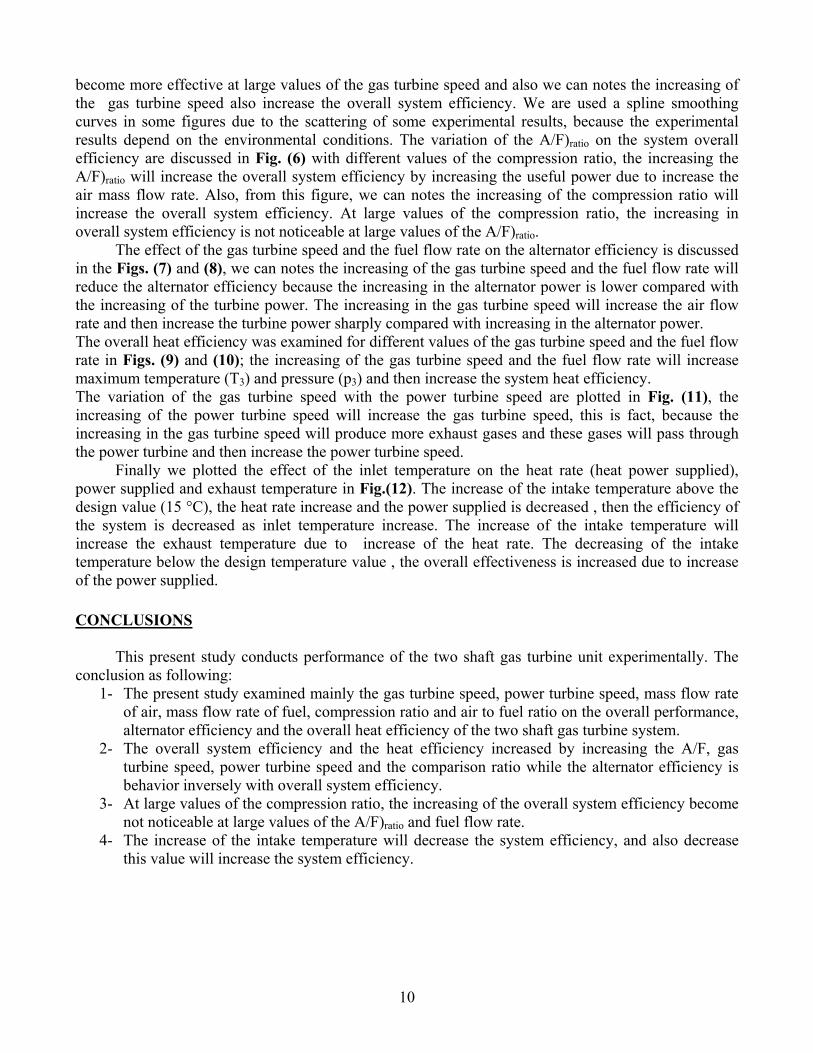
become more effective at large values of the gas turbine speed and also we can notes the increasing of the gas turbine speed also increase the overall system efficiency. We are used a spline smoothing curves in some figures due to the scattering of some experimental results, because the experimental results depend on the environmental conditions. The variation of the A/F)ratio on the system overall efficiency are discussed in Fig. (6) with different values of the compression ratio, the increasing the A/F)ratio will increase the overall system efficiency by increasing the useful power due to increase the air mass flow rate. Also, from this figure, we can notes the increasing of the compression ratio will increase the overall system efficiency. At large values of the compression ratio, the increasing in overall system efficiency is not noticeable at large values of the A/F)ratio. The effect of the gas turbine speed and the fuel flow rate on the alternator efficiency is discussed in the Figs. (7) and (8), we can notes the increasing of the gas turbine speed and the fuel flow rate will reduce the alternator efficiency because the increasing in the alternator power is lower compared with the increasing of the turbine power. The increasing in the gas turbine speed will increase the air flow rate and then increase the turbine power sharply compared with increasing in the alternator power. The overall heat efficiency was examined for different values of the gas turbine speed and the fuel flow rate in Figs. (9) and (10); the increasing of the gas turbine speed and the fuel flow rate will increase maximum temperature (T3) and pressure (p3) and then increase the system heat efficiency. The variation of the gas turbine speed with the power turbine speed are plotted in Fig. (11), the increasing of the power turbine speed will increase the gas turbine speed, this is fact, because the increasing in the gas turbine speed will produce more exhaust gases and these gases will pass through the power turbine and then increase the power turbine speed. Finally we plotted the effect of the inlet temperature on the heat rate (heat power supplied), power supplied and exhaust temperature in Fig.(12). The increase of the intake temperature above the design value (15 °C), the heat rate increase and the power supplied is decreased , then the efficiency of the system is decreased as inlet temperature increase. The increase of the intake temperature will increase the exhaust temperature due to increase of the heat rate. The decreasing of the intake temperature below the design temperature value , the overall effectiveness is increased due to increase of the power supplied. CONCLUSIONS This present study conducts performance of the two shaft gas turbine unit experimentally. The conclusion as following:
1- The present study examined mainly the gas turbine speed, power turbine speed, mass flow rate of air, mass flow rate of fuel, compression ratio and air to fuel ratio on the overall performance, alternator efficiency and the overall heat efficiency of the two shaft gas turbine system.
2- The overall system efficiency and the heat efficiency increased by increasing the A/F, gas turbine speed, power turbine speed and the comparison ratio while the alternator efficiency is behavior inversely with overall system efficiency.
3- At large values of the compression ratio, the increasing of the overall system efficiency become not noticeable at large values of the A/F)ratio and fuel flow rate.
4- The increase of the intake temperature will decrease the system efficiency, and also decrease this value will increase the system efficiency.
11
FIGURES
5.6 5.8 6 6.2 6.4 6.6 6.8 7Entropy ( Kj/Kg.K)
200
300
400
500
600
700
800
900
1000
Tem
pera
ture
(K)
2'
1
2
3
4
4'
Fig. (3), The comparison between the actual and the ideal efficiency for the first test
Fig. (11), The variation of the gas turbine speed and the power turbine speed
10 15 20 25 30 35 40Inlet Temperature (oC)
70
80
90
100
110
120
Perc
enta
ge (
% )
Gas Turbine SystemHeat Rate (KJ/Kg)Power Supply (KW)Exhuast Temperature (oC)
Fig. (12), The variation of the gas turbine speed and the power turbine speed
16
REFERENCES 1- White, A.O., “The Place of the Gas Turbine in Electrical Power Generation”, Trans. ASME,
1956. 2- Potter, J.P., “Power Plant Theory and Design”, JOHN WILEY and SONS, 1959. 3- Dundas, R.E., “Design of the Gas Turbine Engine”, Sawyer’s Gas Turbine Engineering
Handbook Volume 1, Gas Turbine Publications Inc, 2002. 4- Cengel, Y.A., Boles, M.A., “Thermodynamic an Engineering Approach”, McGraw-Hill
and Technical, New York,2000. 6- Howard, C.P., “Thermodynamics and fundamentals of the Gas Turbine Cycle”, Sawyer’s Gas
Turbine Engineering Handbook Volume 1, Gas Turbine Publications Inc, 2001. 7- Hazard, H.R., “Combustor Design”, Sawyer’s Gas Turbine Engineering Handbook Volume 1, Gas
Turbine Publications Inc, 1999. 8- Bathie, W.W., “Fundamentals of Gas Turbines”, John Wiley and Son, 2000. 9- Daycock,C. andDesjardians, R., “ Generation Cost Forecasting Using On-Line Thermodynamic
Models” ELECTRICAL POWER Conf., March 30- April 1, 2004, Baltimore, MD. 10- Albert J. Juhasz, and Jerzy T. Sawicki, “Lunar Surface Gas Turbine Power Systems with
Fission Reactor Heat Sources”, NASA/TM—2005-214003 11- Brooks,F.J., “GE Gas Turbine Performance Characteristics” GE Power Systems _ GER-3567H
_ (10/00) ,2006. 12- Dipippo, R, “Small Geothermal Power plant, Design, Performance and Economic”, Geo-Heat
Center Quarterly Bulletin, Vol.20, No.2, June, 1999. 13- Layne, A., “Advanced Turbine System Program”, National Energy Technology Laboratory,
http://www.netl.doe.gov/publications/factsheet/program/prog002.pdf 14- Jared, W. J., “The Development of an Accelerated Testing Facility for the Study of Deposits in
Land-Based Gas Turbine Engines”, M.Sc. Thesis, Department of Mechanical Engineering, Brigham Young University, August 2004.
15- Didacta Italia., “T200D Two Shaft Gas Turbine”, User’s Manual and Exercise Guide, 2001.