Farm Diversification in England 2002: Final Report 4. THE NATURE OF FARM DIVERSIFICATION 4.1 Patterns of diversification 4.1.1 This chapter focuses on the findings of the postal survey, with the empirical results structured around the definition of diversification discussed in Chapter 2 (section 2.4 and Table 2.3. – the diversion of agricultural resources into income-generating activities beyond the boundaries of conventional farming. Agricultural businesses based on registered agricultural holdings provide the basic framework for analytical purposes. However, it is worth mentioning at the outset that a significant number of the businesses , while classified as ‘agricultural’ holdings by virtue of their possession of land, had either very little involvement in farming or contained a high proportion of non-farming enterprises. It is no longer the case that diversified businesses are necessarily supplementary to the main business of farming, since it is evident that such a structure cannot be taken for granted. 4.1.2 The initial analytical framework uses information available from the agricultural census as well as supplementary data collected directly in the postal questionnaire. The following analyses of the patterns of farm diversification utilise a range of perspectives in examining the current nature and extent of farm diversification in England. These include such characteristics of the surveyed holdings as farm business size, farm type, region and tenure; and spatially defined groupings based on a holding’s location in relation to policy-based designations including LFA, ESA, National Park or Objective 1 and 2 areas. Many of these attributes are based on the agricultural census data for the individual holdings sampled, rather than relating directly to farm businesses per se. However, the postal responses were from farm businesses, which not infrequently cover more than one holding. While this is not expected to exert a very significant influence on the findings 1 the overall effect is to introduce a certain amount of imprecision between groups. For instance, the responses recorded under smaller holdings may be expected to include some which actually relate to larger ‘multiple holding’ businesses. However, the relatively small scale of this problem makes it highly unlikely that any spurious correlations have been introduced as a result. The overall incidence of diversification 4.1.3 Of the 2,785 usable responses on which these analyses are based a total of 1,624 holdings (58.3 per cent) were found to be engaged in some form of diversified activity, as defined in Table 2.3 (Table 4.1). Broadly speaking, then, the postal survey suggests that almost six out of ten agricultural holdings in England are currently engaged in some gainful activity other than conventional agricultural production 2 . Moreover, although in most cases this diversified activity is taking place alongside conventional farming, as might be expected, it emerges from this survey that on nearly one in five diversified holdings there is no 1 DEFRA is well aware of the problems posed by the increasingly outmoded sampling framework available from the Agricultural Census, including the issues raised by the ‘multiple holdings’ problem. It is understood that work is currently underway on an integrated ‘Agricultural Businesses’ database, but this is not yet in a sufficiently complete state to be of help in the present study. 2 Although this broad finding must be tempered with the interview survey finding that about a fifth of the diversified activities recorded in the postal survey are relatively insignificant in economic terms, since most diversified farms are engaged in more than one activity this does not change the postal survey evidence on the overall incidence of diversification (see paragraphs 5.2.5ff). Centre for Rural Research, University of Exeter 30
Transcript
Farm Diversification in England 2002: Final Report
4. THE NATURE OF FARM DIVERSIFICATION 4.1 Patterns of diversification 4.1.1 This chapter focuses on the findings of the postal survey, with the empirical results structured around the definition of diversification discussed in Chapter 2 (section 2.4 and Table 2.3. – the diversion of agricultural resources into income-generating activities beyond the boundaries of conventional farming. Agricultural businesses based on registered agricultural holdings provide the basic framework for analytical purposes. However, it is worth mentioning at the outset that a significant number of the businesses , while classified as ‘agricultural’ holdings by virtue of their possession of land, had either very little involvement in farming or contained a high proportion of non-farming enterprises. It is no longer the case that diversified businesses are necessarily supplementary to the main business of farming, since it is evident that such a structure cannot be taken for granted. 4.1.2 The initial analytical framework uses information available from the agricultural census as well as supplementary data collected directly in the postal questionnaire. The following analyses of the patterns of farm diversification utilise a range of perspectives in examining the current nature and extent of farm diversification in England. These include such characteristics of the surveyed holdings as farm business size, farm type, region and tenure; and spatially defined groupings based on a holding’s location in relation to policy-based designations including LFA, ESA, National Park or Objective 1 and 2 areas. Many of these attributes are based on the agricultural census data for the individual holdings sampled, rather than relating directly to farm businesses per se. However, the postal responses were from farm businesses, which not infrequently cover more than one holding. While this is not expected to exert a very significant influence on the findings1 the overall effect is to introduce a certain amount of imprecision between groups. For instance, the responses recorded under smaller holdings may be expected to include some which actually relate to larger ‘multiple holding’ businesses. However, the relatively small scale of this problem makes it highly unlikely that any spurious correlations have been introduced as a result. The overall incidence of diversification
4.1.3 Of the 2,785 usable responses on which these analyses are based a total of 1,624 holdings (58.3 per cent) were found to be engaged in some form of diversified activity, as defined in Table 2.3 (Table 4.1). Broadly speaking, then, the postal survey suggests that almost six out of ten agricultural holdings in England are currently engaged in some gainful activity other than conventional agricultural production2. Moreover, although in most cases this diversified activity is taking place alongside conventional farming, as might be expected, it emerges from this survey that on nearly one in five diversified holdings there is no
1 DEFRA is well aware of the problems posed by the increasingly outmoded sampling framework available from the Agricultural Census, including the issues raised by the ‘multiple holdings’ problem. It is understood that work is currently underway on an integrated ‘Agricultural Businesses’ database, but this is not yet in a sufficiently complete state to be of help in the present study. 2 Although this broad finding must be tempered with the interview survey finding that about a fifth of the diversified activities recorded in the postal survey are relatively insignificant in economic terms, since most diversified farms are engaged in more than one activity this does not change the postal survey evidence on the overall incidence of diversification (see paragraphs 5.2.5ff).
Centre for Rural Research, University of Exeter 30
Farm Diversification in England 2002: Final Report
conventional agricultural production. Considered in the context of England’s agricultural sector, therefore, it is estimated that about ten per cent of all ‘farm’ holdings are engaged only in diversified activities. Given the breadth of our definition this may, of course, include some production of unconventional agricultural products. The first key finding, therefore, is that 58.3 per cent of all agricultural holdings have at least one diversified activity.
Table 4.1 Farm diversification in England by farm business size, farm type and tenure, 2002
Per cent diversified
Divergence from ‘all holdings’ average
All holdings 58.3 Farm business size (ESU) Very small 47.9 -10.4% Small 63.4 +5.1% Medium 64.0 +5.6% Large 68.0 +9.7% Very large 80.7 +22.3% Farm type Cereals 69.9 +11.6% General cropping 71.3 +12.9% Horticulture 63.4 +5.1% Pigs & poultry 60.9 +2.6% Dairy 50.1 -8.2% Cattle & sheep (LFA) 50.2 -8.2% Cattle & Sheep (Lowland) 59.8 +1.4% Mixed 74.6 +16.2% Other types 48.1 -10.3% Land tenure Wholly owned 54.5 -3.8% Mainly owned 67.5 +9.1% Mainly tenanted 63.1 +4.8% Wholly tenanted 66.4 +8.1% Diversification and farm business size 4.1.4 One of the important findings of this research concerns the relationship between farm business size and involvement in diversification. There appears to be a consistent relationship between farm business size and diversification, with larger holdings more likely to have branched out of conventional agriculture. Thus, diversification is significantly more common on ‘very large’ farms with more than eight out of ten holdings in this group recording additional activities, well above the ‘all holdings’ average. At the other extreme holdings classed as ‘very small’ are the least diversified group although, even here, nearly half have some such activity.
Centre for Rural Research, University of Exeter 31
Farm Diversification in England 2002: Final Report
4.1.5 Having observed a similar relationship between farm size and diversification, the first Exeter baseline study (hypothesised about its nature thus:
‘In one sense the smaller farms may seem more in need of finding alternative sources of income, since large farms can better capture the economies that make for cost-efficient agricultural production. On the other hand, many small farms may be effectively part-time anyway because the operator requires another job to sustain the household income; in such circumstances where the labour resources have not been fully committed to farming, there may be insufficient time (or farm resources) to divert into the establishment of additional on-farm enterprises.’ (McInerney et al, 1989)
4.1.6 This study confirms that this pattern in diversification persists and it appears that larger farms are more likely to have the resources, the flexibility and, perhaps, an entrepreneurial management, to pursue opportunities for diversification. Of course, significant numbers of ‘very small’ and even some medium size holdings are known to function largely as residential units (Ward and Manley 2001), and are not being operated under primarily business objectives. In others, where farming is carried out, smaller farms were likely to contain household members employed in off-farm occupations (not classified as diversification of the purposes of this study). If we also add into the equation the incidence of organic farming and participation in agri-environment schemes we find a minority of farmers in all size categories reliant solely on what might be termed conventional agriculture, as shown in Table 4.2.
Centre for Rural Research, University of Exeter 32
Farm Diversification in England 2002: Final Report
Table 4.2 Participation in farm diversification, organic and agri-environment schemes in England by farm business size, farm type and tenure, 2002
Percent diversified, organic and/or
participating in agri-environment schemes
Divergence from ‘all holdings’ average
All holdings 63.6 Farm business size (ESU) Very small 51.5 -12.0% Small 69.5 +5.9% Medium 71.3 +7.8% Large 73.1 +9.5% Very large 86.0 +22.5% Farm type Cereals 73.2 +9.6% General cropping 74.8 +11.2% Horticulture 65.8 +2.2% Pigs & poultry 63.0 -0.6% Dairy 59.7 -3.9% Cattle & sheep (LFA) 67.1 3.5% Cattle & Sheep (Lowland) 68.1 +4.6% Mixed 77.8 +14.2% Other types 50.8 -12.7% Land tenure Wholly owned 59.1 -4.5% Mainly owned 73.8 +10.3% Mainly tenanted 70.1 +6.5% Wholly tenanted 73.0 +9.4% Diversification and farm type
4.1.7 A very interesting pattern of diversification emerges from the data relating to farm type. Compared to the ‘all holdings’ average, diversification is significantly more common on ‘cereals’, ‘general cropping’ and ‘mixed’ farms, and notably less common on ‘dairy’ and ‘cattle and sheep (LFA)’ farms, and on ‘other types’3 (Table 4.1). Both ‘pigs and poultry’ and ‘horticulture’ types are slightly more likely than average to have some form of diversified activity. These findings are, in fact, remarkably consistent with the earlier study of farm diversification (McInerney et al, 1989), confirming what must be regarded as an established pattern. The incidence of diversification between farm type groups ranges from 48.1 per cent (‘other types’) to 74.6 per cent (‘mixed’ farms).
3 Since the latter group are largely composed of the part-time ‘very small’ holdings discussed earlier these are not referred to again here.
Centre for Rural Research, University of Exeter 33
Farm Diversification in England 2002: Final Report
Diversification and land tenure
4.1.8 The importance of land tenure as a factor in farm diversification is an issue of considerable interest in a policy context, and Table 4.1 provides what may be regarded as an unexpected contribution to an understanding of the process. The respondents were classed as one of four tenure types – wholly owned, mainly owned, mainly tenanted or wholly tenanted – based on the information collected as part of the agricultural census. The usual caveats regarding the relationship between agricultural holdings and farm businesses apply. The data show that owner occupied holdings are less likely than average to be involved in any form of farm diversification, at 54.5 per cent compared with the ‘all holdings’ figure of 58.3 per cent. Wholly tenanted holdings, in contrast, are the most heavily involved, at 66.4 per cent. There is no clear pattern for mixed tenure holdings, other than to suggest that farms which include some rented land are noticeably more likely to have some diversified activity. Table 4.2 shows that much of the difference is in the part-time category. Full-time holdings reveal very similar rates of diversification across tenure type. 4.1.9 At first glance these findings may be seen as counter-intuitive, since owner occupiers clearly have greater freedom than tenants in planning and implementing diversification projects, as well as better resources in terms of business assets. Indeed, this is an issue that has attracted considerable comment in recent times with bodies representing tenant farmers arguing that their members are disadvantaged through having less opportunity for diversification. 4.1.10 It is possible to construct a plausible hypothesis as to why wholly owned holdings are not more diversified than wholly tenanted holdings, which rests on the possibility of a linkage between diversification, entrepreneurial talent and business viability. First, there is good evidence that many of the more entrepreneurial farmers typically expand their farming business through various forms of tenure and quasi-tenure arrangements (Whitehead et al 2002, Lobley et al 2002). Secondly, studies have also shown that farm businesses under greater pressure - for example, through having to meet regular rent payments for land, and/or debt servicing charges – typically have higher performance. (ref Maunder et al, ). However, some caution in interpreting the results is appropriate given the findings of a recent study of structural change in agriculture which found that ‘the expansion of varied tenure arrangements and whole farm contracting means that holdings-based data have less and less relevance in monitoring the extent of farm business change’ (Lobley et al, 2002). Full-time and part-time holdings compared
4.1.11 These three sets of characteristics (size, type and tenure) , of course, are not independent. In particular the great majority of ‘very small’ holdings are wholly owned and fall into just two farm types, ‘cattle and sheep (lowland)’ and ‘other types’. Although other distinctive associations can be discerned, these are not as clearcut4. The relationships between business size and both farm type and land tenure are evident in Table 4.3. Table 4.3 Patterns of diversification by farm type and land tenure: ‘very small’ holdings compared with all others
‘Very small’ holdings All other business sizes
Divergence Divergence
Centre for Rural Research, University of Exeter 34
4 Detailed survey results are given in Appendices D, E and F.
Farm Diversification in England 2002: Final Report
Percent
diversified
from ‘all holdings’ average
Percent
diversified
from ‘all holdings’ average
All holdings 48 65 Farm type Cereals 43 -5% 75 +9% General cropping 50 +2% 73 +7% Horticulture 52 +4% 70 +4% Pigs & poultry 46 -2% 72 +6% Dairy 27 -21% 51 -15% Cattle & sheep (LFA) 47 -1% 52 -13% Cattle & sheep (low) -48% 60 -6% Mixed 80% +32% 73 +8% Other types 47 -1% 86 +20% Land tenure Wholly owned 46 -2% 64 -1% Mainly owned 59 +11% 69 +3% Mainly tenanted 40 -8% 66 +1% Wholly tenanted 73 +25% 65 -0% 4.1.12 This analysis provides a clearer understanding of differences in the rate of diversification between full-time (holdings rated as being 8 ESU or over) and part-time (holdings of less than 8 ESU) units. The first evident difference is that part-time holdings are significantly less likely to be involved in diversification (at 48 per cent) than full-time holdings (at 65 per cent), with one notable exception. Wholly tenanted part-time holdings, uniquely, recorded a higher involvement in diversification than their full-time counterparts. The second key finding, therefore, is that 65 per cent of full-time holdings are diversified, compared with 48 per cent of part-time holdings. 4.1.13 Secondly, there is evidence of a much greater consistency of involvement in diversified activities among part-time holdings (range 47 to 51 per cent) when considered in terms of farm type. However, most of these holdings are wholly owned and, echoing the ‘all holdings’ results, these are less likely to have diversified than those partly or wholly tenanted. Indeed, wholly tenanted part-time holdings are more likely to be diversified than their full-time equivalents. Within the part-time ‘other types’ groups three main farm types each account for about a third - ‘specialist grass and forage’, ‘specialist horses’ and ‘unclassifiable’ for which the rates of diversification were 50 per cent, 62 per cent and 28 per cent, respectively. A number of the specialist horse holdings do not qualify as diversified inasmuch as the horses are kept purely for personal use with no services offered. 4.1.14 Among the formally full-time holdings5 ‘dairy’ and both ‘cattle and sheep’ farm types are less likely than average to be diversified but, as noted earlier, there are no significant differences on the basis of land tenure. For the record, it seems likely that the very high level of diversification recorded in the full time ‘other types’ group is probably explained by it being composed mainly of the ‘specialist horse’ main farm type.
Centre for Rural Research, University of Exeter 35
5 Evidence from the Farm Business Survey, and elsewhere, indicates that many nominally ‘full-time’ holdings (i.e. those between 8 and 16 ESU) are in fact only capable of being operated on a part-time basis.
Farm Diversification in England 2002: Final Report
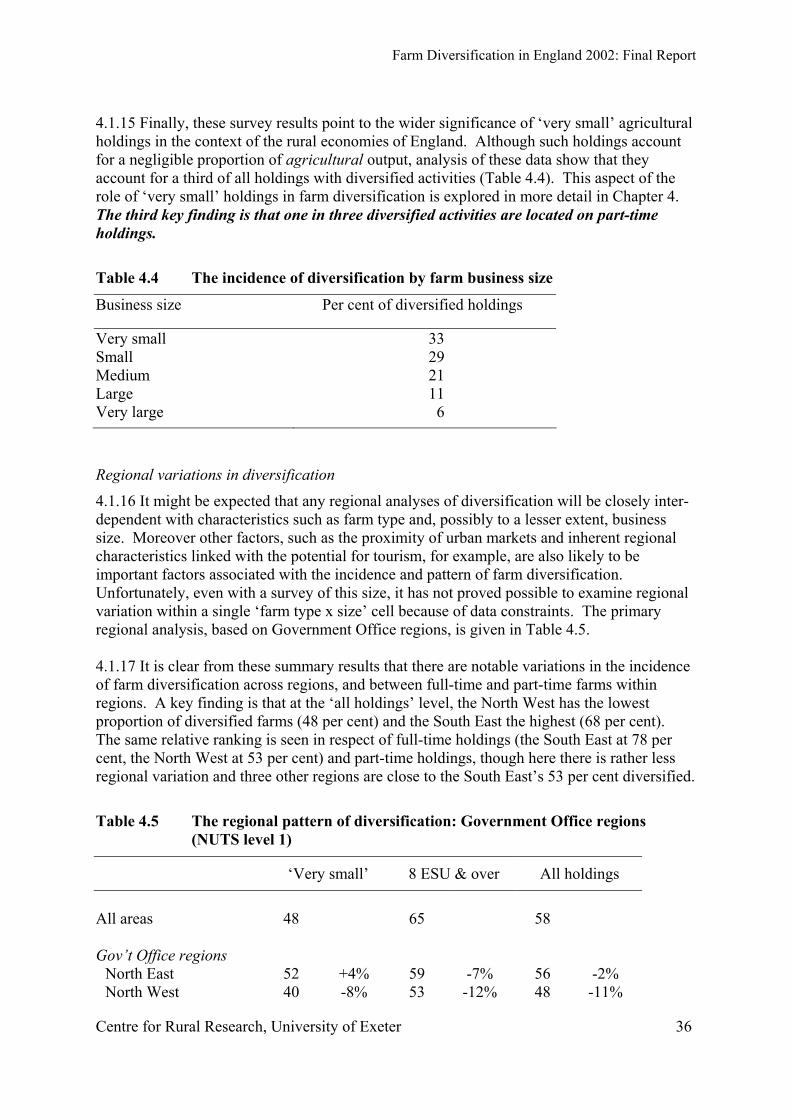
4.1.15 Finally, these survey results point to the wider significance of ‘very small’ agricultural holdings in the context of the rural economies of England. Although such holdings account for a negligible proportion of agricultural output, analysis of these data show that they account for a third of all holdings with diversified activities (Table 4.4). This aspect of the role of ‘very small’ holdings in farm diversification is explored in more detail in Chapter 4. The third key finding is that one in three diversified activities are located on part-time holdings.
Table 4.4 The incidence of diversification by farm business size
Business size Per cent of diversified holdings
Very small 33 Small 29 Medium 21 Large 11 Very large 6 Regional variations in diversification
4.1.16 It might be expected that any regional analyses of diversification will be closely inter-dependent with characteristics such as farm type and, possibly to a lesser extent, business size. Moreover other factors, such as the proximity of urban markets and inherent regional characteristics linked with the potential for tourism, for example, are also likely to be important factors associated with the incidence and pattern of farm diversification. Unfortunately, even with a survey of this size, it has not proved possible to examine regional variation within a single ‘farm type x size’ cell because of data constraints. The primary regional analysis, based on Government Office regions, is given in Table 4.5. 4.1.17 It is clear from these summary results that there are notable variations in the incidence of farm diversification across regions, and between full-time and part-time farms within regions. A key finding is that at the ‘all holdings’ level, the North West has the lowest proportion of diversified farms (48 per cent) and the South East the highest (68 per cent). The same relative ranking is seen in respect of full-time holdings (the South East at 78 per cent, the North West at 53 per cent) and part-time holdings, though here there is rather less regional variation and three other regions are close to the South East’s 53 per cent diversified.
Table 4.5 The regional pattern of diversification: Government Office regions (NUTS level 1)
‘Very small’ 8 ESU & over All holdings
All areas 48 65 58 Gov’t Office regions
North East 52 +4% 59 -7% 56 -2% North West 40 -8% 53 -12% 48 -11%
Centre for Rural Research, University of Exeter 36
Farm Diversification in England 2002: Final Report
Yorkshire & Humber 48 +0% 72 +6% 55 -4% East Midlands 43 -5% 62 -4% 55 -4% West Midlands 43 -5% 61 -5% 53 -5% East of England 51 +3% 70 +4% 64 +6% South East 53 +5% 78 +13% 68 +9% South West 52 +4% 67 +2% 61 +3%
4.1.18 It may be surmised from these data that, irrespective of farm type and other holdings-related factors, there is firm evidence of significant regional variations in diversification which are probably linked to the existence of exploitable opportunities. In other words, market-related factors are important in the development of farm diversification. For example, it seems a reasonable hypothesis that the relatively high level of diversification in the South West region – despite its strong association with various forms of livestock farming, which have a lower than average incidence of diversification – will be related to factors such as tourism potential. Conversely, the north is clearly less diversified than the south of the country. A similar distinction may be drawn between the South East and the North West, in terms which emphasise the other major locational effect of ‘urban markets’, where the market for let workspace in converted buildings etc might be distinguished from other types of diversified ‘product’. Some of these aspects are explored further in Chapter 4. The fourth key finding is that regional factors linked to market opportunities have an important influence on the pattern of farm diversification. 4.1.19 Further spatially-based analyses of the pattern of farm diversification are given in Table 4.6. At national level, at least, the incidence on hill farms, defined here as those located within one of the LFAs, largely mirror the farm type analyses presented in Table 4.2, although there are unsurprising indications that remoteness (as shown by SDA status) is associated with a lower incidence of diversification. Similarly holdings in National Parks are less likely to be diversified than others, notwithstanding tourism possibilities in those locations. Holdings in Objective One areas are actually more likely to be diversified than their counterparts, though since the great majority of these holdings are found in Cornwall (with a few in Merseyside and South Yorkshire) this may be largely reflecting different regional opportunities as noted earlier. Conversely, holdings in Objective Two areas are rather less likely than average to be diversified, the bulk of these holdings being located in Cumbria, Devon and Herefordshire. Table 4.6 Other regional patterns of diversification across spatially defined
4.2 Other structural aspects of diversification 4.2.1 This section considers the postal survey findings in more detail, focussing particularly on the range of diversified activities currently found on agricultural holdings in England. It has been argued elsewhere that farm business diversification should be seen as a natural development in rural resource use in a modern economy (McInerney et al, 1989). As the requirement for agriculture, particularly food production, to have a primary claim on land use has receded, so the demands for a range of new products and services that farmers can provide have become more evident. To the extent that diversification is a market-led response to new, and evolving, consumer demands it can properly be regarded as an integral feature of a modern farm business. As this study has established, about two out of three full-time farms are already involved in diversified activity and it is now clearly a normal part of the English farming scene. 4.2.2 The range of the activities now found in close association with agriculture is extremely broad. Some are products or processes which are relatively new, if not entirely novel, in the agricultural sector while others are activities which have been long established on a few farms, or in particular localities, but are now being taken up more widely. Other ways in which farm income can be enhanced through diversification do not so much involve expanding the scope of the farm business as moving agricultural resources into other uses. While many activities will be of only minor significance individually, when compared with conventional agricultural production, their range and diversity means that diversification is an important phenomenon in aggregate. Diversification and conventional agriculture: some comparisons
4.2.3 In Table 4.7 farm diversification is considered in relation to its relative importance in terms of the proportion of the agricultural land area associated with some form of diversified economic activity. On the basis of the survey results it can be concluded that more than two thirds of England’s farmed area is closely associated with diversification. Put another way, the farm businesses responsible for farming some 68 per cent of the country’s farmland have some form of business diversification. A further 4 per cent of land is held by farm businesses which do not themselves produce any conventional agricultural product, suggesting that approaching three quarters of the nation’s farmland is associated with diversified activities. Table 4.8 shows the regional distribution.
Centre for Rural Research, University of Exeter 38
Farm Diversification in England 2002: Final Report
Table 4.7 Farmed area associated with diversification, by category of involvement: all holdings in England
Total area6
(ha)
Percent of total area
Average area per holding
(ha) Conventional but not diversified 2,046,000 23 72 Conventional and diversified 6,176,000 68 104 Diversified but no conventional 318,000 4 25 Neither conventional nor diversified 529,000 6 23 All holdings 9,069,000 100 73
Centre for Rural Research, University of Exeter 39
6 This has been calculated by applying the proportions of the total weighted areas to the actual total farmed area in England (the weighted total is only 4 per cent away from the true actual).
Farm Diversification in England 2002: Final Report
Table 4.8 Farmed area associated with diversification, by category of involvement: all holdings in England Regions
Total area7
(ha)
Percent of total area
Average area per holding
(ha) North East Conventional but not diversified 191,000 33% 133 Conventional and diversified 366,000 63% 153 Diversified but no conventional 3,000 1% 5 Neither conventional nor diversified 19,000 3% 21 All holdings 580,000 100% 108 North West Conventional but not diversified 319,000 36% 58 Conventional and diversified 444,000 50% 59 Diversified but no conventional 39,000 4% 25 Neither conventional nor diversified 85,000 10% 19 All holdings 887,000 100% 47 Yorkshire & Humber Conventional but not diversified 191,000 18% 139 Conventional and diversified 801,000 75% 261 Diversified but no conventional 42,000 4% 48 Neither conventional nor diversified 40,000 4% 21 All holdings 1,074,000 100% 149 East Midlands Conventional but not diversified 297,000 25% 74 Conventional and diversified 818,000 68% 120 Diversified but no conventional 22,000 2% 18 Neither conventional nor diversified 60,000 5% 23 All holdings 1,197,000 100% 81 West Midlands Conventional but not diversified 279,000 30% 85 Conventional and diversified 527,000 56% 98 Diversified but no conventional 23,000 2% 17 Neither conventional nor diversified 104,000 11% 39 All holdings 933,000 100% 74 East of England Conventional but not diversified 233,000 16% 62 Conventional and diversified 1,078,000 76% 112 Diversified but no conventional 37,000 3% 19 Neither conventional nor diversified 74,000 5% 27 All holdings 1,423,000 100% 79
Centre for Rural Research, University of Exeter 40
7 This has been calculated by applying the proportions of the total weighted areas to the actual total farmed area in England (the weighted total is only 4 per cent away from the true actual).
Farm Diversification in England 2002: Final Report
South East Conventional but not diversified 110,000 9% 51 Conventional and diversified 958,000 82% 104 Diversified but no conventional 43,000 4% 26 Neither conventional nor diversified 57,000 5% 19 All holdings 1,169,000 100% 73 South West Conventional but not diversified 395,000 22% 50 Conventional and diversified 1,209,000 67% 68 Diversified but no conventional 102,000 6% 24 Neither conventional nor diversified 86,000 5% 14 All holdings 1,792,000 100% 50
4.2.4 An alternative take on the relationship between diversification and conventional agriculture is presented in Figure 4.1, which shows the proportions of holdings associated with diversification using the same four categories of involvement as in Table 4.7. Because many of the diversified holdings are very small (see also Table 4.2) the relative proportions are lower than for land area, but the Figure serves to reinforce the finding that diversification is now a normal – though not universal – feature of modern farming.
Figure 4.1 Proportions of holdings in England associated with diversification, by broad category
Conventional but not diversified
23%
Neither19%
Diversified but no conventional
10%
Conventional and diversified
48%
4.2.5 An analysis of ‘inactive’ holdings is presented in Table 4.9. About three quarters of those holdings which reported no conventional agricultural production were classified as ‘other types’. At nearly a fifth of the total number of holdings, those with no diversified activity either are an important issue in the interpretation of the overall levels of Centre for Rural Research, University of Exeter 41
Farm Diversification in England 2002: Final Report
diversification. What are these holdings actually doing? The clearest indication perhaps comes from the fact that 82 per cent relate to ‘uncompleted’ responses (see the analysis of survey response in Chapter 3) which can be broken down into proprietor now retired (28 per cent), farm or land let to others (50 per cent), operates as a private dwelling only (6 per cent) and ‘hobby smallholding’ (8 per cent). According to written comments, the remaining (completed) forms consist mainly of farms with accommodation land let for grass keep. In all of these cases, as they are presently managed, the holdings have little or no scope for diversification. If these holdings are excluded from the calculation, the overall rate of diversification across all holdings could then be restated as 72 per cent of actively managed holdings.
Table 4.9 An analysis of ‘inactive’ holdings, by farm type
72 Categorising diversification: from activities to enterprises
4.2.6 The following tables (Tables 4.10 to 4.17) set out for each diversified ‘enterprise’ its component activities, their prevalence amongst diversified holdings generally8 (col.1) and their prevalence amongst holdings with the enterprise (col. 4), together with the unweighted (sample) numbers of holdings and their estimated frequency at national level (the ‘weighted’ count). The weighted counts have been rounded to the nearest fifty, and estimate the actual number of holdings engaged in each activity and enterprise. The ‘percent with activity within enterprise’ column not only shows the relative importance of the individual activities within each of the enterprises but also illustrates the degree to skew within each enterprise – whether it consists largely of one or two particular activities or is more evenly represented. 4.2.7 The first analysis, Table 4.10, relates to agricultural services. Included under this head are all those enterprises where diversified farmers provide some kind of service to other
Centre for Rural Research, University of Exeter 42
8 To convert to percentage of all holdings simply multiply by 0.58
Farm Diversification in England 2002: Final Report
farmers. More than one in three of diversified farms provide these services. Some 82 per cent are in the form of contract machinery services (other than haulage); one in seven provide machinery hire, one in eight consultancy and management advice and a similar proportion haulage services. Other agricultural service enterprises include the provision of cold storage facilities and the supply of agricultural sundries.
Table 4.10 Diversified activities included under ‘agricultural services’
Percent of diversified holdings
Weighted count
Unweight-ed count
Percent with
activity within
enterprise Agricultural contracting 29 21900 578 82 Machinery hire 5 3600 95 14 Provision of cold storage facilities 1 700 20 3 Consultancy and management 4 3300 69 12 Haulage 4 3150 65 12 Agricultural sundries supply 0 300 9 1 Enterprise totals 35 26650 682 4.2.8 The second group of activities have been classed as trading enterprises (Table 4.11) and are found on almost a third of these holdings. This group contains all those enterprises which involve the selling of agricultural or non-agricultural products to the general public, where the sales aspect of the business is more important than any production or processing activities that might also be undertaken. Virtually half of the enterprises in this category involve selling hay or straw and there is some doubt as to how many of those recording this activity would actually have been engaged in something over and above what would be regarded as conventional – that is, actively trading in hay or straw, or growing for a specialist market. It should be noted that on 70 per cent of the holdings with this activity it was their only activity within ‘trading enterprises’; were these to be excluded the total number of holdings with the enterprise would be reduced by 35 per cent. Of the remainder, most are of the farm shop/farm-gate sales type, including farmers’ markets.
Centre for Rural Research, University of Exeter 43
Farm Diversification in England 2002: Final Report
Table 4.11 Diversified activities included under ‘trading enterprises’
Percent of diversified holdings
Weighted count
Unweight-ed count
Percent with
activity within
enterprise Farm shop 4 2950 74 12 Freezer shop 1 650 14 3 Market stall 2 1350 30 6 Farmers’ markets 3 2000 50 8 Box scheme 1 950 23 4 Egg sales 5 4050 86 17 Milk round 1 700 19 3 Garden centre/plant sales 3 2050 47 8 Hay, straw sales 16 12100 288 49 Miscellaneous supplies 2 1350 37 5 Other marketing or retail 4 3300 82 14 Rural crafts 2 1350 25 5 Teaching of crafts 1 500 13 2 Timber products 3 2500 54 10 Enterprise totals 32 24450 585 4.2.9 A third group of activities involve the provision of accommodation and catering services to the general public (Table 4.12). These enterprises all offer overnight accommodation services to visitors, from minimal provision (campsites) to full residential services and meals. The dominant form is the provision of long-term accommodation, typically using cottages previously used for farmworkers. Nearly a third of farms with an entry here are involved in the letting of holiday cottages or flats (usually specific modernisations or conversions), about a quarter in each of the provision of facilities for caravans or camping and in-house bed and breakfast accommodation. Specialised catering enterprises are of minor importance. The evident importance of this group of diversified activities has clear linkages with some of the findings of the recent study of structural change (Lobley et al, 2002). In particular, the widespread labour shedding has enabled more farmers to use cottages previously required for full-time staff to be put to other, more lucrative use as here.
Centre for Rural Research, University of Exeter 44
Farm Diversification in England 2002: Final Report
Table 4.12 Diversified activities included under ‘accommodation and catering’
Percent of diversified holdings
Weighted count
Unweight- ed count
Percent with
activity within
enterprise Caravan/camping site 6 4400 99 24 Holiday cottage(s) 7 5450 147 30 Rented accommodation (all year) 13 9500 227 53 Bed & Breakfast 6 4750 115 26 On-farm catering 1 750 15 4 Other 1 1000 22 6 Enterprise totals 24 18100 442 4.2.10 Equine enterprises are found on nearly a quarter of diversified holdings, and Table 4.13 sets out the range of activities included in this grouping. It includes any activity involving either the production or provision of horses, or the provision of facilities for horses. Apart from the obvious ‘horseyculture’ connection, most of these enterprises probably occupy an appreciable area of land (although some simple livery yard facilities may not be particularly land-using). More than half of the holdings grouped here provide livery facilities, 15 per cent have horse racing or stud activities and 11 per cent are involved in providing horse riding or trekking. It is likely that many of these enterprises involving horses are of a multi-faceted nature (riding, trekking, breeding, stabling, etc), thus 41 per cent recorded their equine activity as ‘other’.
Table 4.13 Diversified activities included under ‘equine enterprises’
Percent of diversified holdings
Weighted count
Unweight- ed count
Percent with
activity within
enterprise Horse riding/trekking 3 1950 45 11 Livery 13 9950 214 56 Horse racing and stud 3 2550 52 15 Horse trials 1 750 17 4 Other 10 7200 124 41 Enterprise totals 23 17650 345 4.2.11 Nearly a quarter of diversified holdings recorded having at least one activity which could be grouped as recreation and leisure services. As Table 4.14 shows, this group covers a wide range of leisure services provided using a range of farm resources, but typically involving land, woodland or water features. The major distinct types are shooting-based enterprises (on 52 per cent of these holdings) and fishing (26 per cent) but a great variety of other minor forms of recreational and educational pursuits are also covered.
Centre for Rural Research, University of Exeter 45
Farm Diversification in England 2002: Final Report
Table 4.14 Diversified activities included under ‘recreation and leisure’
Percent of diversified holdings
Weighted count
Unweight- ed count
Percent with
activity within
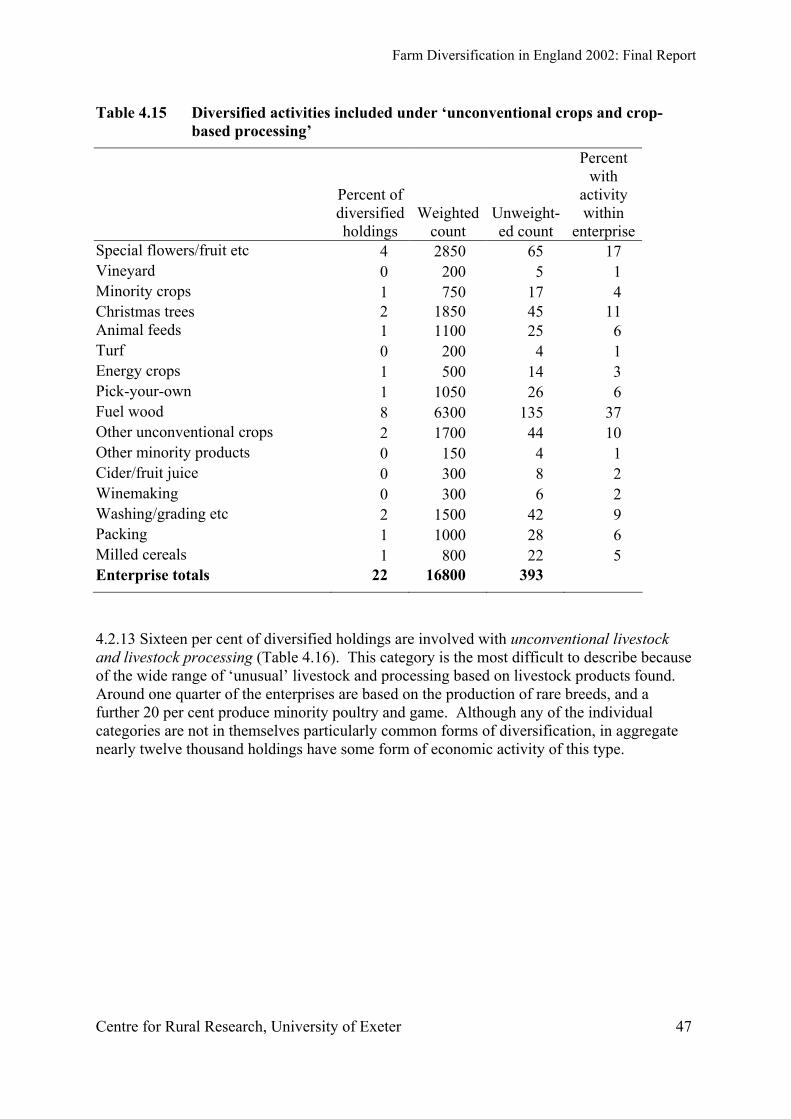
enterprise Shooting 12 9150 225 52 Motorsport 1 850 17 5 Golf 0 300 8 2 Other sport 1 700 16 4 Picnic site 2 1300 29 7 Wildlife/Trail/Museum etc 2 1750 35 10 Activity facilities 1 650 13 4 Boating 1 550 13 3 Fishing 6 4600 107 26 War games 0 350 7 2 Gliding 0 150 4 1 Educational facilities 3 2300 47 13 Other leisure 4 2950 60 17 Enterprise totals 23 17650 406 4.2.12 Overall more than one in five diversified holdings have an unconventional crop or crop-based processing activity (Table 4.15). Both this and the stock-based group (Table 4.16) frequently consist of a combination of production and processing activities, with varying degrees of emphasis placed on one or other aspect but generally linked together in a sequential system. Thus, the most sensible distinction is based on the nature of the central product. Other than the commonest activity, the sale of wood for fuel, the crop-based group predominantly contains horticultural enterprises. Production of beverages, milling and feedstuffs, arable and horticultural processing and turf are other noticeable components of a very diverse array of enterprises. Some 11 per cent of these holdings produce and sell Christmas trees.
Centre for Rural Research, University of Exeter 46
Farm Diversification in England 2002: Final Report
Table 4.15 Diversified activities included under ‘unconventional crops and crop-based processing’
Percent of diversified holdings
Weighted count
Unweight-ed count
Percent with
activity within
enterprise Special flowers/fruit etc 4 2850 65 17 Vineyard 0 200 5 1 Minority crops 1 750 17 4 Christmas trees 2 1850 45 11 Animal feeds 1 1100 25 6 Turf 0 200 4 1 Energy crops 1 500 14 3 Pick-your-own 1 1050 26 6 Fuel wood 8 6300 135 37 Other unconventional crops 2 1700 44 10 Other minority products 0 150 4 1 Cider/fruit juice 0 300 8 2 Winemaking 0 300 6 2 Washing/grading etc 2 1500 42 9 Packing 1 1000 28 6 Milled cereals 1 800 22 5 Enterprise totals 22 16800 393 4.2.13 Sixteen per cent of diversified holdings are involved with unconventional livestock and livestock processing (Table 4.16). This category is the most difficult to describe because of the wide range of ‘unusual’ livestock and processing based on livestock products found. Around one quarter of the enterprises are based on the production of rare breeds, and a further 20 per cent produce minority poultry and game. Although any of the individual categories are not in themselves particularly common forms of diversification, in aggregate nearly twelve thousand holdings have some form of economic activity of this type.
Centre for Rural Research, University of Exeter 47
Farm Diversification in England 2002: Final Report
Table 4.16 Diversified activities included under ‘unconventional livestock and livestock processing’
4.2.14 There is, inevitably, a catch-all group and Table 4.17 sets out the range of activities which have been grouped together as miscellaneous services. By virtue of the structure of the other groupings, it could be characterised as consisting of the provision of non-agricultural, non-leisure services, which is to say that they are services being provided to people other than farmers and are not aimed at the leisure market. The dominant component is the commercial letting of buildings, both short-term (35 per cent of holdings) and long-term (34 per cent of holdings); land let for sports grounds or similar recreational uses, and woodland let for diversified activities are each found on about 8 per cent of holdings in this category. Non-agricultural contract work (e.g. for local authorities) accounts for more than a quarter of these activities, with landscape gardening, pet care, and vehicle storage being other notable activities. Again, the findings of this study corroborate those of the agricultural adjustment study (Lobley et al, 2002), which found that farm restructuring often involves shifting land or buildings resources out of farming.
Centre for Rural Research, University of Exeter 48
Farm Diversification in England 2002: Final Report
Table 4.17 Diversified activities included under ‘miscellaneous services’
Percent of diversified holdings
Weighted count
Unweight-ed count
Percent with
activity within
enterprise Land let for sports ground 3 2150 44 8 Buildings let for commercial/industrial use 12 9000 216 34
Woodland let for diversified activities 3 2200 47 8
Hire of buildings 12 9150 217 35 Other land or buildings let for diversified activities 2 1400 29 5
Secretarial services 1 1100 24 4 Stone extraction/landfill 0 350 11 1 Vehicle storage 5 3850 88 15 Non-agricultural contracting 9 7050 178 27 Alternative technology 0 350 6 1 Showground 1 750 21 3 Dog/cat/breeding or kennels 2 1400 19 5 Caged birds 0 250 4 1 Other miscellaneous services 4 3350 75 13 Enterprise totals 35 26150 598 4.2.15 From Table 4.18 can be gained an impression of the distributions of multiple activities on holdings included within each of the identified ‘enterprises’. One of the problems in categorising such a diverse range of activities is the need to report as accurately and informatively as possible on the real world, without at the same time sacrificing detail or introducing distortions. Many otherwise similar farm diversifications may involve, on different farms, different combinations of activities. For example, while sheep dairying may on some farms be confined to a production enterprise, on others it may be associated with cheese making (i.e. processing activity), and retailing (through a number of different channels). 4.2.16 It is probably inevitable that, in some instances, the nomenclature of farm diversification adopted here will have divorced activities which in practice are closely linked. At the extreme, this could result in an over-estimate of the incidence of diversified activities. However, the information in Table 4.18, taken together with the preceding tables, may be interpreted as providing some confirmation that the identified ‘enterprises’ represent a reasonable estimate of the actual number of
Centre for Rural Research, University of Exeter 49
Farm Diversification in England 2002: Final Report
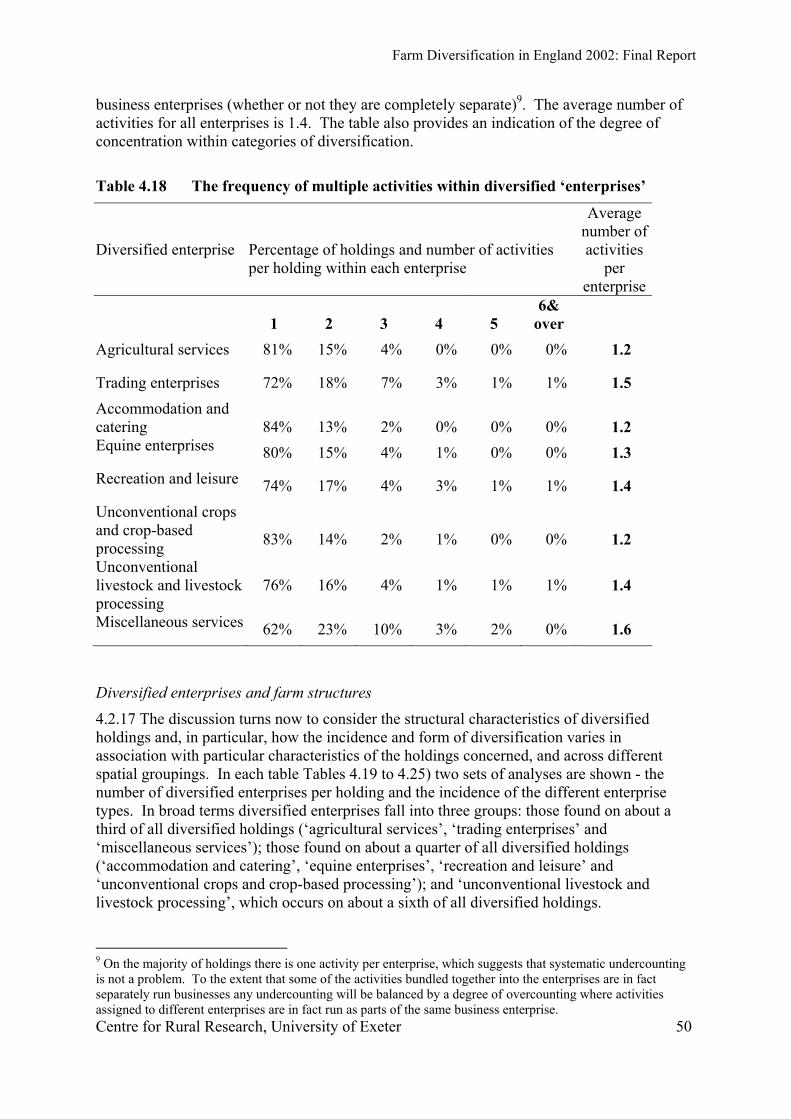
business enterprises (whether or not they are completely separate)9. The average number of activities for all enterprises is 1.4. The table also provides an indication of the degree of concentration within categories of diversification.
Table 4.18 The frequency of multiple activities within diversified ‘enterprises’
Diversified enterprise
Percentage of holdings and number of activities per holding within each enterprise
4.2.17 The discussion turns now to consider the structural characteristics of diversified holdings and, in particular, how the incidence and form of diversification varies in association with particular characteristics of the holdings concerned, and across different spatial groupings. In each table Tables 4.19 to 4.25) two sets of analyses are shown - the number of diversified enterprises per holding and the incidence of the different enterprise types. In broad terms diversified enterprises fall into three groups: those found on about a third of all diversified holdings (‘agricultural services’, ‘trading enterprises’ and ‘miscellaneous services’); those found on about a quarter of all diversified holdings (‘accommodation and catering’, ‘equine enterprises’, ‘recreation and leisure’ and ‘unconventional crops and crop-based processing’); and ‘unconventional livestock and livestock processing’, which occurs on about a sixth of all diversified holdings.
Centre for Rural Research, University of Exeter 50
9 On the majority of holdings there is one activity per enterprise, which suggests that systematic undercounting is not a problem. To the extent that some of the activities bundled together into the enterprises are in fact separately run businesses any undercounting will be balanced by a degree of overcounting where activities assigned to different enterprises are in fact run as parts of the same business enterprise.
Farm Diversification in England 2002: Final Report
4.2.18 The first such analysis, shown in Table 4.19, looks at the distribution of enterprises by farm business size. The provision of agricultural services as a form of diversification is positively correlated with business size, with 58 per cent of ‘very large’ holdings involved. While most of the other enterprises do not show clear patterns in relation to business size, there is evidence that for a number of enterprise types farms in the largest one or two categories appear to be more diversified than smaller units. This applies for ‘accommodation and catering’, ‘recreation and leisure’ and ‘unconventional crops and crop-based processing’. Furthermore, ‘very large’ farms are more likely to be multiply-diversified with four or more enterprises. These results are entirely consistent with recent work on agricultural restructuring (Lobley et al, 2002).
Table 4.19 Distribution of diversified enterprises by size of farm business
Very small
Small
Medium
Large
Very large
All
Unweighted count 285 577 464 248 141 1715 Enterprise Percent of diversified holdings Agricultural servs. 19 36 48 47 58 35 Trading ents. 27 41 32 28 31 32 Accom. and cater. 19 24 26 31 32 24 Equine ents. 31 21 17 19 22 23 Rec’n. and leisure 21 20 22 29 50 23 Crop-based 20 25 21 20 34 22 Livestock-based 18 19 11 9 13 16 Misc servs. 34 31 33 39 5 35 No. of enterprises Percent of diversified holdings One 50 39 42 38 27 43 Two 24 29 28 30 21 27 Three 16 18 16 15 16 16 Four or more 9 14 14 17 36 14 Average per diversified holding
1.9
2.2
2.1
2.2
2.9
2.1
4.2.19 Analyses of diversification enterprises by farm type are given in Tables 4.20. Some farm types are more likely than average to have several enterprises (cereals, general cropping, pigs and poultry and mixed types) although the causes vary by type. Arable farming systems are much more involved in the provision of ‘agricultural services’, ‘recreation and leisure’ and ‘miscellaneous services’; pigs and poultry and mixed types have more trading and livestock based enterprises. Dairy and hill livestock farms, if diversified, are far more likely than average to have only one or two diversified enterprises.
Centre for Rural Research, University of Exeter 51
Farm Diversification in England 2002: Final Report
Table 4.20 Distribution of diversified enterprises by robust farm type
Cereals
General cropping
Horti-culture
Pigs & poultry
Dairy
Unweighted count 417 175 137 69 213 Enterprise Percent of diversified holdings Agricultural servs. 49 54 12 27 42 Trading ents. 36 35 50 52 25 Accom. and cater. 23 23 13 18 26 Equine ents. 24 24 6 14 9 Rec. and leisure 30 28 12 19 20 Crop-based 20 34 68 17 13 Livestock-based 10 12 9 45 13 Misc servs. 52 39 22 35 21 No. of enterprises Percent of diversified holdings One 33 32 46 36 55 Two 25 30 30 31 29 Three 22 13 14 15 11 Four or more 20 25 10 17 6 Average per diversified holding
2.4
2.5
1.9
2.3
1.7
Table 4.20 cont/ Distribution of diversified enterprises by robust farm type
Cattle & sheep (LFA)
Cattle & sheep
(Lowland)
Mixed
Other types
All enterprises
Unweighted count 122 235 190 157 1715 Enterprise Percent of diversified holdings Agricultural servs. 31 39 38 22 35 Trading ents. 28 32 43 21 32 Accom. and cater. 34 33 27 21 24 Equine ents. 7 18 17 44 23 Rec. and leisure 14 20 26 24 23 Crop-based 13 16 26 15 22 Livestock-based 19 20 23 14 16 Misc servs. 19 26 36 35 35 No. of enterprises Percent of diversified holdings One 59 42 31 50 43 Two 23 31 34 21 27 Three 13 14 17 18 16 Four or more 5 13 18 11 14 Average per diversified holding
1.7
2.0
2.3
2.0
2.1
Centre for Rural Research, University of Exeter 52
Farm Diversification in England 2002: Final Report
4.2.20 The pattern of diversification by land tenure class is explored in Table 4.21. Perhaps surprisingly it is difficult to see many clear differences according to tenure, nor indeed any distinctive patterns, except that holdings with some tenanted land do seem to be more likely to be involved with the provision of agricultural services. Almost certainly this is linked more strongly with farm type than with tenure but, as it stands, about half of tenanted or mixed tenure farms are involved with this form of diversification, compared with little more than a quarter of wholly owned farms. Mixed tenure farms average rather more enterprises per farm than either wholly owned or wholly tenanted units.
Table 4.21 Distribution of diversified enterprises by land tenure
Wholly owned
Mainly owned
Mainly tenanted
Wholly tenanted
All enterprises
Unweighted count 933 323 193 266 1715 Enterprise Percent of diversified holdings Agricultural servs. 27 50 50 47 35 Trading ents. 31 32 34 36 32 Accom. and cater. 25 27 18 21 24 Equine ents. 26 14 25 21 23 Rec. and leisure 24 25 21 22 23 Crop-based 22 22 26 20 22 Livestock-based 17 12 12 16 16 Misc servs. 34 44 37 27 35 No. of enterprises Percent of diversified holdings One 44 38 38 43 43 Two 26 27 29 28 27 Three 17 15 17 14 16 Four or more 12 19 16 15 14 Average per diversified holding
2.1
2.3
2.2
2.1
2.1
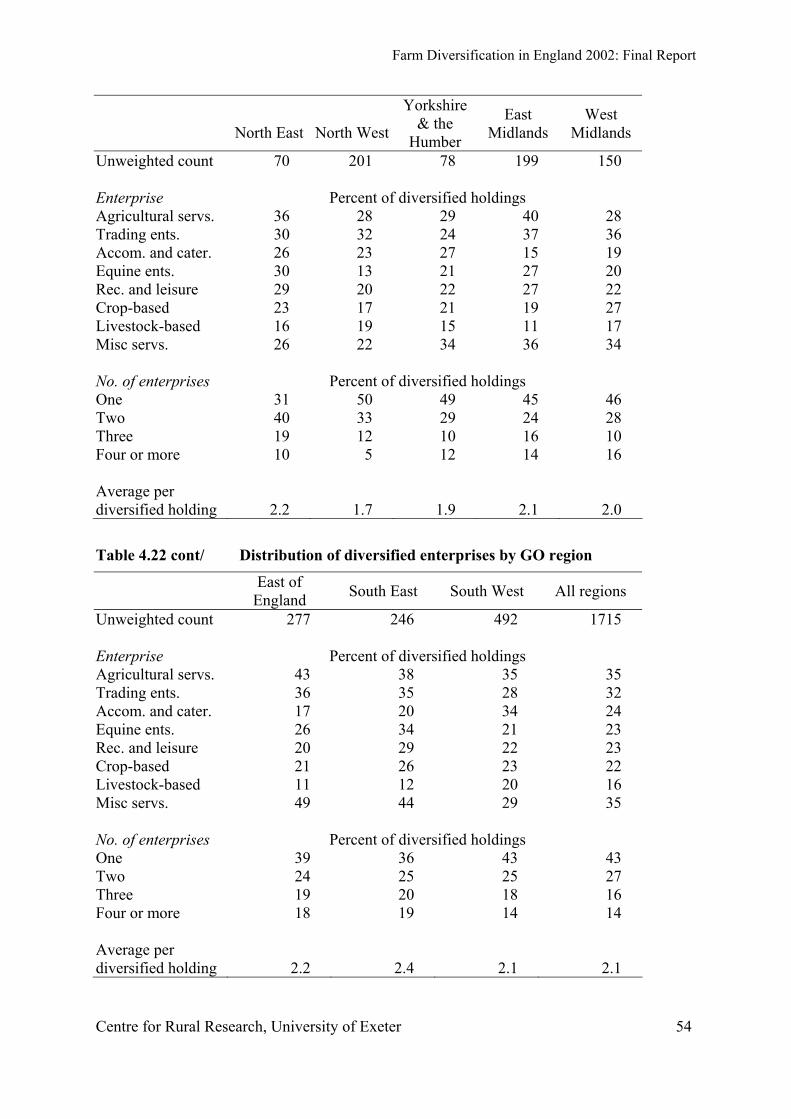
4.2.21 The regional analyses based on GO regions (Tables4.22) throw up some interesting findings of clear regional differences on diversified holdings, the focus here. In the East and South East regions, and also in the North East, diversified holdings are likely to have more enterprises per holding than average, while the North West and Yorkshire/Humber average fewer. Regional strengths in diversification, if that is an appropriate way to look at these data, are fascinating though necessarily rather broad-brush. ‘Agricultural services’ and ‘trading’ are more common forms of diversification in the East, East Midlands and South East; the South West has a clear lead in ‘accommodation and catering’; the South East and the North East and, less obviously, the East Midlands, lead in the incidence of ‘equine’ and ‘recreation and leisure’ enterprises on diversified holdings; the South East has proportionately more ‘crops-based’ enterprises while ‘livestock-based enterprises are more common on diversified holdings in the South West and North West; ‘miscellaneous services are much more likely to be found on diversified holdings in the South East and East. Further analyses by GO region are given in Appendix G.
Table 4.22 Distribution of diversified enterprises by GO region
Centre for Rural Research, University of Exeter 53
Farm Diversification in England 2002: Final Report
North East
North West
Yorkshire & the
Humber
East Midlands
West Midlands
Unweighted count 70 201 78 199 150 Enterprise Percent of diversified holdings Agricultural servs. 36 28 29 40 28 Trading ents. 30 32 24 37 36 Accom. and cater. 26 23 27 15 19 Equine ents. 30 13 21 27 20 Rec. and leisure 29 20 22 27 22 Crop-based 23 17 21 19 27 Livestock-based 16 19 15 11 17 Misc servs. 26 22 34 36 34 No. of enterprises Percent of diversified holdings One 31 50 49 45 46 Two 40 33 29 24 28 Three 19 12 10 16 10 Four or more 10 5 12 14 16 Average per diversified holding
2.2
1.7
1.9
2.1
2.0
Table 4.22 cont/ Distribution of diversified enterprises by GO region
East of England South East South West All regions
Unweighted count 277 246 492 1715 Enterprise Percent of diversified holdings Agricultural servs. 43 38 35 35 Trading ents. 36 35 28 32 Accom. and cater. 17 20 34 24 Equine ents. 26 34 21 23 Rec. and leisure 20 29 22 23 Crop-based 21 26 23 22 Livestock-based 11 12 20 16 Misc servs. 49 44 29 35 No. of enterprises Percent of diversified holdings One 39 36 43 43 Two 24 25 25 27 Three 19 20 18 16 Four or more 18 19 14 14 Average per diversified holding
2.2
2.4
2.1
2.1
Centre for Rural Research, University of Exeter 54
Farm Diversification in England 2002: Final Report
4.2.22 A final analysis of diversification and aspects of farm structure is shown in Table 4.23, which looks at the distributions of enterprises for farms inside and outside, respectively, an LFA and a National Park. Diversified farms outside either designated area are more likely to have more enterprises, although there is evidence of a strata of multiply-diversified holdings within both LFAs and National Parks. Diversified holdings in the LFAs are more likely than their non-LFA counterparts to have an ‘accommodation and catering’ or ‘livestock-based’ enterprise; the equivalent strengths in a National Park context are ‘accommodation and catering’ and ‘recreation and leisure’. None of these findings will be regarded as surprising but, particularly in a National Park context, they do reinforce the relationship between opportunities in the wider rural economy and the apparent vitality of farm diversification.
Table 4.23 Distribution of diversified enterprises by LFA and National Park status
LFA
Non-LFA
National Park
Non- National
Park
All enterprises
Unweighted count 201 1514 78 1637 1715 Enterprise Percent of diversified holdings Agricultural servs. 30 36 24 36 35 Trading ents. 31 33 20 33 32 Accom. and cater. 31 23 36 23 24 Equine ents. 9 25 19 24 23 Rec. and leisure 19 24 31 23 23 Crop-based 17 23 15 23 22 Livestock-based 22 15 17 16 16 Misc servs. 18 37 20 35 35 No. of enterprises Percent of diversified holdings One 51 41 54 42 43 Two 31 26 28 27 27 Three 12 17 8 17 16 Four or more 6 15 11 14 14 Average per diversified holding
1.8 2.2 1.8 2.1 2.1
4.2.23 Because there has been, inevitably, a degree of overlap in some of the foregoing analyses, it is useful to summarise what this section of the analyses of diversification has shown in terms of the diversified enterprises: • The incidence of agricultural services increases with farm business size from 19 per cent
on ‘very small’ holdings to 58 per cent on ‘very large’. Not surprisingly this enterprise features particularly strongly on cereals and general cropping farm types and hence it is relatively prevalent in the East and South East regions.
Centre for Rural Research, University of Exeter 55
Farm Diversification in England 2002: Final Report
• The most striking thing about the trading enterprises is their markedly higher prevalence
on diversified horticultural and pigs & poultry holdings, which may be connected with the higher incidence of crop-based and livestock-based enterprises on these farm types (at 68 per cent and 45 per cent respectively).
• Accommodation and catering enterprises again occur more frequently with increasing
farm size. They are relatively prevalent on diversified cattle and sheep holdings and diversified holdings in the South West region, and also in the LFAs and National Parks (all of which are clearly interrelated).
• Equine enterprises probably have the strongest association with farm type, featuring on
44 per cent of diversified ‘other types’ holdings but on less than ten per cent of diversified horticultural, dairy and hill livestock holdings. They are relatively more common on diversified ‘very small’ holdings.
• Interestingly, half of all diversified ‘very large’ farms have recreation and leisure
enterprises, more than twice the all farms average. These enterprises are relatively scarce on diversified horticultural and hill livestock holdings.
• The relative incidence of miscellaneous services may well be most closely related to the
likely availability of, and demand for, surplus farm buildings for non-agricultural use. This would correspond with the relatively high incidence of these enterprises on diversified cereal and general cropping farm types and on diversified holdings in the East and South East regions. They are, of course, well represented on diversified ‘very large’ farms.
4.2.24 A further observation is that the relative number of diversified enterprises per holding may give a good indication of the extent to which farm businesses have adopted diversification as a business strategy. This indicator seems to mirror fairly closely the incidence of diversification for the various groupings, so that groups with relatively low rates of diversification also tend to have a relatively low average number of enterprises per holding. Particularly distinctive in this regard are the ‘very large’ holdings, which average nearly three diversified enterprises each and with more than a third running four or more. 4.2.25 As a final view of diversification in relation to structural aspects of the industry, Tables 4.24 and 4.25 set out ‘reversed’ versions of the farm business size and farm type analyses above, in that they show how each enterprise is distributed across the industry. For example, it can be seen that ‘9 per cent of agricultural services enterprises are found on very large holdings’ as distinct from ’58 per cent of (diversified) very large holdings have an agricultural services enterprise’ (which can be found in Table 4.17). 4.2.26 These additional analyses help to provide a fuller understanding of the nature and role of farm diversification in England at the present time. One important reminder in terms of context is that ‘very small’ holdings and ‘other types’ holdings (two categories with a great deal of overlap), although relatively lightly diversified do in fact account for a significant proportion of most types of diversified enterprise, simply because of the sheer weight of their numbers. By the same token, although very heavily diversified per se, ‘very large’ holdings
Centre for Rural Research, University of Exeter 56
Farm Diversification in England 2002: Final Report
are numerically small and therefore account for only a relatively small proportion of each diversified enterprise type.
Table 4.24 Distribution of diversified enterprises by farm business size
Agric. servs.
Trad-ing ents.
Accom. & cater.
Equine ents.
Rec. and
leisure
Crops-based
Live-stock based
Misc. servs.
Percentage of all enterprises Very small 18 28 26 44 30 30 39 32 Small 30 36 29 26 25 32 35 26 Medium 2 21 23 15 20 20 15 20 Large 14 9 14 9 13 10 6 12 Very large 9 5 8 5 12 9 5 9 Totals 100 100 100 100 100 100 100 100
Table 4.25 Distribution of diversified enterprises by robust farm type
4.3.1 The postal survey explored briefly the disposal of formerly agricultural assets – farmland and farm buildings – and the principal motives for such sales. In the context of a study of farm diversification, it may be expected that one of the constraints facing farmers wishing to establish a new (diversified) enterprise is a shortage of capital for investment, particularly since additional external borrowings will adversely affect the financial strength of the business. Disposal of unwanted assets or, at least, assets which are not crucial to the continuation of the business, represents a potentially useful way of providing a cash injection to fund, or part fund, a new business venture of this sort. The aim was to find out to what extent disposal of fixed assets may be associated with farm diversification.
Centre for Rural Research, University of Exeter 57
Farm Diversification in England 2002: Final Report
4.3.2 Tables 4.26 and 4.27 summarise the survey findings. First, it is clear that diversified holdings are more likely to have disposed of land or building assets than non-diversified holdings, this finding applying consistently for both land and buildings. In total 7 per cent of diversified holdings had sold land or buildings compared with only 3 per cent of non-diversified holdings. The biggest category of ‘end user’ of these former assets was housing, followed by recreational purposes and then industry. However, 16 per cent of cases the end use was recorded as other, which may include further use for agriculture or anther land-based function; indeed, it would be very unlikely if some of the land, at least, were not retained in agriculture.
Table 4.26 Proportion of holdings recording sales of land or buildings
All holdings Diversified Not diversified
Any land or buildings 5.5% 7.4% 2.7% Any land 4.4% 5.9% 2.4% Any buildings 2.1% 3.0% 0.8%
Table 4.27 Post disposal uses of land and buildings sold off
Land Buildings
Housing 39% 88% Recreation 23% 1% Tourism 2% 2% Industry 12% 4% Woodland 8% Other 16% 4% 4.3.3 Unfortunately the constraints of the postal questionnaire precluded any realistic possibility of establishing with certainty the nature of the linkage between diversification and asset disposal of this sort. Consequently, it cannot be concluded either that the opportunity for asset disposal made the diversification a realistic possibility, or whether the need for cash to establish or expand the diversified enterprise was a driving force in seeking the asset sales. Even so, the existence of a positive association has been established and the injection of cash into a farm business from such a sale will clearly have been a potentially important factor in the process of diversifying. The role of grant aid in diversification
4.3.4 The postal questionnaire also addressed the issue of grant assistance for diversification. There have been two major funding schemes under which grants for diversified enterprises have been available, but quite a number of smaller, more specialised schemes. As discussed shown in Chapter 2 grants for diversification projects have been available under the Farm Diversification Grants Scheme in the late 1980s and various schemes under the Rural Development Regulation and European Programmes such as Objective 5b and the current Objective 1.
Centre for Rural Research, University of Exeter 58
Farm Diversification in England 2002: Final Report
4.3.5 However, the survey found that a little over five percent of all diversified holdings had received grant aid in setting up their diversified activities, indicating that the process of agricultural diversification has not been significantly shaped by the strictures of obtaining grant aid. This figure excludes the woodland grant schemes and also various agri-environmental schemes which are recorded under ‘other’. The two principal national grant schemes for diversification, had been received by approximately equal numbers of respondents, while other schemes were of much less significance (Table 4.28).
Table 4.28 Sources of grant aid for farm diversification
Percentage of grants cited
Percentage of holding receiving
grants Farm Diversification Grant Scheme 31% 35% Rural Enterprise Scheme 31% 35% Processing and Marketing Grant Scheme 9% 10% Local Authority scheme 8% 9% Tourist Board grant 6% 6% FMD recovery 5% 6% Energy Crops Scheme 5% 5% Farm Business Non-Capital Grants Scheme 3% 3% Objective 5b 2% 3% Other 5% 5% 4.3.6 In Table 4.29 the proportional significance of grant aid received by size of business is examined. Partly because of their numerical significance, one third of all holdings receiving grant aid were classed as ‘very small’, with the proportional distributions declining in inverse proportion to business size. In terms of the share of the total grant aid received nearly a third went to holdings in each of the ‘small’ and ‘medium’ size groups. When the recipient holdings are considered in relation to their peers, however, it is seen that larger holdings did proportionately better, with about one in twelve of all diversified holdings in the ‘medium’, ‘large’ and ‘very large’ groups receiving at least some grant aid.
Table 4.29 Proportional significance of grant aid by size of business
Proportion of all diversified holdings
Proportion of total grant aid received
Percentage in group grant aided
Very small 33% 15% 2% Small 29% 30% 5% Medium 21% 31% 8% Large 11% 14% 7% Very large 6% 9% 8% All holdings 100% 100% 5%
Centre for Rural Research, University of Exeter 59
Farm Diversification in England 2002: Final Report
Centre for Rural Research, University of Exeter 60
4.3.7 Finally, Table 4.30 looks at the distribution of grant aid in relation to the diversified enterprises on the farms. Since the majority of diversified holdings have more than one enterprise it is not really possible to ascribe grant aid to a specific enterprise but there is a broad indication that ‘accommodation and catering’ enterprises have featured more strongly than average.
Table 4.30 The incidence of grant aid by diversified enterprise