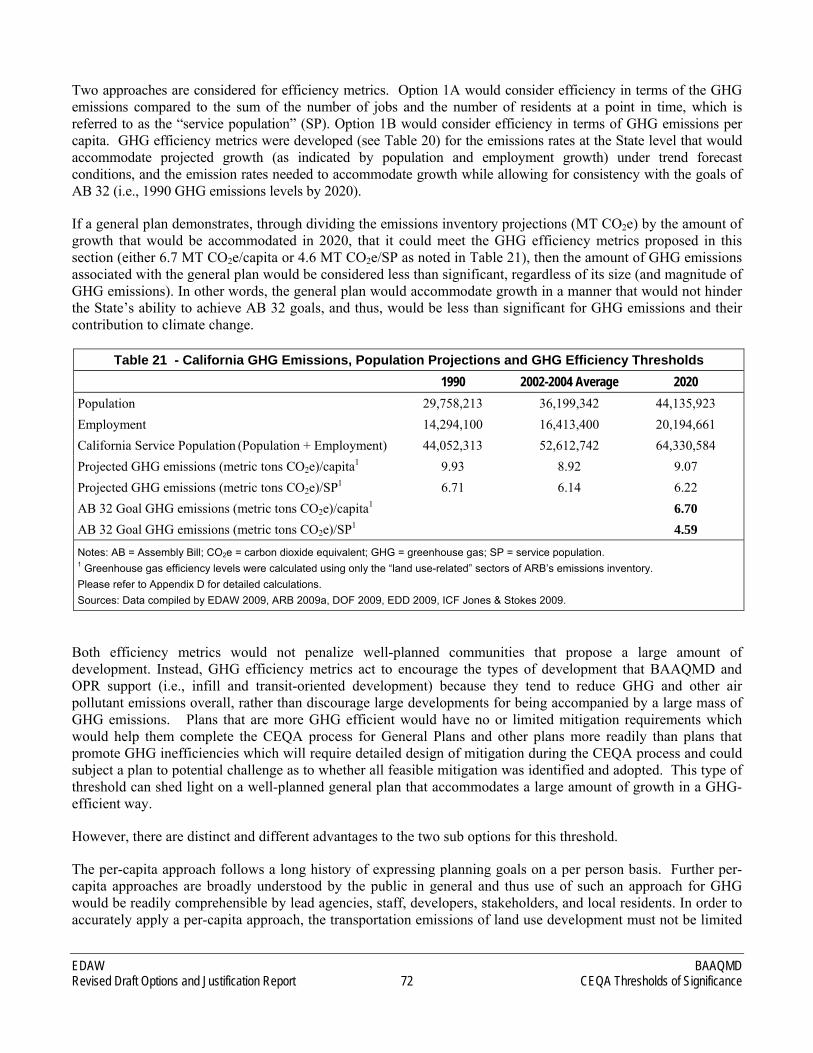
Technical Assistance: EDAW 2022 J Street Sacramento, CA 95811 Contact: Honey Walters Associate Principal (916) 414-5800 With Support from: ICF Jones & Stokes Rich Walter, Principal 510-433-8962 October 2009 Revised Draft Options and Justification Report California Environmental Quality Act Thresholds of Significance Project Manager: Greg Tholen Principal Environmental Planner (415) 749-4954 Bay Area Air Quality Management District 939 Ellis Street San Francisco, CA 94109 P 08110224.01
Transcript
Technical Assistance:
EDAW2022 J Street
Sacramento, CA 95811
Contact:
Honey WaltersAssociate Principal
(916) 414-5800
With Support from:
ICF Jones & StokesRich Walter, Principal
510-433-8962
October 2009
Revised Draft Options and Justification Report
California Environmental Quality ActThresholds of Significance
2 Introduction ....................................................................................................................................................9 2.1 BAAQMD/CEQA Regulatory Authority................................................................................................9 2.2 Justification for Updating CEQA Thresholds.......................................................................................10 2.3 SFBAAB Air Quality Designations......................................................................................................10 2.4 Emissions Nomenclature ......................................................................................................................13 2.5 A Review of California Air District’s Approaches to Air Quality Thresholds.....................................13
3 Analysis to support new threshold development .......................................................................................16 3.1 CAA/CCAA & New Source Review....................................................................................................16 3.2 Analysis of Bay Area Growth and Emission Forecasts ........................................................................17
Appendices A CEQA Thresholds of Significance Used by Other California Air Districts B Development Projections and URBEMIS Modeling C Criteria Air Pollutant Emissions Modeling and Threshold Sensitivity Analysis D BAAQMD and ARB GHG Emissions Inventory Data E GHG Emissions Modeling and Threshold Sensitivity Analysis F TAC Unweighted Cancer Risk G TAC Population-Weighted Cancer Risk
Exhibits Exhibit 1: Example Derivation from BAAQMD Single-Family Residential Development Projections .................20
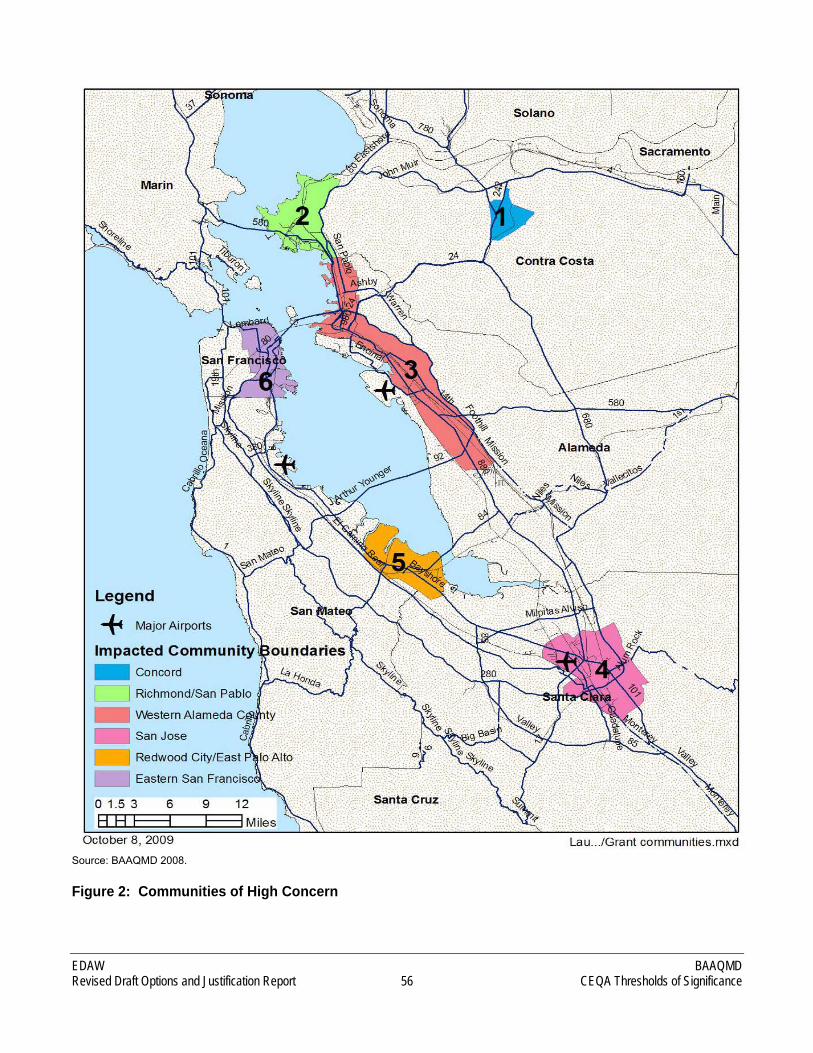
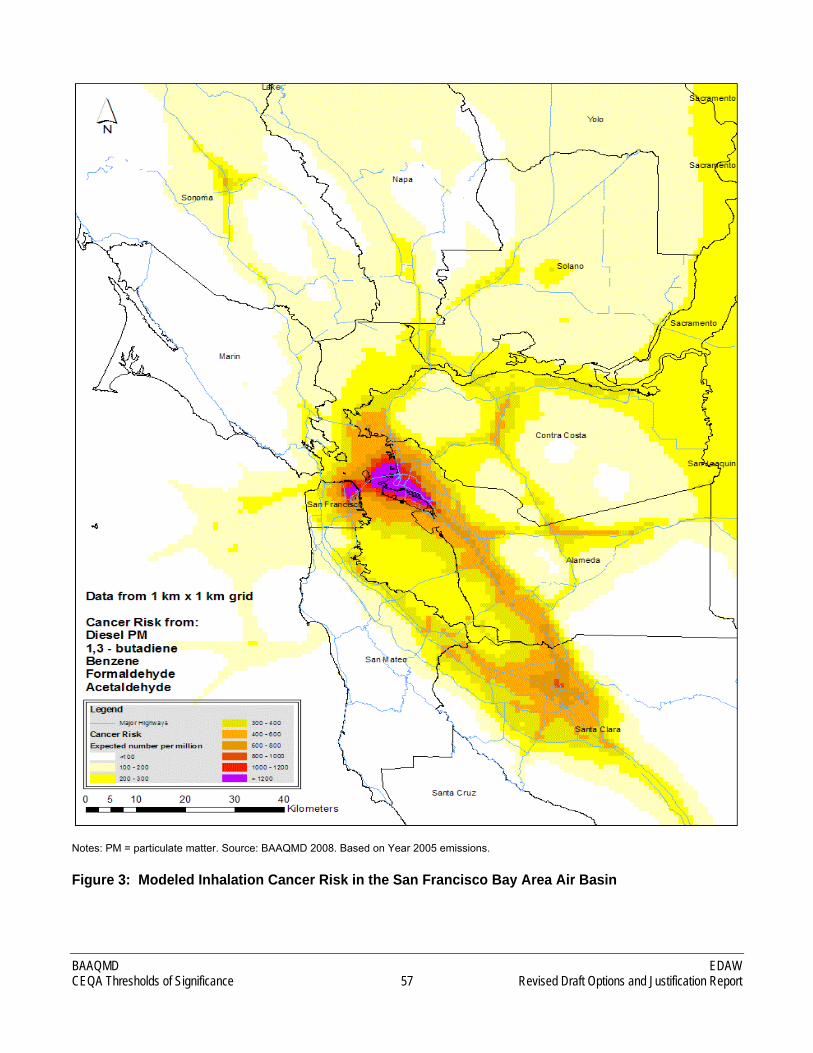
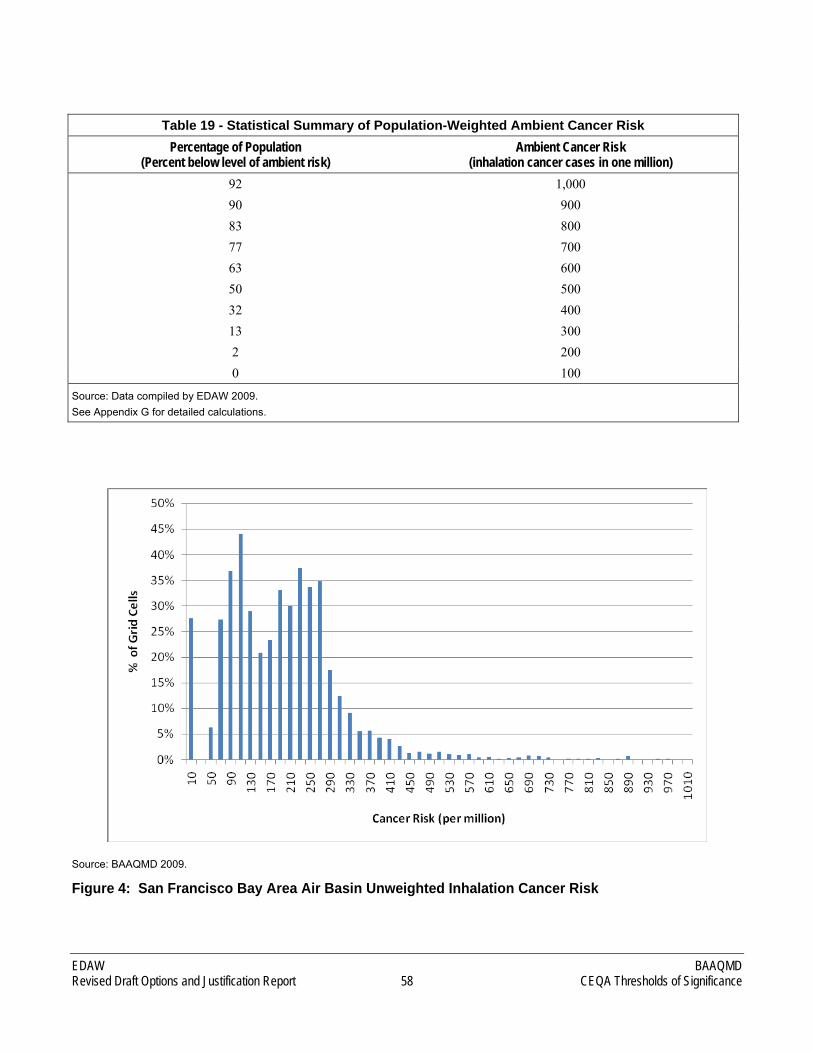
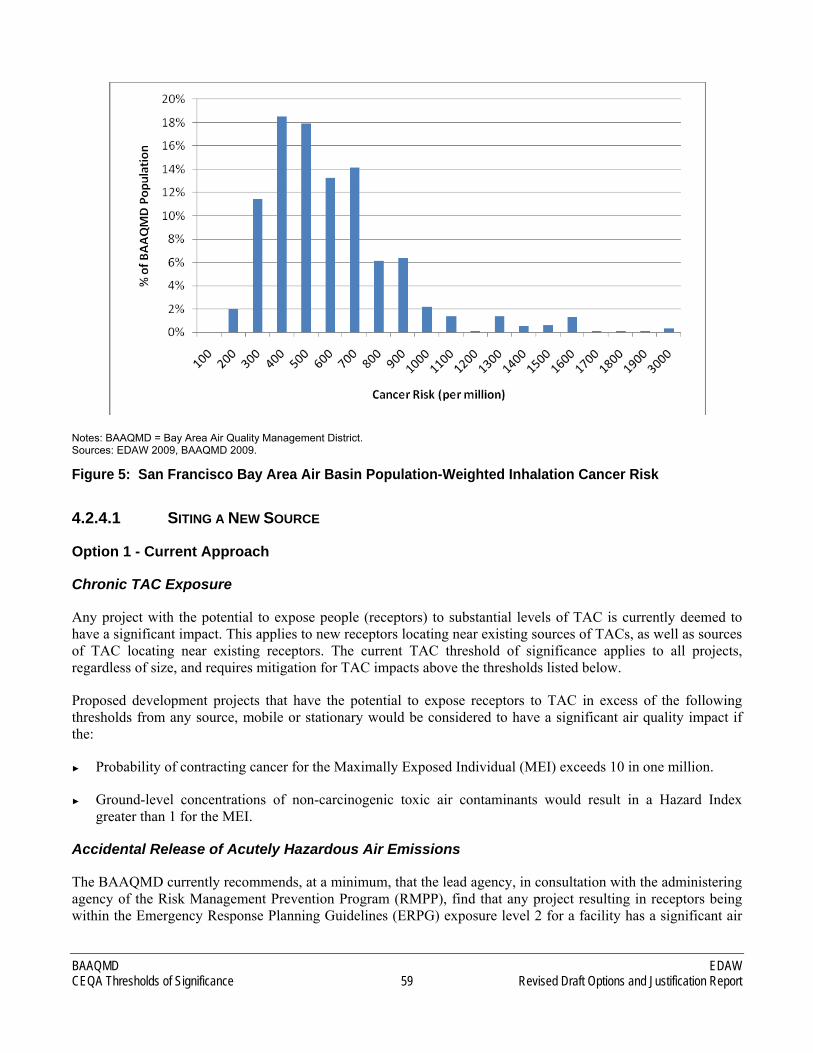
Figures Figure 1: Natural Gas Combustion Emissions from Stationary Sources in the SFBAAB ......................................51 Figure 2: Communities of High Concern ................................................................................................................56 Figure 3: Modeled Inhalation Cancer Risk in the San Francisco Bay Area Air Basin............................................57 Figure 4: San Francisco Bay Area Air Basin Unweighted Inhalation Cancer Risk ................................................58 Figure 5: San Francisco Bay Area Air Basin Population-Weighted Inhalation Cancer Risk..................................59
BAAQMD EDAW CEQA Thresholds of Significance i Revised Draft Options and Justification Report
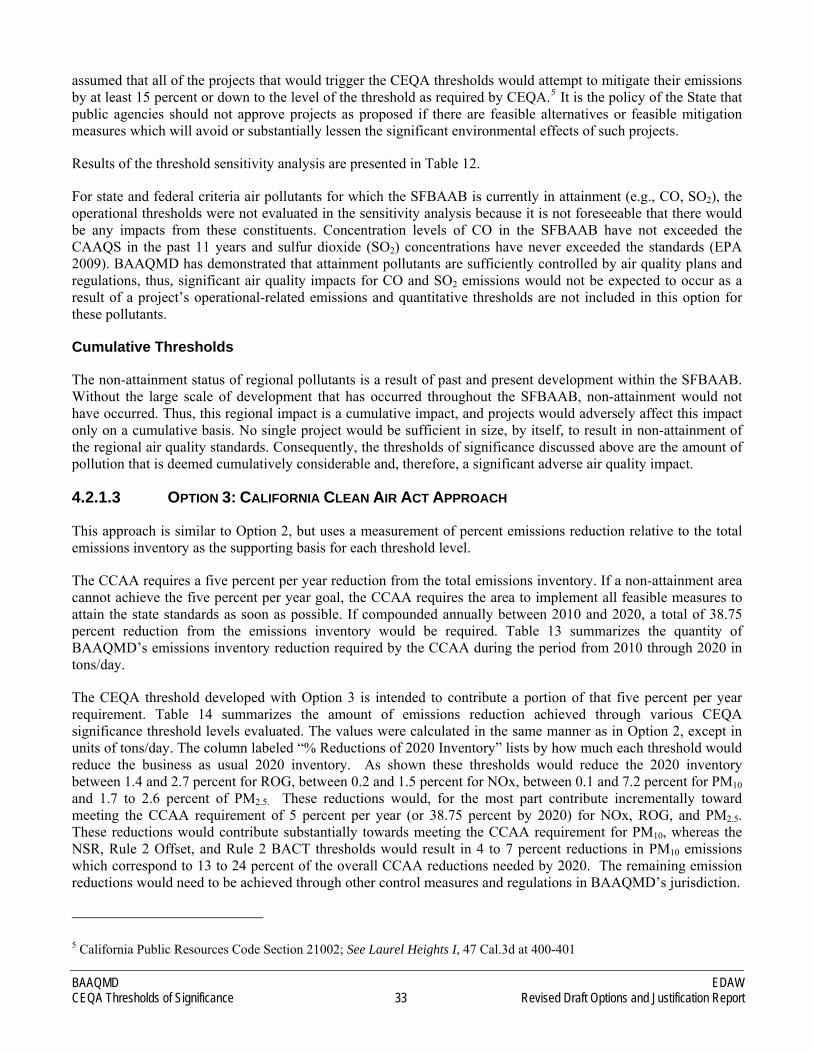
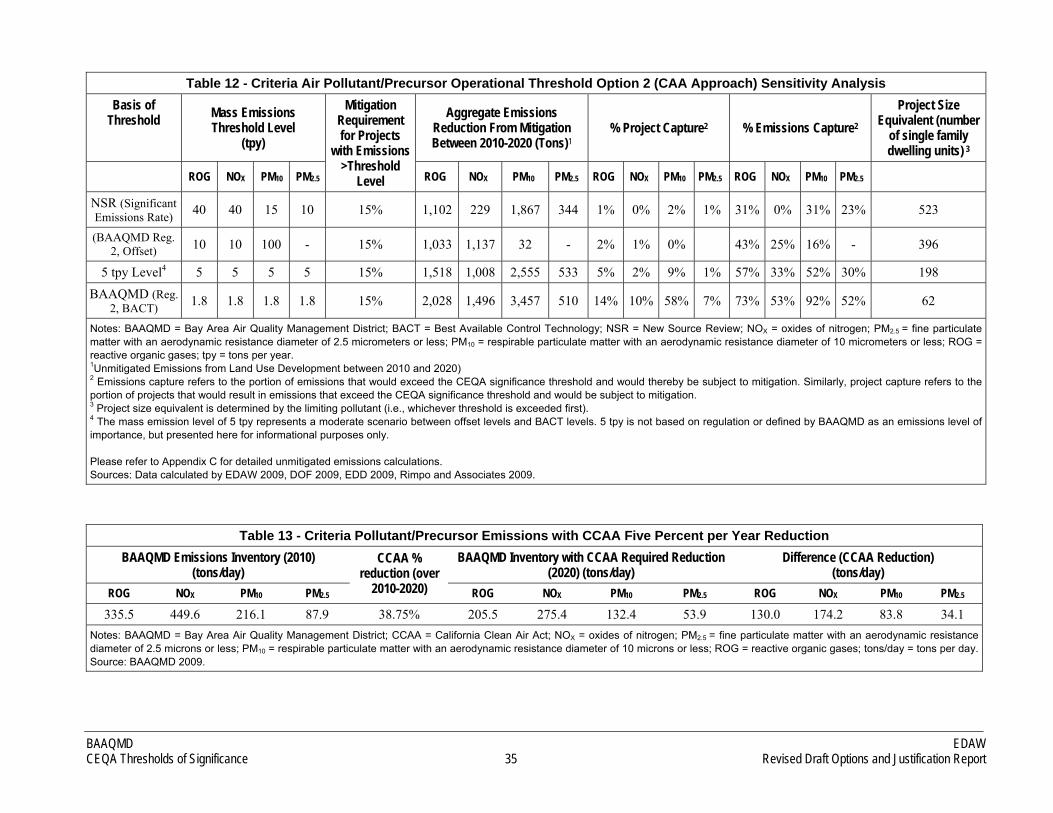
Tables Table 1 - Staff-Recommended CEQA Thresholds of Significance............................................................................7 Table 2 - Ambient Air Quality Standards and Designations, San Francisco Bay Area Air Basin ...........................11 Table 3 – New Source Review Criteria Pollutant/Precursor Significant Emission Rates ........................................16 Table 4 – Criteria Air Pollutant/Precursor BACT and Offset Emissions Levels .....................................................17 Table 5 - Unmitigated Criteria Pollutant/Precursor Emissions Subject to CEQA in the Basin ...............................21 Table 6 - CEQA Threshold Options for Project Construction Emissions ................................................................22 Table 7 - CEQA Threshold Options for Operational Emissions ..............................................................................23 Table 8 - Criteria Air Pollutant/Precursor Construction Threshold Option 2 (CAA Approach)..............................26 Table 9 - Historical Bay Area Construction Site-Related Odor Complaints............................................................30 Table 10 - Criteria Air Pollutant/Precursor Operational Threshold Option 1 (Current Practice).............................31 Table 11 - Criteria Air Pollutant/Precursor Operational Threshold Option 2 (CAA Approach)..............................32 Table 12 - Criteria Air Pollutant/Precursor Operational Threshold Option 2 (CAA Approach)
Sensitivity Analysis ..................................................................................................................................35 Table 13 - Criteria Pollutant/Precursor Emissions with CCAA Five Percent per Year Reduction..........................35 Table 14 - Criteria Air Pollutant/Precursor Operational Threshold Option 3 (CCAA Approach) Sensitivity
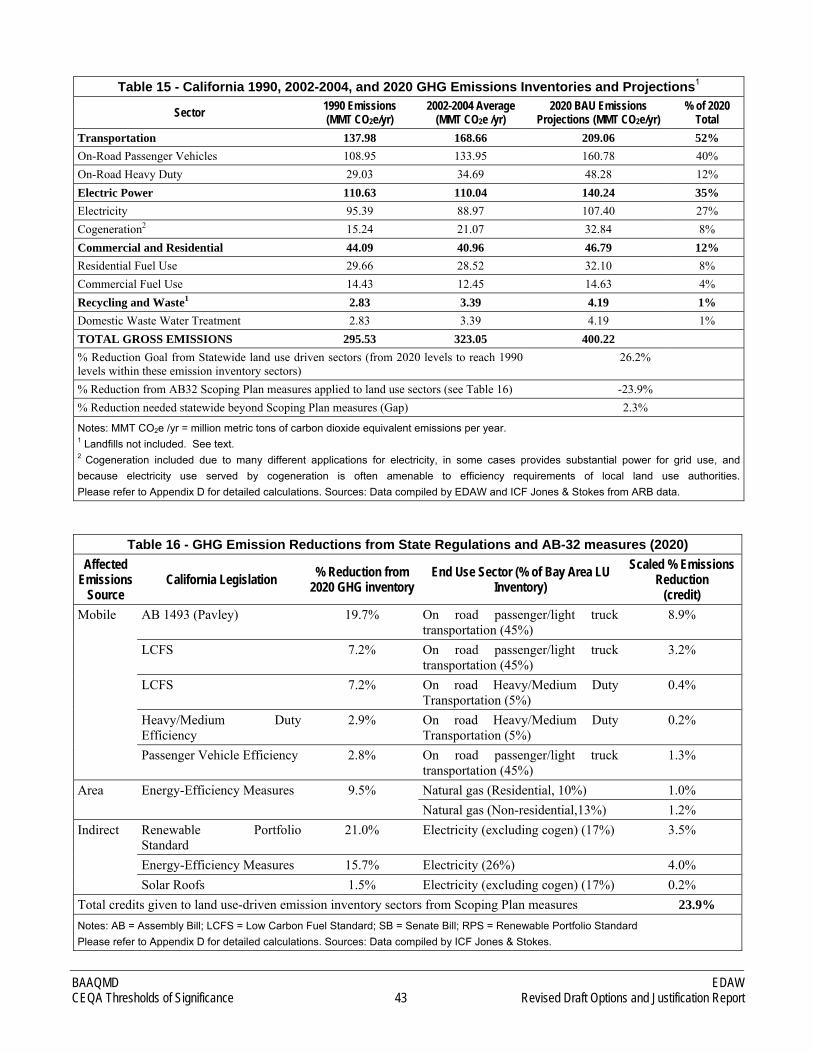
Analysis ....................................................................................................................................................36 Table 15 - California 1990, 2002-2004, and 2020 GHG Emissions Inventories and Projections1...........................43 Table 16 - GHG Emission Reductions from State Regulations and AB-32 measures (2020) .................................43 Table 17 - Basin 1990, 2007, and 2020 GHG Emissions Inventories and Projections ............................................44 Table 18 - Operational GHG Threshold Option 1A/1B/1C Sensitivity Analysis.....................................................47 Table 19 - Statistical Summary of Population-Weighted Background Cancer Risk................................................58 Table 20 - BAAQMD Screening Distances for Potential Odor Sources..................................................................69 Table 21 - California GHG Emissions, Population Projections and GHG Efficiency Thresholds..........................72
EDAW BAAQMD Draft Options and Justification Report ii CEQA Thresholds of Significance
ACRONYMS AND ABBREVIATIONS
µg/m3 micrograms per cubic meter AB State of California Assembly Bill ABAG Association of Bay Area Governments APS Alternative Planning Strategy AQP air quality plan ARB California Air Resources Board BAAQMD Bay Area Air Quality Management District BACT Best Available Control Technology BMP Best Management Practices BAU Business as Usual CAA federal Clean Air Act CAAQS California Ambient Air Quality Standards CAP climate action plan CAPCOA California Air Pollution Control Officers Association CARE Community Air Risk Evaluation CCAA California Clean Air Act CEQA California Environmental Quality Act CFR Code of Federal Regulations CH4 methane CO carbon monoxide CO2 carbon dioxide CO2e carbon dioxide equivalent DOF California Department of Finance EDD California Economic Development Department EIR Environmental Impact Report EPA U.S. Environmental Protection Agency ERPG Emergency Response Planning Guidelines GBC California Green Building Code GHG greenhouse gas GPA general plan amendment HAP hazardous air pollutants IS/MND Initial Study/Mitigated Negative Declaration lb/day pounds per day LCFS Low Carbon Fuel Standard LOS level of service MDAQMD Mojave Desert Air Quality Management District
BAAQMD EDAW CEQA Thresholds of Significance iii Revised Draft Options and Justification Report
MEI Maximally Exposed Individual MMT million metric tons MMT/yr million metric tons per year MPO Metropolitan Planning Organization MT metric tons N2O nitrous oxide NAAQS National Ambient Air Quality Standards NAICS North American Industry Classification System NOE Notice of Exemption NOX oxides of nitrogen NSR New Source Review OPR Governor’s Office of Planning and Research
PM10respirable particulate matter with an aerodynamic resistance diameter of 10 micrometers or less
PM2.5fine particulate matter with an aerodynamic resistance diameter of 2.5 micrometers or less
PM particulate matter ppm parts per million PSD Prevention of Significant Deterioration RMPP Risk Management Prevention Program ROG reactive organic gases RTP Regional Transportation Plan SB Senate Bill SCH California State Clearinghouse SCS Sustainable Communities Strategy sf square feet SFBAAB San Francisco Bay Area Air Basin SMAQMD Sacramento Metropolitan Air Quality Management District SO2 sulfur dioxide TACs toxic air contaminants T-BACT Toxic Best Available Control Technology TBPs Toxic Best Practices TCMs transportation control measures tons/day tons per day tpy tons per year UNFCCC United Nations Framework Convention on Climate Change URBEMIS Urban Emissions Model VCAPCD Ventura County Air Pollution Control District VMT vehicle miles traveled
EDAW BAAQMD Draft Options and Justification Report iv CEQA Thresholds of Significance
1 EXECUTIVE SUMMARY
Bay Area Air Quality Management District (BAAQMD or Air District) California Environmental Quality Act (CEQA) Guidelines for assessing air quality impacts, first published in 1985, were last revised in 1999. The CEQA process and the associated Guidelines are one of many mechanisms BAAQMD employs to further the primary goal of attaining and maintaining state and national ambient air quality standards. CEQA alone will not achieve the air quality goals. Thus, this paper recommends thresholds of significance that BAAQMD staff believes will provide a fair share of emission reductions from land use development.
BAAQMD publishes these Guidelines to assist local jurisdictions and agencies to comply with the requirements of CEQA regarding potentially adverse impacts to air quality. The primary purpose of the Guidelines are to provide a means to identify proposed local plans and development projects that may have a significant adverse effect on air quality, public health, attainment of state and national ambient air quality standards, and to provide recommendations to mitigate those impacts. Many of the assumptions underlying the analytical methodologies have been updated or revised since the last update of the Guidelines. In addition, some air quality impact issues, such as toxic air contaminant (TAC) risk and global climate change, have received significantly increased focus and prominence.
For these reasons, BAAQMD has decided to update the Guidelines, review existing significance criteria, establish new significance criteria where needed, and develop substantial evidence to support the threshold options available for use.
These thresholds are intended for application to land use development projects, which includes both project level residential and commercial development and Plans, e.g., general plans, specific plans, transportation plans, etc. These thresholds only apply in part to industrial sources. Mobile sources and area sources from industrial land use can be evaluated using the thresholds below as these emission sources have much in common with mobile sources and area sources from residential and commercial uses. Stationary sources are regulated through Air District rules and regulations, the federal Clean Air Act, and the California Clean Air Act and CEQA evaluation of stationary sources should apply these relevant regulations to make significance determinations.
Many of the thresholds are proposed as cumulatively significant impact levels that identify a level of impact that is considered either a cumulatively considerable contribution to an existing adverse condition or a level of impact where, in combination with the project being evaluated, together with other projects causing related impacts, is considered cumulatively significant. In the case of emissions of regional (e.g. ozone precursors) or global pollutants (greenhouse gases) no single project would be sufficient in size, by itself, to result in emissions that are considered significant.
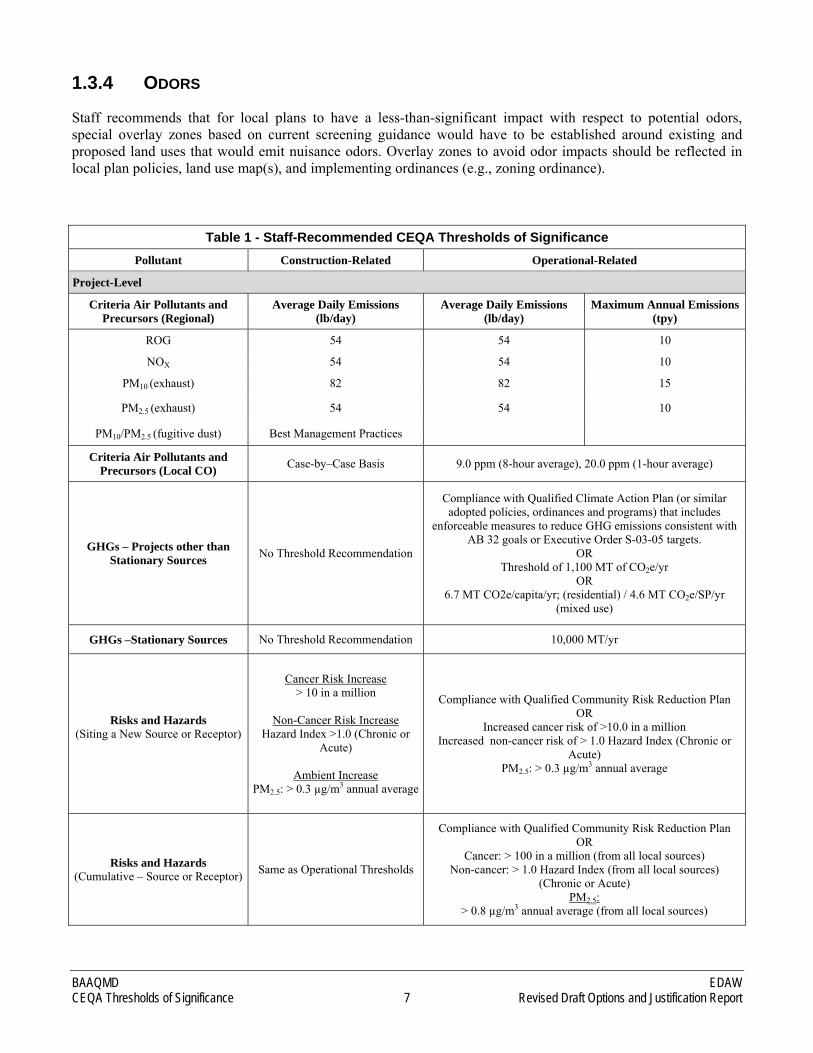
BAAQMD staff-recommended CEQA thresholds of significance for construction, operational-related, and plan-level emissions of criteria air pollutants and ozone precursors, greenhouse gases (GHGs), TACs, and odors include the following, as summarized in Table 1 at the end of this section. The justifications for the recommended thresholds are presented in the main body of this report.
1.1 CONSTRUCTION-RELATED IMPACTS
1.1.1 CRITERIA AIR POLLUTANTS AND OZONE PRECURSORS (REGIONAL)
Staff recommends the following thresholds for addressing attainment-related pollutants, which includes the following average daily thresholds of significance:
► 54 pounds per day (lb/day) for reactive organic gases (ROG),
BAAQMD EDAW CEQA Thresholds of Significance 1 Revised Draft Options and Justification Report
► 54 lb/day for oxides of nitrogen (NOx),
► 82 lb/day for respirable particulate matter from exhaust emissions with an aerodynamic resistance diameter of 10 micrometers or less (PM10), and
► 54 lb/day for fine particulate matter from exhaust emissions with an aerodynamic resistance diameter of 2.5 micrometers or less (PM2.5).
These levels are based on the trigger levels for the federal New Source Review (NSR) Program and BAAQMD’s Regulation 2, Rule 2 for new or modified sources. These levels represent a cumulatively considerable contribution.
For fugitive dust, staff recommends a continuation of the current Best Management Practice approach for the control of construction fugitive dust production.
No thresholds are proposed for regional Carbon Monoxide or Sulfur Dioxide construction emissions as control of these sources is currently not required to achieve regional attainment for these pollutants.
1.1.2 LOCALIZED CARBON MONOXIDE
Staff recommends a case-by-case consideration of localized carbon monoxide emissions from construction because carbon monoxide emissions from construction activities are rarely a public health concern except for the occasionally very large construction efforts.
1.1.3 GREENHOUSE GASES
Staff does not recommend a construction GHG threshold at this time because there is not sufficient evidence to determine a level at which construction emissions are significant. Staff recommends a case-by-case consideration of construction GHG emissions and encourages project applicants to implement construction GHG reduction strategies where feasible. The Air District will develop a list of best management practices, such as alternative fuels, use of local materials, and recycling of construction and demolition waste, to provide lead agencies with strategies that reduce greenhouse gas emissions from construction.
1.1.4 LOCAL COMMUNITY RISKS AND HAZARDS
Staff recommends the following thresholds for evaluation of a project’s construction related toxic air contaminant emissions:
► Increase of greater than 10 in a million cancer risk;
► Increase of non-cancer risk greater than a chronic or acute Hazard Index of 1.0; or
► Increase in ambient air quality emissions of PM2.5 greater than > 0.3 µg/m3.
Staff recommends a case-by-case consideration of a project’s cumulative construction impact. A cumulative analysis of a project’s construction risk impacts should be considered if there is a substantial overlap of projects or there is a major source of risk nearby. Where a cumulative analysis is warranted, staff recommends that the operational-related cumulative risks and hazards thresholds described below are used.
EDAW BAAQMD Draft Options and Justification Report 2 CEQA Thresholds of Significance
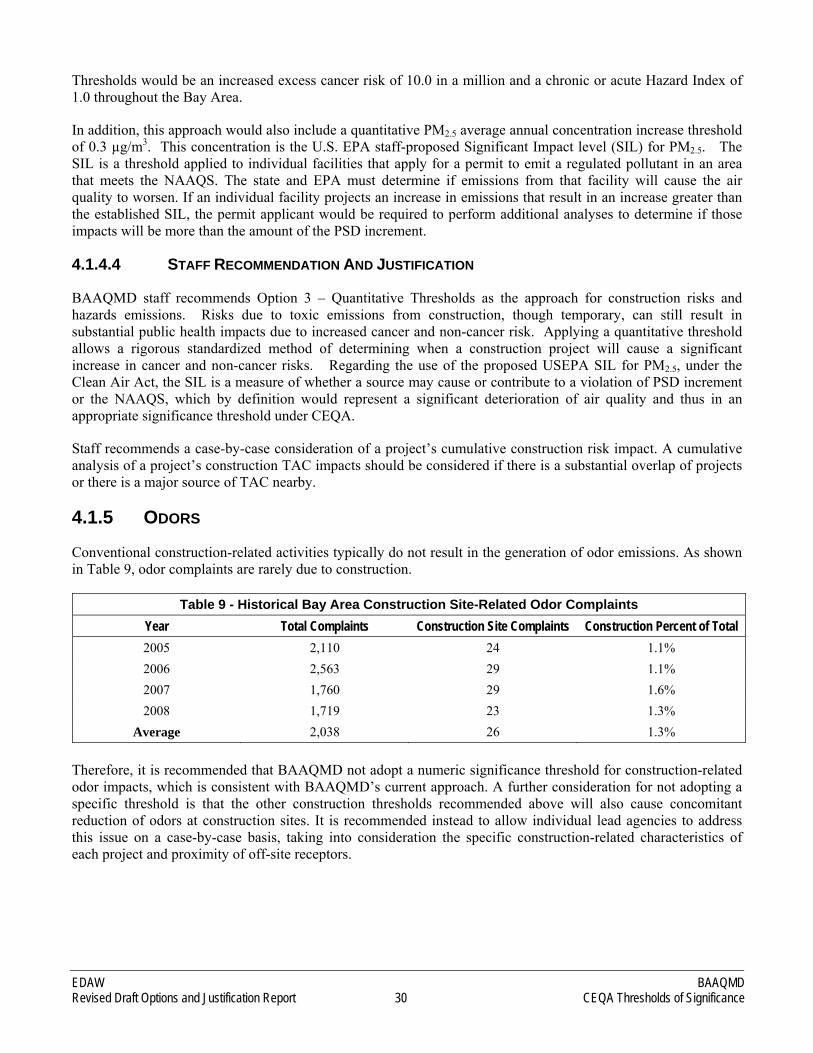
1.1.5 ODORS
Staff recommends individual lead agencies address this issue on a case-by-case basis, taking into consideration the specific construction-related characteristics of each project and proximity of off-site receptors. Proximity examples are given in the text below. Examples of odorous compounds are found in District Regulation 7.
1.2 OPERATIONAL-RELATED IMPACTS
1.2.1 CRITERIA AIR POLLUTANTS AND OZONE PRECURSORS (REGIONAL)
Staff recommends the following average daily and maximum annual thresholds of significance for evaluation of attainment-related criteria pollutants and ozone precursors:
► 54 lb/day and 10 tons per year (tpy) for ROG,
► 54 lb/day and 10 tpy for NOx,
► 82 lb/day and 15 tpy for PM10, and
► 54 lb/day and 10 tpy for PM2.5.
These levels are based on the trigger levels for the federal NSR Program and BAAQMD’s Regulation 2, Rule 2 for new or modified sources. These levels represent a cumulatively considerable contribution.
1.2.2 LOCALIZED CARBON MONOXIDE
Staff recommends the following ambient CO thresholds of significance for operational emissions:
► 20 ppm for 1-hour exposure
► 8 ppm for 8-hour exposure
These thresholds are based on the California ambient air quality standards for carbon monoxide.
1.2.3 GREENHOUSE GASES
1.2.3.1 LAND USE SECTOR PROJECTS
Staff recommends a tiered approach to consideration of operational GHG emissions.
Projects consistent with a qualified Climate Action Plan adopted by the local jurisdiction (or similar adopted policies, ordinances and programs) that include enforceable measures to reduce GHG emissions consistent with AB 32 goals or Executive Order S-03-05 targets, would be considered less than significant.
Projects not consistent with an adopted qualified Climate Action Plan (or similar adopted policies, ordinances and programs) would be considered to have a significant impact.
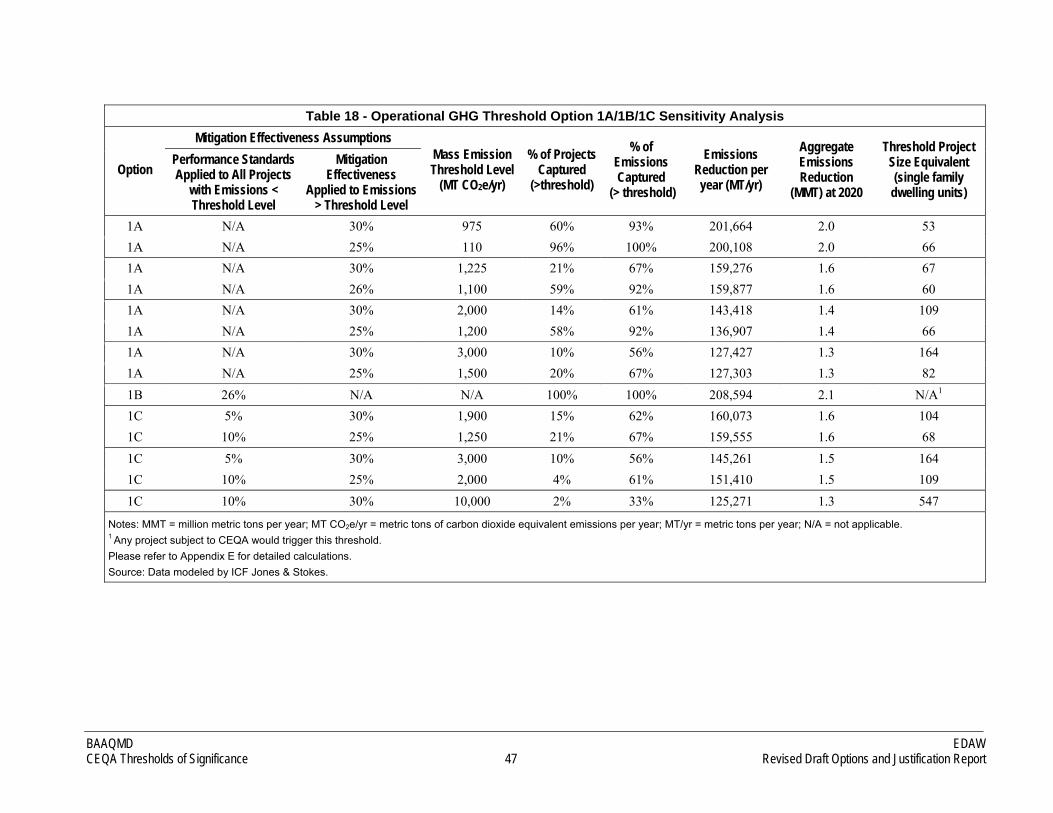
Projects proposed in areas where a qualified Climate Action Plan has not been adopted should be reviewed against a “bright-line” threshold of 1,100 MT carbon dioxide equivalent per year (CO2e/yr). A bright line numeric threshold of 1,100 MT CO2e/yr would result in approximately 59 percent of all future projects and 92 percent of all future land use emissions being subject to mitigation requirements under CEQA, and achieve aggregate emissions reduction of 1.6 MMT CO2e by 2020 to achieve the SFBAAB’s fair share GHG emission reductions
BAAQMD EDAW CEQA Thresholds of Significance 3 Revised Draft Options and Justification Report
needed from new land use projects. This threshold corresponds to a project size of approximately 60 single family dwelling units.
Residential projects that are over the bright line threshold would not be considered significant if their overall GHG efficiency is less than 6.7 MT CO2e/yr/capita. Mixed use projects that are over the bright line threshold would not be considered significant if their overall efficiency is less than 4.6 MT CO2e/yr/service population (= project jobs + project residents).
The above levels represent a cumulatively considerable contribution.
For tiering, projects consistent with a SB 375 Sustainable Communities Strategy or Alternative Planning Strategy would be considered less than significant for transportation-related GHG emissions, but not necessarily for other GHG emissions. Review against the bright-line threshold for non-transportation related emissions would still be required. Given that transportation emissions are often the largest source of GHG emissions for land use sector projects, it is expected that projects consistent with a SB 375 plan would more readily demonstrate compliance with the bright line significance threshold.
Staff will revisit these thresholds over time as implementation of AB 32 and SB 375 proceed.
1.2.3.2 STATIONARY SOURCES
Staff recommends that stationary source permit applications be reviewed against a bright-line threshold of 10,000 MT CO2e/yr. This threshold corresponds to a level that would capture approximately 95 percent of stationary source GHG emissions based on all combustion emissions.
1.2.4 LOCAL COMMUNITY RISK AND HAZARD IMPACTS
1.2.4.1 SITING OF A NEW SOURCE OR NEW RECEPTOR
Staff recommends a tiered approach to consideration of community risk and hazard impacts.
Projects consistent with a qualified Community Risk Reduction Plan (CRRP) adopted by the local jurisdiction that includes enforceable measures to reduce the community risk to acceptable levels would be considered less than significant.
Proposed development projects that are not consistent with a qualified CRRP that has been adopted for the area where the project is proposed to be located would be considered to have a significant impact.
Projects proposed in areas where a qualified CRRP has not been adopted and the potential to expose sensitive receptors or the general public to emissions-related risk in excess of the following thresholds from any source would be considered to have a significant air quality impact:
► Increased Cancer Risk to Maximally Exposed Individual (MEI) - Emissions from a new source or emissions affecting a new receptor would be considered significant where ground-level concentrations of carcinogenic TACs from any source result in an increased cancer risk greater than 10.0 in one million.
► Increased Non-Cancer Risk to MEI – Emissions from a new source or emissions affecting a new receptor would be considered significant where ground-level concentrations of non-carcinogenic TACs result in an increased chronic or acute Hazard Index from any source greater than 1.0.
EDAW BAAQMD Draft Options and Justification Report 4 CEQA Thresholds of Significance
► Increased Ambient Concentration of PM2.5 – Emissions from a new source or emissions affecting a new receptor would be considered significant where ground-level concentrations of PM2.5 from any source would result in an average annual increase greater than 0.3 µg/m3.
These thresholds would apply to stationary, area, and mobile sources of TAC emissions.
Accidental Release of Acutely Hazardous Air Pollutants
Staff recommends continuing with the current threshold for the accidental release of hazardous air pollutants. Staff recommends that agencies consult with the California Emergency Management Agency for the most recent guidelines and regulations for the storage of hazardous materials. Staff recommends that projects using or storing acutely hazardous materials locating near existing receptors, and projects resulting in receptors locating near facilities using or storing acutely hazardous materials be considered significant.
1.2.4.2 CUMULATIVE RISK AND HAZARD EMISSIONS
Staff recommends the following as the thresholds of significance for cumulative impacts of siting a new source of risks or hazards or siting a new receptor.
Projects consistent with a qualified Community Risk Reduction Plan (CRRP) adopted by the local jurisdiction that includes enforceable measures to reduce the community risk to acceptable levels would be considered a less than cumulative significant.
Proposed development projects that are not consistent with a qualified CRRP that has been adopted for the area where the project is proposed to be located would be considered to have a significant cumulative impact.
Projects proposed in areas where a qualified CRRP has not been adopted and the potential to expose sensitive receptors or the general public to emissions-related risk in excess of the following thresholds from any source would be considered to have a significant cumulative air quality impact:
► Cancer Risk to MEI - Cumulative sources (including the proposed project, existing sources and reasonably foreseeable future sources) would be subject to a significance threshold of 100 in one million within 1,000 feet from the location of the new source being evaluated. Siting of new receptors would be subject to the 100 in one million threshold relative to all cumulative sources within 1,000 feet of the new receptor location.
► Non-Cancer Risk to MEI - Cumulative sources of risks or hazards would be subject to a significance threshold of a chronic or acute Hazard Index of greater than 1.0 within 1,000 feet from the location of the new source being evaluated. Siting of new receptors would be subject to the chronic or acute Hazard Index threshold of greater than 1.0 relative to all cumulative sources within 1,000 feet of the new receptor location.
► Increased Ambient Concentration of PM2.5 – Cumulative emissions within the 1,000 foot evaluation zone would be considered significant where the increased average annual ground-level concentrations of PM2.5 would be greater than 0.8 µg/m3.
These thresholds would apply to stationary, area, and mobile sources of TAC emissions.
1.2.5 ODOR IMPACTS
Staff recommends agencies use BAAQMD’s current approach, which is based on screening level distances, complaint history, and other factors. The BAAQMD considers a project locating near an existing source of odors as having a significant odor impact if it is proposed for a site that is closer to an existing odor source than any location where there has been:
BAAQMD EDAW CEQA Thresholds of Significance 5 Revised Draft Options and Justification Report
► More than one confirmed complaint per year averaged over a three year period; or
► More than three unconfirmed complaints per year averaged over a three year period.
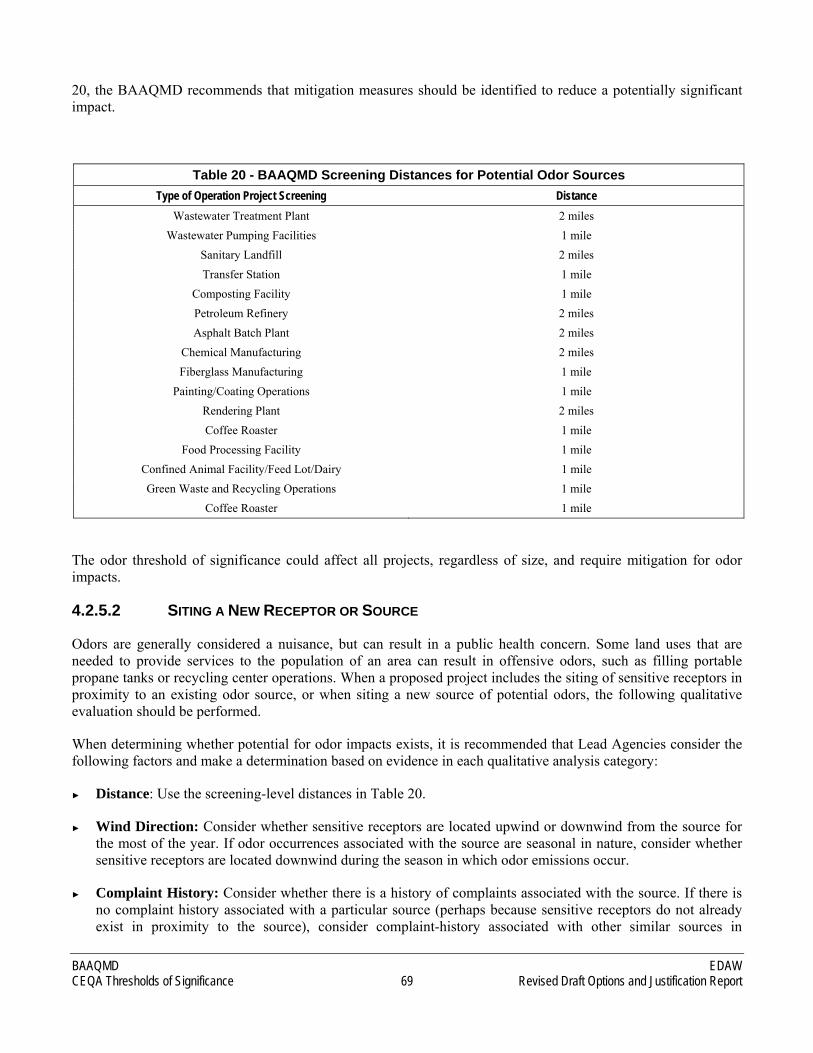
If a proposed project involves the siting of sensitive receptors within the screening-level distances or the siting of an odor-producing land use within the impacts distances in Table 19 below, and the average complaints are greater than identified above, the BAAQMD recommends that mitigation measures be identified to reduce a potentially significant impact.
1.3 PLAN-LEVEL IMPACTS
1.3.1 CRITERIA AIR POLLUTANTS AND PRECURSORS
Staff s’ recommendation is to continue the current approach for plan-level impacts with one addition. The current approach recommends that general plans of cities and counties must show consistency with regional plans and policies affecting air quality to claim a less than significant impact on air quality. General plan amendments, transportation plans, congestion management plans, redevelopment plans, specific area plans, annexations of lands and services, and similar planning activities should receive the same scrutiny as general plans with respect to consistency with regional air quality plans. Staff recommends the addition of a threshold requiring that the forecasted rate of vehicle-miles travelled (VMT) or vehicle trip increase from a new plan should be less than the forecasted rate of population increase.
1.3.2 GREENHOUSE GAS EMISSIONS
Staff recommends that plans, such as general plans, be considered less than significant if they either meet specified GHG efficiency metrics or if the jurisdiction has adopted a qualified Climate Action Plan (or similar adopted policies, ordinances and programs) that includes feasible measures to reduce GHG emissions consistent with AB 32 goals and Executive Order S-03-05 targets.
GHG-efficiency metrics (6.7 MT CO2e/capita, 4.6 CO2e/service population) can be used to enable comparison of a proposed general plan to determine if the proposed general plan meets AB 32 emission reduction goals on an efficiency basis. Staff will revisit the efficiency thresholds over time as implementation of AB 32 and SB 375 proceed.
Local jurisdictions that may not initiate a general plan update for a number of years may decide instead to address GHG emissions for general plans through a stand-alone Climate Action Plan. In order for a Climate Action Plan to be considered less than significant under CEQA, the Climate Action Plan for the jurisdiction must contain a GHG inventory and forecast, an adopted local reduction goal consistent with AB 32 (or S-03-05), enforceable reduction measures that are measureable in terms of their reduction effectiveness and are verifiable, a viable implementation plan and schedule and monitoring. In addition, CEQA compliance must be completed for adoption of the plan.
1.3.3 LOCAL COMMUNITY RISK AND HAZARDS
Staff recommends that for local plans to have a less-than-significant impact with respect to potential risks or hazards, special overlay zones should be established around existing and proposed land uses that would emit these air pollutants. Overlay zones should also be established for areas that have an adopted Community Risk Reduction Plan. Overlay zones should be established based on a quantitative threshold of exposure using the quantitative operational project level thresholds. Risk and hazard overlay zones should be reflected in local plan policies, land use map(s), and implementing ordinances (e.g., zoning ordinance).
EDAW BAAQMD Draft Options and Justification Report 6 CEQA Thresholds of Significance
1.3.4 ODORS
Staff recommends that for local plans to have a less-than-significant impact with respect to potential odors, special overlay zones based on current screening guidance would have to be established around existing and proposed land uses that would emit nuisance odors. Overlay zones to avoid odor impacts should be reflected in local plan policies, land use map(s), and implementing ordinances (e.g., zoning ordinance).
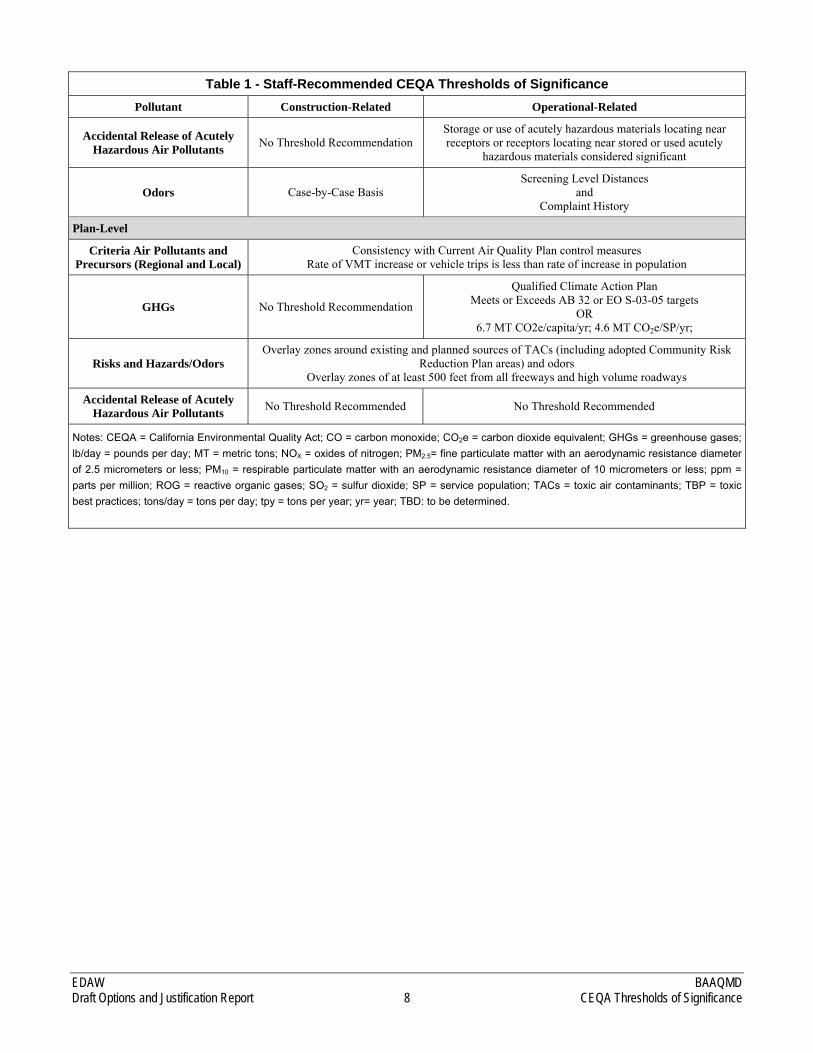
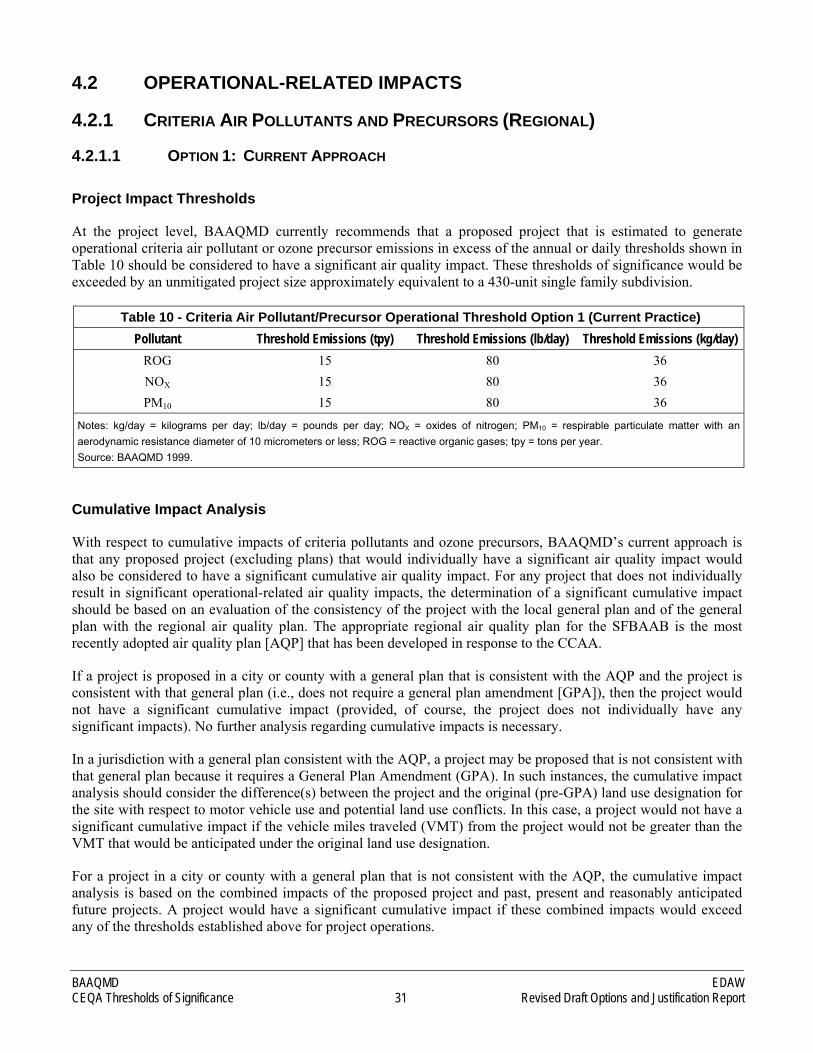
Criteria Air Pollutants and Precursors (Regional and Local)
Consistency with Current Air Quality Plan control measures Rate of VMT increase or vehicle trips is less than rate of increase in population
GHGs No Threshold Recommendation
Qualified Climate Action Plan Meets or Exceeds AB 32 or EO S-03-05 targets
OR 6.7 MT CO2e/capita/yr; 4.6 MT CO2e/SP/yr;
Risks and Hazards/Odors Overlay zones around existing and planned sources of TACs (including adopted Community Risk
Reduction Plan areas) and odors Overlay zones of at least 500 feet from all freeways and high volume roadways
Accidental Release of Acutely Hazardous Air Pollutants No Threshold Recommended No Threshold Recommended
Notes: CEQA = California Environmental Quality Act; CO = carbon monoxide; CO2e = carbon dioxide equivalent; GHGs = greenhouse gases; lb/day = pounds per day; MT = metric tons; NOX = oxides of nitrogen; PM2.5= fine particulate matter with an aerodynamic resistance diameter of 2.5 micrometers or less; PM10 = respirable particulate matter with an aerodynamic resistance diameter of 10 micrometers or less; ppm = parts per million; ROG = reactive organic gases; SO2 = sulfur dioxide; SP = service population; TACs = toxic air contaminants; TBP = toxic best practices; tons/day = tons per day; tpy = tons per year; yr= year; TBD: to be determined.
EDAW BAAQMD Draft Options and Justification Report 8 CEQA Thresholds of Significance
2 INTRODUCTION
The purpose of this report is to evaluate options for California Environmental Quality Act (CEQA) thresholds of significance for use within Bay Area Air Quality Management District’s (BAAQMD or Air District) jurisdiction. In this section the regulatory authority of BAAQMD, the justification for why the thresholds are being updated, the current air quality designation of the region, emission reduction nomenclature used in this report, and a review of other air districts efforts to revise air quality thresholds to evaluate new thresholds are introduced.
2.1 BAAQMD/CEQA REGULATORY AUTHORITY
The BAAQMD has direct and indirect regulatory authority over sources of air pollution in the San Francisco Bay Area Air Basin (SFBAAB). CEQA requires that public agencies consider the potential adverse environmental impacts of any project that a public agency proposes to carry out, fund or approve. CEQA requires that a lead agency prepare an Environmental Impact Report (EIR) whenever it can be fairly argued (the “fair argument” standard), based on substantial evidence,1 that a project may have a significant effect2 on the environment, even if there is substantial evidence to the contrary (CEQA Guidelines § 15064). CEQA requires that the lead agency review not only a project’s direct effects on the environment, but also the cumulative impacts of a project and other projects causing related impacts. When the incremental effect of a project is cumulatively considerable, the lead agency must discuss the cumulative impacts in an EIR. (CEQA Guidelines § 15064).
The “fair argument” standard refers to whether a fair argument can be made that a project may have a significant effect on the environment (No Oil, Inc. v. City of Los Angeles (1974) 13 Cal.3d 68, 84). The fair argument standard is generally considered a low threshold requirement for preparation of an EIR. The legal standards reflect a preference for requiring preparation of an EIR and for “resolving doubts in favor of environmental review.” Meija v. City of Los Angeles (2005) 130 Cal. App. 4th 322, 332. “The determination of whether a project may have a significant effect on the environment calls for careful judgment on the part of the public agency involved, based to the extent possible on scientific and factual data.” CEQA Guidelines § 15064(b).
In determining whether a project may have a significant effect on the environment, CEQA Guidelines Section 15064.7 provides that lead agencies may adopt and/or apply “thresholds of significance.” A threshold of significance is “an identifiable quantitative, qualitative or performance level of a particular environmental effect, non-compliance with which means the effect will normally be determined to be significant by the agency and compliance with which means the effect normally will be determined to be less than significant” (CEQA Guidelines § 15064.7).
While thresholds of significance give rise to a presumption of insignificance, thresholds are not conclusive, and do not excuse a public agency of the duty to consider evidence that a significant effect may occur under the fair argument standard. Meija, 130 Cal. App. 4th at 342. “A public agency cannot apply a threshold of significance or regulatory standard ‘in a way that forecloses the consideration of any other substantial evidence showing there may be a significant effect.’” Id. This means that if a public agency is presented with factual information or other substantial evidence establishing a fair argument that a project may have a significant effect on the environment,
1 “Substantial evidence” includes facts, reasonable assumptions predicated upon facts, or expert opinions supported by facts, but does not include argument, speculation, unsubstantiated opinion or narrative, evidence that is clearly inaccurate or erroneous, or evidence of social or economic impacts that do not contribute to, or are not caused by, physical impacts on the environment. Cal. Pub. Res. C. § 21080(c); see also CEQA Guidelines § 15384. 2 A “significant effect” on the environment is defined as a “substantial, or potentially substantial, adverse change in the environment.” Cal. Pub. Res. C. § 21068; see also CEQA Guidelines § 15382.
BAAQMD EDAW CEQA Thresholds of Significance 9 Revised Draft Options and Justification Report
EDAW BAAQMD Draft Options and Justification Report 10 CEQA Thresholds of Significance
the agency must prepare an EIR to study those impacts even if the project’s impacts fall below the applicable threshold of significance.
Thresholds of significance must be supported by substantial evidence. This Report provides the substantial evidence in support of the thresholds of significance developed by the BAAQMD. The BAAQMD recommends that lead agencies within the nine counties of the BAAQMD’s jurisdiction use the thresholds of significance in this report when considering the air quality impacts of projects under their consideration.
2.2 JUSTIFICATION FOR UPDATING CEQA THRESHOLDS
Any analysis of environmental impacts under CEQA includes an assessment of the nature and extent of each impact expected to result from the project to determine whether the impact will be treated as significant or less than significant. CEQA gives lead agencies discretion whether to classify a particular environmental impact as significant. Ultimately, formulation of a standard of significance requires the lead agency to make a policy judgment about where the line should be drawn distinguishing adverse impacts it considers significant from those that are not deemed significant. This judgment must, however, be based on scientific information and other factual data to the extent possible (State CEQA Guidelines §15064(b)).
In the sense that advances in science provide new or refined factual data, combined with advances in technology and the gradual improvement or degradation of an environmental resource, the point where an environmental effect is considered significant is fluid over time. Other factors influencing this fluidity include new or revised regulations and standards, and emerging, new areas of concern.
In the ten years since BAAQMD last reviewed its recommended CEQA thresholds of significance for air quality, there have been tremendous changes that affect the quality and management of the air resource in the Bay Area. Traditional criteria air pollutant ambient air quality standards, at both the state and federal levels, have become increasingly more stringent. A new criteria air pollutant standard for PM2.5 has been added to federal and state ambient air quality standards. We have found, through technical advances in impact assessment, that toxic air contaminants are not only worse than previously thought from a health perspective, but also their concentrations have been steadily increasing, giving rise to new regulations and programs to reduce the significantly elevated levels of ambient toxic air contaminant concentrations in the Bay Area. Another significant issue that affects the quality of life for Bay Area residents is the growing concern with global climate change
For the reasons stated above, and to further the goals of other District programs such as transit-oriented and infill development, BAAQMD has undertaken an effort to review all of its currently-recommended CEQA thresholds, revise them as appropriate, and develop new thresholds where appropriate. The overall goal of this effort is to develop CEQA significance criteria that ensure new development contributes its feasible fair share of emissions reductions to mitigate significant air quality impacts and meet the objectives stated above. The Air District’s recommended CEQA significance criteria will be vetted through a public review process and presented to the BAAQMD Board of Directors for adoption.
2.3 SFBAAB AIR QUALITY DESIGNATIONS
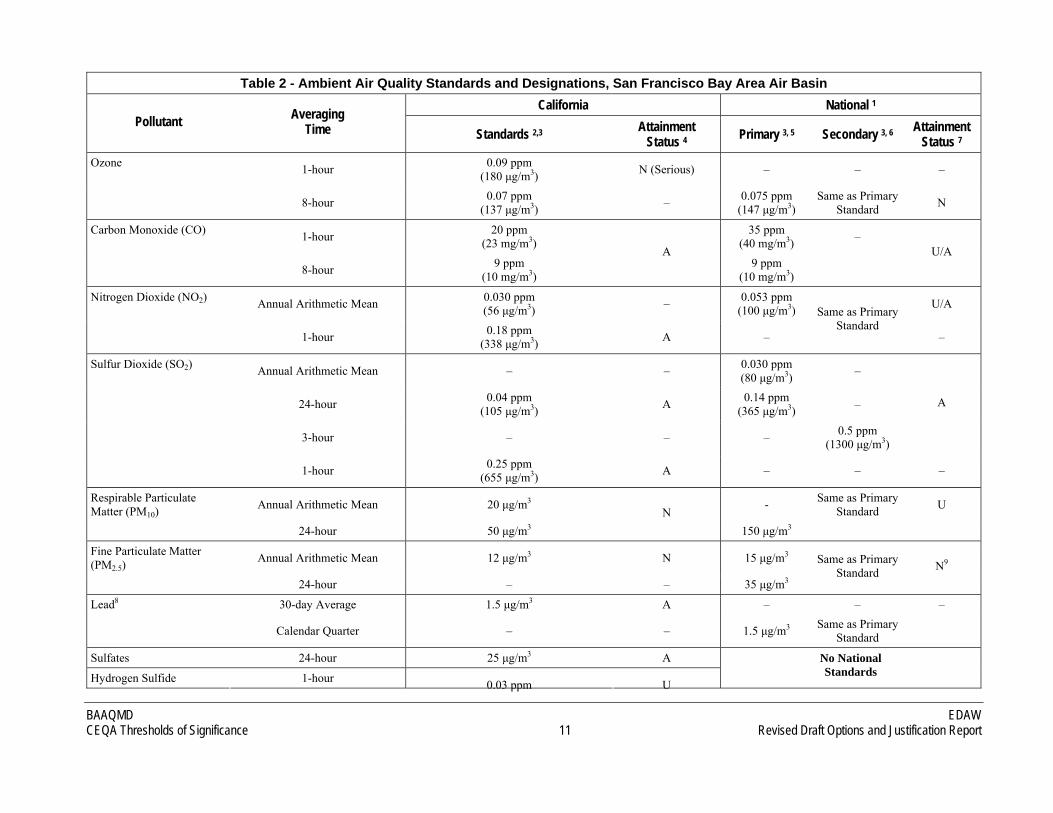
SFBAAB is currently designated as an ozone non-attainment area for the California and national ambient air quality standards (CAAQS and NAAQS, respectively) as shown in Table 2. The U.S. Environmental Protection Agency (EPA) has also recently designated the SFBAAB as non-attainment for the new 24-hour fine particulate with an aerodynamic resistance diameter of 2.5 micrometers or less (PM2.5) standard of 35 microgram per cubic meter (µg/m3). However, since the new presidential administration has ordered a freeze on all pending federal rules, the designation will not be effective until after publication of the regulation in the Federal Register. With regards to the CAAQS, the SFBAAB is also designated as a non-attainment area for respirable particulate matter with an aerodynamic resistance diameter of 10 micrometers or less (PM10) and PM2.5.
BAAQMD EDAW CEQA Thresholds of Significance 11 Revised Draft Options and Justification Report
Table 2 - Ambient Air Quality Standards and Designations, San Francisco Bay Area Air Basin California National 1
Pollutant Averaging Time Standards 2,3 Attainment
Status 4 Primary 3, 5 Secondary 3, 6 Attainment Status 7
Annual Arithmetic Mean 20 μg/m3 - Same as Primary Standard U
24-hour 50 μg/m3N
150 μg/m3
Fine Particulate Matter (PM2.5)
Annual Arithmetic Mean 12 μg/m3 N 15 μg/m3
24-hour – – 35 μg/m3
Same as Primary Standard N9
30-day Average 1.5 μg/m3 A – – – Lead8
Calendar Quarter – – 1.5 μg/m3 Same as Primary Standard
Sulfates 24-hour 25 μg/m3 A
Hydrogen Sulfide 1-hour 0.03 ppm U
No National Standards
BAAQMD Revised Draft Options and Justification Report 12 CEQA Thresholds of Significance
Table 2 - Ambient Air Quality Standards and Designations, San Francisco Bay Area Air Basin California National 1
Pollutant Averaging Time Standards 2,3 Attainment
Status 4 Primary 3, 5 Secondary 3, 6 Attainment Status 7
(42 μg/m3)
Vinyl Chloride8 24-hour 0.01 ppm (26 μg/m3) U
Visibility-Reducing Particle Matter
8-hour Extinction coefficient of 0.23 per kilometer—visibility of 10 miles or more (0.07—30 miles or more for Lake Tahoe)
because of particles when the relative humidity is less than 70%.
U
No National
Standards
Notes: µg/m3 = micrograms per cubic meter; mg/m3 = milligram per cubic meter; ppm = parts per million. 1 National standards (other than ozone, respirable and fine particulate matter (PM10 and PM2.5, respectively)), and those based on annual averages or annual arithmetic means) are not to be exceeded more than
once a year. The ozone standard is attained when the fourth highest 8-hour concentration in a year, averaged over 3 years, is equal to or less than the standard. For respirable particulate matter, the 24-hour
standard is attained when the expected number of days per calendar year with a 24-hour average concentration above 150 micrograms per cubic meter is equal to or less than one. For fine particulate matter, the
24-hour standard is attained when 98 percent of the daily concentrations, averaged over 3 years, are equal to or less than the standard. 2 California standards for ozone, carbon dioxide (except Lake Tahoe), sulfur dioxide (1- and 24-hour), nitrogen dioxide, PM, and visibility-reducing particles are values that are not to be exceeded. All others are not to
be equaled or exceeded. California ambient air quality standards are listed in the Table of Standards in Section 70200 of Title 17 of the California Code of Regulations. 3 Concentration expressed first in units in which it was promulgated. Equivalent units given in parentheses are based on a reference temperature of 25°C and a reference pressure of 760 torr. Most measurements of
air quality are to be corrected to a reference temperature of 25°C and a reference pressure of 760 torr; parts per million (ppm) refers to ppm by volume, or micromoles of pollutant per mole of gas. 4 Unclassified (U): A pollutant is designated unclassified if the data are incomplete and do not support a designation of attainment or non-attainment. Attainment (A): A pollutant is designated attainment if the state
standard for that pollutant was not violated at any site in the area during a 3-year period. Non-attainment (N): A pollutant is designated non-attainment if there was a least one violation of a state standard for that
pollutant in the area. Non-attainment/Transitional (NT): A subcategory of the non-attainment designation. An area is designated non-attainment/transitional to signify that the area is close to attaining the standard
for that pollutant. 5 National Primary Standards: The levels of air quality necessary, with an adequate margin of safety, to protect the public health. 6 National Secondary Standards: The levels of air quality necessary to protect the public welfare from any known or anticipated adverse effects of a pollutant. 7 Non-attainment (N): Any area that does not meet (or that contributes to ambient air quality in a nearby area that does not meet) the national primary or secondary ambient air quality standard for the pollutant.
Attainment (A): Any area that meets the national primary or secondary ambient air quality standard for the pollutant. Unclassifiable (U): Any area that cannot be classified on the basis of available information as
meeting or not meeting the national primary or secondary ambient air quality standard for the pollutant. 8 The California Air Resources Board has identified lead and vinyl chloride as toxic air contaminants with no threshold of exposure for adverse health effects determined. These actions allow for the implementation of
control measures at levels below the ambient concentrations specified for these pollutants. 9 The U.S Environmental Protection Agency (EPA) lowered the 24-hour PM standard from 65 µg/m2.5
3 to 35 µg/m3 in 2006. EPA issued attainment status designations for the 35 µg/m3 standard on December 22,
2008. EPA has designated the San Francisco Bay Area Air Basin as non-attainment for the 35 µg/m3 PM standard. The EPA designation will be effective 90 days after publication of the regulation in the Federal
Register. The Office of the President has ordered a freeze on all pending federal rules; therefore, the effective date of the designation is unknown at this time.2.5
Source: ARB 2009c.
EDAW
The fact that SFBAAB is designated as non-attainment for both national and California ambient air quality standards highlights the need to evaluate new CEQA thresholds to improve Bay Area air quality.
2.4 EMISSIONS NOMENCLATURE
Terminology such as capture and mitigation can change definition based on context. To ensure the unambiguous description of emission related terminology, the following definitions are used in this the report. All references to mitigation used below refer to air pollution emission reduction measures. Unless specifically qualified, the use of the word total in the definitions below refers to total emissions subject to CEQA not to total regional emissions. The following terms relate to the total number of projects subject to CEQA: ► CEQA Projects – the total number of projects that require CEQA analysis.
► Captured Projects – the number of projects that require mitigation.
► Project Capture Ratio – the ratio of Captured Projects to CEQA Projects.
The following terms below can apply to any single project, program, plan, or the Bay Area as a whole. ► Raw Emissions – the amount of emissions (by mass) emitted as a result of a project, program or plan without
considering mitigation measures.
► Captured Emissions – the amount of Raw Emissions (by mass) that require mitigation measures in any particular threshold option.
► Mitigated Emissions – the amount of emissions (by mass) emitted as a result of a project when mitigation measures are in place.
► Mitigation Effectiveness – the percent reduction in Raw Emissions as a result of mitigation measures.
2.5 A REVIEW OF CALIFORNIA AIR DISTRICT’S APPROACHES TO AIR QUALITY THRESHOLDS
In this section, a review of how various California air districts address CEQA thresholds is presented. This review should add context to the methodologies and approaches used by BAAQMD to update their air quality thresholds. A summary of air district thresholds, and supporting documentation, where available, is presented in Appendix A.
With respect to criteria air pollutant and ozone precursor emissions, numerous air districts (e.g., Monterey Bay Unified Air Pollution Control District, Santa Barbara County Air Pollution Control District, Mojave Desert Air Quality Management District [MDAQMD], and South Coast Air Quality Management District) have based thresholds of significance for reactive organic gases (ROG) and oxides of nitrogen (NOX) on limits established by the federal New Source Review (NSR) Program. In certain cases, these NSR limits, which are identified in regulation on an annual basis (tons per year [tpy]), are converted to pounds per day (lb/day) for precursor emissions. While some air districts have no quantitative threshold levels, many use the CAAQS as thresholds of significance, particularly for carbon monoxide (CO) where impacts are more localized in nature. Dispersion modeling is often required to evaluate whether a concentration-based threshold would be exceeded as a result of project implementation. Within jurisdictions where thresholds of significance have not been adopted, air districts advise the lead agencies on a case-by-case basis and rely on guidance of nearby air districts.
BAAQMD EDAW CEQA Thresholds of Significance 13 Revised Draft Options and Justification Report
Supporting documentation for non-NSR-derived thresholds of significance from the Sacramento Metropolitan Air Quality Management District (SMAQMD) and the Ventura County Air Pollution Control District (VCAPCD) are included in Appendix A. SMAQMD prepared draft justification documentation for both construction- and operational-related thresholds of significance in 2001. The bases for these thresholds were derived from the reductions (tons per day [tons/day] of ozone precursors) committed to by control measures contained in the State Implementation Plan (SIP) and in a manner that was intended to optimize project emission elimination of proposed projects, while requiring a level of mitigation that would be realistic and achievable.
VCAPCD developed thresholds of significance for ozone precursors by determining the emissions capture rate associated with applying five different increments of ROG and NOX emission levels to projected development. This approach was intended to achieve a balance between the number of projects affected and the amount of emissions subject to mitigation.
With respect to toxic air contaminants (TACs), an excess cancer risk level of 10 in one million or a hazard index of one are widely used based on a thorough review of district-adopted CEQA guidance and discussions with air district staff. In most cases, these are applied to stationary sources and not to construction or mobile sources of TACs. The current rationale for not applying these indices to construction-related emissions is that such activities are short-term and intermittent in nature and the primary health concern with diesel particulate matter (PM) is long-term exposure. Because these indices were originally developed based on the behavior of stationary sources (e.g., constant emissions rate over time), they are also typically not applied to mobile sources. Some air districts (e.g., MDAQMD) also use adopted rules and regulations based on limits established by the federal Toxic NSR Program (e.g., new or modified source that emit more than 10 tpy of a single hazardous air pollutant [HAP] or more than 25 tpy of multiple HAPs would be required to implement maximum achievable control technology) for thresholds of significance (e.g., projects that would violate a rule or regulation would be considered significant with respect to TACs). Others refer to the Air Quality and Land Use Handbook: A Community Health Perspective released by the California Air Resources Board (ARB) in 2005 for guidance on land use compatibility issues; however, this document was intended to be advisory, not regulatory.
For assessing odor impacts, no quantitative thresholds of significance have been adopted, but instead many air districts use screening-level buffer distances for common odor-generating sources in combination with complaint history. Typically, a significant odor impact would occur under the complaint-based threshold if the project has: 1) more than one confirmed complaint per year averaged over a three-year period, or 2) more than three unconfirmed complaints per year averaged over a three-year period. Projects that would involve the siting of sensitive receptors within the screening-level distances or the siting of an odor-producing land use within these distances from existing sensitive receptors would be considered to have a significant odor impact and further analysis and/or mitigation would be required. Prevailing wind direction relative to the source and receptors are also taken into consideration.
Many air districts state that if implementation of a proposed project would not result in the generation of emissions that exceed applicable project-level mass emission thresholds, then the cumulative impact of the project on air quality would also be considered less than significant. In other words, if project-generated emissions would exceed the operational-related thresholds of significance in a designated non-attainment area, then the project’s incremental contribution would be considered cumulatively considerable, and therefore, significant.
To date, no air district in California has adopted a threshold of significance for greenhouse gas (GHG) emissions for nonindustrial land use development projects. The South Coast Air Quality Management District (SCAQMD) has developed an approach to tiered threshold of significances for GHG emissions that considers CEQA exemptions, consistency with a GHG reduction plan, a quantitative threshold based on source analysis and a 90 percent capture rate, and several performance standard approaches for mitigation. SCAQMD has adopted a tiered threshold for industrial projects with a quantitative threshold of 10,000 metric tons/year using this general approach. SCAQMD is also developing a tiered threshold approach for residential and commercial projects using a similar methodology, but have not made a proposal for adoption yet. The San Joaquin Air Pollution Control
EDAW BAAQMD Revised Draft Options and Justification Report 14 CEQA Thresholds of Significance
District is exploring a tiered GHG emissions threshold for land use development projects that considers CEQA exemptions, compliance with a GHG reduction plan, and compliance with best performance standards or a 29 percent reduction requirement compared to business as usual conditions.
BAAQMD EDAW CEQA Thresholds of Significance 15 Revised Draft Options and Justification Report
3 ANALYSIS TO SUPPORT NEW THRESHOLD DEVELOPMENT
Relevant findings from a series of qualitative and quantitative studies conducted by BAAQMD to support the development and selection of new CEQA thresholds are presented below.
3.1 CAA/CCAA & NEW SOURCE REVIEW
The federal and California Clean Air Acts (CAA and CCAA, respectively) impose emission limitations on stationary sources (e.g., federal New Source Review [NSR], and BAAQMD Best Available Control Technology [BACT] and Offset Requirements) that serve to reduce emissions from those sources to the extent feasible.
The NSR Program3 was created by the CAA to ensure that stationary sources of air pollution are constructed or modified in a manner that is consistent with attainment of health-based federal ambient air quality standards. Existing regulations require the NSR Program to address any pollutant for which there is an established federal ambient air quality standard. The NSR Program is composed of two primary components: Prevention of Significant Deterioration (PSD), which applies to pollutants where the standard has been attained, and NSR, which applies to pollutants where the standard has not been attained. The CAA regulations also require the installation of BACT, air quality monitoring and modeling analyses to ensure that a project’s emissions will not cause or contribute to a violation of any air quality standard, limiting the incremental increase of a pollutant and offsetting new emissions with creditable emission reductions.
The determination of whether a source is subject to NSR is based, in part, on comparison to the Significant Emission Rates identified in the regulations. These are derived from modeling analyses to determine the level of emissions below which a source alone is not expected to have an impact on air quality (see Table 3). Although the limits are adopted in regulation to control stationary source emissions, they are considered to have the same effect of controlling emissions from land use development.
Table 3 – New Source Review Criteria Pollutant/Precursor Significant Emission Rates Emissions Type Significant Emissions Rate (tpy)
ROG 40 NOX 40 CO 100 SO2 40 PM10 15 PM2.5 10
Notes: CO = carbon monoxide; NOX = oxides of nitrogen; PM2.5 = fine particulate matter with an aerodynamic resistance diameter of 2.5 micrometers or less; PM10 = respirable particulate matter with an aerodynamic resistance diameter of 10 micrometers or less; ROG = reactive organic gases; SO2 = sulfur dioxide; tpy = tons per year. Sources: BAAQMD 2005, EPA 2008.
BAAQMD Regulation 2, Rule 2 provides for the review of new and modified sources, including the use of BACT and offsets before a source is allowed to operate. Specifically, an applicant for a permit to operate shall apply BACT to any new or modified source that could result in the potential to emit more than the levels shown in Table 4.
EDAW BAAQMD Revised Draft Options and Justification Report 16 CEQA Thresholds of Significance
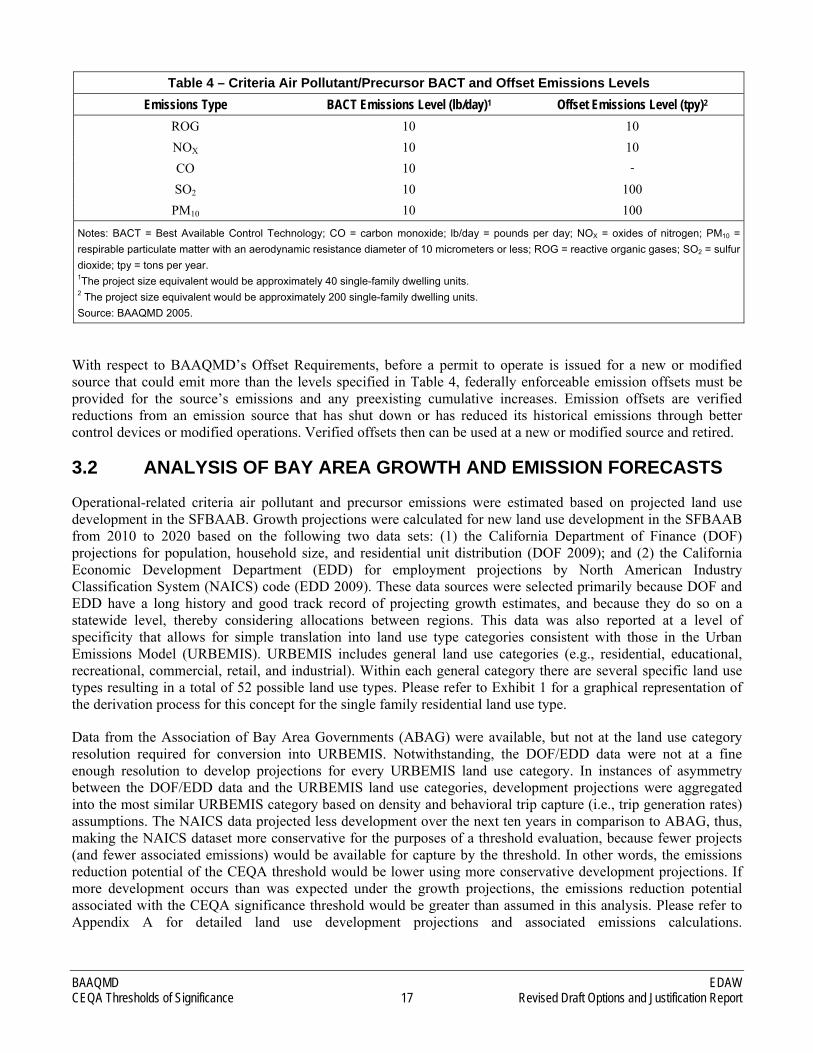
Table 4 – Criteria Air Pollutant/Precursor BACT and Offset Emissions Levels Emissions Type BACT Emissions Level (lb/day)1 Offset Emissions Level (tpy)2
ROG 10 10 NOX 10 10
CO 10 -
SO2 10 100 PM10 10 100
Notes: BACT = Best Available Control Technology; CO = carbon monoxide; lb/day = pounds per day; NOX = oxides of nitrogen; PM10 = respirable particulate matter with an aerodynamic resistance diameter of 10 micrometers or less; ROG = reactive organic gases; SO2 = sulfur dioxide; tpy = tons per year. 1The project size equivalent would be approximately 40 single-family dwelling units. 2 The project size equivalent would be approximately 200 single-family dwelling units. Source: BAAQMD 2005.
With respect to BAAQMD’s Offset Requirements, before a permit to operate is issued for a new or modified source that could emit more than the levels specified in Table 4, federally enforceable emission offsets must be provided for the source’s emissions and any preexisting cumulative increases. Emission offsets are verified reductions from an emission source that has shut down or has reduced its historical emissions through better control devices or modified operations. Verified offsets then can be used at a new or modified source and retired.
3.2 ANALYSIS OF BAY AREA GROWTH AND EMISSION FORECASTS
Operational-related criteria air pollutant and precursor emissions were estimated based on projected land use development in the SFBAAB. Growth projections were calculated for new land use development in the SFBAAB from 2010 to 2020 based on the following two data sets: (1) the California Department of Finance (DOF) projections for population, household size, and residential unit distribution (DOF 2009); and (2) the California Economic Development Department (EDD) for employment projections by North American Industry Classification System (NAICS) code (EDD 2009). These data sources were selected primarily because DOF and EDD have a long history and good track record of projecting growth estimates, and because they do so on a statewide level, thereby considering allocations between regions. This data was also reported at a level of specificity that allows for simple translation into land use type categories consistent with those in the Urban Emissions Model (URBEMIS). URBEMIS includes general land use categories (e.g., residential, educational, recreational, commercial, retail, and industrial). Within each general category there are several specific land use types resulting in a total of 52 possible land use types. Please refer to Exhibit 1 for a graphical representation of the derivation process for this concept for the single family residential land use type.
Data from the Association of Bay Area Governments (ABAG) were available, but not at the land use category resolution required for conversion into URBEMIS. Notwithstanding, the DOF/EDD data were not at a fine enough resolution to develop projections for every URBEMIS land use category. In instances of asymmetry between the DOF/EDD data and the URBEMIS land use categories, development projections were aggregated into the most similar URBEMIS category based on density and behavioral trip capture (i.e., trip generation rates) assumptions. The NAICS data projected less development over the next ten years in comparison to ABAG, thus, making the NAICS dataset more conservative for the purposes of a threshold evaluation, because fewer projects (and fewer associated emissions) would be available for capture by the threshold. In other words, the emissions reduction potential of the CEQA threshold would be lower using more conservative development projections. If more development occurs than was expected under the growth projections, the emissions reduction potential associated with the CEQA significance threshold would be greater than assumed in this analysis. Please refer to Appendix A for detailed land use development projections and associated emissions calculations.
BAAQMD EDAW CEQA Thresholds of Significance 17 Revised Draft Options and Justification Report
EDAW BAAQMD Revised Draft Options and Justification Report 18 CEQA Thresholds of Significance
For residential development, the DOF population, household size, and residential unit distribution projections were used to calculate population-driven residential square footage projections. For non-residential development, EDD projections for employment by NAICS code were used to calculate employment-driven commercial, retail, and industrial development square footage projections. Using type and size distribution data from projects in the SFBAAB that passed through the CEQA process from 2001-2008, the development square footage annual projections were translated into units and project size distributions for each URBEMIS land use category. This uses the 2001 – 2008 profile of proposed development to develop a projected development inventory for new development that would occur over the next ten years (i.e., 2010-2020). Please refer to Appendix B for detailed development projections calculations.
The CEQA Projects Database (Rimpo and Associates 2009), which includes information from environmental documents prepared by lead agencies within BAAQMD’s jurisdiction and filed with the California State Clearinghouse (SCH) during the past eight years (2001-2008), was used to conduct a frequency analysis of projects categorized by land use type and size. Projects for which an Environmental Impact Report (EIR) or Initial Study/Mitigated Negative Declaration (IS/MND) was prepared during the last eight years were distributed over size intervals of 50,000 square feet (sf) by each corresponding URBEMIS land use category to develop frequency distributions of project type and size. These frequency distributions were applied to the total development projections to obtain development forecasts by project size and type in the SFBAAB. This development forecast dataset represents the manner in which the projected development will come under the purview of CEQA in terms of project type and size. It was assumed that past projects proposed in the SFBAAB Area are indicative of project attributes in the future.
It was necessary to forecast these attributes into the future to model the mass emissions for projects of different types and sizes in order to evaluate the sensitivity (e.g., emissions reduction and capture rates) of the threshold level for each pollutant. Projects of a certain size would trigger the CEQA threshold, and would require mitigation. The sensitivity analysis (presented in Section 4) involved adjusting the threshold in order to achieve a balance that attains different amount of emissions reduction. Project size intervals (i.e., “bins”) of 50,000 sf (approximately 28 single family homes) were used to assess the sensitivity of operational criteria air pollutant and precursor threshold levels at different increments to determine a reasonable emissions capture rate which achieves a feasible (as defined by CEQA) amount of emission reductions when considering mitigation effectiveness.
It is important to note that there is an unknown amount of projected development included in the forecast totals that would not be subject to CEQA requirements, because some of the projected development included in the DOF/EDD data would be categorically (e.g., certain infill development projects in urban areas [Class 32; State of California CEQA Guidelines Section 15332]) or statutorily exempt (e.g., actions related to construction of less than 100 low-income housing units in urban areas [California Public Resources Code 21080.14]). Our presumption is that the quantity of potential development that is exempt is not considerable. Data to support this conclusion is incomplete, despite attempts to acquire it throughout the State. First, Notices of Exemption (NOE) are not required to be posted or filed for exempt projects; they are voluntary. Furthermore, NOEs are not required to be filed with the SCH unless a state agency serves as the CEQA lead agency. Otherwise, NOEs only need be filed with the County Clerk’s office. NOEs filed with the SCH represent a small portion of total NOEs, and rarely do NOEs where the State is the lead agency represent development that could be categorized within URBEMIS. Typically, NOEs accompany ministerial actions that do not result in actual development, such as the subdivision of land or modification of an existing use. Further, many exempt development projects are, at some point, largely captured under CEQA, such as through an EIR prepared for a proposed subdivision. The exemption would apply to the building permits for already evaluated projects, in this instance. Projects that are not exempt are typically small, or would otherwise not meet a category that exempts the projects (plus lead agencies cannot, under CEQA, categorically exempt projects that considerably contribute to cumulative impacts or may have potentially significant impacts). Thus, it was concluded that NOEs represent a less-than-substantial portion of total projected development in the SFBAAB.
BAAQMD Revised Draft Options and Justification Report 20 CEQA Thresholds of Significance
Notes: BAAQMD = Bay Area Air Quality Management District; CEQA = California Environmental Quality Act; NOx = oxides of nitrogen; tons/year = tons per year; URBEMIS = Urban Emissions Model.
Exhibit 1: Example Derivation from BAAQMD Single-Family Residential Development Projections
EDAW
Source: Data adapted by EDAW 2009.
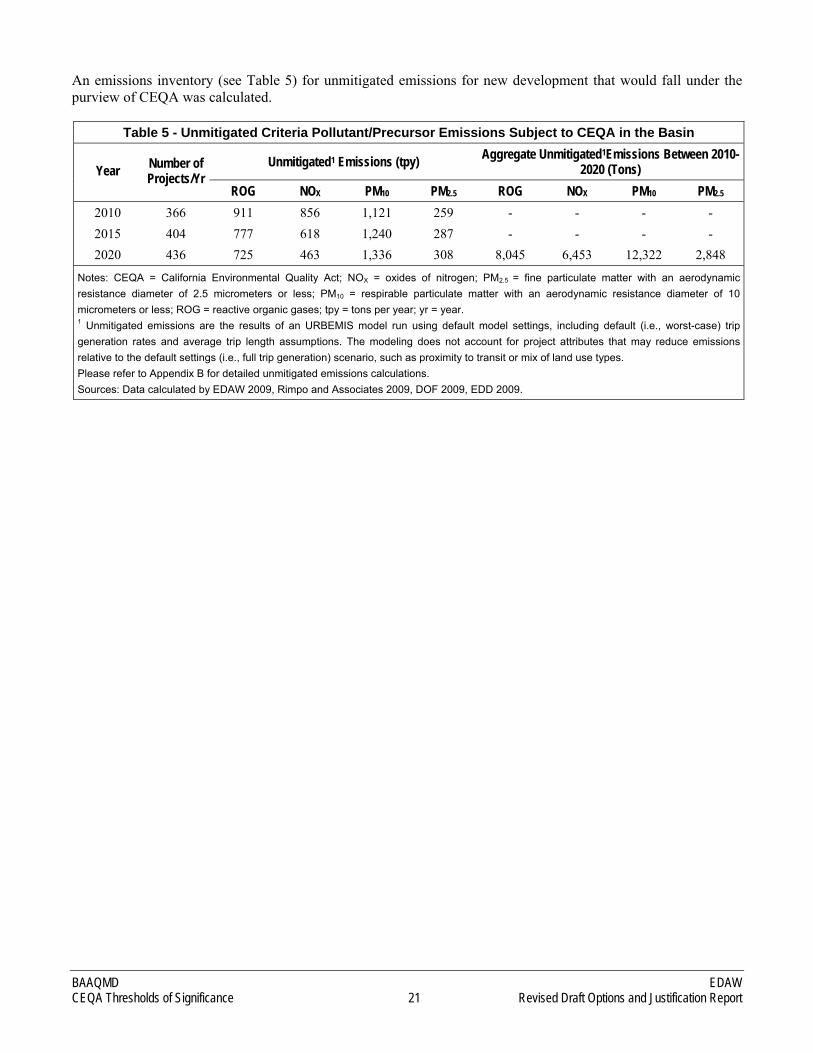
An emissions inventory (see Table 5) for unmitigated emissions for new development that would fall under the purview of CEQA was calculated.
Table 5 - Unmitigated Criteria Pollutant/Precursor Emissions Subject to CEQA in the Basin Aggregate Unmitigated1Emissions Between 2010-
2020 (Tons) Unmitigated1 Emissions (tpy) Year Number of Projects/Yr
Notes: CEQA = California Environmental Quality Act; NOX = oxides of nitrogen; PM2.5 = fine particulate matter with an aerodynamic resistance diameter of 2.5 micrometers or less; PM10 = respirable particulate matter with an aerodynamic resistance diameter of 10 micrometers or less; ROG = reactive organic gases; tpy = tons per year; yr = year. 1 Unmitigated emissions are the results of an URBEMIS model run using default model settings, including default (i.e., worst-case) trip generation rates and average trip length assumptions. The modeling does not account for project attributes that may reduce emissions relative to the default settings (i.e., full trip generation) scenario, such as proximity to transit or mix of land use types. Please refer to Appendix B for detailed unmitigated emissions calculations. Sources: Data calculated by EDAW 2009, Rimpo and Associates 2009, DOF 2009, EDD 2009.
BAAQMD EDAW CEQA Thresholds of Significance 21 Revised Draft Options and Justification Report
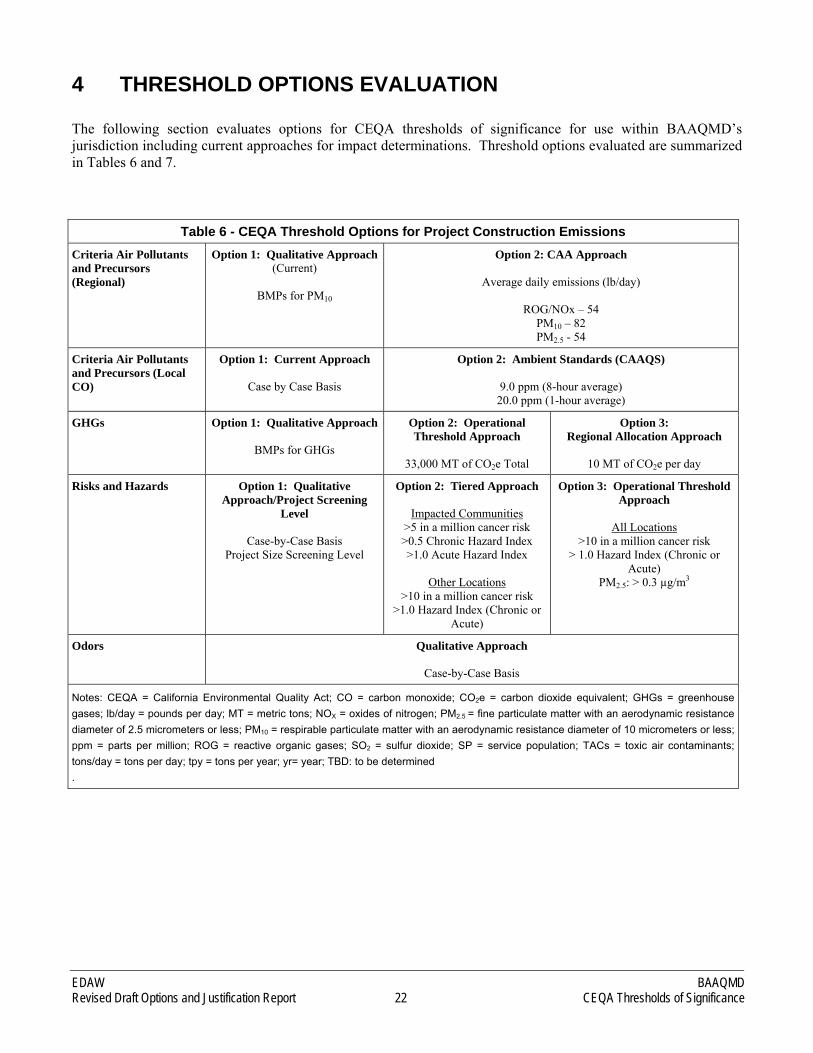
4 THRESHOLD OPTIONS EVALUATION
The following section evaluates options for CEQA thresholds of significance for use within BAAQMD’s jurisdiction including current approaches for impact determinations. Threshold options evaluated are summarized in Tables 6 and 7.
Table 6 - CEQA Threshold Options for Project Construction Emissions Criteria Air Pollutants and Precursors (Regional)
Risks and Hazards Option 1: Qualitative Approach/Project Screening
Level
Case-by-Case Basis Project Size Screening Level
Option 2: Tiered Approach
Impacted Communities >5 in a million cancer risk >0.5 Chronic Hazard Index >1.0 Acute Hazard Index
Other Locations
>10 in a million cancer risk >1.0 Hazard Index (Chronic or
Acute)
Option 3: Operational Threshold Approach
All Locations
>10 in a million cancer risk > 1.0 Hazard Index (Chronic or
Acute) PM2.5: > 0.3 µg/m3
Odors Qualitative Approach
Case-by-Case Basis
Notes: CEQA = California Environmental Quality Act; CO = carbon monoxide; CO2e = carbon dioxide equivalent; GHGs = greenhouse gases; lb/day = pounds per day; MT = metric tons; NOX = oxides of nitrogen; PM2.5 = fine particulate matter with an aerodynamic resistance diameter of 2.5 micrometers or less; PM10 = respirable particulate matter with an aerodynamic resistance diameter of 10 micrometers or less; ppm = parts per million; ROG = reactive organic gases; SO2 = sulfur dioxide; SP = service population; TACs = toxic air contaminants; tons/day = tons per day; tpy = tons per year; yr= year; TBD: to be determined .
EDAW BAAQMD Revised Draft Options and Justification Report 22 CEQA Thresholds of Significance
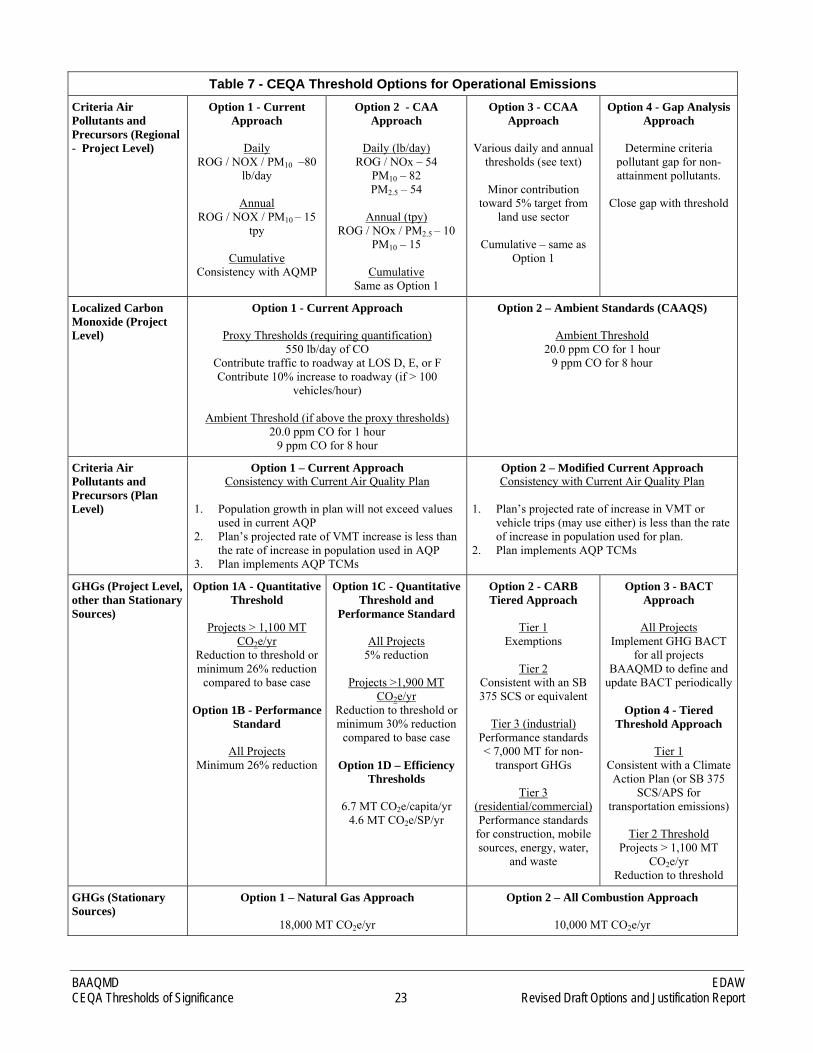
Table 7 - CEQA Threshold Options for Operational Emissions Criteria Air Pollutants and Precursors (Regional - Project Level)
Option 1 - Current Approach
Daily
ROG / NOX / PM10 –80 lb/day
Annual
ROG / NOX / PM10 – 15 tpy
Cumulative
Consistency with AQMP
Option 2 - CAA Approach
Daily (lb/day)
ROG / NOx – 54 PM10 – 82 PM2.5 – 54
Annual (tpy)
ROG / NOx / PM2.5 – 10 PM10 – 15
Cumulative
Same as Option 1
Option 3 - CCAA Approach
Various daily and annual
thresholds (see text)
Minor contribution toward 5% target from
land use sector
Cumulative – same as Option 1
Option 4 - Gap Analysis Approach
Determine criteria
pollutant gap for non-attainment pollutants.
Close gap with threshold
Localized Carbon Monoxide (Project Level)
Option 1 - Current Approach
Proxy Thresholds (requiring quantification) 550 lb/day of CO
Contribute traffic to roadway at LOS D, E, or F Contribute 10% increase to roadway (if > 100
vehicles/hour)
Ambient Threshold (if above the proxy thresholds) 20.0 ppm CO for 1 hour
9 ppm CO for 8 hour
Option 2 – Ambient Standards (CAAQS)
Ambient Threshold 20.0 ppm CO for 1 hour
9 ppm CO for 8 hour
Criteria Air Pollutants and Precursors (Plan Level)
Option 1 – Current Approach Consistency with Current Air Quality Plan
1. Population growth in plan will not exceed values
used in current AQP 2. Plan’s projected rate of VMT increase is less than
the rate of increase in population used in AQP 3. Plan implements AQP TCMs
Option 2 – Modified Current Approach Consistency with Current Air Quality Plan
1. Plan’s projected rate of increase in VMT or
vehicle trips (may use either) is less than the rate of increase in population used for plan.
2. Plan implements AQP TCMs
GHGs (Project Level, other than Stationary Sources)
Option 1A - Quantitative Threshold
Projects > 1,100 MT
CO2e/yr Reduction to threshold or minimum 26% reduction
compared to base case
Option 1B - Performance Standard
All Projects
Minimum 26% reduction
Option 1C - Quantitative Threshold and
Performance Standard
All Projects 5% reduction
Projects >1,900 MT
CO2e/yr Reduction to threshold or minimum 30% reduction
compared to base case
Option 1D – Efficiency Thresholds
6.7 MT CO2e/capita/yr
4.6 MT CO2e/SP/yr
Option 2 - CARB Tiered Approach
Tier 1
Exemptions
Tier 2 Consistent with an SB 375 SCS or equivalent
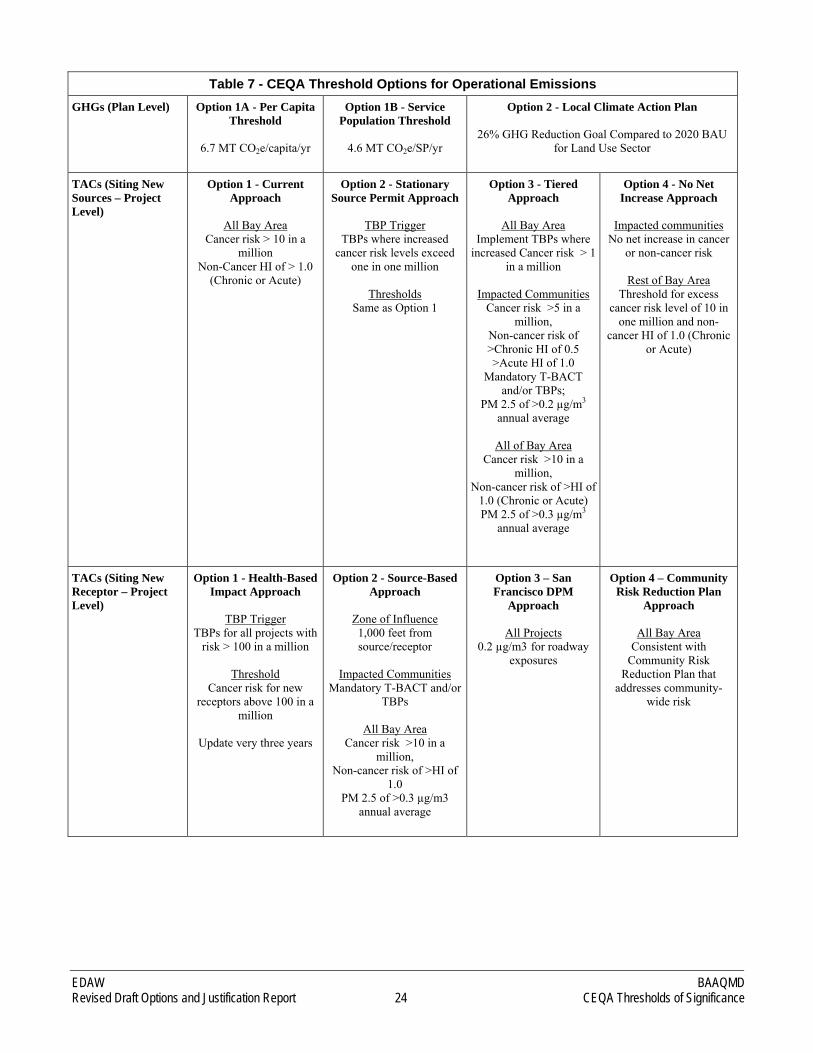
Cancer risk >100 in a million from all zone sources Non-cancer risk of >HI of 1.0 (Chronic or Acute) from all zone sources
PM2.5 of 0.8 µg/m3 annual average from all zone sources
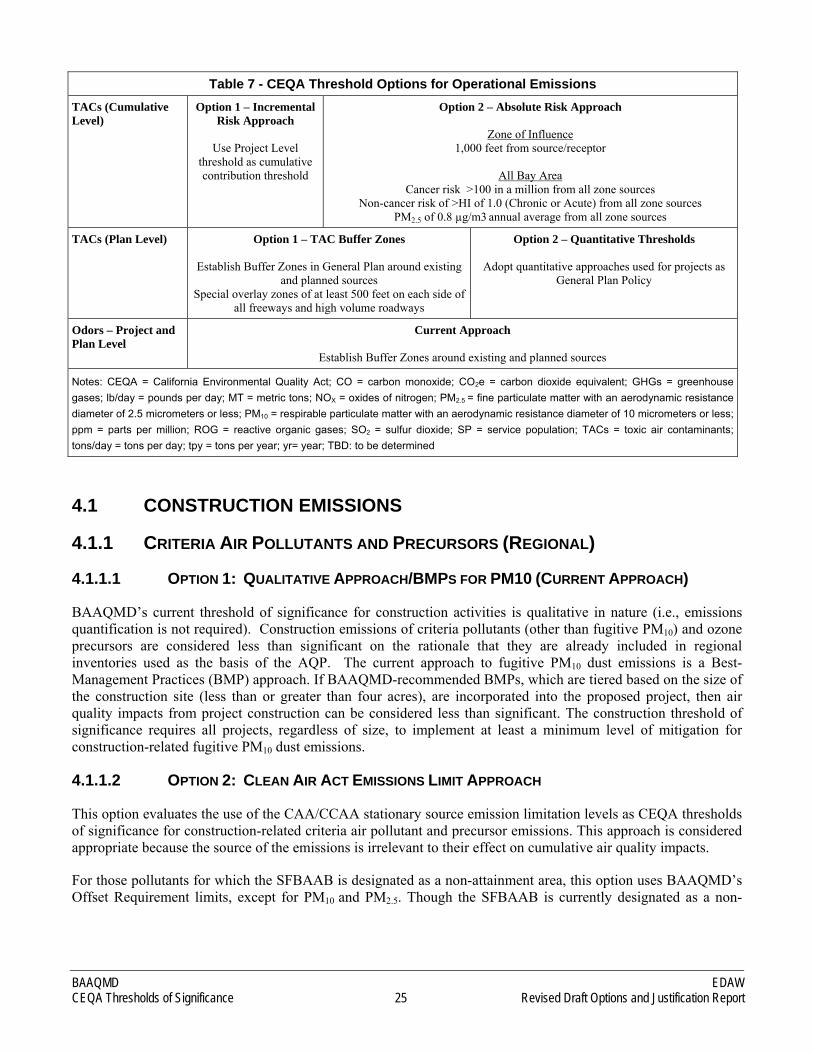
TACs (Plan Level) Option 1 – TAC Buffer Zones
Establish Buffer Zones in General Plan around existing and planned sources
Special overlay zones of at least 500 feet on each side of all freeways and high volume roadways
Option 2 – Quantitative Thresholds
Adopt quantitative approaches used for projects as General Plan Policy
Odors – Project and Plan Level
Current Approach
Establish Buffer Zones around existing and planned sources
Notes: CEQA = California Environmental Quality Act; CO = carbon monoxide; CO2e = carbon dioxide equivalent; GHGs = greenhouse gases; lb/day = pounds per day; MT = metric tons; NOX = oxides of nitrogen; PM2.5 = fine particulate matter with an aerodynamic resistance diameter of 2.5 micrometers or less; PM10 = respirable particulate matter with an aerodynamic resistance diameter of 10 micrometers or less; ppm = parts per million; ROG = reactive organic gases; SO2 = sulfur dioxide; SP = service population; TACs = toxic air contaminants; tons/day = tons per day; tpy = tons per year; yr= year; TBD: to be determined
4.1 CONSTRUCTION EMISSIONS
4.1.1 CRITERIA AIR POLLUTANTS AND PRECURSORS (REGIONAL)
4.1.1.1 OPTION 1: QUALITATIVE APPROACH/BMPS FOR PM10 (CURRENT APPROACH)
BAAQMD’s current threshold of significance for construction activities is qualitative in nature (i.e., emissions quantification is not required). Construction emissions of criteria pollutants (other than fugitive PM10) and ozone precursors are considered less than significant on the rationale that they are already included in regional inventories used as the basis of the AQP. The current approach to fugitive PM10 dust emissions is a Best-Management Practices (BMP) approach. If BAAQMD-recommended BMPs, which are tiered based on the size of the construction site (less than or greater than four acres), are incorporated into the proposed project, then air quality impacts from project construction can be considered less than significant. The construction threshold of significance requires all projects, regardless of size, to implement at least a minimum level of mitigation for construction-related fugitive PM10 dust emissions.
4.1.1.2 OPTION 2: CLEAN AIR ACT EMISSIONS LIMIT APPROACH
This option evaluates the use of the CAA/CCAA stationary source emission limitation levels as CEQA thresholds of significance for construction-related criteria air pollutant and precursor emissions. This approach is considered appropriate because the source of the emissions is irrelevant to their effect on cumulative air quality impacts.
For those pollutants for which the SFBAAB is designated as a non-attainment area, this option uses BAAQMD’s Offset Requirement limits, except for PM10 and PM2.5. Though the SFBAAB is currently designated as a non-
BAAQMD EDAW CEQA Thresholds of Significance 25 Revised Draft Options and Justification Report
attainment area for both PM10 and PM2.54, the federal NSR Significant Emission Rate limits of 15 and 10 tons per
year, respectively, are recommended for this option as BAAQMD has not established an Offset Requirement limit for PM2.5
2.5
and the existing limit of 100 tons per year under the federal PSD program is much less stringent and would not be appropriate in light of our pending nonattainment designation for the federal 24-hour PM standard. The BACT Requirement limits as shown in Table 8 represent the levels at which, if exceeded, stationary sources must install common control devices. However, stationary sources are still allowed to result in emissions up to the offset requirement and above if federally enforceable offsets are provided. With respect to construction sources, analogous common control devices include increasingly stringent tailpipe standards for off-road equipment, after-market controls such as diesel particulate matter traps and oxidation catalysts.
CARB’s new off-road regulations will require the use of newer equipment with lower emission rates and retrofitting of older equipment with after-market controls. These statewide regulations will essentially require the equivalent of installing BACT on all off-road construction equipment over the next several years. Therefore, it would be appropriate to set a threshold level of significance at the NSR offset level to be consistent with this approach. Thus, utilization of the BACT Requirements as thresholds of significance for CEQA would result in achieving considerably more emission reductions from land use development than is needed to achieve air quality goals. The federal NSR Significant Emission Rate and BAAQMD’s Offset Requirement limits are identified in regulation on an annual basis (in units of tons per year). For this option, the applicable limits were converted to average daily emissions (pounds per day) for each threshold of significance, as shown in Table 8. This is appropriate because of the short-term intermittent nature of construction activities and, if emissions would not exceed these average daily threshold emission levels, the project would also not exceed the annual levels.
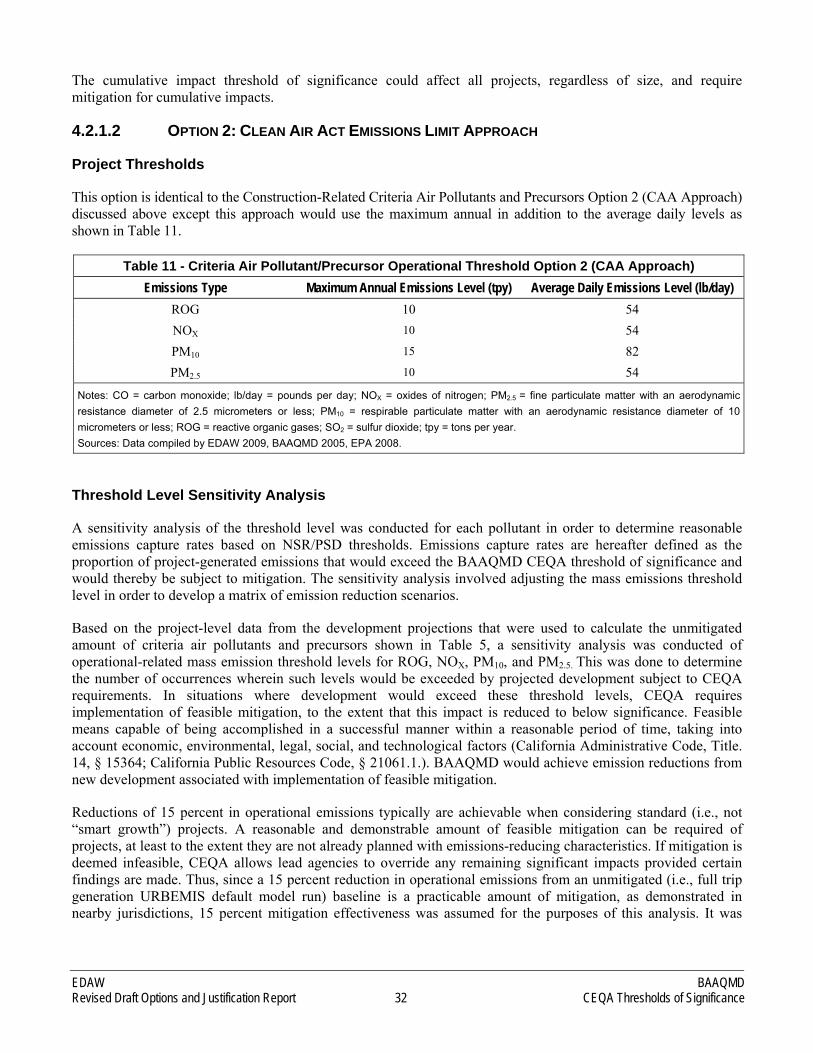
Table 8 - Criteria Air Pollutant/Precursor Construction Threshold Option 2 (CAA Approach) Emissions Type BACT (lb/day) Average Daily Emissions Level (lb/day)
ROG 10 54 NOX 10 54
CO 10 547
SO2 10 219 PM10 10 82
PM2.5 10 54
Notes: CO = carbon monoxide; lb/day = pounds per day; NOX = oxides of nitrogen; PM2.5 = fine particulate matter with an aerodynamic resistance diameter of 2.5 micrometers or less; PM10 = respirable particulate matter with an aerodynamic resistance diameter of 10 micrometers or less; ROG = reactive organic gases; SO2 = sulfur dioxide. Sources: Data compiled by EDAW 2009, BAAQMD 2005, EPA 2008.
All of these levels are used within current regulations and thus are consistent with thresholds for federal NSR, and associated definitions of significant emissions limits for criteria air pollutants and precursors.
4.1.1.3 STAFF RECOMMENDATION AND JUSTIFICATION
Staff recommends a hybrid approach of the two approaches described above regarding exhaust emissions and fugitive dust. While our current Guidelines considered construction exhaust emissions controlled by the overall air quality plan, the implementation of new and more stringent state and federal standards over the past ten years now warrants additional control of this source of emissions. The CAA approach for criteria pollutant construction thresholds and thus the average daily criteria air pollutant and precursor emission levels shown in Table 8 for
4 The SFBAAB is designated nonattainment for the state annual and 24-hour PM10 and PM2.5 standards and anticipates being designated nonattainment for the federal 24-hour PM2.5 standard.
EDAW BAAQMD Revised Draft Options and Justification Report 26 CEQA Thresholds of Significance
ROG, NOx, and PM are recommended as the thresholds of significance for construction activity for exhaust emissions. These thresholds represent the levels above which a project’s individual emissions would result in a considerable contribution (i.e., significant) to the SFBAAB’s existing non-attainment air quality conditions and thus establish a nexus to regional air quality impacts that satisfies CEQA requirements for evidence-based determinations of significant impacts.
For fugitive dust emissions, staff recommends following the current best management practices approach which has been a pragmatic and effective approach to the control of fugitive dust emissions. Studies have demonstrated (Western Regional Air Partnership, U.S.EPA) that the application of best management practices at construction sites have significantly controlled fugitive dust emissions. Individual measures have been shown to reduce fugitive dust by anywhere from 30 percent to more than 90 percent. In the aggregate best management practices will substantially reduce fugitive dust emissions from construction sites. These studies support staff’s recommendation that projects implementing construction best management practices will reduce fugitive dust emissions to a less than significant level.
Regional concentration levels of CO in the SFBAAB have not exceeded the CAAQS in the past 11 years and sulfur dioxide (SO2) concentrations have never exceeded the standards (EPA 2009). Construction-related SO2 emissions represent a negligible portion of total basin-wide emissions and construction-related CO emissions represent less than five percent of the SFBAAB total basin-wide CO emissions. BAAQMD has demonstrated that attainment pollutants are sufficiently controlled by air quality plans and regulations and thus no quantitative thresholds for construction are recommended for CO or SO2 for evaluation of impacts to regional air quality.
4.1.2 LOCAL CARBON MONOXIDE
4.1.2.1 OPTION 1 - CURRENT APPROACH
BAAQMD has no formal guidance for the evaluation of construction localized carbon monoxide impact given that the volumes necessary to result in a health-based CO impact are rarely reached due to construction traffic. Thus, the current approach is left to the case by case considerations of CEQA lead agencies. 4.1.2.2 OPTION 2 - AMBIENT STANDARDS
As a localized pollutant, this approach for evaluation of carbon monoxide impacts would be based on ambient concentration limits set by the California Clean Air Act for Carbon Monoxide and Appendix G of the State of California CEQA Guidelines. The CAAQS of 20.0 ppm and 9 ppm for 1-hour and 8-hour CO, respectively, would be used as the thresholds of significance for localized concentrations of CO. This approach is described further below in the discussion of operational thresholds.
4.1.2.3 STAFF RECOMMENDATION AND JUSTIFICATION
BAAQMD staff recommends Option 1 – Current Approach for consideration of construction CO emissions. As noted above, health-based CO impacts rarely arise due to construction traffic and thus there is little potential for significant impacts to occur for the vast majority of projects. Instead, it is recommended that CEQA lead agencies consider the potential for CO impacts on a case by case that would focus only on the largest of construction projects. 4.1.3 GREENHOUSE GASES
According to the greenhouse gas inventory developed by BAAQMD, GHG emissions from construction activities represent a relatively small portion (less than two percent) of the overall GHG emissions inventory in the Bay Area. Staff has identified three potential approaches to set a significance threshold for construction GHG emissions. Because constructions GHG emissions were not included in the land use-driven sectors analyzed for
BAAQMD EDAW CEQA Thresholds of Significance 27 Revised Draft Options and Justification Report
the operational GHG threshold, they were analyzed as a separate GHG emissions sector. While there are other approaches to defining GHG thresholds, such as a percent reduction approach, these are the three approaches that staff finds to be the most promising to achieve AB32 goals. All options analyzed here identify cumulatively significant threshold options.
4.1.3.1 OPTION 1: QUALITATIVE APPROACH/BMPS FOR GHGS
This approach is similar to the current approach to construction fugitive dust emissions. Quantitative evaluation of construction emissions would not be required for GHGs. Instead, all projects would be required to implement a suite of construction BMPs to reduce GHGs. A list of BMPs would need to be developed by BAAQMD and would need to be updated periodically to reflect changes in technology, feasibility, and cost-effectiveness. Initial BMPs could include, but need not be limited to the following: use of alternatives fuels (biodiesel, electricity, etc.) for at least 15 percent of the construction fleet; reduction of equipment idling beyond existing ARB regulations; worker carpooling and use of worker shuttles; a minimum use of 10 percent local building materials (to reduce material lifecycle GHGs), and recycling/diversion of a minimum of 50 percent of construction and demolition waste.
4.1.3.2 OPTION 2: OPERATIONAL THRESHOLD APPROACH
This approach includes the same CEQA threshold of significance for construction-related GHG emissions as that for project operations, which is discussed in detail herein. Assuming that a project has an operational lifetime of approximately 30 years, the aggregate operational GHG emissions associated with a project that would generate 1,100 metric tons (MT) of carbon dioxide equivalent (CO2e) emissions per year (See Operational Option 1A discussion below) would result in approximately 33,000 MT of CO2e emissions over the 30–year operational life of the project. Thus, if a project would result in GHG emissions greater than 33,000 MT of CO2e over the duration of construction, the impact would be considered significant.
4.1.3.3 OPTION 3: REGIONAL ALLOCATION APPROACH
The goal of this approach is to reduce the projected 2020 emissions associated with construction activities to the 1990 level, the overall goal of AB 32, by setting a per project threshold, that when aggregated, the total annual construction emissions would not exceed the total 1990 inventory levels in 2020. BAAQMD’s current CO2e emissions inventory estimated that in 1990 CO2e emissions from construction activities were 1.3 million metric tons (MMT) CO2e for off-road construction equipment. In addition, about five percent of the on-road medium/heavy duty truck CO2e emissions inventory is attributed to construction debris and material haul trips, which equals 0.2 MMT CO2e per year. Therefore, the total 1990 inventory for construction-related CO2 emissions is 1.5 MMT, whereas the total projected 2020 construction-related emissions inventory is 2.9 MMT CO2e. It is also estimated that approximately 4,000 development projects would be constructed in the SFBAAB between 2010 and 2020, or an average of 400 projects per year. The threshold of significance can be established by spreading the goal of 1.5 MMT over the 400 projects (1,500,000/400 equals 3,750 tons/year, or 10.3 metric tons/day). Therefore, projects with construction CO2e emissions above 10 metric tons per day (tons/day) would be considered to have a significant impact.
4.1.3.4 STAFF RECOMMENDATION AND JUSTIFICATION
Staff does not recommend a construction GHG threshold at this time because there is not sufficient evidence to determine a level at which construction emissions are significant. Staff recommends a case-by-case consideration of construction GHG emissions and encourages project applicants to implement construction GHG reduction strategies where feasible. The Air District will develop a list of best management practices, such as alternative fuels, use of local materials, and recycling of construction and demolition waste, to provide lead agencies with strategies that reduce greenhouse gas emissions from construction.
EDAW BAAQMD Revised Draft Options and Justification Report 28 CEQA Thresholds of Significance
A BMP approach (Option1), can be effective to promote on-site emissions reductions yet allow flexibility for a wide range of construction applications. If lead agencies require all projects to implement the BMPs identified by the Air District, GHG emission reductions will be achieved during construction activity. However, a BMP approach requires that a finding can be made that the recommended measures will indeed reduce the impact to a less than significant level. Since Staff cannot substantiate such a finding at this time, this approach is not recommended.
As shown by Option 2 and Option 3, quantitative threshold approaches to construction emissions do not at present represent reasonable approaches to determining significance. Options 2 and 3 would result in an emissions threshold for construction that is so large that only truly large projects would be required to conduct any mitigation, whereas a BMP approach requires feasible measures for all projects which would result in lower emission levels overall. Thus, neither of the quantitative thresholds provides sufficient nexus and proportionality to demonstrate a significant impact tied to the impact level and severity.
This approach entails using the “Expose sensitive receptors to substantial pollutant concentrations” question as contained in the State of California CEQA Guidelines’ Appendix G checklist to determine the significance of construction-related TAC emissions on a case-by-case basis.
This option does not include a recommendation for a numeric threshold of significance for construction-related TAC emissions, which is consistent with BAAQMD’s current approach. Construction work could result in the generation of diesel PM, which ARB has designated as a TAC, from the use of off-road heavy-duty equipment during site grading, excavation, material transport, paving, and other construction activities. However, due to the variable nature of such activities, the generation of TAC emissions in most cases would be temporary, especially considering the short amount of time such heavy-duty equipment are typically within an influential distance (e.g., 70 percent reduction at approximately 500 feet from mobile sources [ARB 2005]) to nearby sensitive receptors (i.e., people or facilities that generally house people [e.g., schools, hospitals, residences]) that may experience adverse effects from unhealthful concentrations of air pollutants. In addition, current models and methodologies for conducting health risk assessments are associated with longer-term exposure periods of 9, 40, and 70 years, which do not correlate well with the temporary and highly variable nature of construction activities resulting in difficulties with producing accurate modeling results.
Staff is currently assessing the size of a construction project where an assessment of the health risk to nearby receptors would be warranted. A recommended screening level for assessing a construction project’s health risks will be provided in the methodologies section of the BAAQMD CEQA Guidelines update.
4.1.4.2 OPTION 2: TIERED QUANTITATIVE THRESHOLD
This approach entails using the same risk thresholds in specific geographic areas developed below as potential operational quantitative thresholds (see discussion below). Construction emissions would need to be quantified where they occur in proximity to sensitive receptors. The threshold for incremental increase in risks would be a 10 in a million risk of cancer and a chronic or acute Hazard Index of 1.0 for all locations other than CARE communities. Within CARE communities, the threshold would be an incremental increase of 5 in a million risk of cancer, a chronic Hazard Index of 0.5 and an acute Hazard Index of 1.0.
4.1.4.3 OPTION 3: QUANTITATIVE THRESHOLDS
This approach entails using the same thresholds throughout the Bay Area for operations (see discussion below). Construction emissions would need to be quantified where they occur in proximity to sensitive receptors.
BAAQMD EDAW CEQA Thresholds of Significance 29 Revised Draft Options and Justification Report
Thresholds would be an increased excess cancer risk of 10.0 in a million and a chronic or acute Hazard Index of 1.0 throughout the Bay Area.
In addition, this approach would also include a quantitative PM2.5 average annual concentration increase threshold of 0.3 µg/m3. This concentration is the U.S. EPA staff-proposed Significant Impact level (SIL) for PM2.5. The SIL is a threshold applied to individual facilities that apply for a permit to emit a regulated pollutant in an area that meets the NAAQS. The state and EPA must determine if emissions from that facility will cause the air quality to worsen. If an individual facility projects an increase in emissions that result in an increase greater than the established SIL, the permit applicant would be required to perform additional analyses to determine if those impacts will be more than the amount of the PSD increment.
4.1.4.4 STAFF RECOMMENDATION AND JUSTIFICATION
BAAQMD staff recommends Option 3 – Quantitative Thresholds as the approach for construction risks and hazards emissions. Risks due to toxic emissions from construction, though temporary, can still result in substantial public health impacts due to increased cancer and non-cancer risk. Applying a quantitative threshold allows a rigorous standardized method of determining when a construction project will cause a significant increase in cancer and non-cancer risks. Regarding the use of the proposed USEPA SIL for PM2.5, under the Clean Air Act, the SIL is a measure of whether a source may cause or contribute to a violation of PSD increment or the NAAQS, which by definition would represent a significant deterioration of air quality and thus in an appropriate significance threshold under CEQA.
Staff recommends a case-by-case consideration of a project’s cumulative construction risk impact. A cumulative analysis of a project’s construction TAC impacts should be considered if there is a substantial overlap of projects or there is a major source of TAC nearby.
4.1.5 ODORS
Conventional construction-related activities typically do not result in the generation of odor emissions. As shown in Table 9, odor complaints are rarely due to construction.
Table 9 - Historical Bay Area Construction Site-Related Odor Complaints Year Total Complaints Construction Site Complaints Construction Percent of Total 2005 2,110 24 1.1% 2006 2,563 29 1.1% 2007 1,760 29 1.6% 2008 1,719 23 1.3%
Average 2,038 26 1.3% Therefore, it is recommended that BAAQMD not adopt a numeric significance threshold for construction-related odor impacts, which is consistent with BAAQMD’s current approach. A further consideration for not adopting a specific threshold is that the other construction thresholds recommended above will also cause concomitant reduction of odors at construction sites. It is recommended instead to allow individual lead agencies to address this issue on a case-by-case basis, taking into consideration the specific construction-related characteristics of each project and proximity of off-site receptors.
EDAW BAAQMD Revised Draft Options and Justification Report 30 CEQA Thresholds of Significance
4.2 OPERATIONAL-RELATED IMPACTS
4.2.1 CRITERIA AIR POLLUTANTS AND PRECURSORS (REGIONAL)
4.2.1.1 OPTION 1: CURRENT APPROACH
Project Impact Thresholds
At the project level, BAAQMD currently recommends that a proposed project that is estimated to generate operational criteria air pollutant or ozone precursor emissions in excess of the annual or daily thresholds shown in Table 10 should be considered to have a significant air quality impact. These thresholds of significance would be exceeded by an unmitigated project size approximately equivalent to a 430-unit single family subdivision.
Notes: kg/day = kilograms per day; lb/day = pounds per day; NOX = oxides of nitrogen; PM10 = respirable particulate matter with an aerodynamic resistance diameter of 10 micrometers or less; ROG = reactive organic gases; tpy = tons per year. Source: BAAQMD 1999.
Cumulative Impact Analysis
With respect to cumulative impacts of criteria pollutants and ozone precursors, BAAQMD’s current approach is that any proposed project (excluding plans) that would individually have a significant air quality impact would also be considered to have a significant cumulative air quality impact. For any project that does not individually result in significant operational-related air quality impacts, the determination of a significant cumulative impact should be based on an evaluation of the consistency of the project with the local general plan and of the general plan with the regional air quality plan. The appropriate regional air quality plan for the SFBAAB is the most recently adopted air quality plan [AQP] that has been developed in response to the CCAA.
If a project is proposed in a city or county with a general plan that is consistent with the AQP and the project is consistent with that general plan (i.e., does not require a general plan amendment [GPA]), then the project would not have a significant cumulative impact (provided, of course, the project does not individually have any significant impacts). No further analysis regarding cumulative impacts is necessary.
In a jurisdiction with a general plan consistent with the AQP, a project may be proposed that is not consistent with that general plan because it requires a General Plan Amendment (GPA). In such instances, the cumulative impact analysis should consider the difference(s) between the project and the original (pre-GPA) land use designation for the site with respect to motor vehicle use and potential land use conflicts. In this case, a project would not have a significant cumulative impact if the vehicle miles traveled (VMT) from the project would not be greater than the VMT that would be anticipated under the original land use designation.
For a project in a city or county with a general plan that is not consistent with the AQP, the cumulative impact analysis is based on the combined impacts of the proposed project and past, present and reasonably anticipated future projects. A project would have a significant cumulative impact if these combined impacts would exceed any of the thresholds established above for project operations.
BAAQMD EDAW CEQA Thresholds of Significance 31 Revised Draft Options and Justification Report
The cumulative impact threshold of significance could affect all projects, regardless of size, and require mitigation for cumulative impacts.
4.2.1.2 OPTION 2: CLEAN AIR ACT EMISSIONS LIMIT APPROACH
Project Thresholds
This option is identical to the Construction-Related Criteria Air Pollutants and Precursors Option 2 (CAA Approach) discussed above except this approach would use the maximum annual in addition to the average daily levels as shown in Table 11.
Table 11 - Criteria Air Pollutant/Precursor Operational Threshold Option 2 (CAA Approach) Emissions Type Maximum Annual Emissions Level (tpy) Average Daily Emissions Level (lb/day)
ROG 10 54 NOX 10 54
PM10 15 82
PM2.5 54 10
Notes: CO = carbon monoxide; lb/day = pounds per day; NOX = oxides of nitrogen; PM2.5 = fine particulate matter with an aerodynamic resistance diameter of 2.5 micrometers or less; PM10 = respirable particulate matter with an aerodynamic resistance diameter of 10 micrometers or less; ROG = reactive organic gases; SO2 = sulfur dioxide; tpy = tons per year. Sources: Data compiled by EDAW 2009, BAAQMD 2005, EPA 2008.
Threshold Level Sensitivity Analysis
A sensitivity analysis of the threshold level was conducted for each pollutant in order to determine reasonable emissions capture rates based on NSR/PSD thresholds. Emissions capture rates are hereafter defined as the proportion of project-generated emissions that would exceed the BAAQMD CEQA threshold of significance and would thereby be subject to mitigation. The sensitivity analysis involved adjusting the mass emissions threshold level in order to develop a matrix of emission reduction scenarios.
Based on the project-level data from the development projections that were used to calculate the unmitigated amount of criteria air pollutants and precursors shown in Table 5, a sensitivity analysis was conducted of operational-related mass emission threshold levels for ROG, NOX, PM10, and PM2.5. This was done to determine the number of occurrences wherein such levels would be exceeded by projected development subject to CEQA requirements. In situations where development would exceed these threshold levels, CEQA requires implementation of feasible mitigation, to the extent that this impact is reduced to below significance. Feasible means capable of being accomplished in a successful manner within a reasonable period of time, taking into account economic, environmental, legal, social, and technological factors (California Administrative Code, Title. 14, § 15364; California Public Resources Code, § 21061.1.). BAAQMD would achieve emission reductions from new development associated with implementation of feasible mitigation.
Reductions of 15 percent in operational emissions typically are achievable when considering standard (i.e., not “smart growth”) projects. A reasonable and demonstrable amount of feasible mitigation can be required of projects, at least to the extent they are not already planned with emissions-reducing characteristics. If mitigation is deemed infeasible, CEQA allows lead agencies to override any remaining significant impacts provided certain findings are made. Thus, since a 15 percent reduction in operational emissions from an unmitigated (i.e., full trip generation URBEMIS default model run) baseline is a practicable amount of mitigation, as demonstrated in nearby jurisdictions, 15 percent mitigation effectiveness was assumed for the purposes of this analysis. It was
EDAW BAAQMD Revised Draft Options and Justification Report 32 CEQA Thresholds of Significance
assumed that all of the projects that would trigger the CEQA thresholds would attempt to mitigate their emissions by at least 15 percent or down to the level of the threshold as required by CEQA.5 It is the policy of the State that public agencies should not approve projects as proposed if there are feasible alternatives or feasible mitigation measures which will avoid or substantially lessen the significant environmental effects of such projects.
Results of the threshold sensitivity analysis are presented in Table 12.
For state and federal criteria air pollutants for which the SFBAAB is currently in attainment (e.g., CO, SO2), the operational thresholds were not evaluated in the sensitivity analysis because it is not foreseeable that there would be any impacts from these constituents. Concentration levels of CO in the SFBAAB have not exceeded the CAAQS in the past 11 years and sulfur dioxide (SO2) concentrations have never exceeded the standards (EPA 2009). BAAQMD has demonstrated that attainment pollutants are sufficiently controlled by air quality plans and regulations, thus, significant air quality impacts for CO and SO2 emissions would not be expected to occur as a result of a project’s operational-related emissions and quantitative thresholds are not included in this option for these pollutants.
Cumulative Thresholds
The non-attainment status of regional pollutants is a result of past and present development within the SFBAAB. Without the large scale of development that has occurred throughout the SFBAAB, non-attainment would not have occurred. Thus, this regional impact is a cumulative impact, and projects would adversely affect this impact only on a cumulative basis. No single project would be sufficient in size, by itself, to result in non-attainment of the regional air quality standards. Consequently, the thresholds of significance discussed above are the amount of pollution that is deemed cumulatively considerable and, therefore, a significant adverse air quality impact.
4.2.1.3 OPTION 3: CALIFORNIA CLEAN AIR ACT APPROACH
This approach is similar to Option 2, but uses a measurement of percent emissions reduction relative to the total emissions inventory as the supporting basis for each threshold level.
The CCAA requires a five percent per year reduction from the total emissions inventory. If a non-attainment area cannot achieve the five percent per year goal, the CCAA requires the area to implement all feasible measures to attain the state standards as soon as possible. If compounded annually between 2010 and 2020, a total of 38.75 percent reduction from the emissions inventory would be required. Table 13 summarizes the quantity of BAAQMD’s emissions inventory reduction required by the CCAA during the period from 2010 through 2020 in tons/day.
The CEQA threshold developed with Option 3 is intended to contribute a portion of that five percent per year requirement. Table 14 summarizes the amount of emissions reduction achieved through various CEQA significance threshold levels evaluated. The values were calculated in the same manner as in Option 2, except in units of tons/day. The column labeled “% Reductions of 2020 Inventory” lists by how much each threshold would reduce the business as usual 2020 inventory. As shown these thresholds would reduce the 2020 inventory between 1.4 and 2.7 percent for ROG, between 0.2 and 1.5 percent for NOx, between 0.1 and 7.2 percent for PM10 and 1.7 to 2.6 percent of PM2.5. These reductions would, for the most part contribute incrementally toward meeting the CCAA requirement of 5 percent per year (or 38.75 percent by 2020) for NOx, ROG, and PM2.5. These reductions would contribute substantially towards meeting the CCAA requirement for PM10, whereas the NSR, Rule 2 Offset, and Rule 2 BACT thresholds would result in 4 to 7 percent reductions in PM10 emissions which correspond to 13 to 24 percent of the overall CCAA reductions needed by 2020. The remaining emission reductions would need to be achieved through other control measures and regulations in BAAQMD’s jurisdiction.
5 California Public Resources Code Section 21002; See Laurel Heights I, 47 Cal.3d at 400-401
BAAQMD EDAW CEQA Thresholds of Significance 33 Revised Draft Options and Justification Report
EDAW BAAQMD Revised Draft Options and Justification Report 34 CEQA Thresholds of Significance
For cumulative impact analysis, this option would use the same approach as Option 2.
4.2.1.4 OPTION 4: QUANTITATIVE THRESHOLD, GAP ANALYSIS
This approach would involves using the same “gap” analysis described below under Operational GHG threshold Option 1 to determine a quantitative threshold for criteria pollutants and ozone precursors. The analysis would examine all sources of criteria pollutants and ozone precursors, the effect of current regulations and programs (such as the Diesel Risk Reduction Plan), the feasibility of project-specific mitigation, and then allocate an overall “budget” of emissions reductions to the land use sector subject to CEQA. This approach was not developed further given that regulatory bases for establishment of a quantitative threshold already exist in the form of the CAA and CCAA.
Table 12 - Criteria Air Pollutant/Precursor Operational Threshold Option 2 (CAA Approach) Sensitivity Analysis Basis of
Threshold Mass Emissions Threshold Level
(tpy)
Aggregate Emissions Reduction From Mitigation Between 2010-2020 (Tons)1
Notes: BAAQMD = Bay Area Air Quality Management District; BACT = Best Available Control Technology; NSR = New Source Review; NOX = oxides of nitrogen; PM2.5 = fine particulate matter with an aerodynamic resistance diameter of 2.5 micrometers or less; PM10 = respirable particulate matter with an aerodynamic resistance diameter of 10 micrometers or less; ROG = reactive organic gases; tpy = tons per year. 1Unmitigated Emissions from Land Use Development between 2010 and 2020) 2 Emissions capture refers to the portion of emissions that would exceed the CEQA significance threshold and would thereby be subject to mitigation. Similarly, project capture refers to the portion of projects that would result in emissions that exceed the CEQA significance threshold and would be subject to mitigation. 3 Project size equivalent is determined by the limiting pollutant (i.e., whichever threshold is exceeded first). 4 The mass emission level of 5 tpy represents a moderate scenario between offset levels and BACT levels. 5 tpy is not based on regulation or defined by BAAQMD as an emissions level of importance, but presented here for informational purposes only. Please refer to Appendix C for detailed unmitigated emissions calculations. Sources: Data calculated by EDAW 2009, DOF 2009, EDD 2009, Rimpo and Associates 2009.
Table 13 - Criteria Pollutant/Precursor Emissions with CCAA Five Percent per Year Reduction BAAQMD Emissions Inventory (2010)
(tons/day) BAAQMD Inventory with CCAA Required Reduction
Notes: BAAQMD = Bay Area Air Quality Management District; CCAA = California Clean Air Act; NOX = oxides of nitrogen; PM2.5 = fine particulate matter with an aerodynamic resistance diameter of 2.5 microns or less; PM10 = respirable particulate matter with an aerodynamic resistance diameter of 10 microns or less; ROG = reactive organic gases; tons/day = tons per day. Source: BAAQMD 2009.
BAAQMD EDAW CEQA Thresholds of Significance 35 Revised Draft Options and Justification Report
EDAW CEQA Thresholds of Significance 36 Revised Draft Options and Justification Report
Notes: BAAQMD = Bay Area Air Quality Management District; BACT = Best Available Control Technology; CCAA = California Clean Air Act; NSR = New Source Review; NOX = oxides of nitrogen; PM2.5 = fine particulate matter with an aerodynamic resistance diameter of 2.5 microns or less; PM10 = respirable particulate matter with an aerodynamic resistance diameter of 10 microns or less; ROG = reactive organic gases; tons/day = tons per day; tpy =tons per year. 1 Project size equivalent is determined by the limiting pollutant (i.e., whichever threshold is exceeded first). 2 The mass emission level of 5 tpy represents a moderate scenario between offset levels and BACT levels. 5 tpy is not based on regulation or defined by BAAQMD as an emissions level of importance, but presented here for informational purposes only. Please see Table 11 for % project and emission capture rates associated with these mass emission levels. Please refer to Appendix C for detailed unmitigated emissions calculations. Sources: Data calculated by EDAW 2009, DOF 2009, EDD 2009, Rimpo and Associates 2009.
BAAQMD
4.2.1.5 STAFF RECOMMENDATION AND JUSTIFICATION
BAAQMD staff recommends Option 2 and the average daily and maximum annual criteria air pollutant and precursor levels shown in Table 11 as the thresholds of significance that are derived from the information above (i.e., federal NSR Significant Emission Rate and BAAQMD Offset Requirement limits). This option applies the federal BAAQMD Offset Requirements to ozone precursors for which the SFBAAB is designated as a non-attainment area which is an appropriate approach to prevent further deterioration of ambient air quality and thus has nexus and proportionality to prevention of a regionally cumulative significant impact (e.g. worsened status of non-attainment). Despite non-attainment area for state PM10 and pending nonattainment for federal PM2.5, the federal NSR Significant Emission Rate annual limits of 15 and 10 tons per year, respectively, are recommended for this option as BAAQMD has not established an Offset Requirement limit for PM2.5 and the existing limit of 100 tons per year is much less stringent and would not be appropriate in light of our pending nonattainment designation for the federal 24-hour PM2.5 standard. These thresholds represent the emission levels above which a project’s individual emissions would result in a considerable adverse contribution to the SFBAAB’s existing air quality conditions. As discussed for Option 2, the thresholds would be an evaluation both of project significance and of the cumulative contribution of a project to a significant cumulative impact. These threshold levels are well-established in terms of existing regulations as promoting review of emissions sources to prevent cumulative deterioration of air quality. Using existing environmental standards in this way to establish CEQA thresholds of significance under Guidelines section 15067.4 is an appropriate and effective means of promoting consistency in significance determinations and integrating CEQA environmental review activities with other areas of environmental regulation. (See Communities for a Better Environment v. California Resources Agency (2002) 103 Cal. App. 4th 98, 111.6)
As noted above under discussion of construction criteria pollutants, regional concentration levels of CO in the SFBAAB have not exceeded the CAAQS in the past 11 years and sulfur dioxide (SO2) concentrations have never exceeded the standards (EPA 2009). BAAQMD has demonstrated that attainment pollutants are sufficiently controlled by air quality plans and regulations and thus no quantitative thresholds for construction are recommended for CO or SO2 for evaluation of impacts to regional air quality.
4.2.2 LOCAL CARBON MONOXIDE
4.2.2.1 OPTION 1 - CURRENT APPROACH
BAAQMD’s current approach to localized carbon monoxide concentrations is that CO emissions should be estimated for projects in which: 1) vehicle emissions of CO would exceed 550 lb/day; 2) project traffic would impact intersections or roadway links operating at Level of Service (LOS) D, E or F or would cause LOS to decline to D, E or F; or 3) project traffic would increase traffic volumes on nearby roadways by 10 percent or more. The current guidelines also state that a project contributing to CO concentrations exceeding the California Ambient Air Quality Standard (CAAQS) of 9 parts per million (ppm) averaged over 8 hours and 20 ppm for 1 hour would be considered to have a significant impact. Thus, in effect, the current approach has an overall threshold using the CAAQS ambient standards, but also includes several proxy thresholds in the form of a mass emissions threshold, traffic LOS threshold, and a traffic volume threshold. If below the proxy thresholds, then no quantification is done and no comparison to the ambient standards is completed.
6 The Court of Appeal in the Communities for a Better Environment case held that existing regulatory standards could not be used as a definitive determination of whether a project would be significant under CEQA where there is substantial evidence to the contrary. Staff’s proposed thresholds would not do that. The thresholds are levels at which a project’s emissions would normally be significant, but would not be binding on a lead agency if there is contrary evidence in the record.
BAAQMD EDAW CEQA Thresholds of Significance 37 Revised Draft Options and Justification Report
BAAQMD EDAW CEQA Thresholds of Significance 38 Revised Draft Options and Justification Report
4.2.2.2 OPTION 2 - AMBIENT STANDARDS
As a localized pollutant, this approach for evaluation of carbon monoxide impacts is based solely on ambient concentration limits set by the California Clean Air Act for Carbon Monoxide and Appendix G of the State of California CEQA Guidelines.
The CAAQS of 20.0 ppm and 9 ppm for 1-hour and 8-hour CO, respectively, would be used as the thresholds of significance for localized concentrations of CO. Carbon monoxide is a directly emitted pollutant with primarily localized adverse effects when concentrations exceed the health based standards established by the California Air Resources Board (ARB).
In addition, Appendix G of the State of California CEQA Guidelines includes the checklist question: Would the project violate any air quality standard or contribute substantially to an existing or projected air quality violation? Answering yes to this question would indicate that the project would result in a significant impact under CEQA. The use of the ambient standard would relate directly to this checklist question.
4.2.2.3 STAFF RECOMMENDATION AND JUSTIFICATION
Since the Option 2 ambient air quality standards are health-based (i.e., protective of public health), there is substantial evidence (i.e., health studies that the standards are based on) in support of their use as CEQA significance thresholds and they are recommended by BAAQMD staff instead of the current approach. The use of the ambient standard would relate directly to the CEQA checklist question. By not using a proxy standard, there would be a definitive bright line about what is or is not a significant impact and that line would be set using a health-based level. 4.2.3 GREENHOUSE GASES
4.2.3.1 CURRENT APPROACH
BAAQMD does not currently have an adopted threshold of significance for GHG emissions. BAAQMD currently recommends that lead agencies quantify GHG emissions resulting from new development and apply all feasible mitigation measures to lessen the potentially adverse impacts. One of the primary objectives in updating the current CEQA Guidelines is to identify a GHG significance threshold, analytical methodologies, and mitigation measures to ensure new land use development meets its fair share of the emission reductions needed to address the cumulative environmental impact of GHG emissions. Similar to regulated air pollutants, GHG emissions and global climate change also represent cumulative impacts. GHG emissions contribute, on a cumulative basis, to the significant adverse environmental impacts of global climate change. As reviewed herein, climate change impacts include an increase in extreme heat days, higher concentrations of air pollutants, sea level rise, impacts to water supply and water quality, public health impacts, impacts to ecosystems, impacts to agriculture, and other environmental impacts. No single project could generate enough GHG emissions to noticeably change the global average temperature. The combination of GHG emissions from past, present, and future projects contribute substantially to the phenomenon of global climate change and its associated environmental impacts.
BAAQMD’s approach to developing a Threshold of Significance for GHG emissions is to identify the emissions level for which a project would not be expected to substantially conflict with existing California legislation adopted to reduce statewide GHG emissions. If a project would generate GHG emissions above the threshold level, it would be considered to contribute substantially to a cumulative impact, and would be considered significant. If mitigation can be applied to lessen the emissions such that the project meets its fair share of emission reductions needed to address the cumulative impact, the project would normally be considered less than significant.
GHG CEQA significance thresholds evaluated herein are intended to serve as interim levels during the implementation of the AB 32 Scoping Plan and SB 375, which will occur over time. Until AB 32 has been fully implemented in terms of adopted regulations, incentives, and programs and until SB 375 required plans have been fully adopted, or ARB adopts a recommended threshold, the BAAQMD recommends that local agencies in the SFBAAB apply the GHG threshold developed herein.
If left unchecked, GHG emissions from new land use development in California may result in a cumulatively considerable amount of GHG emissions and a substantial conflict with the State’s ability to meet the goals within AB 32. Thus, BAAQMD has elected to adopt an interim GHG threshold for CEQA analysis, which can be used by lead agencies within the SFBAAB. This would help lead agencies navigate this dynamic regulatory and technological environment where the field of analysis has remained wide open and inconsistent. BAAQMD’s framework for developing a GHG threshold for land development projects that is based on policy and substantial evidence follows, and is detailed in Appendix D.
It is widely recognized that AB 32 is only a starting point for the long-term effort to reduce the potential adverse effects from climate change. There will be a need for greater reductions beyond that called for by AB 32 by 2050 in order to avoid the potentially more catastrophic consequences. At this time, BAAQMD is considering threshold development to support the incremental GHG emission reductions mandated by AB 32 given the importance of curbing the growth of GHG emissions and to begin to reduce their absolute levels. Given the magnitude of this initial challenge, BAAQMD considers it premature to propose thresholds for the period after 2020. However, there will be a need in the future to consider CEQA evaluation of post-2020 GHG emissions and reductions. As California and the nation grapple with the post-2020 challenge, BAAQMD will need to update its guidelines to consider the appropriate contributions from CEQA as part of the overall effort to reduce emissions.
While there are myriad potential ways to approach thresholds as documented in the CAPCOA white paper, staff is exploring four options, as described below, as the most promising for application in the SFBAAB.
4.2.3.2 SCIENTIFIC AND REGULATORY JUSTIFICATION
Climate Science Overview
Prominent GHGs contributing to the greenhouse effect are carbon dioxide (CO2), methane (CH4), nitrous oxide (N2O), hydrofluorocarbons, chlorofluorocarbons, and sulfur hexafluoride. Human-caused emissions of these GHGs in excess of natural ambient concentrations are responsible for intensifying the greenhouse effect and have led to a trend of unnatural warming of the earth’s climate, known as global climate change or global warming. It is extremely unlikely that global climate change of the past 50 years can be explained without the contribution from human activities (IPCC 2007a).
According to Article 2 of the United Nations Framework Convention on Climate Change (UNFCCC), “Avoiding Dangerous Climate Change” means: "stabilization of greenhouse gas concentrations in the atmosphere at a level that would prevent dangerous anthropogenic interference with the climate system.” Dangerous climate change defined in the UNFCCC based on several key indicators including the potential for severe degradation of coral reef systems, disintegration of the West Antarctic Ice Sheet, and shut down of the large-scale, salinity- and thermally-driven circulation of the oceans. (UNFCCC 2009). The global atmospheric concentration of carbon dioxide has increased from a pre-industrial value of about 280 ppm to 379 ppm in 2005 (IPCC 2007a). “Avoiding dangerous climate change” is generally understood to be achieved by stabilizing global average temperatures between 2 and 2.4°C above pre-industrial levels. In order to limit temperature increases to this level, ambient global CO2 concentrations must stabilize between 350 and 400 ppm (IPCC 2007b).
Executive Order S-3-05
Executive Order S-3-05, which was signed by Governor Schwarzenegger in 2005, proclaims that California is vulnerable to the impacts of climate change. It declares that increased temperatures could reduce the Sierra’s
BAAQMD EDAW CEQA Thresholds of Significance 39 Revised Draft Options and Justification Report
BAAQMD EDAW CEQA Thresholds of Significance 40 Revised Draft Options and Justification Report
snowpack, further exacerbate California’s air quality problems, and potentially cause a rise in sea levels. To combat those concerns, the Executive Order established total GHG emission targets. Specifically, emissions are to be reduced to the 2000 level by 2010, the 1990 level by 2020, and to 80 percent below the 1990 level by 2050.
Assembly Bill 32, the California Global Warming Solutions Act of 2006
In September 2006, Governor Arnold Schwarzenegger signed Assembly Bill 32, the California Global Warming Solutions Act of 2006, which set the 2020 greenhouse gas emissions reduction goal into law. AB 32 finds and declares that “Global warming poses a serious threat to the economic well-being, public health, natural resources, and the environment of California.” AB 32 requires that statewide GHG emissions be reduced to 1990 levels by 2020, and establishes regulatory, reporting, voluntary, and market mechanisms to achieve quantifiable reductions in GHG emissions to meet the statewide goal.
In December of 2008, ARB adopted its Climate Change Scoping Plan (Scoping Plan), which is the State’s plan to achieve GHG reductions in California, as required by AB 32 (ARB 2008). The Scoping Plan contains the main strategies California will implement to achieve a reduction of 169 MMT CO2e emissions, or approximately 28 percent from the state’s projected 2020 emission level of 596 MMT of CO2e under a business-as-usual scenario (this is a reduction of 42 MMT of CO2e, or almost 10 percent, from 2002-2004 average emissions), so that the state can return to 1990 emission levels, as is required by AB 32.
While the Scoping Plan establishes the policy intent to control numerous GHG sources through regulatory, incentive, and market means, given the early phase of implementation and the level of control that local CEQA lead agencies have over numerous GHG sources, CEQA is an important and supporting tool in achieving GHG reductions overall in compliance with AB 32. In this spirit, BAAQMD is considering the adoption of thresholds of significance for GHG emissions for land use development projects.
Senate Bill 375
Senate Bill (SB) 375, signed in September 2008, aligns regional transportation planning efforts, regional GHG reduction targets, and land use and housing allocation. SB 375 requires Metropolitan Planning Organizations (MPOs) to adopt a Sustainable Communities Strategy (SCS) or Alternative Planning Strategy (APS), which will prescribe land use allocation in that MPO’s Regional Transportation Plan (RTP). ARB, in consultation with MPOs, will provide each affected region with reduction targets for GHGs emitted by passenger cars and light trucks in the region for the years 2020 and 2035. These reduction targets will be updated every 8 years, but can be updated every 4 years if advancements in emission technologies affect the reduction strategies to achieve the targets. ARB is also charged with reviewing each MPO’s SCS or APS for consistency with its assigned targets. If MPOs do not meet the GHG reduction targets, transportation projects would not be eligible for State funding programmed after January 1, 2012. New provisions of CEQA would incentivize qualified projects that are consistent with an approved SCS or APS, categorized as “transit priority projects.”
While SB 375 is considered in the development of thresholds, given that Metropolitan Transportation Commission (MTC)’s development of the SCS for the Bay Area is in its early stages and the ARB GHG reduction target for light duty and passenger vehicles in the Bay Area has not yet been proposed, it is premature to be able to fully rely on SB 375 to address transportation emissions. In the future as SB 375 implementation progresses, BAAQMD may need to revisit GHG thresholds.
4.2.3.3 OPTION 1: QUANTITATIVE THRESHOLD AND PERFORMANCE STANDARD APPROACHES
This approach sets a GHG significance threshold based on AB 32 GHG emission reduction goals while taking into consideration emission reduction strategies outlined in ARB’s Scoping Plan. Within Option 1, there are four
sub-options to consider, which are described below. BAAQMD took eight essential steps in developing this approach.
Step 1. Estimate from ARB’s statewide GHG emissions inventory the growth in emissions between 1990 and 2020 attributable to “land use”-driven sectors of the emission inventory per OPR’s guidance document.
Step 2. Estimate the GHG emission reductions anticipated statewide to these same “land use” -driven emissions inventory sectors associated with adopted regulations identified in the AB 32 Scoping Plan.
Step 3. Determine any short fall or “gap” between the 2020 statewide emission inventory estimates and the anticipated emission reductions from Scoping Plan adopted regulations. This “gap” represents additional GHG emission reductions needed statewide from these “land use”-driven emissions inventory sectors, which represents new land development’s fair share of the emission reductions needed to meet statewide GHG emission reduction goals.
Step 4. Determine the percent reduction this “gap” represents in the “land use”-driven statewide emissions inventory sectors and apply that percent to the same GHG emissions inventory sectors from BAAQMD’s GHG emissions inventory to identify the mass of emission reductions needed in the SFBAAB from “land use”-driven emissions inventory sectors.
Step 5. Forecast new land use development for the Bay Area using DOF/EDD projections for all land use types. Translate the land use development projections into land use categories consistent with those contained in the Urban Emissions Model (URBEMIS).
Step 6. Apply BAAQMD’s CEQA database to projected new land use development to determine the frequency distribution of project sizes and types that would be expected to see come through the CEQA process in the SFBAAB between 2010 and 2020.
Step 7. Estimate the amount of GHG emissions that can be eliminated through mitigation measures for all land use development projects subject to CEQA (“mitigation effectiveness”) compared to BAU conditions.
Step 8. Conduct a sensitivity analysis of the numeric GHG mass emissions threshold needed to achieve the desired emissions reduction (i.e., “gap”) determined in Step 4. This mass emission GHG threshold is that which would be needed to achieve the emissions reduction necessary by 2020 to fill the Bay Area’s fair share of the statewide “gap” in emissions reduction needed from the “land use”-driven emissions inventory sectors to meet AB 32 goals.
Basis and Analysis
Derivation of Greenhouse Gas Reduction Goal
To meet the target emissions limit established in AB 32 (equivalent to levels in 1990), total GHG emissions would need to be reduced by approximately 28 percent from projected 2020 forecasts (ARB 2009a). The AB 32 Scoping Plan is ARB’s plan for meeting this mandate (ARB 2008). While the Scoping Plan does not specifically identify GHG emission reductions from the CEQA process for meeting AB 32 derived emission limits, the scoping plan acknowledges that “other strategies to mitigate climate change . . . should also be explored.” The Scoping Plan also acknowledges that “Some of the measures in the plan may deliver more emission reductions than we expect; others less . . . and new ideas and strategies will emerge.” In addition, climate change is considered a significant environmental issue and, therefore, warrants consideration under CEQA. SB 97 represents the State Legislature’s confirmation of this fact, and it directed the Governor’s Office of Planning and Research (OPR) to develop CEQA Guidelines for evaluation of GHG emissions impacts and recommend mitigation strategies. In response, OPR released the Technical Advisory: CEQA and Climate Change (OPR 2008), and has released proposed CEQA guidelines (April 14, 2009) for consideration of GHG emissions. It is known
BAAQMD EDAW CEQA Thresholds of Significance 41 Revised Draft Options and Justification Report
BAAQMD EDAW CEQA Thresholds of Significance 42 Revised Draft Options and Justification Report
that new land use development must also do its fair share toward achieving AB 32 goals (or, at a minimum, should not hinder the State’s progress toward the mandated emission reductions).
Foreseeable Emission Reductions from the Scoping Plan Measures
As stated above, to meet the requirements set forth in AB 32 (i.e., achieve California’s 1990-equivalent GHG emissions levels by 2020) California would need to achieve an approximate 28 percent reduction in emissions across all sectors of the GHG emissions inventory compared with 2020 projections. However, to meet the AB 32 reduction goals in the emissions sectors that are related to land use development (e.g., on-road passenger and heavy-duty motor vehicles, commercial and residential area sources [i.e., natural gas], electricity generation/consumption, wastewater treatment, and water distribution/consumption), California would need to achieve an approximate 26 percent reduction in GHG emissions from these “land use-driven” sectors (ARB 2009a) by 2020. GHG emission reductions within these land use-driven sectors that are anticipated to occur from implementation of the Scoping Plan measures statewide are summarized in Table 15. Since the GHG emission reductions anticipated with the Scoping Plan were not accounted for in ARB’s or BAAQMD’s 2020 GHG emissions inventory forecasts (i.e., business as usual), an adjustment was made to include (i.e., give credit for) GHG emission reductions associated with key Scoping Plans measures, such as the Renewable Portfolio Standard, improvements in energy efficiency through periodic updates to Title 24, AB 1493 (Pavley) (which recently received a federal waiver to allow it to be enacted in law), the Low Carbon Fuel Standard (LCFS), and other measures. With reductions from these State regulations (Scoping Plan measures) taken into consideration, the Bay Area would still need to achieve a 2.3 percent reduction from projected 2020 GHG emissions to meet the 1990 GHG emissions goal from these “land-use driven” sectors. Refer to Tables 15 through 17 for data used in this analysis and Appendix C for detailed calculations.
Table 15 - California 1990, 2002-2004, and 2020 GHG Emissions Inventories and Projections1
Sector 1990 Emissions (MMT CO2e/yr)
2002-2004 Average (MMT CO2e /yr)
2020 BAU Emissions Projections (MMT CO2e/yr)
% of 2020 Total
Transportation 137.98 168.66 209.06 52% On-Road Passenger Vehicles 108.95 133.95 160.78 40% On-Road Heavy Duty 29.03 34.69 48.28 12% Electric Power 110.63 110.04 140.24 35% Electricity 95.39 88.97 107.40 27% Cogeneration2 15.24 21.07 32.84 8% Commercial and Residential 44.09 40.96 46.79 12% Residential Fuel Use 29.66 28.52 32.10 8% Commercial Fuel Use 14.43 12.45 14.63 4% Recycling and Waste1 2.83 3.39 4.19 1% Domestic Waste Water Treatment 2.83 3.39 4.19 1% TOTAL GROSS EMISSIONS 295.53 323.05 400.22 % Reduction Goal from Statewide land use driven sectors (from 2020 levels to reach 1990 levels within these emission inventory sectors)
26.2%
% Reduction from AB32 Scoping Plan measures applied to land use sectors (see Table 16) -23.9% % Reduction needed statewide beyond Scoping Plan measures (Gap) 2.3%
Notes: MMT CO2e /yr = million metric tons of carbon dioxide equivalent emissions per year. 1 Landfills not included. See text. 2 Cogeneration included due to many different applications for electricity, in some cases provides substantial power for grid use, and because electricity use served by cogeneration is often amenable to efficiency requirements of local land use authorities. Please refer to Appendix D for detailed calculations. Sources: Data compiled by EDAW and ICF Jones & Stokes from ARB data.
Table 16 - GHG Emission Reductions from State Regulations and AB-32 measures (2020) Affected
Emissions Source
California Legislation % Reduction from 2020 GHG inventory
End Use Sector (% of Bay Area LU Inventory)
Scaled % Emissions Reduction
(credit) AB 1493 (Pavley) 19.7% On road passenger/light truck
transportation (45%) 8.9%
LCFS 7.2% On road passenger/light truck transportation (45%)
3.2%
LCFS 7.2% On road Heavy/Medium Duty Transportation (5%)
0.4%
Heavy/Medium Duty Efficiency
2.9% On road Heavy/Medium Duty Transportation (5%)
0.2%
Mobile
Passenger Vehicle Efficiency 2.8% On road passenger/light truck transportation (45%)
1.3%
Natural gas (Residential, 10%) 1.0% Area Energy-Efficiency Measures 9.5% Natural gas (Non-residential,13%) 1.2%
Solar Roofs 1.5% Electricity (excluding cogen) (17%) 0.2% Total credits given to land use-driven emission inventory sectors from Scoping Plan measures 23.9% Notes: AB = Assembly Bill; LCFS = Low Carbon Fuel Standard; SB = Senate Bill; RPS = Renewable Portfolio Standard Please refer to Appendix D for detailed calculations. Sources: Data compiled by ICF Jones & Stokes.
BAAQMD EDAW CEQA Thresholds of Significance 43 Revised Draft Options and Justification Report
BAAQMD EDAW CEQA Thresholds of Significance 44 Revised Draft Options and Justification Report
Table 17 - Basin 1990, 2007, and 2020 GHG Emissions Inventories and Projections
Sector 1990 Emissions (MMT CO2e /yr)
2007 Emissions (MMT CO2e /yr)
2020 Emissions Projections (MMT CO2e /yr)
% of 2020 Total2
Transportation 26.1 30.8 35.7 50% On-Road Passenger Vehicles 23.0 27.5 32.0 On-Road Heavy Duty 3.1 3.3 3.7 Electric Power 25.1 15.2 18.2 26% Electricity 16.5 9.9 11.8 Cogeneration 8.6 5.3 6.4 Commercial and Residential 8.9 15.0 16.8 24% Residential Fuel Use 5.8 7.0 7.5 Commercial Fuel Use 3.1 8.0 9.3 Recycling and Waste1 0.2 0.4 0.4 1% Domestic Waste Water Treatment 0.2 0.4 0.4 TOTAL GROSS EMISSIONS 60.3 61.4 71.1 SFBAAB’s “Fair Share” % Reduction (from 2020 levels to reach 1990 levels) with AB-32 Reductions (from Table 16)
23.9%
SFBAAB’s Equivalent Mass Emissions Land Use Reduction Target at 2020 1.6
Notes: MMT CO2e /yr = million metric tons of carbon dioxide equivalent emissions per year; SFBAAB = San Francisco Bay Area Air Basin. 1 Landfills not included. 2 Percentages do not sum exactly to 100% in table due to rounding. Please refer to Appendix D for detailed calculations. Sources: Data compiled by EDAW 2009, ICF Jones & Stokes 2009, BAAQMD 2008.
Because the transportation sector is the largest emissions sector of the state’s GHG emissions inventory, it is aggressively targeted in early actions and other priority actions in the Scoping Plan including measures concerning gas mileage (Pavley), fuel carbon intensity (LCFS) and vehicle efficiency measures.
The AB 32 Scoping Plan assigns an approximate 20 percent reduction in emissions from passenger vehicles associated with the implementation of AB 1493. The AB 32 Scoping Plan also notes that “AB 32 specifically states that if the Pavley regulations do not remain in effect, ARB shall implement alternative regulations to control mobile sources to achieve equivalent or greater reductions of greenhouse gas emissions (HSC §38590).” Thus, it is reasonable to assume full implementation of AB 1493 standards, or equivalent programs that would be implemented by ARB. While the Obama administration has proposed national CAFÉ standards that may be equivalent to or even surpass AB 1493, the timing for implementation of the proposed federal standards is uncertain such that development of thresholds based on currently unadopted federal standards would be premature. BAAQMD may need to revisit this methodology as the federal standards come on line, particularly if such standard are more aggressive than that forecast under state law.
According to the adopted LCFS rule (CARB, April 2009), the LCFS is expected to result in approximately 10 percent reduction in the carbon intensity of transportation fuels. However, a portion of the emission reductions required from the LCFS would be achieved over the life cycle of transportation fuel production rather than from mobile-source emission factors. Based on CARB’s estimate of nearly 16 MMT reductions in on-road emissions from implementation of the LCFS and comparison to the statewide on-road emissions sector, the LCFS is assumed to result in a 7.2 percent reduction compared to 2020 BAU conditions (CARB 2009e).
Energy efficiency and renewable energy measures from the Scoping Plan were also included in the gap analysis. The Renewable Portfolio Standard (rules) will require the renewable energy portion of the retail electricity portfolio to be 33 percent in 2020. For PG&E, the dominant electricity provider in the Basin, approximately 12
percent of their current portfolio qualifies under the RPS rules and thus the gain by 2020 would be approximately 21 percent. The Scoping Plan also estimates that energy efficiency gains with periodic improvement in building and appliance energy standards and incentives will reach 10 to 15 percent for natural gas and electricity respectively. The final state measure included in this gap analysis is the solar roof initiative, which is estimate to result in reduction of the overall electricity inventory of 1.5 percent.
Landfill emissions are excluded from this analysis. While land use development does generate waste related to both construction and operations, CIWMB has mandatory diversion requirements that will, in all probability, increase over time to promote waste reductions, reuse, and recycle. The Bay Area has relatively high levels of waste diversion and extensive recycling efforts. Further, ARB has established and proposes to increase methane capture requirements for all major landfills. Thus, at this time, landfill emissions associated with land use development waste generation is not included in the land use sector inventory used to develop this threshold approach.
Industrial stationary sources thresholds were developed separately from the land use threshold development using a market capture approach as described below. However, mobile source and area source emissions, as well as indirect electricity emissions that derive from industrial use are included in the land use inventory above as these particular activities fall within the influence of local land use authorities in terms of the influence on trip generation and energy efficiency.
It should be noted that the “gap approach” used for threshold development is a conservative approach focusing on a limited set of state mandates that appear to have greatest promise in reducing land use development GHG emissions at this time. BAAQMD will need to reconsider this gap approach over time as the effectiveness of state implementation of AB 32 (and SB 375) progresses to address the need for and extent of GHG reductions required from local land use development over and above that being addressed through both federal and state mandates.
Threshold Development
AB 32 mandates (reduction to 1990-equivalent GHG levels by 2020), with foreseeable emission reductions from State regulations and key Scoping Plan measures taken into account, were applied to the “land use-driven” emission sectors within the SFBAAB (i.e., those that are included in the quantification of emissions from a land use project pursuant to a CEQA analysis [on-road passenger vehicles, commercial and residential natural gas, commercial and residential electricity consumption, and domestic waste water treatment], as directed by OPR in the Technical Advisory: Climate Change and CEQA [OPR 2008]). This translates to 2.3 percent gap in necessary GHG emission reductions by 2020 from these sectors.
Applying a 2.3 percent reduction to these land use emissions sectors in the SFBAAB’s GHG emissions inventory would result in an equivalent fair share of 1.6 million metric tons per year (MMT/yr) reductions in GHG emissions from new land use development. As additional regulations and legislation aimed at reducing GHG emissions from land use-related sectors become available in the future, the 1.6 MMT GHG emissions reduction goal may be revisited and recalculated by BAAQMD.
A projected development inventory for the next ten years in the SFBAAB was calculated in the same manner as described above under the Operational-Related Criteria Air Pollutants and Precursors section (see above and refer to Exhibit 1). CO2e emissions were modeled for projected development in the SFBAAB and compiled to estimate the associated GHG emissions inventory. The GHG (i.e., CO2e) CEQA threshold level was adjusted for projected land use development that would occur within BAAQMD’s jurisdiction over the period from 2010 through 2020.
Option 1A: Quantitative Threshold (Bright Line)
Option 1A involves using a numeric mass emissions significance threshold. If project-generated GHG emissions would be greater than the mass emissions level, the impact would be significant and mitigation would be required.
BAAQMD EDAW CEQA Thresholds of Significance 45 Revised Draft Options and Justification Report
BAAQMD EDAW CEQA Thresholds of Significance 46 Revised Draft Options and Justification Report
If project-generated emissions were below the mass emissions level, no CEQA related mitigation measures would be required. This option is consistent with significance thresholds recommended by air districts throughout the State for criteria pollutants. Establishing a “bright line” to determine the significance of a project’s GHG emission impact provides a level of certainty to lead agencies in determining if a project needs to reduce its GHG emissions through mitigation measures and when an EIR is required.
Projects with emissions greater than the threshold would be required to mitigate to the threshold level or reduce project emissions by a fixed percentage compared to a base year condition. The base year condition is defined by an equivalent size and character of project with annual emissions using the defaults in URBEMIS and the California Climate Action Registry’s General Reporting Protocol for 2008. By this method, land use project mitigation subject to CEQA would help close the “gap” remaining after application of the key regulations and measures noted above supporting overall AB 32 goals.
The Sensitivity Analysis (Table 18) conducted for Option 1 demonstrates various mass emissions significance threshold levels (i.e., bright lines) that could be chosen based on the mitigation effectiveness and performance anticipated to be achieved per project to meet the aggregate emission reductions of 1.6 MMT needed in the SFBAAB by 2020. Choosing a 1,100 MT mass emissions (equivalent to approximately 60 single-family units), significance threshold level from Option 1 would result in about 59 percent of all projects being above the significance threshold and having to implement feasible mitigation measures to meet their CEQA obligations. These projects account for approximately 92 percent of all GHG emissions anticipated to occur between now and 2020 from new land use development.
Project applicants and lead agencies could use readily available computer models to estimate a project’s GHG emissions, based on project specific attributes, to determine if they are above or below the bright line numeric threshold. With this threshold, projects that are above the threshold level would have to reduce their emissions to below the threshold.
Option 1B: Performance Standards-Only Threshold
Option 1B involves implementation of performance standards by all projects subject to CEQA that are not categorically or statutorily exempt that would achieve a minimum 26 percent emissions reduction from all projects. If the project would implement performance measures to achieve the minimum performance standard of 26 percent reduction in GHG emissions, the impact would be considered less than significant. The rationale for this approach is based on the analysis of the OPR identified land use-driven GHG emissions inventory sectors in ARB’s statewide GHG emissions inventory that identified the total amount of emissions reduction needed statewide to meet AB32 goals.
The sensitivity analysis (Table 18) indicates, at least theoretically, that requiring all projects to achieve a 26 percent emissions reduction would result in the SFBAAB exceeding its fair share of the emission reductions needed to meet the statewide 2020 GHG emission reduction goal. However, it should be noted that all projects (100 percent) subject to CEQA would have to calculate their unmitigated GHG emissions, or baseline, and then identify mitigation measures to reduce 26 percent of those emissions. It could prove difficult for the smallest of projects to implement sufficient mitigation measures to reduce their GHG emissions by 26 percent, thereby requiring these smaller projects to prepare an EIR for no other impacts than GHG emissions and climate change. In addition, due to economies of scale, larger projects could more efficiently mitigate GHG emission reductions.
EDAW CEQA Thresholds of Significance 47 Revised Draft Options and Justification Report
Notes: MMT = million metric tons per year; MT CO2e/yr = metric tons of carbon dioxide equivalent emissions per year; MT/yr = metric tons per year; N/A = not applicable. 1 Any project subject to CEQA would trigger this threshold. Please refer to Appendix E for detailed calculations. Source: Data modeled by ICF Jones & Stokes.
BAAQMD
EDAW BAAQMD Revised Draft Options and Justification Report 48 CEQA Thresholds of Significance
Option 1B would require provision of guidance to project applicants and lead agencies on how to calculate a project’s unmitigated baseline GHG emissions and the amount of emission reductions that could be taken credit for with each separate mitigation measure proposed for implementation.
Option 1C: Combination of Performance Standards and Numeric Threshold
Option 1C involves using a combination of a minimum performance standard for all projects and a mass emissions threshold.
All projects that would result in GHG emissions would be required to reduce emissions by a minimum of 5 percent (compared to the base year condition) to be considered less than significant. The minimum amount of 5 percent was chosen because it is relatively easy to achieve 5 percent reduction in operational GHG emissions through implementation of relatively few performance measures. This amount would be achievable for projects not located along transit or bicycle infrastructure, which have historically achieved greater emission reductions. Sources of information cited in the report by the California Air Pollution Control Officers Association (CAPCOA) entitled CEQA and Climate Change indicate that there are measures and methods for quantification of mitigation effectiveness that can achieve the minimum 5 percent reduction in GHG emissions (CAPCOA 2008).
Projects that are above the mass emissions threshold would have to either reduce their emissions to below the threshold or by a minimum of 30 percent compared to the base year condition.
The results of the sensitivity analysis presented in Table 18 for Option 1C suggest that a mass emission CEQA threshold of <1,900 MT/yr (equivalent to approximately 104 single family dwelling units) combined with a mitigation effectiveness of 30 percent for projects over the threshold and 5 percent from all projects would be needed to achieve the requisite emissions capture to reach 1.6 MMT CO2e of GHG emissions reduction by 2020.
Option 1D: GHG Efficiency Standard Approach
As discussed in Section 4.3.2 below, GHG efficiency metrics can also be utilized as thresholds to assess the GHG efficiency of a project on a per capita basis (residential only projects) or on a “service population” basis (the sum of the number of jobs and the number of residents provided by a project) . GHG efficiency metrics were developed in Section 4.3.2 for the emissions rates at the State level for the land use sector that would accommodate projected growth (as indicated by population and employment growth) under trend forecast conditions, and the emission rates needed to accommodate growth while allowing for consistency with the goals of AB 32 (i.e., 1990 GHG emissions levels by 2020). The resultant GHG efficiency metrics for this option would be 6.7 MT CO2e/capita or 4.6 MT CO2e/SP. A project with GHG emissions per capita or per service population less than these metrics would be considered less than significant. This approach would only apply to mixed use or residential only projects and would not apply to commercial or industrial projects.
4.2.3.4 OPTION 2: CALIFORNIA AIR RESOURCES BOARD TIERED THRESHOLD APPROACH
This option would involve implementation of the CEQA threshold(s) that have been conceptually developed by ARB in coordination with OPR, in response to SB 97 requirements.
Pursuant to SB 97, OPR was directed to develop CEQA mitigation guidelines for GHG emissions. OPR looked to ARB for technical expertise in the development, and evidence in support, of these thresholds. ARB released its draft interim CEQA thresholds concepts for industrial, commercial, and residential projects for public comment in October 2008.
BAAQMD EDAW CEQA Thresholds of Significance 49 Revised Draft Options and Justification Report
ARB proposed a tiered approach as follows:
► Tier 1 - If the project is statutorily or categorically exempt from CEQA, it would be considered to result in a less-than-significant impact for GHG emissions.
► Tier 2 - If the project is consistent with an ARB-approved SCS developed pursuant to SB 375, it would be considered to result in a less-than-significant impact for GHG emissions.
► Tier 3A - For industrial projects (i.e., projects that would apply for air district permits), if the project would implement prescriptive performance standards related to construction and mobile-source operational GHG emissions, and meet a mass emissions threshold of 7,000 MT CO2e/yr, it would be considered to result in a less-than-significant impact for GHG emissions.
► Tier 3B - For residential and commercial projects, if the project would implement a series of prescriptive performance measures addressing GHG emissions from construction, mobile sources, energy consumption, water consumption, and solid waste, and meet a mass emissions threshold (which is still under development and was not provided in the interim threshold draft) it would be considered to result in a less-than-significant impact for GHG emissions.
As of the time of writing, ARB is still accepting public comments on these draft options, and has not suggested a timeline for revision or adoption (ARB 2009b).
4.2.3.5 OPTION 3: BACT APPROACH
Quantitative evaluation of construction emissions would not be required for GHGs. Instead, all projects would be required to implement BACT to reduce GHGs. BACT would need to be developed by BAAQMD and would need to be updated periodically to reflect changes in technology, feasibility, and cost-effectiveness. Initial BACT standards could include, but need not be limited to the following: building energy efficiency, integration of renewable energy into project, waste minimization and reuse, water efficiency, alternative modes of travel. This approach would be labor intensive for BAAQMD staff and would involve the District in issues normally addressed by local land use authorities.
4.2.3.6 OPTION 4: TIERED THRESHOLD APPROACH
This option would be similar to Option 1A, except it would include two tiers of evaluation.
The first tier of evaluation would be whether the project is consistent with a qualified climate action plan or an adopted SCS/APS under SB 375 that addresses the project.
A qualified climate action plan must have the characteristics described below under Plan-Level GHG Thresholds.
A SCS (or APS) adopted pursuant to SB 375 must have the following characteristics:
► must meet the ARB identified reduction target;
► must have been adopted by the Metropolitan Transportation Organization (MPO); and
► certification of the EIR for the associated Regional Transportation Plan (RTP) must be completed.
EDAW BAAQMD Revised Draft Options and Justification Report 50 CEQA Thresholds of Significance
If the project is consistent with a qualified Climate Action Plan, then the GHG emissions of the project would be less than significant. Projects that are found to not be consistent with an adopted Climate Action Plan would be reviewed against a quantitative threshold, as in Option 1A.
A project that is consistent with a SB 375 Sustainable Communities Strategy or Alternative Planning Strategy would be considered less than significant for transportation-related GHG emissions, but not necessarily for other GHG emissions. Review against the bright-line threshold, as in Option 1A, would still be required. Given that transportation emissions are often the largest source of GHG emissions for land use sector projects, it is expected that projects consistent with a SB 375 plan would more readily demonstrate compliance with the mitigation requirements in this threshold.
4.2.3.7 STATIONARY SOURCE GHG THRESHOLD
Two GHG threshold options were developed for stationary sources as discussed below using a “market-capture” approach.
Stationary Option 1: Natural Gas Only-Based Threshold Approach
Staff compiled reported annual natural gas consumption for 1,154 permitted facilities for 2007 and rank-ordered the facilities to estimate the 90th percentile of the cumulative natural gas usage for all permitted facilities. Figure 1 shows that approximately 4 percent of facilities evaluated comprise more than 90 percent of the total natural gas consumption. The threshold which would capture this 4 percent of facilities corresponds to 18,000 metric tons per year (tpy) of CO2 emissions. If the screening threshold of 18,000 MT CO2e/yr were implemented, based on the permitting activities for 2007, it would have resulted in 6 projects that would mandate a MNDs or EIR to be prepared by the BAAQMD as the lead agency unless another tier option is selected to demonstrate no significant impacts for GHG emissions7. It should be noted that this analysis did not include other possible GHG pollutants such as methane, N2O; a life-cycle analysis; mobile sources; or indirect electricity consumption. Therefore, under an 18,000 MT CO2e/yr screening level, a few more projects would be required to go through an MND or EIR environmental analysis than is currently the case. Furthermore, when the BAAQMD acts as a lead agency, the stationary source equipment employed as part of the proposed project typically must comply with BACT or other BAAQMD rules, regulations, programs that require reducing criteria pollutants or air toxics. Stationary Option 2: All Combustion Emissions Threshold Approach
This approach is based on estimating the GHG emissions from combustion sources for all permit applications submitted to the Air District in 2005, 2006 and 2007. The analysis is based only on CO2 emissions from stationary sources, as that would cover the vast majority of the GHG emissions due to stationary combustion sources in the SFBAAB. The estimated CO2 emissions were calculated for the maximum permitted amount, i.e. emissions that would be emitted if the sources applying for a permit application operate at maximum permitted load and for the total permitted hours. All fuel types are included in the estimates. For boilers burning natural gas, diesel fuel is excluded since it is considered a backup fuel and is used only if natural gas is not available. Emission values are estimated before any offsets (i.e., Emission Reduction Credits) are applied. GHG emissions from mobile sources, electricity use and water delivery associated with the operation of the permitted sources are not included in the estimates.
It is projected that a threshold level of 10,000 metric tons of CO2e per year would capture approximately 95% of all GHG emissions from stationary sources in the SFBAAB. That threshold level was calculated as an average of
7 In 2005, three projects went through the CEQA process with BAAQMD as the lead.
BAAQMD EDAW CEQA Thresholds of Significance 51 Revised Draft Options and Justification Report
the combined CO2 emissions from all stationary source permit applications submitted to the Air District during the three year analysis period.
Figure 1: Natural Gas Combustion Emissions from Stationary Sources in the SFBAAB
4.2.3.8 STAFF RECOMMENDATIONS AND JUSTIFICATION
Land Use Sector Threshold Recommendation and Justification
As shown in Table 18 and described in text above, the analysis for this threshold evaluated several combinations of performance standards, mitigation effectiveness, and mass emissions levels. The percent of project and emission capture for each option is identified in Table 18 along with the aggregate emissions reduction, which ranges from 1.3 to 2.1 MMT in 2020. Although there is an inherent amount of uncertainty in these capture rates and the aggregate emission reductions, they are based on the best available data and assume a conservative approach to the amount of reductions from legislation in derivation of the goal (e.g., adopted only).
BAAQMD staff recommends a combination of Option 1A and Option 1D as an interim approach for determining the significance of a land-use project’s greenhouse gas emissions until such time as Climate Action Plans and SCSs/APSs are adopted that can be used for this purpose. When the MTC RTP is completed in 2012, along with adoption of a SCS (and possibly an APS), municipalities throughout the Bay Area could analyze consistency with the SCS/APS as a significance threshold. As an interim threshold for use until a qualifying Climate Action Plan, SCS, and/or APS is adopted, staff recommends a bright-line numeric threshold of 1,100 MT CO2e/yr as described in Option 1A as a numeric emissions level below which a project’s contribution to global climate change would be less than “cumulatively considerable.” This emissions rate is equivalent to a project size of approximately 60
EDAW BAAQMD Revised Draft Options and Justification Report 52 CEQA Thresholds of Significance
single-family dwelling units, and approximately 59 percent of all future projects and 92 percent of all emissions from future projects would exceed this level. For projects that are above this bright-line cutoff level, emissions from these projects would still be less than cumulatively significant if the project as a whole would result in an efficiency of 6.7 MT CO2e per capita or better for residential projects; or 4.6 MT CO2e per service population or better for mixed-use projects. Projects with emissions above 1,100 MT CO2e/yr would therefore still be less than significant if they achieved project efficiencies below these levels. If projects as proposed exceed these levels, they would be required to implement mitigation measures to bring them back below the 1,100 MT CO2e/yr bright-line cutoff or within the 6.7 MT CO2e per capita/4.6 MT CO2e Service Population efficiency threshold. If mitigation did not bring a project back within the threshold requirements, the project would be cumulatively significant and could be approved only with a Statement of Overriding Considerations and a showing that all feasible mitigation measures have been implemented.
As explained in the preceding analyses of these options, the greenhouse gas emissions from land use projects expected between now and 2020 built in compliance with these thresholds would be approximately 26 percent below BAU 2020 conditions and thus would be consistent with achieving an AB 32 equivalent reduction. The 26 percent reduction from BAU 2020 from new projects built in conformance with these proposed thresholds would achieve an aggregate reduction of approximately 1.6 MMT CO2e/yr, which is the “fair share” of emission reductions from Bay Area land use sources needed to meet the AB 32 goals, per ARB’s Scoping Plan as discussed above.
Projects with greenhouse gas emissions in conformance with these proposed thresholds would therefore not be considered significant for purposes of CEQA. Although the emissions from such projects would add an incremental amount to the overall greenhouse gas emissions that cause global climate change impacts, emissions from projects consistent with these thresholds would not be a “cumulatively considerable” contribution under CEQA. Such projects would not be “cumulatively considerable” because they would be helping to solve the cumulative problem as a part of the AB 32 process. California’s response to the problem of global climate change is to reduce greenhouse gas emissions to 1990 levels by 2020 under AB 32 as a near-term measure and ultimately to 80 percent below 1990 levels by 2050 as the long-term solution to stabilizing greenhouse gas concentrations in the atmosphere at a level that will not cause unacceptable climate change impacts. To implement this solution, the Air Resources Board has adopted a Scoping Plan and budgeted emissions reductions that will be needed from all sectors of society in order to reach the interim 2020 target. The land-use sector in the Bay Area needs to achieve aggregate emission reductions of approximately 1.6 MMT CO2e/yr from new projects between now and 2020 to achieve this goal, as noted above, and each individual new project will need to achieve its own respective portion of this amount in order for the Bay Area land use sector as a whole to achieve its allocated emissions target. Building all of the new projects expected in the Bay Area between now and 2020 in accordance with the thresholds that District staff are proposing will achieve the overall “fair share” for the land use sector, and building each individual project in accordance with the proposed thresholds will achieve that individual project’s respective portion of the emission reductions needed to implement the AB 32 solution. For these reasons, projects built in conformance with the proposed thresholds will be part of the solution to the cumulative problem, and not part of the continuing problem. They will allow the Bay Area’s land use sector to achieve the emission reductions necessary from that sector for California to implement its solution to the cumulative problem of global climate change. As such, even though such projects will add an incremental amount of greenhouse gas emissions, their incremental contribution will be less than “cumulatively considerable” because they are helping to achieve the cumulative solution, not hindering it. Such projects will therefore not be “significant” for purposes of CEQA. (See CEQA Guidelines § 15064(h)(1).)
The conclusion that land use projects that comply with these proposed thresholds is also supported by CEQA Guidelines Section 15030(a)(3), which provides that a project’s contribution to a cumulative problem can be less that cumulatively considerable “if the project is required to implement or fund its fair share of a mitigation measure or measures designed to alleviate the cumulative impact.” In the case of greenhouse gas emissions associated with land use projects, achieving the amount of emission reductions below BAU that will be required
BAAQMD EDAW CEQA Thresholds of Significance 53 Revised Draft Options and Justification Report
to achieve the AB 32 goals is the project’s “fair share” of the overall emission reductions needed under ARB’s scoping plan to reach the overall statewide AB 32 emissions levels for 2020. If a project is designed to implement greenhouse gas mitigation measures that achieve a level of reductions consistent with what is required from all new land use projects to achieve the land use sector “budget” – i.e., keeping overall project emissions below 1,100 MT CO2e/yr or ensuring that project efficiency is better than 6.7 MT CO2e per capita for residential projects or 4.6 MT CO2e Service Population for mixed-use projects – then it will be implementing its “fair share” of the mitigation measures necessary to alleviate the cumulative impact, as shown in the analyses set forth above. It is also worth noting that this “fair share” approach is flexible and will allow a project’s significance to be determined by how well it is designed from a greenhouse-gas efficiency standpoint, and not just by the project’s size. For example, a large high-density infill project located in an urban core nearby to public transit and other alternative transportation options, and built using state-of-the-art energy efficiency methods and improvements such as solar panels, as well as all other feasible mitigation measures, would not become significant for greenhouse gas purposes (and thus require a statement of overriding considerations in order to be approved) simply because it happened to be a large project. Projects such as this hypothetical development with low greenhouse-gas emissions per capita are what California will need in the future in order to do its part in achieving a solution to the problem of global climate change. The determination of significance under CEQA should therefore take these factors into account, and staff’s proposed significance thresholds would achieve this important policy goal.
Stationary Source Threshold Recommendation and Justification
For stationary sources, staff recommends Stationary Option 2 as it would address a broad range of combustion sources and thus provide for a greater amount of GHG reductions to be captured and mitigated through the CEQA process. As documented in the Scoping Plan, in order to achieve statewide reduction targets, emissions reductions need to be obtained through a broad range of sources throughout the California economy and Stationary Option 2 would achieve this purpose better than the more limited Stationary Option 1.
This threshold would be considered an interim threshold and Air District staff will reevaluate the threshold as AB 32 Scoping Plan measures such as Cap and Trade are more fully developed at the state level.
EDAW BAAQMD Revised Draft Options and Justification Report 54 CEQA Thresholds of Significance
4.2.4 LOCAL COMMUNITY RISK AND HAZARD IMPACTS
Phase 1 of the BAAQMD’s Community Air Risk Evaluation (CARE) Program compiled and analyzed a regional emissions inventory of toxic air contaminants (TACs), including emissions from stationary sources, area sources, and on-road and off-road mobile sources. Phase 2 of the CARE Program conducted regional computer modeling of selected TAC species, species which collectively posed the greatest risk to Bay Area residents. In both Phases 1 and 2 demographic data were combined with estimates of TAC emissions and concentrations to identify communities that are disproportionally impacted from high concentrations of TACs. The TAC modeling was performed on a regular grid with one kilometer resolution covering the Bay Area to identify areas that are cumulatively impacted from sources of TACs. The modeling yielded estimates of annual concentrations of five key compounds—diesel particulate matter, benzene, 1,3-butadiene, formaldehyde, and acetaldehyde—for year 2005. These concentrations were multiplied by their respective unit cancer risk factors, as established by the State’s Office of Environmental Health Hazard Assessment (OEHHA) to estimate the expected excess cancer risk per million people from these compounds. The datasets compiled to identify impacted communities were determined as follows:
• Exposure of sensitive populations: Sensitive populations from the 2000 U.S. Census database were identified as youth (under 18) and seniors (over 64) and mapped to the same one kilometer grid used for the toxics modeling. Excess cancers from TAC exposure were determined by multiplying these sensitive populations by the model-estimated excess risk to establish a data set representing sensitive populations with high TAC exposures.
• TAC emissions: TAC emissions (year 2005) were mapped to the one kilometer grid and also scaled by
their unit cancer risk factor to provide a data set representing source regions for TAC emissions.
• Poverty-level: Block-group level household income data from the U.S. Census database were used to identify block groups with family incomes where more than 40 percent of the population was below 185 percent of the federal poverty level (FPL).
The impacted communities currently identified by the Air District’s CARE program (Figure 2) are exemplary of the type of community where Community Risk Reduction Plans (CRRPs) discussed below are intended to be developed and implemented. Agencies are encouraged to contact the Air District to ensure that the most current CARE community designations are used for identifying areas in need of CRRPs. The Air District will also assist agencies to identify other impacted communities within their jurisdiction based on the above criteria.
According to the findings of the CARE Program, diesel PM—mostly from on and off-road mobile sources—accounts for about 80 percent of the inhalation cancer risk from TACs in the Bay Area. The highest diesel PM emissions occur in the urban core areas of Concord, eastern San Francisco, western Alameda County, Redwood City/East Palo Alto, Richmond/San Pablo, and San Jose (BAAQMD 2006). The highest cancer risk levels from ambient TAC in the SFBAAB also tend to occur in the core urban areas, along major roadways and adjacent to freeways (Figure 3). Cancer risks in areas along these major freeways are estimated to range from 200 to over 500 excess cases in a million. Typical annual average ambient levels of diesel PM in the Bay Area are approximately 1.3 micrograms per cubic meter (µg/m3), which equates to approximately 400 excess cancer cases in a million. By weighting the cancer risk by the number of sensitive receptors (i.e., people under the age of 18 and over the age of 64) living in each grid cell, areas with high risk and vulnerable populations can be identified.
BAAQMD EDAW CEQA Thresholds of Significance 55 Revised Draft Options and Justification Report
Analysis of the one kilometer resolution modeling predictions of TAC concentrations and risk reveals that 50 percent of the land area in the SFBAAB currently experiences background inhalation cancer risk levels of less than 152 excess cases per one million, with a standard deviation of 180. The frequency distribution of inhalation cancer risk in the SFBAAB is presented in Figure 4 and detailed in Appendix E.
The frequency distribution of risk changes when ambient risk levels are weighted by population. Fifty percent of BAAQMD’s population is estimated to have an ambient background inhalation cancer risk of less than 500 cases in one million. Figure 5 presents a frequency distribution of population-weighted risk data. Table 19, using a similar data set, presents a summary of percentages of the population exposed to varying levels of cancer risk from ambient TACs. Approximately two percent of the SFBAAB population is exposed to background risk levels of less than 200 excess cases in one million. This is in contrast to the upper percentile ranges where 8 percent of the SFBAAB population is exposed to background risk levels of greater than 1,000 excess cases per one million.
EDAW BAAQMD
Source: BAAQMD 2008. Figure 2: Communities of High Concern
Revised Draft Options and Justification Report 56 CEQA Thresholds of Significance
BAAQMD EDAW
Notes: PM = particulate matter. Source: BAAQMD 2008. Based on Year 2005 emissions. Figure 3: Modeled Inhalation Cancer Risk in the San Francisco Bay Area Air Basin
CEQA Thresholds of Significance 57 Revised Draft Options and Justification Report
EDAW BAAQMD
Table 19 - Statistical Summary of Population-Weighted Ambient Cancer Risk Percentage of Population
(Percent below level of ambient risk) Ambient Cancer Risk
(inhalation cancer cases in one million) 92 1,000 90 900 83 800 77 700 63 600 50 500 32 400 13 300 2 200 0 100
Source: Data compiled by EDAW 2009. See Appendix G for detailed calculations.
Source: BAAQMD 2009.
Figure 4: San Francisco Bay Area Air Basin Unweighted Inhalation Cancer Risk
Revised Draft Options and Justification Report 58 CEQA Thresholds of Significance
BAAQMD EDAW
Notes: BAAQMD = Bay Area Air Quality Management District. Sources: EDAW 2009, BAAQMD 2009.
Figure 5: San Francisco Bay Area Air Basin Population-Weighted Inhalation Cancer Risk
4.2.4.1 SITING A NEW SOURCE
Option 1 - Current Approach
Chronic TAC Exposure
Any project with the potential to expose people (receptors) to substantial levels of TAC is currently deemed to have a significant impact. This applies to new receptors locating near existing sources of TACs, as well as sources of TAC locating near existing receptors. The current TAC threshold of significance applies to all projects, regardless of size, and requires mitigation for TAC impacts above the thresholds listed below.
Proposed development projects that have the potential to expose receptors to TAC in excess of the following thresholds from any source, mobile or stationary would be considered to have a significant air quality impact if the:
► Probability of contracting cancer for the Maximally Exposed Individual (MEI) exceeds 10 in one million.
► Ground-level concentrations of non-carcinogenic toxic air contaminants would result in a Hazard Index greater than 1 for the MEI.
Accidental Release of Acutely Hazardous Air Emissions
The BAAQMD currently recommends, at a minimum, that the lead agency, in consultation with the administering agency of the Risk Management Prevention Program (RMPP), find that any project resulting in receptors being within the Emergency Response Planning Guidelines (ERPG) exposure level 2 for a facility has a significant air
CEQA Thresholds of Significance 59 Revised Draft Options and Justification Report
EDAW BAAQMD Revised Draft Options and Justification Report 60 CEQA Thresholds of Significance
quality impact. ERPG exposure level 2 is defined as "the maximum airborne concentration below which it is believed that nearly all individuals could be exposed for up to one hour without experiencing or developing irreversible or other serious health effects or symptoms which could impair an individual's ability to take protective action."
The current Accidental Release/Hazardous Air Emissions threshold of significance could affect all projects, regardless of size, and require mitigation for Accidental Release/Hazardous Air Emissions impacts.
Option 2: Stationary Source Permit Approach
This option would consist of applying the current stationary source permitting thresholds to project-generated stationary, area-, and mobile-source TAC emissions.
Stationary sources of emissions are subject to BAAQMD’s permit process per adopted rules and regulations. The permitting process requires that all new or modified stationary sources that emit TACs perform modeling to determine what the concentration of TACs will be at the boundary of their property. This current permitting approach does not include area or mobile sources of emissions in the modeling or permitting assessment. If a proposed stationary source will have operational TAC concentrations from permitted equipment that result in an estimated 1 excess cancer risk in a million, the project is required to install Toxic Best Available Control Technology (TBACT) to minimize emissions of TACs. The TAC modeling must also demonstrate to BAAQMD that implementation of the proposed project would not result in additional incremental exposure of surrounding receptors to levels that exceed 10 in one million for excess cancer risk or a hazard index above one. The BAAQMD will not issue an authority to construct or permit to operate for any stationary source of TACs that would result in concentrations exceeding a 10 in one million threshold.
This approach would expand on the current approach by requiring the application of the one in a million requirement for stationary sources to install TBACT to projects that have TAC emissions from sources (primarily mobile) not currently required to obtain permits to operate. These non-stationary source type projects would be required to implement TBPs such as site and circulation design, setbacks from roadways, air conditioning, and vegetation buffers, if their modeled cancer risks are above the one in a million threshold. The BAAQMD would identify a list of TBPs for non-stationary sources to implement if they are above the one in a million threshold. The threshold of significant impact, thereby requiring implementation of all feasible onsite mitigation measures would remain at the current 10 in a million excess cancer risk and a HI of 1.0.
Stationary source permits to operate would still not be issued to stationary sources that could not reduce their risk on site below the 10 in a million excess cancer risk threshold or the HI of 1.0.
Option 3: Tiered Approach
This approach would involve application of a tiered (more stringent) CEQA threshold in impacted communities.
Proposed development projects that have the potential to expose sensitive receptors or the general public to TACs in excess of the following thresholds from any source, mobile, area or stationary would be considered to have a significant air quality impact in the following conditions:
► Increase in Cancer Risk to Maximally Exposed Individual (MEI) in Excess of One in a Million - Projects not requiring a BAAQMD permit to operate, but that would result in area or mobile sources of TACs would be required to implement TBPs if their modeled cancer risks are above a one in a million excess cancer risk threshold. The BAAQMD would identify a prescribed set of TBPs. Projects that could not feasibly implement prescribed TBPs would be considered to contribute considerably to cumulative cancer risk.
BAAQMD EDAW CEQA Thresholds of Significance 61 Revised Draft Options and Justification Report
► Increased Cancer Risk to MEI - New sources of TACs locating in impacted communities, as identified by the BAAQMD’s Community Air Risk Evaluation (CARE) Program, would have to install Toxics Best Available Control Technology (TBACT) and/or TBPs and would be subject to a significance threshold of 5 in one million (after consideration of TBACT and/or TBPs). New sources of TACs locating in a community other than an impacted community would be subject to a significance threshold of 10 in one million.
► Increased Non-Cancer Risk to MEI – Project TAC emissions would be considered significant where ground-level concentrations of non-carcinogenic TACs result in a chronic Hazard Index of greater than 0.5 and an acute Hazard Index greater than 1.0 within an impacted community, or greater than 1.0 in all other areas.
► Increased Ambient Concentration of PM2.5 of 0.3 µg/m3 – This approach would also include a quantitative concentration threshold for the project-generated annual average increase in PM2.5 emissions of 0.3 µg/m3. This concentration is the U.S. EPA Significant Impact level (SIL) for PM2.5. The SIL is a threshold applied to individual facilities that apply for a permit to emit a regulated pollutant in an area that meets the NAAQS. The state and EPA must determine if emissions from that facility will cause the air quality to worsen. If an individual facility projects an increase in emissions that result in ambient impacts greater than the established SIL, the permit applicant would be required to perform additional analyses to determine if those impacts will be more than the amount of the PSD increment. This analysis would combine the impact of the proposed facility when added on to all other sources in the area.
Option 4: No Net Increase Approach
Option 4 would proposes a no net increase inhalation cancer risk CEQA significance threshold for siting a new source of TACs in CARE priority communities identified as the urban core areas of Concord, eastern San Francisco, western Alameda County, Redwood City/East Palo Alto, Richmond/San Pablo, and San Jose. Thresholds for other parts of the Bay Area would be the same as Option 1. This threshold would not define a “substantial change” (see definition of significant impact in section below), because any increase would be considered significant. The practical implications of essentially setting a zero threshold for TACs in these communities could be substantial. A no net increase or zero threshold could make it extremely difficult for a wide variety of businesses to locate in the CARE communities, businesses that are essential to daily lives. A large number of relatively small projects would need to prepare an EIR since any increase in TACs would be considered a significant impact. There are no adequate mitigation strategies or alternatives available to eliminate all TAC from even the smallest of sources.
4.2.4.2 SITING A NEW RECEPTOR
Impacts of the Existing Environment on a Proposed Project
In addressing the potential for impacts from existing sources of toxic exposure, Lead Agencies should take care to focus their analyses squarely on impacts arising from changes to the environment caused by the proposed project. (See CEQA § 21068, defining “significant effect on the environment” as “a substantial, or potentially substantial, adverse change in the environment” (emphasis added).) A Lead Agency can address a preexisting environmental condition – such as existing sources of toxics – under CEQA only if there is a nexus between the preexisting condition and some physical change arising from the project. For example, the mere existence of preexisting groundwater contamination underneath a property does not constitute a significant environmental impact from a project on the property that would not affect the contamination in any way, as the California Court of Appeal held in the case of Baird v. County of Contra Costa (1995) 32 Cal.App.4th 1464, 1468. But where a change caused by the project will implicate the preexisting contamination in some way, such as introducing people to an area with a preexisting hazard, the contamination does warrant consideration under CEQA. Thus, where a developer seeks to acquire contaminated property and the acquisition will require it to manage the contaminated soil, the preexisting contamination is subject to CEQA analysis, as the Court of Appeal held in McQueen v. Mid-Peninsula Regional
EDAW BAAQMD Revised Draft Options and Justification Report 62 CEQA Thresholds of Significance
Open Space District (1988) 202 Cal.App.3d 1136, 1147, 249 Cal.Rptr. 439. In that case the project did entail a change implicating the preexisting contamination, which is the key distinction the court pointed to in Baird. (See also City of Santa Monica v. City of Los Angeles, 2007 Cal. App. Unpub. LEXIS 7409, *87-*89 n.22 (distinguishing Baird in noting that constructing buildings above subterranean methane contamination could concentrate the methane and constitute a physical change triggering CEQA analysis of the methane impacts).)
Lead agencies should, therefore, ensure that they focus on physical changes caused by the project that will implicate existing sources of toxic exposure. An example of such a change caused by the project would be if the project causes additional people to be attracted to the project location and thereby to be exposed to additional toxic risks. This approach to evaluating risks to new occupants of a project from existing sources of risk has been endorsed by the Resources Agency in Section 15126.2(a) of the CEQA Guidelines. Lead agencies using such an approach should specifically identify the changes being caused by the project in relation to existing sources of risk to minimize the chances of falling afoul of Baird.
Option 1: Statistical/Percentile Health Impact-Based Approach
This approach considers a method of determining whether a project would result in a significant impact if it would attract or locate new sensitive receptors into an area exposed to TAC concentrations exceeding the ambient median exposure for the entire SFBAAB.
Option 1 for siting new sensitive receptors in areas currently impacted from nearby sources of TACs would set a TBP threshold of 100 in a million excess cancer cases for all new residential projects. The 100 in a million TBP threshold is based on EPA guidance for conducting air toxics analyses and making risk management decisions at the facility and community-scale level which considers a range of “acceptable” cancer risks from one in a million to one in ten thousand. In protecting public health with an ample margin of safety, EPA strives to provide maximum feasible protection against risks to health from Hazardous Air Pollutants (HAPs) by limiting to a no higher than approximately one in ten thousand (100 in a million) the estimated risk that a person living near a source would be exposed to the maximum pollutant concentrations for 70 years. This goal is described in the preamble to the benzene National Emissions Standards for Hazardous Air Pollutants (NESHAP) rulemaking (54 Federal Register 38044, September 14, 1989) and is incorporated by Congress for EPA’s residual risk program under Clean Air Act (CAA) section 112(f). The 100 in a million excess cancer cases is also consistent with the ambient cancer risk in the most pristine portions of the Bay Area based on the District’s recent regional modeling analysis.
The threshold of significance for CEQA would be based on the median exposure to inhalation cancer risk now occurring in the SFBAAB, of 500 excess cancer cases in a million. This option would attempt to reconcile the issues associated with promoting high density infill transit oriented development, while, at the same time, trying to reduce the public’s exposure to TACs. Many of the features that make transit oriented development favorable from a regional air quality perspective (e.g., being located along existing transportation, transit, and train corridors) can also expose sensitive receptors to high concentrations of TACs. At some point the benefits to regional air quality from development in these areas are superseded by the need to protect the public from moving into an area of high TACs. With this option, nearly all residential projects (or other projects that involve new receptors) would implement TBPs, but would not require preparation of an EIR unless those TBPs could not reduce the exposure to a cancer risk level of 500 in a million for those new receptors.
Further complicating this issue is ARB’s diesel risk reduction plan, which estimates an 85 percent reduction in statewide diesel particulate matter (PM) emissions by 2020, and whether currently existing areas of high cancer risks from diesel PM will be at acceptable levels in 2020 due to implementation thereof. Since CEQA is concerned about the existing condition at the time the Notice of Preparation is prepared, BAAQMD staff believe it would be premature to assume ARB’s plan would ensure significant impacts did not occur at this time.
BAAQMD EDAW CEQA Thresholds of Significance 63 Revised Draft Options and Justification Report
However, as progress is made with the DRRP, a greater level of confidence may develop such that the future impact of implementation could be taken into consideration as reasonably foreseeable under CEQA.
Option 2: Source-Based Approach
This approach would focus on the cancer and non-cancer risk to new receptors that occur due to existing stationary and mobile sources located within 1,000 feet from the new receptor.
The 1,000 foot distance was selected based on several factors. A summary of research findings in CARB’s Land Use Compatibility Handbook (CARB 2005) indicates that traffic-related pollutants were higher than regional levels within approximately 1,000 feet downwind and that differences in health-related effects (such as asthma, bronchitis, reduced lung function, and increased medical visits) could be attributed in part to the proximity to heavy vehicle and truck traffic within 300 to 1,000 feet of receptors. Although CARB has recommended avoiding siting sensitive land uses within 500 feet of a freeway or high-volume urban roads, this option uses 1,000 feet based on research that has indicated attributable increased health effects in some cases out to as far as 1,000 feet. In the same study, CARB recommended avoiding siting sensitive land uses within 1,000 feet of a distribution center and major rail yard, which supports the use of a 1,000 feet evaluation distance in case such sources may be relevant to a particular project setting. A second consideration is that studies have shown that the concentrations of particulate matter tends to be reduced substantially or can even be indistinguishable from upwind background concentrations a distance 1,000 feet downwind from sources such as freeways or large distribution centers (Zhu et al. 2002, CARB 2005). Finally, a 1,000 foot zone of influence is also supported by Health & Safety Code §42301.6 (Notice for Possible Source Near School).
Projects that proposed new receptors would be required to evaluate the potential cancer and non-cancer risks from mobile and stationary sources that are located within 1,000 feet. If the cancer risk from all sources within 1,000 feet exceeds 10 in a million or the non-cancer risk (chronic or acute) would be greater than a Hazard Index of 1.0, then the project TAC impacts would be considered significant.
Where new receptors are located in areas closer than 1,000 feet of major TAC sources such as freeways or high volume urban roadways, distribution centers, rail yards, ports or other TAC sources, it is probable that impacts may exceed the thresholds included in this option. Thus, proposed residential and other development with sensitive receptors (such as senior centers, health centers, and schools) in such areas would likely be identified as having significant impacts through application of this threshold and require CEQA evaluation through a Mitigated Negative Declaration (if mitigation available to reduce to below threshold levels) or an EIR (if feasible mitigation cannot be identified).
Option 3: San Francisco Department of Health Ambient Standard Approach for Roadway Exposure
The City and County of San Francisco Department of Public Health (SFDPH) has recommended a methodology for the analysis of impacts to new receptors relative to roadway exposure. The methodology includes a six step approach to avoid future land use air quality conflicts from busy roadways as follows (City and County of San Francisco Public Health Department 2008):
► Hazard Identification - Screening projects for exposure to high traffic volumes using data from Caltrans, local Public Works Departments, the California Environmental Health Tracking Program's (CEHTP) spatial linkage web service, or prior EIRs. In this approach a potential hazard exists if average daily traffic volume exceeds the following thresholds: 100,000 vehicles/day within a 150 meter radius; 50,000 vehicles/day within a 100 meter radius; or 10,000 vehicles /day within a 50 meter radius. The threshold of 100,000 vehicles with a 150 meter radius roughly corresponds to the CARB guidance avoiding sensitive uses. Thresholds for 100 meters and 50 meters are equivalent with regards to area traffic volume density.
EDAW BAAQMD Revised Draft Options and Justification Report 64 CEQA Thresholds of Significance
► Exposure Assessment – If a potential hazard for a new residential project is identified through screening of traffic volumes, then an examination of air quality exposure is done on a project-level basis by estimating the concentration of PM2.5 contributed by proximate roadway sources within a 150 meter radius of the project. This analysis can be done using physical based dispersion models using local data on vehicle volumes, vehicle types, emissions characteristics, meteorology. SFDPH recommends CAL3QHCR Line Source Dispersion Model with best available local meteorology. Other dispersion models may be appropriate as well.
► Action Threshold for Mitigation - Compare roadway contribution to annual average PM2.5 concentration to an action threshold of 0.2 µg/m3 of PM2.5. SFDPH identified the rationale for this threshold as follows:
o A threshold of 0.2 µg/m3 represents about 8-10 percent of the intra-urban range of PM2.5 ambient concentration based on available and reliable monitoring data in San Francisco.
o A change in ambient concentration of PM2.5 by 0.2 µg/m3, independent of other vehicle pollutants would result in significant forecasted health impacts. Based on a study of intra-urban pollution in Los Angeles, a 0.2 µg/m3 increase in PM2.5 would result in a 0.28 percent increase in non-injury mortality or an increase of about twenty-one excess death per 1,000,000 population per year from non-injury causes in San Francisco (Jerrett 2005). Applying the health effects assessment methodology and Concentration Response Functions in the CARB Staff Report on AAQS for PM published in 2002. A 0.2 µg/m3 increase inPM2.5 affecting a population of 100,000 adults would result in about 20 extra premature deaths per year (CARB 2002). These effects are well above the one-in-a-million lifetime de minimus risk threshold for premature death considered insignificant by most regulatory agencies (Asante-Duah 2002). A 0.2 µg/m3 increase in PM2.5 would also result in ~160 days per year with respiratory symptoms, 108 days with work limitations, and 577 days with minor activity limitations in the same adult population.
► Health Effects Analysis - For sites with roadway contributions to PM2.5 above the threshold concentration quantify potential effects of roadway-related exposures to criteria and non-criteria pollutants on health outcomes using established risk assessment principles. Comprehensive health effects analysis involving identifying sensitive (receptors) populations, estimating exposure, and calculating health risks.
► Mitigation –For sites with roadway contributions to PM2.5 above the threshold concentration, prevent exposure or apply mitigations using the following hierarchy:
1. Relocate project outside hazardous zones around roadway of concern
2. Reroute or reduce traffic through circulation changes or traffic demand reduction.
3. Provide mechanical ventilation systems with best available supply intake air location; with fresh air filtration and building designs; and with reduced infiltration to mitigate particulate exposure.
► Disclosure - Disclosure of exposure, health risks and included mitigations to future residents.
Based on modeling completed by SFDPH, the action threshold of 0.2 µg/m3 of PM2.5 is presently exceeded in areas along Highway 101, Highway 80 (approach to the Bay Bridge), and Highway 280, and along numerous major streets in San Francisco, particularly in the downtown area.
Option 4: Consistency with Community Risk Reduction Plan
This approach consists of evaluating whether a project is consistent with an adopted qualified Community Risk Reduction Plan. The goal of a Community Risk Reduction Plan would be to bring TAC and PM2.5 concentrations
BAAQMD EDAW CEQA Thresholds of Significance 65 Revised Draft Options and Justification Report
for the entire community covered by the Plan down to acceptable levels as identified by the local jurisdiction and approved by the Air District. This approach provides local agencies a proactive alternative to addressing communities with high levels of risk on a project-by-project approach. This approach is supported by CEQA Guidelines Section 15030(a)(3), which provides that a project’s contribution to a cumulative problem can be less than cumulatively considerable “if the project is required to implement or fund its fair share of a mitigation measure or measures designed to alleviate the cumulative impact.” This approach is also further supported by CEQA Guidelines Section 15064(h)(3), which provides that a project’s contribution to a cumulative effect is not considerable “if the project will comply with the requirements in a previously approved plan or mitigation program which provides specific requirements that will avoid or substantially lessen the cumulative problem.”
Qualified Community Risk Reduction Plans
A qualified Community Risk Reduction Plan adopted by a local jurisdiction should:
► Evaluate current and future emissions and concentrations of TACs and PM2.5.
► Establish risk and exposure reduction targets for the community, including for subareas located near sources of air pollution.
► Identify measures to reduce exposures.
► Identify implementation measures to reduce exposures.
► Includes procedures for monitoring and updating the TAC inventory, modeling and reduction measures, in coordination with Air District staff.
► Include a certified CEQA document.
Staff Recommendation and Justification for Siting a New Source or New Receptor
Staff is recommending a threshold that combines elements of Siting a New Source Options 1 (Current Approach) and 3 (Tiered Approach), and Siting a New Receptor Option 4 (Consistency with Community Risk Reduction Plan). The recommended threshold would apply to both siting new sources and siting new receptors. Thus the staff-recommendation is a tiered approach to the consideration of community risk and hazard impacts.
Projects consistent with a qualified CRRP adopted by the local jurisdiction that includes enforceable measures to reduce the community risk to acceptable levels would be considered less than significant.
Proposed development projects that are not consistent with a CRRP that has been adopted for the area where the project is proposed to be located would be considered to have a significant impact.
Projects proposed in areas where a CRRP has not been adopted and the potential exits to expose sensitive receptors or the general public to emissions-related risk in excess of the following thresholds from any source would be considered to have a significant air quality impact:
► Increased Cancer Risk to Maximally Exposed Individual (MEI) - Emissions from a new source or emissions affecting a new receptor would be considered significant where ground-level concentrations of carcinogenic TACs from any source result in an increased cancer risk greater than 10.0 in one million.
EDAW BAAQMD Revised Draft Options and Justification Report 66 CEQA Thresholds of Significance
► Increased Non-Cancer Risk to MEI – Emissions from a new source or emissions affecting a new receptor would be considered significant where ground-level concentrations of non-carcinogenic TACs result in an increased chronic or acute Hazard Index from any source greater than 1.0.
► Increased Ambient Concentration ofPM2.5 – Emissions from a new source or emissions affecting a new receptor would be considered significant where ground-level concentrations of PM2.5 from any source would result in an average annual increase greater than 0.3 µg/m3.
These thresholds would apply to stationary, area, and mobile sources of TAC emissions.
This combined approach would be protective of ambient air quality through the inclusion of a PM2.5 threshold. Further, by providing an ambient threshold for PM2.5, this approach would establish a bright line standard concerning particulate exposure that is consistent with EPA permitting requirements for stationary sources. The 10.0 cancer risk threshold is supported by EPA’s guidance for conducting air toxics analyses and making risk management decisions at the facility and community-scale level which considers a range of “acceptable” cancer risks from one in a million to one in ten thousand. The conclusion that land use projects that comply with qualified Community Risk Reduction Plans are less than significant is supported by CEQA Guidelines Sections 15030(a)(3) and 15064(h)(3), which provides that a project’s contribution to a cumulative problem can be less that cumulatively considerable if the project is required to implement or fund its fair share of a mitigation measure or measures designed to alleviate the cumulative impact.
Accidental Releases of Acutely Hazardous Air Emissions
Staff recommends continuing with the current threshold for the accidental release of hazardous air pollutants. Staff recommends that agencies consult with the California Emergency Management Agency for the most recent guidelines and regulations for the storage of hazardous materials. Staff recommends that projects using or storing acutely hazardous materials locating near existing receptors, and projects resulting in receptors locating near facilities using or storing acutely hazardous materials be considered significant.
4.2.4.3 CUMULATIVE TOXIC AIR CONTAMINANT IMPACTS
Cumulative Option 1 – Incremental Risk Approach
This approach would use the project-level thresholds as the threshold for evaluating a cumulative contribution of TAC emissions. Thus, if a project were determined to be less than significant under a project-level threshold (such as 10 in a million cancer risk for non-impacted communities using the threshold from Siting New Sources Option 1), then the project would also have a less than considerable contribution to cumulative significant TAC impacts. This approach is relatively common in use in assessment of cumulative TAC impacts in CEQA documents in the Bay Area today. The focus would be on assessing the incremental risk increase associated with the project. This approach would only apply to consideration of siting new sources as all of the thresholds for siting new receptors described above are in essence cumulative thresholds already as they consider the existing TAC risk related to the location of new development.
Cumulative Option 2 – Absolute Risk Approach
This approach is a hybrid approach that combines aspects of the health-based approach of Option 1 and the source-based approach of Option 2 described above for siting new receptors. Projects proposing a new TAC source would need to assess their impact within 1,000 feet taking into account cumulative sources (i.e. proposed project plus existing and foreseeable future projects). Projects proposing new receptors would need to assess the impact of cumulative sources located within 1,000 feet of the receptor. Cumulative sources are the combined total risk values of each individual source within the 1,000-foot evaluation zone. The significance threshold of
BAAQMD EDAW CEQA Thresholds of Significance 67 Revised Draft Options and Justification Report
100 in a million increased excess cancer risk and Hazard Index of 1.0 would be applied to the cumulative emissions within the 1,000-foot evaluation zone. The 100 in a million threshold is based on EPA guidance for conducting air toxics analyses and making risk management decisions at the facility and community-scale level. The guidance considers an “acceptable” range of cancer risks to be from one in a million to one in ten thousand. In protecting public health with an ample margin of safety, EPA strives to provide maximum feasible protection against risks to health from hazardous air pollutants (HAPs) by limiting risk to a level no higher than the one in ten thousand (100 in a million) estimated risk that a person living near a source would be exposed to at the maximum pollutant concentrations for 70 years. This goal is described in the preamble to the benzene National Emissions Standards for Hazardous Air Pollutants (NESHAP) rulemaking (54 Federal Register 38044, September 14, 1989) and is incorporated by Congress for EPA’s residual risk program under Clean Air Act (CAA) section 112(f). The 100 in a million excess cancer cases is also consistent with the ambient cancer risk in the most pristine portions of the Bay Area based on the District’s recent regional modeling analysis.
In addition, this option would add an ambient standard for PM2.5 of 0.8 µg/m3 due to cumulative sources within the 1,000-foot evaluation zone. The PM2.5 concentration level of 0.8 µg/m3 is based on a proposed rule being evaluated by U.S. EPA in developing significant impacts levels (SILs) for prevention of significant deterioration for particulate matter less than 2.5 micrometers (Federal Register 40 CFR Parts 51 and 52, September 21, 2007). EPA is proposing a PSD threshold of 0.8 µg/m3 as the cumulative threshold for all PM2.5 sources. The 0.8 µg/m3 standard was developed by scaling the PM10 SIL values by the ratio of direct PM2.5 to direct PM10 emissions. The PM2.5/PM10 emissions ratio is based on the national average derived from the 2001 extrapolation of the EPA’s 1999 National Emissions Inventory. The District believes that the 0.80 µg/m3, which is based on direct PM emissions, is more representative of the mixture of PM sources in the Bay Area. In a recent PM study, the Air District found that direct emissions from wood burning and fossil fuel combustion contribute over one-half of annual PM2.5 emissions. This threshold is also consistent with the estimated California background level and the estimated background level of the more remote areas of the Bay Area. The rationale for selecting 1,000 feet was explained in the discussion of Option 2 for siting new receptors above.
This threshold is also supported from several medical research studies that have linked near-road pollution exposure to a variety of adverse health outcomes impacting children and adults. One notable study conducted by Dr. Michael Kleinman and colleagues at the EPA-funded Southern California Particle Center studied the potential of roadway particles to aggravate allergic and immune responses in mice. Using mice that were not inherently susceptible, the researchers placed these mice at various distances downwind of State Road 60 and Interstate 5 freeways to test the effect these roadway particles have on their immune system. They found that within 5 meters of the roadway, there was a significant allergic response and elevated production of specific antibodies. At 150 meters (492 feet) and 500 meters (1,640 feet) downwind of the roadway, these effects were not statistically significant. In another significant study, the University of Washington (Ven Hee et al, 2009) conducted a survey involving 3,827 participants that aimed to determine the effect of residential traffic exposure on two preclinical indicators of heart failure; left ventricular mass index (LVMI), measured by the cardiac magnetic resonance imaging (MRI), and ejection fraction. The studies classified participants based on the distance between their residence and the nearest interstate highway, state or local highway, or major arterial road. Four distance groups were defined: less than 50 meters (165 feet), 50-100 meters, 101-150 meters, and greater than 150 meters. After adjusting for demographics, behavioral, and clinical covariates, the study found that living within 50 meters of a major roadway was associated with a 1.4 g/m2 higher LVMI than living more than 150 meters from one. This suggests an association between traffic-related air pollution and increased prevalence of a preclinical predictor of heart failure among people living near roadways. To quantify the roadway concentrations that are contributing to the health impacts, the Air District modeled the scenario studied by Dr. Kleinman. In Dr. Kleinman’s study emissions were estimated for Los Angeles using the EMFAC model. Annual average vehicle traffic data taken from Caltrans was used in the roadway model
EDAW BAAQMD Revised Draft Options and Justification Report 68 CEQA Thresholds of Significance
(CAL3QHCR) to estimate the downwind PM2.5 concentrations at 50 meters and 150 meters. Additionally, emissions were assumed to occur from 10:00 a.m. to 2:00 p.m. corresponding to the time in which the mice were exposed during the study. The results of the modeling indicate that at 150 meters, the downwind concentration is 0.78 µg/m3, which is consistent with the EPA-recommended SIL of 0.8 µg/m3.
Staff Recommendation and Justification
Staff is recommending a threshold that combines elements of Cumulative Option 2 (Absolute Risk Approach) and Siting a New Receptor Option 4 (Consistency with Community Risk Reduction Plan). Staff recommends this approach as the cumulative threshold for siting a new source or receptor. Projects consistent with a qualified CRRP adopted by the local jurisdiction that includes enforceable measures to reduce the community risk to acceptable levels would be considered less than significant. Proposed development projects that are not consistent with a CRRP that has been adopted for the area where the project is proposed to be located would be considered to have a significant impact. Projects proposed in areas where a CRRP has not been adopted and the potential to expose sensitive receptors or the general public to emissions-related risk in excess of the following thresholds from any source would be considered to have a significant air quality.
This approach would require evaluation of cancer and non-cancer risk from cumulative mobile and stationary sources within 1,000 feet of a new source or receptor, and the use of a 100 in a million cancer risk, a non-cancer (chronic or acute) Hazard Index of 1.0, and an ambient standard for PM2.5 of 0.8 µg/m3 as thresholds for cumulative risk from sources within the 1,000 foot evaluation area.
As noted above, the 1,000-foot evaluation distance is supported by research-based findings concerning dispersion from roadways and large sources showing that emissions diminish substantially between 500 and 1,000 feet from large emission sources. The 100 in a million threshold is supported by EPA air toxics analysis and risk management guidelines which consider the range of acceptable cancer risk to be from one in a million to one in ten thousand (100 in a million). EPA defines this level as the level necessary to protect public health from hazardous air pollutants with an ample margin of safety. The 0.8 µg/m3 threshold is supported by EPA’s proposed cumulative PSD threshold for all PM2.5 sources and studies that examined the potential health impacts of roadway particles. These threshold levels are appropriate for promoting review of emissions sources to prevent deterioration of air quality. Using existing and EPA-proposed environmental standards in this way to establish CEQA thresholds of significance is an appropriate and effective means of promoting consistency in significance determinations and integrating CEQA environmental review activities with other areas of environmental regulation.
4.2.5 ODOR IMPACTS
4.2.5.1 CURRENT APPROACH
The BAAQMD considers a project locating near an existing source of odors as having a significant odor impact if it is proposed for a site that is closer to an existing odor source than any location where there has been:
► More than one confirmed complaint per year averaged over a three year period; or ► More than three unconfirmed complaints per year averaged over a three year period.
If the proposed project is located farther than the screening distance for the source of the odors identified in Table 19, the odor impacts are considered less than significant.
If a proposed project is determined to result in potential odor problems as defined by the criteria in District Regulation 7: Odorous Substances, and sensitive receptors are located closer than the screening distance in Table
BAAQMD EDAW CEQA Thresholds of Significance 69 Revised Draft Options and Justification Report
20, the BAAQMD recommends that mitigation measures should be identified to reduce a potentially significant impact.
Table 20 - BAAQMD Screening Distances for Potential Odor Sources Type of Operation Project Screening Distance
Wastewater Treatment Plant 2 miles Wastewater Pumping Facilities 1 mile
Sanitary Landfill 2 miles Transfer Station 1 mile
Composting Facility 1 mile Petroleum Refinery 2 miles Asphalt Batch Plant 2 miles
Chemical Manufacturing 2 miles Fiberglass Manufacturing 1 mile
Food Processing Facility 1 mile Confined Animal Facility/Feed Lot/Dairy 1 mile Green Waste and Recycling Operations 1 mile
Coffee Roaster 1 mile
The odor threshold of significance could affect all projects, regardless of size, and require mitigation for odor impacts.
4.2.5.2 SITING A NEW RECEPTOR OR SOURCE
Odors are generally considered a nuisance, but can result in a public health concern. Some land uses that are needed to provide services to the population of an area can result in offensive odors, such as filling portable propane tanks or recycling center operations. When a proposed project includes the siting of sensitive receptors in proximity to an existing odor source, or when siting a new source of potential odors, the following qualitative evaluation should be performed.
When determining whether potential for odor impacts exists, it is recommended that Lead Agencies consider the following factors and make a determination based on evidence in each qualitative analysis category:
► Distance: Use the screening-level distances in Table 20.
► Wind Direction: Consider whether sensitive receptors are located upwind or downwind from the source for the most of the year. If odor occurrences associated with the source are seasonal in nature, consider whether sensitive receptors are located downwind during the season in which odor emissions occur.
► Complaint History: Consider whether there is a history of complaints associated with the source. If there is no complaint history associated with a particular source (perhaps because sensitive receptors do not already exist in proximity to the source), consider complaint-history associated with other similar sources in
EDAW BAAQMD Revised Draft Options and Justification Report 70 CEQA Thresholds of Significance
BAAQMD’s jurisdiction with potential to emit the same or similar types of odorous chemicals or compounds, or that accommodate similar types of processes.
► Character of Source: Consider the character of the odor source, for example, the type of odor events according to duration of exposure or averaging time (e.g., continuous release, frequent release events, or infrequent events).
► Exposure: Consider whether the project would result in the exposure of a substantial number of people to odorous emissions.
4.2.5.3 STAFF RECOMMENDATION AND JUSTIFICATION
BAAQMD staff recommends continuing the current CEQA significance threshold for odors (based on complaint history) and incorporation of the qualitative approach described above, in order to better assist lead agencies with the screening-level analysis. The current approach has proven adaptable to different projects and locations and thus continuation of the current approach with more qualitative guidance is considered an appropriate approach to CEQA evaluation.
4.3 PLAN-LEVEL IMPACT THRESHOLDS
4.3.1 PLAN-LEVEL CRITERIA POLLUTANTS AND OZONE PRECURSORS
4.3.1.1 OPTION 1 – CURRENT APPROACH
General Plans of cities and counties must show consistency with regional plans and policies affecting air quality to claim a less than significant impact on air quality. General plan amendments, redevelopment plans, specific area plans, annexations of lands and services, and similar planning activities should receive the same scrutiny as general plans with respect to consistency with regional air quality plans. For a proposed local plan to be consistent with the regional air quality plan it must be consistent with the most recently adopted AQP, which are updated approximately every three years.
All of the following criteria must be satisfied for a proposed plan to be determined to be consistent with the AQP, and therefore, result in a less than significant impact on air quality.
Determining Local Plan Consistency
Proposed Plans must show over the planning period of the plan that:
► Population growth for the jurisdiction will not exceed the values included in the current AQP, and ► The rate of increase in VMT for the jurisdiction is equal to or lower than the rate of increase in population.
Determining Local Plan Consistency with Clean Air Plan Transportation Control Measures
Determining consistency of local plans with the AQP also involves assessing whether AQP transportation control measures (TCMs) for which local governments are implementing agencies are indeed being implemented and are effective in reducing vehicle travel. The AQP identifies implementing agencies/entities for each of the TCMs included in the AQP. Local plans that do not demonstrate reasonable efforts to implement TCMs in the AQP would be considered to be inconsistent with the regional air quality plan and therefore have a significant air quality impact.
BAAQMD EDAW CEQA Thresholds of Significance 71 Revised Draft Options and Justification Report
4.3.1.2 OPTION 2 – MODIFIED CURRENT APPROACH
Over the years staff has received comments on the difficulties inherent in the current approach regarding the consistency tests for population and VMT growth. First, the population growth estimates used in the most recent AQP can be up to several years older than growth estimates used in a recent plan update, creating an inconsistency in this analysis. Staff recommends that this test of consistency be eliminated because the Air District and local jurisdictions all use regional population growth estimates that are disaggregated to local cities and counties. In addition, the impact to air quality is not necessarily growth but where that growth is located. The second test, rate of increase in vehicle use compared to growth rate, will determine if planned growth will impact air quality. Compact infill develop inherently has less vehicle travel and more transit opportunities than suburban sprawl. Second, the consistency test of comparing the rate of increase in VMT to the rate of increase in population has been problematic at times for practitioners because VMT is not always available with the project analysis. Staff recommends that either the rate of increase in VMT or vehicle trips be compared to the rate of increase in population. Staff also recommends that the growth estimates used in this analysis be for the years covered by the plan. Staff also recommends that the growth estimates be obtained from the Association of Bay Area Governments since the Air District uses ABAG growth estimates for air quality planning purposes. 4.3.1.3 STAFF RECOMMENDATION
Staff recommends Option 2. This approach achieves the same goals as the Air District’s current approach while alleviating the existing analytical difficulties and the inconsistency of comparing a plan update with AQP growth projections that may be up to several years old. Eliminating the analytical inconsistency provides better nexus and proportionality for evaluating air quality impacts for plans. 4.3.2 PLAN-LEVEL GHG THRESHOLD OPTIONS
4.3.2.1 OPTION 1: GHG EFFICIENCY APPROACH
Option 1 proposes the development of a GHG-efficiency metric (e.g., GHG emissions per unit) which would enable comparison of a proposed general plan to its alternatives and to determine if the proposed general plan meets AB 32 emission reduction goals.
AB 32 identifies local governments as essential partners in achieving California’s goal to reduce GHG emissions. Local governments have primary authority to plan, zone, approve, and permit how and where land is developed to accommodate population growth and the changing needs of their jurisdiction. ARB has developed the Local Government Operations Protocol and is developing a protocol to estimate community-wide GHG emissions. ARB encourages local governments to use these protocols to track progress in reducing GHG emissions. ARB encourages local governments to institutionalize the community’s strategy for reducing its carbon footprint in its general plan. SB 375 creates a process for regional integration of land development patterns and transportation infrastructure planning with the primary goal of reducing GHG emissions from the largest sector of the GHG emission inventory, light duty vehicles.
If the statewide AB 32 GHG emissions reduction context is established, GHG efficiency can be viewed independently from the jurisdiction in which the plan is located. Normalizing projected 2020 mass of emissions from land use-related emissions sectors by comparison to a demographic unit (e.g., population and employment) provides evaluation of the GHG efficiency of a project and the opportunity to evaluate the project’s consistency with AB 32 targets.
EDAW BAAQMD Revised Draft Options and Justification Report 72 CEQA Thresholds of Significance
Two approaches are considered for efficiency metrics. Option 1A would consider efficiency in terms of the GHG emissions compared to the sum of the number of jobs and the number of residents at a point in time, which is referred to as the “service population” (SP). Option 1B would consider efficiency in terms of GHG emissions per capita. GHG efficiency metrics were developed (see Table 20) for the emissions rates at the State level that would accommodate projected growth (as indicated by population and employment growth) under trend forecast conditions, and the emission rates needed to accommodate growth while allowing for consistency with the goals of AB 32 (i.e., 1990 GHG emissions levels by 2020).
If a general plan demonstrates, through dividing the emissions inventory projections (MT CO2e) by the amount of growth that would be accommodated in 2020, that it could meet the GHG efficiency metrics proposed in this section (either 6.7 MT CO2e/capita or 4.6 MT CO2e/SP as noted in Table 21), then the amount of GHG emissions associated with the general plan would be considered less than significant, regardless of its size (and magnitude of GHG emissions). In other words, the general plan would accommodate growth in a manner that would not hinder the State’s ability to achieve AB 32 goals, and thus, would be less than significant for GHG emissions and their contribution to climate change.
Table 21 - California GHG Emissions, Population Projections and GHG Efficiency Thresholds 1990 2002-2004 Average 2020
Population 29,758,213 36,199,342 44,135,923 Employment 14,294,100 16,413,400 20,194,661 California Service Population (Population + Employment) 44,052,313 52,612,742 64,330,584 Projected GHG emissions (metric tons CO2e)/capita1 9.93 8.92 9.07 Projected GHG emissions (metric tons CO2e)/SP1 6.71 6.14 6.22 AB 32 Goal GHG emissions (metric tons CO2e)/capita1 6.70 AB 32 Goal GHG emissions (metric tons CO2e)/SP1 4.59
Notes: AB = Assembly Bill; CO2e = carbon dioxide equivalent; GHG = greenhouse gas; SP = service population. 1 Greenhouse gas efficiency levels were calculated using only the “land use-related” sectors of ARB’s emissions inventory. Please refer to Appendix D for detailed calculations. Sources: Data compiled by EDAW 2009, ARB 2009a, DOF 2009, EDD 2009, ICF Jones & Stokes 2009.
Both efficiency metrics would not penalize well-planned communities that propose a large amount of development. Instead, GHG efficiency metrics act to encourage the types of development that BAAQMD and OPR support (i.e., infill and transit-oriented development) because they tend to reduce GHG and other air pollutant emissions overall, rather than discourage large developments for being accompanied by a large mass of GHG emissions. Plans that are more GHG efficient would have no or limited mitigation requirements which would help them complete the CEQA process for General Plans and other plans more readily than plans that promote GHG inefficiencies which will require detailed design of mitigation during the CEQA process and could subject a plan to potential challenge as to whether all feasible mitigation was identified and adopted. This type of threshold can shed light on a well-planned general plan that accommodates a large amount of growth in a GHG-efficient way.
However, there are distinct and different advantages to the two sub options for this threshold.
The per-capita approach follows a long history of expressing planning goals on a per person basis. Further per-capita approaches are broadly understood by the public in general and thus use of such an approach for GHG would be readily comprehensible by lead agencies, staff, developers, stakeholders, and local residents. In order to accurately apply a per-capita approach, the transportation emissions of land use development must not be limited
BAAQMD EDAW CEQA Thresholds of Significance 73 Revised Draft Options and Justification Report
to the jurisdiction itself and must consider regional travel both inbound and outbound from the jurisdiction to get a full picture of the GHG emissions for that jurisdiction. This can be done by running regional travel demand models during General Plan Development and splitting emissions between origins and destinations.
The Service Population metric could allow decision makers to compare GHG efficiency of general plan alternatives that vary residential and non-residential development totals, encourages GHG efficiency through improving jobs/housing balance. This approach would not give preference to communities that accommodate more residential (population-driven) land uses than non-residential (employment driven) land uses which could occur with the per capita approach A potential challenge for the Service Population metric is that within metropolitan areas there is great variation in the balance of land uses within different jurisdictions. Just because a particular jurisdiction or plan area may be heavily residential does not inherently mean that it is necessarily inefficient for GHG transportation emissions; one must consider the geographic placement of that jurisdiction relative to transit and job centers. Further, although a particular jurisdiction may be relatively balanced between residential use and employment, if the employment profile does not match the residential occupational profiles, there could still be substantial inbound and outbound trips that might not be captured by the Service Population metric depending on how the transportation analysis is done. However, similar to that noted above for a per capita approach, if a full regional accounting of transportation emissions from both residential and non-residential land use is conducted then comparative use of the service population metric could be valid.
When analyzing long-range plans, such as general plans, it is important to note that the planning horizon will often surpass the 2020 timeframe for implementation of AB 32. Executive Order S-3-05 establishes a more aggressive emissions reduction goal for the year 2050 of 80 percent below 1990 emissions levels. The year 2020 should be viewed as a milestone year, and the general plan should not preclude the community from a trajectory toward the 2050 goal. However, the 2020 timeframe is examined in this threshold evaluation because doing so for the 2050 timeframe (with respect to population, employment, and GHG emissions projections) would be too speculative. Advances in technology and policy decisions at the state level will be needed to meet the aggressive 2050 goals. It is beyond the scope of the analysis tools available at this time to examine reasonable emissions reductions that can be achieved through CEQA analysis in the year 2050. As the 2020 timeframe draws nearer, BAAQMD will need to reevaluate the threshold to better represent progress toward 2050 goals.
4.3.2.2 OPTION 2: CURRENT APPROACH PLUS CLIMATE ACTION PLAN-FOCUSED APPROACH
This approach would also build on the current approach to evaluating the significance of proposed plans on local and regional air quality by extending it to, and including GHG emissions. Local jurisdictions that may not initiate a general plan update for a number of years, or may decide to address GHG emissions in a stand-alone Climate Action Plan.
Option 2 would require an analysis demonstrating that the Climate Action Plan (or similar adopted policies, ordinances and programs) is consistent with all of the AB 32 Scoping Plan measures and goals. The Climate Action Plan should identify a land use design, transportation network, goals, policies and implementation measures that would achieve a 26.2 percent reduction in GHG emissions relative to 2020 emissions levels as discussed in the section above and calculated in Appendix C. As discussed previously, 26.2 percent was calculated relative to 2020 emissions projections from the “land use-related” GHG emissions sectors only (e.g., the sectors over which local government would have financial, operational, or discretionary control through land use entitlement authority; see Appendix C).
Qualified Climate Action Plans
A qualified Climate Action Plan adopted by a local jurisdiction should include the following:
EDAW BAAQMD Revised Draft Options and Justification Report 74 CEQA Thresholds of Significance
► GHG Inventory for Current Year and Forecast for 2020 (and for 1990 if the reduction goal is based on 1990 emission levels).
► An adopted GHG Reduction Goal for 2020 for the jurisdiction from all sources (existing and future) which is at least one of the following: 1990 GHG emission levels, 15 percent below 2008 emission levels, or 28 percent below BAU Forecasts for 2020 (if including non-land use sector emissions in the local inventory; otherwise can use 26.2 percent if only including land use sector emissions).
► Identification of feasible reduction measures to reduce GHG emissions for 2020 to the identified target.
► Application of relevant reduction measures included in the AB 32 Scoping Plan that are within the jurisdiction of the local land use authority (such as building energy efficiency, etc.).
► Quantification of the reduction effectiveness of each of the feasible measures identified including disclosure of calculation method and assumptions.
► Identification of implementation steps and financing mechanisms to achieve the identified goal by 2020.
► Procedures for monitoring and updating the GHG inventory and reduction Measures at least twice before 2020 or at least every five years.
► Identification of responsible parties for Implementation.
► Schedule of implementation.
► Certified CEQA document.
Local Climate Action Policies, Ordinances and Programs
Air District staff recognize that many communities in the Bay Area have been proactive in planning for climate change but have not yet developed a stand-alone Climate Action Plan that meets the above criteria. Many cities and counties have adopted climate action policies, ordinances and program that may in fact achieve the goals of a qualified climate action plan. Staff recommends that if a local jurisdiction can demonstrate that its collective set of climate action policies, ordinances and other programs is consistent with AB 32, includes requirements or feasible measures to reduce GHG emissions and achieves one of the following GHG emission reduction goals, the AB 32 consistency demonstration should be considered equivalent to a qualified climate action plan:
► 1990 GHG emission levels,
► 15 percent below 2008 emission levels, or
► 28 percent below BAU Forecasts for 2020 (if including non-land use sector emissions in the local inventory; otherwise can use 26.2 percent if only including land use sector emissions).
4.3.2.3 STAFF RECOMMENDATION AND JUSTIFICATION
Staff’s recommendation is to combine Options 1A, 1B and 2. At this time, staff believe that all three are valid approaches to plan evaluation, are tied to the AB 32 reduction goals, would promote reductions on a plan level without impeding the implementation of GHG–efficient development, and would recognize the initiative of many Bay Area communities who have already developed or are in the process of developing a GHG reduction plan. The details required above for a qualified Climate Action Plan (or similar adopted policies, ordinances and
BAAQMD EDAW CEQA Thresholds of Significance 75 Revised Draft Options and Justification Report
programs) would provide the evidentiary basis for making CEQA findings that development consistent with the plan would result in feasible, measureable, and verifiable GHG reductions consistent with broad state goals such that projects approved under qualified Climate Action Plans or equivalent demonstrations would achieve their fair share of GHG emission reductions. .
4.3.3 LOCAL PLAN IMPACTS ASSOCIATED WITH RISKS AND HAZARDS
4.3.3.1 OPTION 1: OVERLAY ZONES BASED ON QUANTITATIVE EXPOSURE LEVEL
With this approach, for local plans to have a less-than-significant impact with respect to potential TACs, overlay zones would have to be established around existing and proposed land uses that would emit these air pollutants. Overlay zones to avoid toxic impacts should be reflected in local plan policies, land use map(s), and implementing ordinances (e.g., zoning ordinance). The overlay zones around existing and future TAC sources would be delineated using the quantitative approaches described above for project-level review and the resultant TAC buffers would be included in the General Plan (or the EIR for the General Plan) to assist in site planning. BAAQMD will provide guidance as to the methods used to establish the TAC buffers and what standards to be applied for acceptable exposure level in the updated CEQA Guidelines document. Special overlay zones of at least 500 feet on each side of all freeways and high volume roadways would be included in this threshold option.
The threshold of significance for plan impacts could affect all plan adoptions and amendments and require mitigation for a plan’s air quality impacts. Where sensitive receptors would be exposed above the acceptable exposure level, the plan impacts would be considered significant and mitigation would be required to be imposed either at the plan level (through policy) or at the project level (through project level requirements).
4.3.3.2 OPTION 2: QUANTITATIVE THRESHOLDS FOR SITING NEW SOURCES AND NEW RECEPTORS
With this approach, quantitative thresholds like those discussed above for siting new receptors and/or new sources would be included in General Plan policies. This approach would be the same as the quantitative approaches to plan compliance but would ensure that local policies matched project-level thresholds.
4.3.3.3 STAFF RECOMMENDATION AND JUSTIFICATION
Staff’s recommends Option 1 – Buffer Zones. By designating overlay zones in land use plans, local land use jurisdictions can take preemptive action before project-level review to reduce the potential for significant exposures to TAC emissions. While this will require more up-front work at the general plan level, in the long-run this approach is a more feasible approach consistent with District and CARB guidance about siting sources and sensitive receptors that is more effective than project by project consideration of effects that often has more limited mitigation opportunities. This approach would also promote more robust cumulative consideration of effects of both existing and future development for the plan-level CEQA analysis as well as subsequent project-level analysis.
4.3.4 LOCAL PLAN IMPACTS ASSOCIATED WITH ODORS
For local plans to have a less-than-significant impact with respect to potential odors, overlay zones would have to be established around existing and proposed land uses that would emit nuisance odors. Overlay zones to avoid odors should be reflected in local plan policies, land use map(s), and implementing ordinances (e.g., zoning ordinance).The threshold of significance for plan impacts could affect all plan adoptions and amendments and require mitigation for a plan’s air quality impacts. The justification for establishing overlay zone in general plans
EDAW BAAQMD Revised Draft Options and Justification Report 76 CEQA Thresholds of Significance
is the same as that articulated above for overlay zone for TAC emission sources. Guidance on appropriate buffer zones will be provided in the updated CEQA Guidelines document.
BAAQMD EDAW CEQA Thresholds of Significance 77 Revised Draft Options and Justification Report
REFERENCES
ARB. See California Air Resources Board.
Asante-Duah K. 2002. Public Health Risk Assessment for Human Exposure to Chemicals. Springer. 56-57.
BAAQMD. See Bay Area Air Quality Management District.
Bay Area Air Quality Management District. 1999 (December). BAAQMD CEQA Guidelines. San Francisco, CA.
_______. 2005. Regulation 2, Rule 2. New Source Review. Available: <http://www.baaqmd.gov/dst/regulations/rg0202.pdf>. Accessed February 2009.
_______.2006. CARE Phase 1 Findings and Policy Recommendations. Available: <http://baaqmd.gov/CARE/documents/care_p1_findings_recommendations_v2.pdf>. Accessed March 2009.
_______. 2008. Source Inventory of Bay Area Greenhouse Gas Emissions. San Francisco, CA.
California Air Pollution Control Officers Association. 2008 (January). CEQA and Climate Change. Sacramento, CA. Available: <http://www.capcoa.org/CEQA/CAPCOA%20White%20Paper.pdf>. Accessed April 10, 2009.
California Air Resources Board. 2000. Risk Reduction Plan to Reduce Particulate Matter Emissions from Diesel-Fueled Engines and Vehicles. Stationary Source Division. Mobile Source Control Division. October.
______. 2002. Staff Report: Public Hearing to Consider Amendments to the Ambient Air Quality Standards for Particulate Matter and Sulfates. Available: http://www.arb.ca.gov/research/aaqs/std-rs/pm-final/pm-final.htm.
_______. 2005. Land Use Compatibility Handbook. A Community Health Perspective. Sacramento, CA.
_______. 82008. Climate Change Proposed Scoping Plan. Sacramento, CA. Adopted in December 2008Available: <http://www.arb.ca.gov/cc/scopingplan/document/scopingplandocument.htm>. Accessed March 2009.
_______. 2009a. Greenhouse Gas Inventory and Forecast. Available: <http://www.arb.ca.gov/cc/inventory/data/tables/arb_ghg_inventory_forecast_2008_06_26.xls>. Accessed March 2009.
_______ .2009b. Preliminary Draft Staff Proposal: Recommended Approaches for Setting Interim Significance Thresholds for Greenhouse Gases under the California Environmental Quality Act. Available: <http://www.arb.ca.gov/cc/localgov/ceqa/meetings/10270prelimdraftproposal102408.pdf>. Accessed March 2009.
_______ .2009c. Area Designations and Maps. Available: <http://www.arb.ca.gov/desig/desig.htm>, Accessed April 10.
EDAW BAAQMD Revised Draft Options and Justification Report 78 CEQA Thresholds of Significance
_______. 2009d. Proposed Regulation to Implement the Low Carbon Fuel Standard, Staff Report Initial Statement Reasons. March 5. Available: http://www.arb.ca.gov/fuels/lcfs/lcfs.htm. Accessed, August 20, 2009.
CEC. See California Energy Commission.
CEC. 2007. Impact Analysis 2008 Update to the California Energy Efficiency Standards for Residential and Nonresidential Buildings. Available: <http://www.energy.ca.gov/title22008standards/rulemaking/documents/2007-11-07_IMPACT_ANALYSIS.PDF>. Accessed March 2009.
California Department of Finance. 2009. Residential Development Data: E5 – City and County Population Estimates. 2000-2050 - Race and Ethnic Populations Totals. Available: <http://www.labormarketinfo.edd.ca.gov/?pageid=145 >. Accessed February 2009.
California Economic Development Department. 2009. Commercial/Industrial Employment Data: Projections of Employment by Industry and Occupation. Available: <http://www.labormarketinfo.edd.ca.gov/?pageid=145>. Accessed February 2009.
City and County of San Francisco Department of Public Health. 2009. Assessment and Mitigation of Air Pollutant Health Effects from Intra-urban Roadways: Guidance for Land Use Planning and Environmental Review. Program on Health, Equity, & Sustainability. Occupational & Environmental Health Section. Prepared by Rajiv Bhatia and Thomas Rivard. May 6.
DOF. See California Department of Finance.
EDD. See California Economic Development Department.
EPA. See U.S. Environmental Protection Agency.
Governor’s Office of Planning and Research. 2008 (June 19). Technical Advisory: CEQA and Climate Change: Addressing Climate Change Through California Environmental Quality Act (CEQA) Review. Sacramento, CA. Available: <http://opr.ca.gov/ceqa/pdfs/june08-ceqa.pdf>. Accessed February 2009.
Intergovernmental Panel on Climate Change. 2007a (February). Climate Change 2007: The Physical Science Basis. Contribution of Working Group I to the Fourth Assessment Report of the IPCC. Geneva, Switzerland.
______.2007a (February). Climate Change 2007: Climate Change 2007:Synthesis Report Summary for Policymakers. Geneva, Switzerland. IPCC. See Intergovernmental Panel on Climate Change.
Jerrett M et al. 2005. Spatial Analysis of Air Pollution and Mortality in Los Angeles. Epidemiology. 16: 727-736
Kleinman, M.T., Sioutas, C., Froines, J.R., Fanning, E., Hamade, A., Mendez, L., Meacher, D., Oldham, M. Inhalation of Concentrated Ambient Particulate Matter Near a Heavily Trafficked Road Simulates Antigen-Induced Airway Responses in Mice; Inhal. Toxicol. 2007, 19 (Supp. 1), 117-126.
OPR. See Governor’s Office of Planning and Research.
BAAQMD EDAW CEQA Thresholds of Significance 79 Revised Draft Options and Justification Report
Rimpo and Associates. 2009. BAAQMD CEQA Projects Database. Orangevale, CA.
SFDPH. See City and County of San Francisco Department of Public Health.
UNFCCC. See United Nations Framework Convention on Climate Change.
United Nations Framework Convention on Climate Change. 2009. Article 1 of the UNFCCC. Available: http://unfccc.int/essential_background/convention/background/items/2536.php. Accessed April 8, 2009.
U.S. Environmental Protection Agency. 2008. Federal Register: Implementation of the New Source Review (NSR) Program for Particulate Matter (PM2.5) less than 2.5 Micrometers. Available: <http://www.epa.gov/fedrgstr/EPA-AIR/200May/Day-1a10768.pdf>. Accessed February 2009.
_______. 1988. C. Cowherd, et al., Control of Open Fugitive Dust Sources, EPA-450/3-88-008, U. S. Environmental Protection Agency, Research Triangle Park, NC, September 1988.
Van Hee, V.C., Adar, S.D., Szpiro, A.A., Barr, R.G., Bluemke, D.A., Diez Roux, A.V., Gill, E.A., Sheppard, L., Kaufman, J.D. Exposure to Traffic and Left Ventricular Mass and Function; Am. J. Respir. Crit. Care Med. 2009, 179 (9), 827-834.
Western Regional Air Partnership. 2006. WRAP Fugitive Dust Handbook. September 7, 2006. Available: http://www.wrapair.org/forums/dejf/fdh/content/FDHandbook_Rev_06.pdf. Accessed September 2009.
Zhu, Y. Hinds, W.C., Kim S, and Sioutas, C. 2002. Concentration and size distribution of ultrafine particles near a major highway. Journal of Air and Waste Management Association. 2002 Sep; 52 (9): 1032-42.