Final Transportation Impacts Technical Report 4.0—Affected Environment WESTSIDE SUBWAY EXTENSION August 2010 Page 4-1 4.0 AFFECTED ENVIRONMENT This section presents information about the affected environment and existing transportation conditions in the Study Area. The transportation conditions discussed include: transit systems, street and highway systems, parking, and pedestrian and bicycle facilities. 4.1 Transit While there are no fixed-guideway transit facilities on the west side of Los Angeles, there is a significant demand for transit service, notably in the east-west direction, as demonstrated by the high number of bus lines, the frequency of bus service, and the high levels of bus ridership. The subway stations proposed as part of the Westside Subway Extension are particularly well positioned to serve this demand. Proposed Station Areas are locations where a high number of existing bus lines intersect and thousands of riders access the transit system each day. 4.1.1 Regional Transit Network Since 1990, a regional fixed-guideway transit system serving Los Angeles County has been constructed. This system has heavy rail transit (HRT), light rail transit (LRT), bus rapid transit (BRT), and commuter rail components and includes more than 79 miles of Metro Rail (HRT and LRT) service, 14 miles of dedicated BRT service, and more than 500 miles of Metrolink commuter rail lines. The existing and committed system is shown in Figure 4-1. This figure illustrates the absence of regional transit options on the west side of Los Angeles. 4.1.2 Study Area Transit Network Metro is the principal transit provider in the Westside Extension Transit Corridor Study Area. The Study Area is also served by Santa Monica’s Big Blue Bus, LADOT Downtown Area Shuttle (DASH), LADOT Commuter Express, Santa Clarita Transit Commuter Express Service, Culver CityBus, West Hollywood CityLine/DayLine, and Antelope Valley Transit Authority Commuter Services. These transit service providers offer bus transit coverage on most major east-west and north- south arterials in the Study Area, as illustrated in Figure 4-2. The Study Area is well-served by bus transit, but that service must operate in mixed flow conditions which are subject to the area’s significant traffic congestion. The Study Area lacks fixed-guideway transit service that offers congestion-free, predictable travel.
Transcript
Final Transportation Impacts Technical Report
4.0—Affected Environment
W E S T S I D E S U B W A Y E X T E N S I O N August 2010 Page 4-1
4.0 AFFECTED ENVIRONMENT
This section presents information about the affected environment and existing transportation conditions in the Study Area. The transportation conditions discussed include: transit systems, street and highway systems, parking, and pedestrian and bicycle facilities.
4.1 Transit
While there are no fixed-guideway transit facilities on the west side of Los Angeles, there is a significant demand for transit service, notably in the east-west direction, as demonstrated by the high number of bus lines, the frequency of bus service, and the high levels of bus ridership. The subway stations proposed as part of the Westside Subway Extension are particularly well positioned to serve this demand. Proposed Station Areas are locations where a high number of existing bus lines intersect and thousands of riders access the transit system each day.
4.1.1 Regional Transit Network
Since 1990, a regional fixed-guideway transit system serving Los Angeles County has been constructed. This system has heavy rail transit (HRT), light rail transit (LRT), bus rapid transit (BRT), and commuter rail components and includes more than 79 miles of Metro Rail (HRT and LRT) service, 14 miles of dedicated BRT service, and more than 500 miles of Metrolink commuter rail lines. The existing and committed system is shown in Figure 4-1. This figure illustrates the absence of regional transit options on the west side of Los Angeles.
4.1.2 Study Area Transit Network
Metro is the principal transit provider in the Westside Extension Transit Corridor Study Area. The Study Area is also served by Santa Monica’s Big Blue Bus, LADOT Downtown Area Shuttle (DASH), LADOT Commuter Express, Santa Clarita Transit Commuter Express Service, Culver CityBus, West Hollywood CityLine/DayLine, and Antelope Valley Transit Authority Commuter Services.
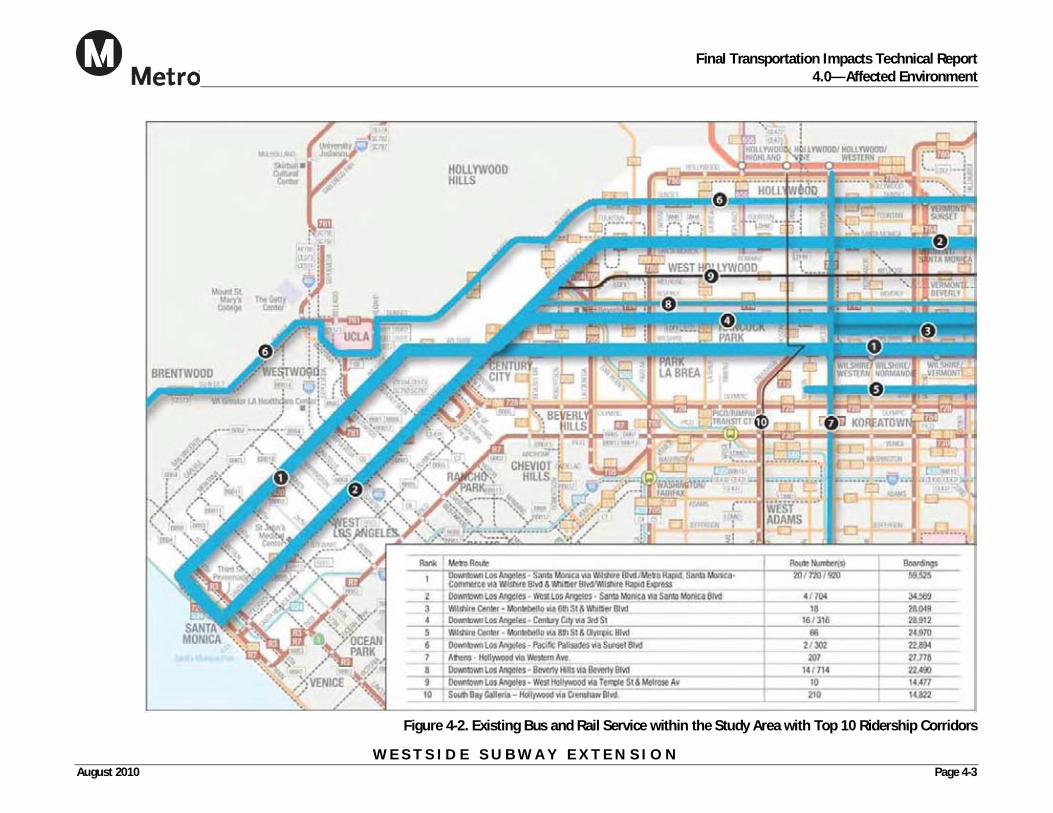
These transit service providers offer bus transit coverage on most major east-west and north-south arterials in the Study Area, as illustrated in Figure 4-2. The Study Area is well-served by bus transit, but that service must operate in mixed flow conditions which are subject to the area’s significant traffic congestion. The Study Area lacks fixed-guideway transit service that offers congestion-free, predictable travel.
Final Transportation Impacts Technical Report
4.0—Affected Environment
W E S T S I D E S U B W A Y E X T E N S I O N Page 4-2 August 2010
W E S T S I D E S U B W A Y E X T E N S I O N August 2010 Page 4-3
Figure 4-2. Existing Bus and Rail Service within the Study Area with Top 10 Ridership Corridors
Final Transportation Impacts Technical Report
4.0—Affected Environment
W E S T S I D E S U B W A Y E X T E N S I O N Page 4-4 August 2010
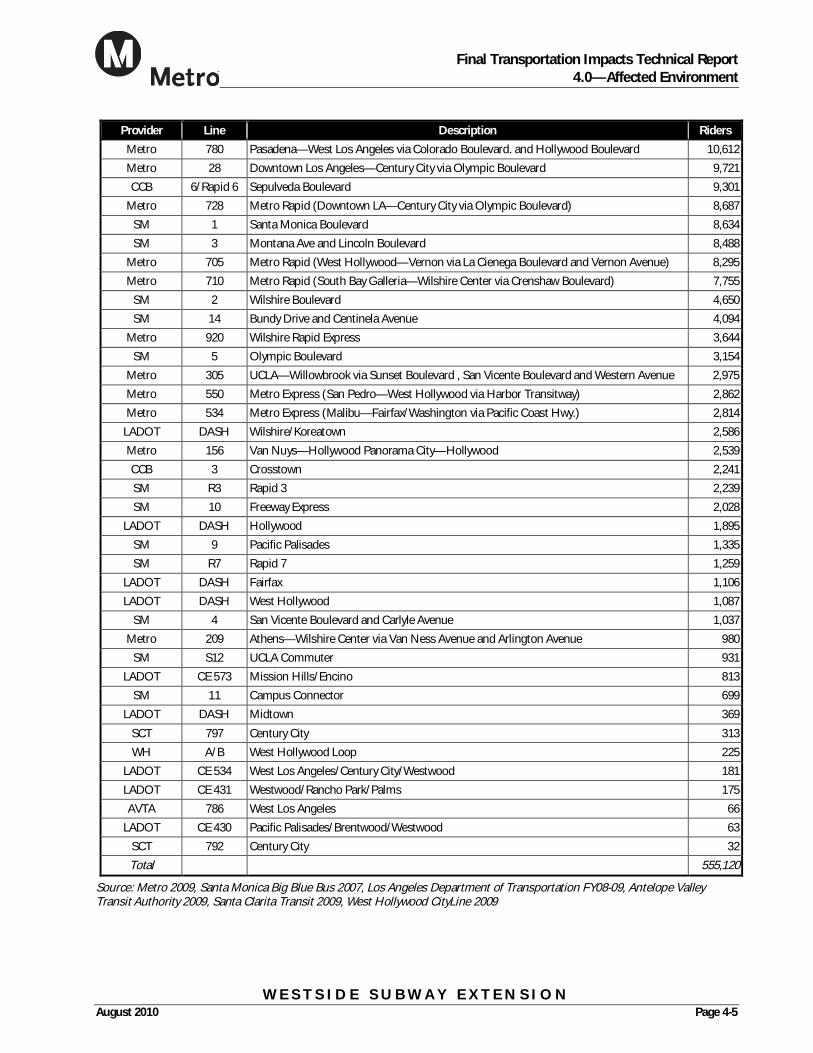
The 62 bus routes operating in the Study Area serve approximately 550,000 boardings or about 50 percent of total weekday bus ridership on all Metro bus lines. Of this total, ridership on seven east-west streets currently account for approximately 40 percent of total transit demand in the Study Area. Weekday ridership for service on these east-west streets is shown in Table 4-1. Bus ridership levels presented in Table 4-1 represent weekday boardings along seven major east-west streets in the Study Area. The distribution of route-specific ridership for the Study Area is shown in Table 4-2.
Table 4-1. Major East-West Streets/Bus Lines in Study Area
Street/Bus Line Weekday Ridership
Wilshire Boulevard/Metro 20, 720, 920, Santa Monica Big Blue Bus 2 64,200
Pico Boulevard/Metro 30 and 730, Santa Monica Big Blue Bus 7 37,929
Santa Monica Boulevard/Metro 4, Santa Monica Big Blue Bus 1 30,143
3rd Street/Metro 16 28,912
Sunset Boulevard/Metro 2 22,894
Olympic Boulevard/Metro 28 and 728, Santa Monica Big Blue Bus 5 21,562
Beverly Boulevard/Metro 14 17,272
Source: Metro 2009, Santa Monica Big Blue Bus 2007
Table 4-2. Existing Study Area Transit Service and Weekday Boardings
Provider Line Description Riders
Metro 720 Metro Rapid (Santa Monica—Commerce via Wilshire Boulevard and Whittier Boulevard) 37,613
Metro 204 Athens—Hollywood via Vermont Avenue 30,396
Metro 16 Downtown Los Angeles—Century City via 3rd Street 28,912
Metro 18 Wilshire Center—Montebello via 6th Street and Whittier Boulevard 28,049
Metro 207 Athens—Hollywood via Western Avenue 27,778
Metro 754 Metro Rapid (Athens—Hollywood via Vermont Avenue.) 22,964
Metro 2 Downtown Los Angeles—Pacific Palisades via Sunset Boulevard 22,894
Metro 4 Downtown Los Angeles—West Los Angeles—Santa Monica via Santa Monica Boulevard 21,509
Metro 30 Pico/Rimpau—Dozier/Rowan—Monterey Park via Pico Boulevard and East 1st Street 18,497
Metro 20 Downtown LA—Santa Monica via Wilshire Boulevard 18,268
Metro 14 Downtown Los Angeles—Beverly Hills via Beverly Boulevard 17,272
Metro 206 Athens—Hollywood via Normandie Avenue 17,025
Metro 210 South Bay Galleria—Hollywood via Crenshaw Boulevard 14,822
Metro 10 Downtown Los Angeles—West Hollywood via Temple Street and Melrose Avenue 14,477
Metro 212 Hawthorne—Hollywood via La Brea Avenue 13,910
SM 7 Pico Boulevard 13,639
Metro 704 Metro Rapid (Downtown Los Angeles—Santa Monica via Santa Monica Boulevard ) 13,060
Metro 105 West Hollywood—Vernon via La Cienega Boulevard and Vernon Avenue. 11,808
Metro 761 Metro Rapid (Pacoima—Westwood via Van Nuys Boulevard ) 11,675
Metro 163 West Hills Medical Center—Sun Valley/North Hollywood Station via Sherman Way and Lankershim Boulevard
11,642
Metro 180 Pasadena—Hollywood via Colorado Boulevard. and Hollywood Boulevard 10,940
Metro 217 Vermont/Sunset—Fairfax/Washington via Fairfax Avenue and Hollywood Boulevard 10,753
Final Transportation Impacts Technical Report
4.0—Affected Environment
W E S T S I D E S U B W A Y E X T E N S I O N August 2010 Page 4-5
Provider Line Description Riders
Metro 780 Pasadena—West Los Angeles via Colorado Boulevard. and Hollywood Boulevard 10,612
Metro 28 Downtown Los Angeles—Century City via Olympic Boulevard 9,721
CCB 6/Rapid 6 Sepulveda Boulevard 9,301
Metro 728 Metro Rapid (Downtown LA—Century City via Olympic Boulevard) 8,687
SM 1 Santa Monica Boulevard 8,634
SM 3 Montana Ave and Lincoln Boulevard 8,488
Metro 705 Metro Rapid (West Hollywood—Vernon via La Cienega Boulevard and Vernon Avenue) 8,295
Metro 710 Metro Rapid (South Bay Galleria—Wilshire Center via Crenshaw Boulevard) 7,755
SM 2 Wilshire Boulevard 4,650
SM 14 Bundy Drive and Centinela Avenue 4,094
Metro 920 Wilshire Rapid Express 3,644
SM 5 Olympic Boulevard 3,154
Metro 305 UCLA—Willowbrook via Sunset Boulevard , San Vicente Boulevard and Western Avenue 2,975
Metro 550 Metro Express (San Pedro—West Hollywood via Harbor Transitway) 2,862
Metro 534 Metro Express (Malibu—Fairfax/Washington via Pacific Coast Hwy.) 2,814
LADOT DASH Wilshire/Koreatown 2,586
Metro 156 Van Nuys—Hollywood Panorama City—Hollywood 2,539
CCB 3 Crosstown 2,241
SM R3 Rapid 3 2,239
SM 10 Freeway Express 2,028
LADOT DASH Hollywood 1,895
SM 9 Pacific Palisades 1,335
SM R7 Rapid 7 1,259
LADOT DASH Fairfax 1,106
LADOT DASH West Hollywood 1,087
SM 4 San Vicente Boulevard and Carlyle Avenue 1,037
Metro 209 Athens—Wilshire Center via Van Ness Avenue and Arlington Avenue 980
SM S12 UCLA Commuter 931
LADOT CE 573 Mission Hills/Encino 813
SM 11 Campus Connector 699
LADOT DASH Midtown 369
SCT 797 Century City 313
WH A/B West Hollywood Loop 225
LADOT CE 534 West Los Angeles/Century City/Westwood 181
LADOT CE 431 Westwood/Rancho Park/Palms 175
AVTA 786 West Los Angeles 66
LADOT CE 430 Pacific Palisades/Brentwood/Westwood 63
SCT 792 Century City 32
Total 555,120
Source: Metro 2009, Santa Monica Big Blue Bus 2007, Los Angeles Department of Transportation FY08-09, Antelope Valley Transit Authority 2009, Santa Clarita Transit 2009, West Hollywood CityLine 2009
Final Transportation Impacts Technical Report
4.0—Affected Environment
W E S T S I D E S U B W A Y E X T E N S I O N Page 4-6 August 2010
Table 4-3 summarizes transit service in the Study Area, including average daily weekday ridership. The highest number of boardings occurs on Metro Line 720, providing service along Wilshire Boulevard with 37,613 boardings per day. Local service on Wilshire Boulevard, provided by Metro Line 20, serves an additional 18,268 riders. Other bus lines with some of the highest levels of ridership in the Study Area include Metro Line 2 (22,894 boardings), Metro Line 4 (21,509 boardings), and Metro Line 16 (28,912 boardings). These three bus lines all run east-west in the Study Area and travel parallel routes to the proposed subway, along Sunset Boulevard, Santa Monica Boulevard, and Third Street, respectively.
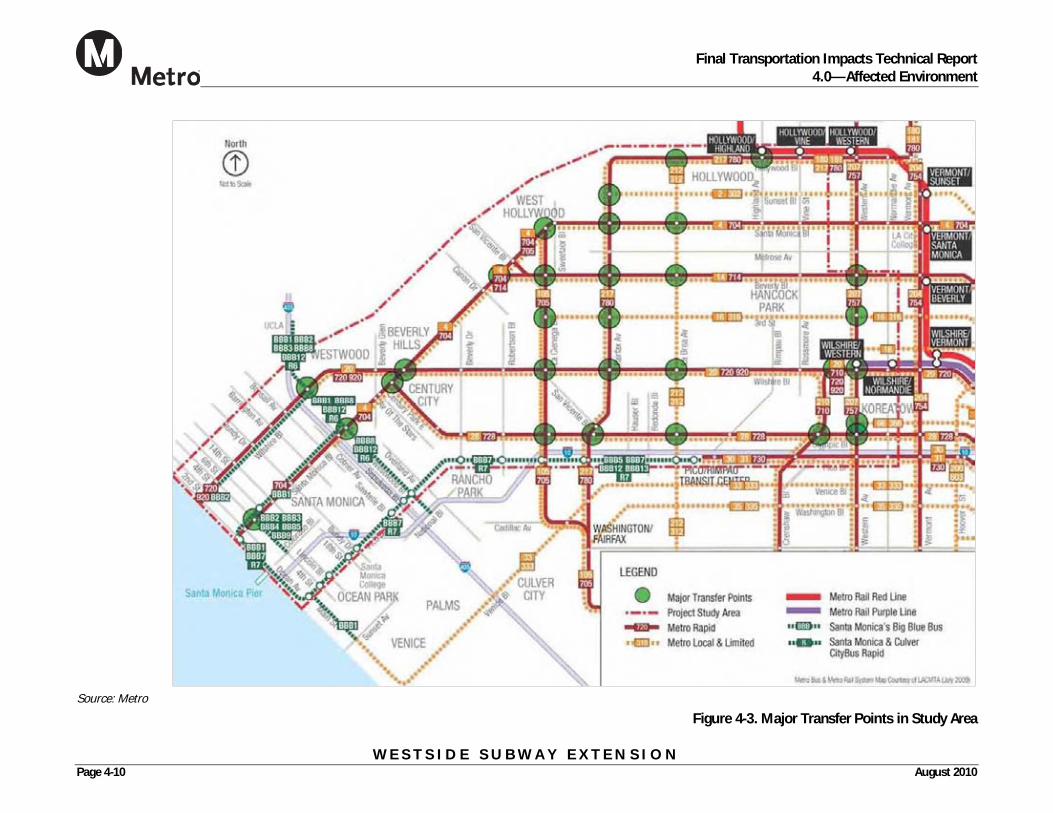
Major north-south/east-west transfer points are shown in Figure 4-3. Major transfer points are defined as locations where a Metro Rapid bus line, operating on weekday peak headways of 12 minutes or less, intersects with another bus line that is also operating on weekday peak headways of 12 minutes or less. Based on this criterion, there are 29 major transfer points in the Study Area. Approximately one third of these major transfer points occur where project stations are proposed, confirming the importance of these locations in the transit network.
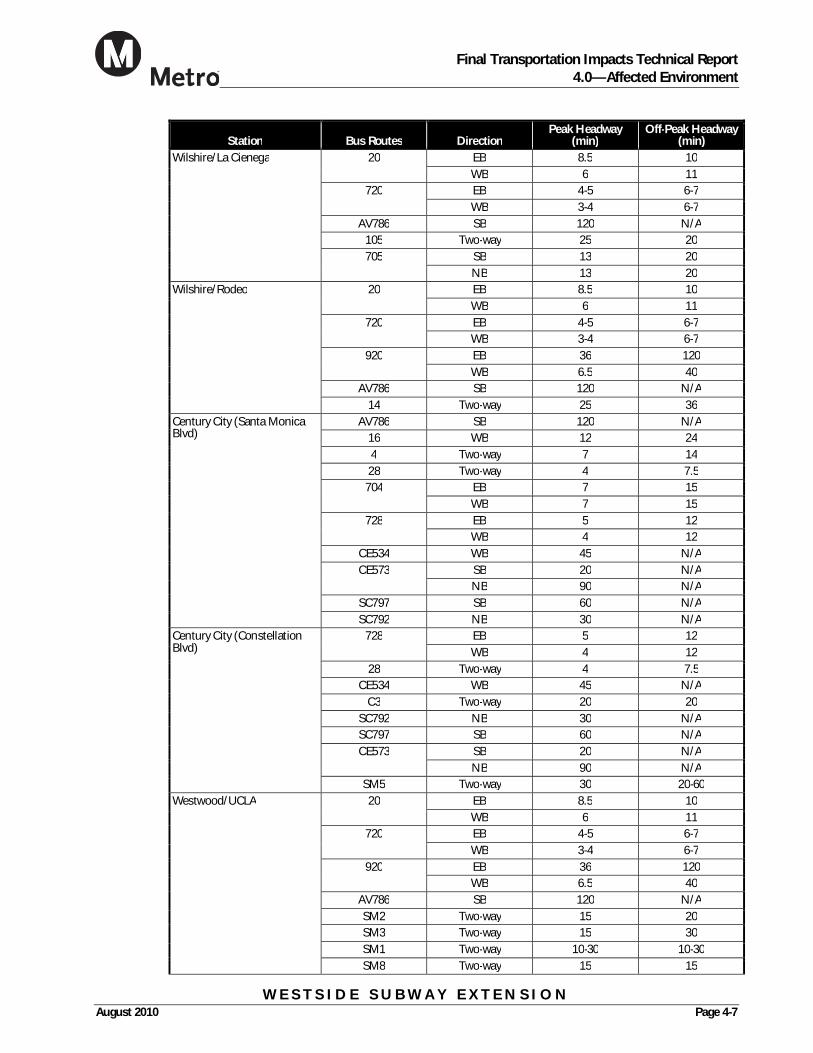
Table 4-3. Station-Area Transit Routes and Headways
Station Bus Routes Direction Peak Headway
(min) Off-Peak Headway
(min) Wilshire/Crenshaw 20 EB 8.5 10
WB 6 11 720 EB 4-5 6-7
WB 3-4 6-7 210 Two-way 10-18 20-90 710 NB 10 15
SB 10 15 Wilshire/La Brea 20 EB 8.5 10
WB 6 11 720 EB 4-5 6-7
WB 3-4 6-7 LD914 Two-way 15 15
212/312 Two-way 10 30 NB 6 30
Wilshire/Fairfax 20 EB 8.5 10 WB 6 11
720 EB 4-5 6-7 WB 3-4 6-7
920 EB 36 120 WB 6.5 40
AV786 SB 120 N/A LD914 Two-way 15 15
217 Two-way 12 20 WB 8 15
Final Transportation Impacts Technical Report
4.0—Affected Environment
W E S T S I D E S U B W A Y E X T E N S I O N August 2010 Page 4-7
Note: Routes are operated by Metro unless otherwise specified as follows: LD (LADOT DASH); AV (Antelope Valley Transit Authority); SC (Santa Clarita Transit); SM (Santa Monica Big Blue Bus); CE (LADOT Commuter Express); C (Culver CityBus); WH (West Hollywood CityLine).
Final Transportation Impacts Technical Report
4.0—Affected Environment
W E S T S I D E S U B W A Y E X T E N S I O N Page 4-10 August 2010
Source: Metro
Figure 4-3. Major Transfer Points in Study Area
Final Transportation Impacts Technical Report
4.0—Affected Environment
W E S T S I D E S U B W A Y E X T E N S I O N August 2010 Page 4-11
4.1.3 Station-Area Transit Service
The focus of this section is to describe existing transit routes serving each potential station area. Table 4-3 lists station-area bus routes by station location, including directional peak and off-peak headways for each bus line. Station locations provide access to an average of 6 different bus lines, with the highest number of intersecting bus lines (16) occurring at UCLA. The headways reflect a high number of Metro Local and Metro Rapid buses serving a high volume of riders throughout the day, especially during morning and afternoon peak periods. The prevalence of commuter bus service at the Century City and Westwood/UCLA stations reflects the importance of these locations as regional employment centers.
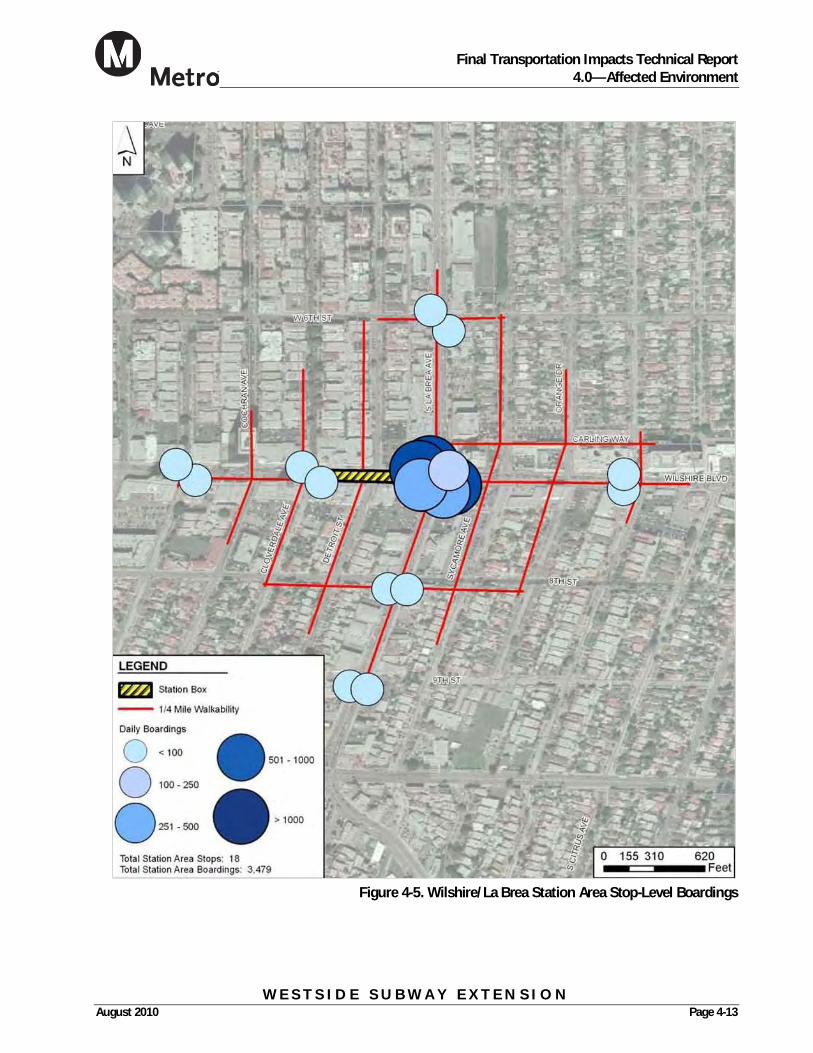
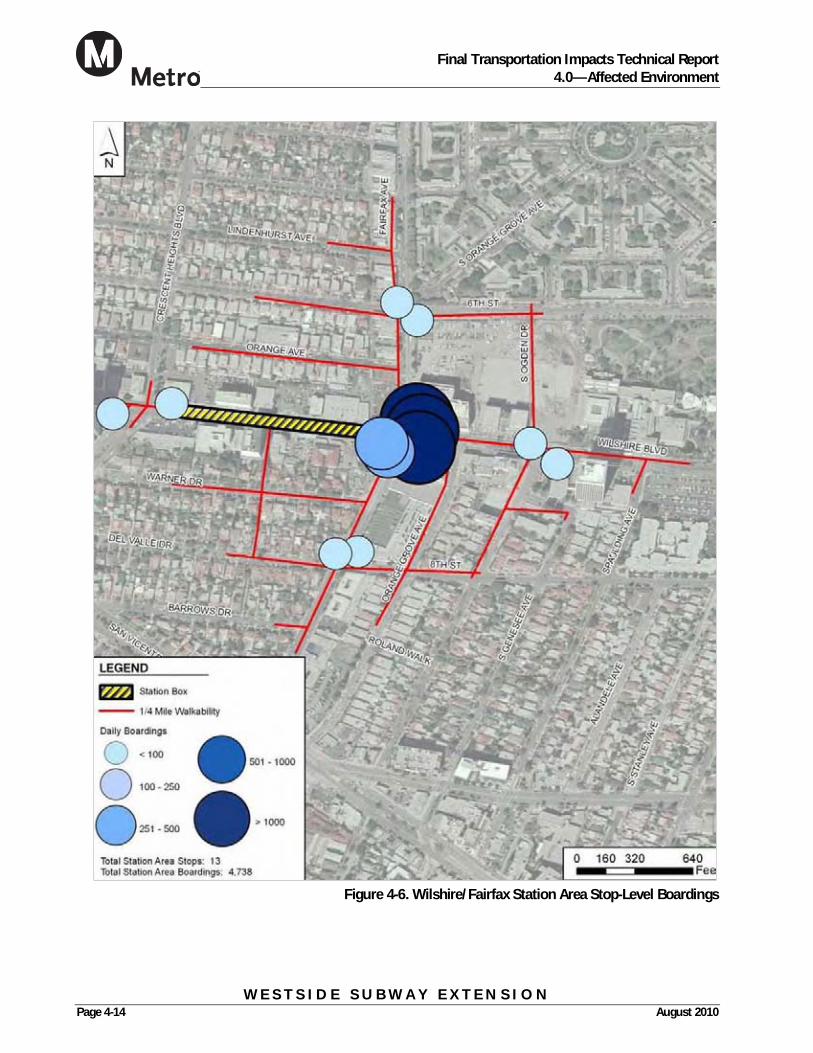
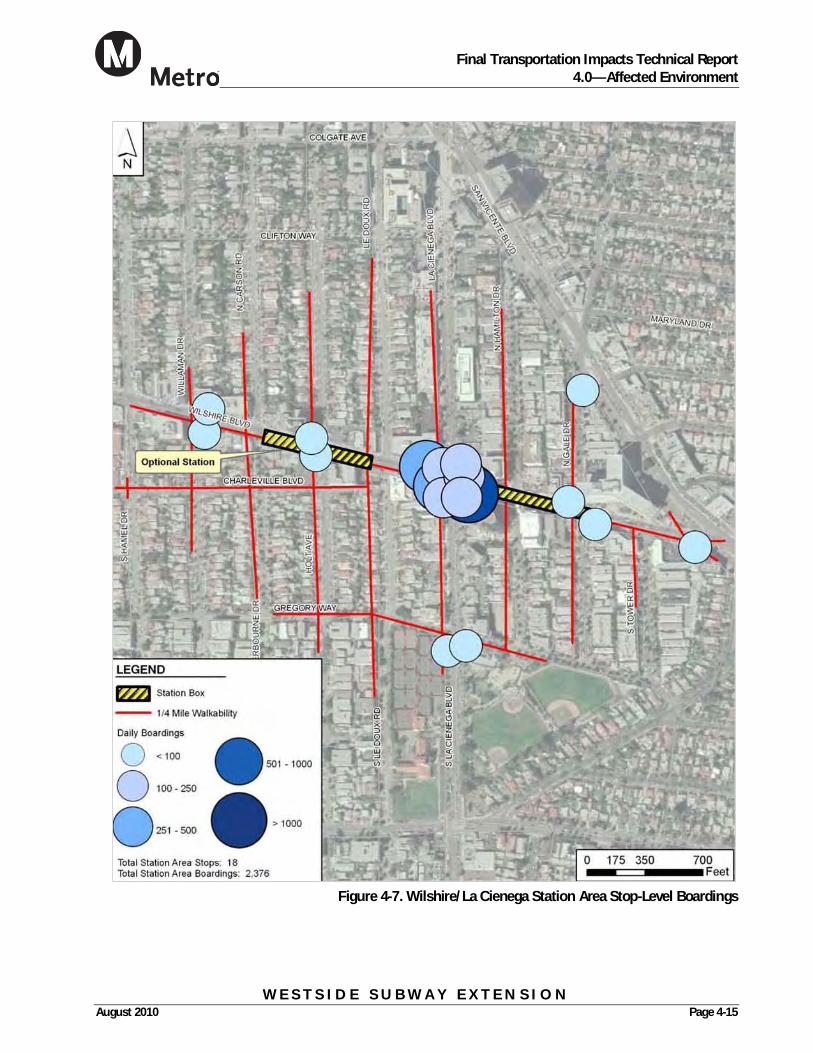
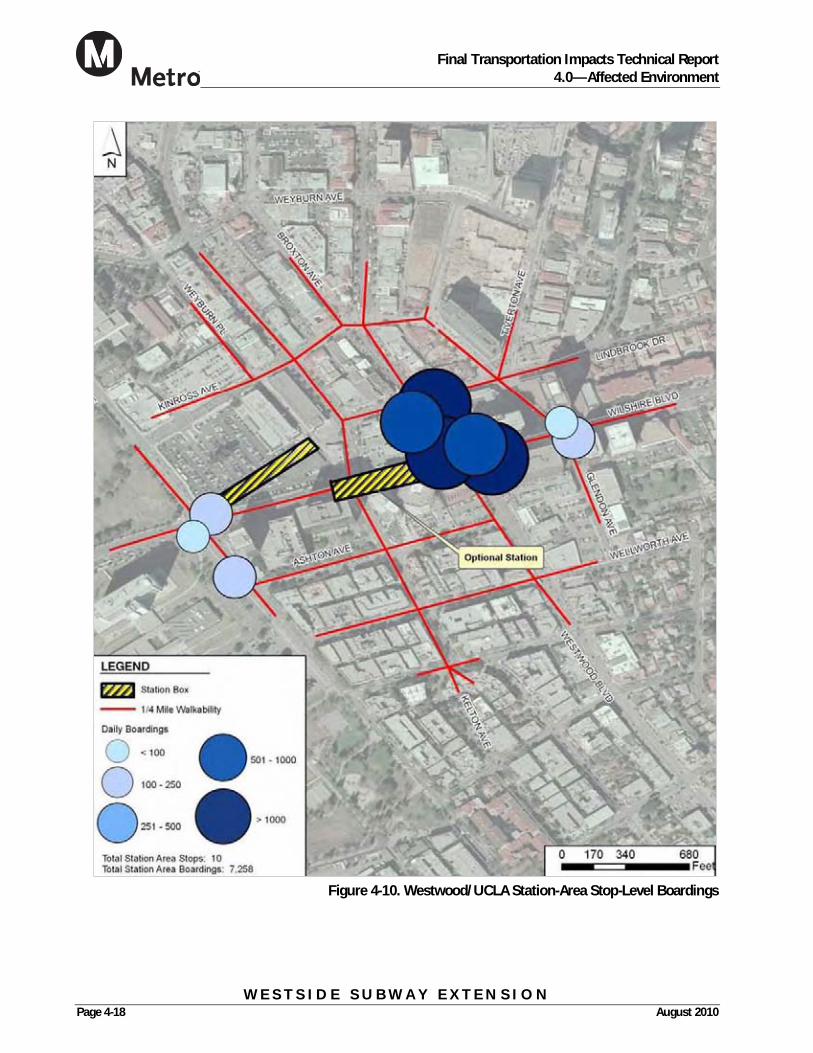
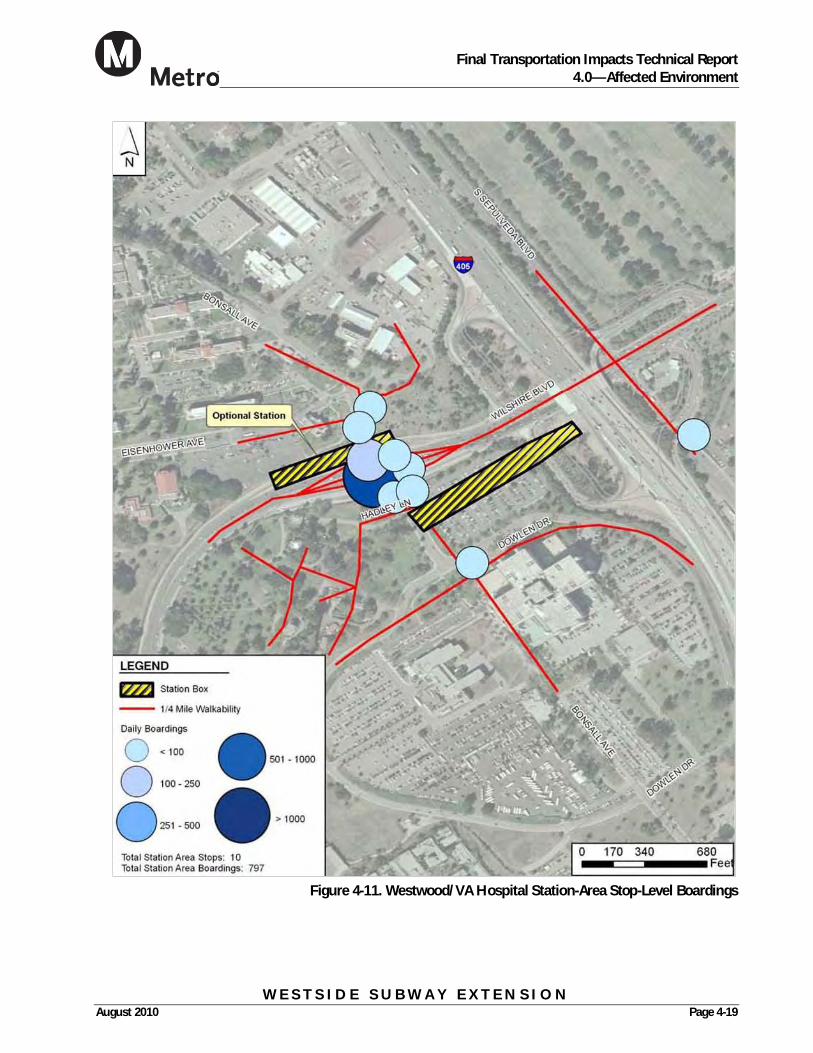
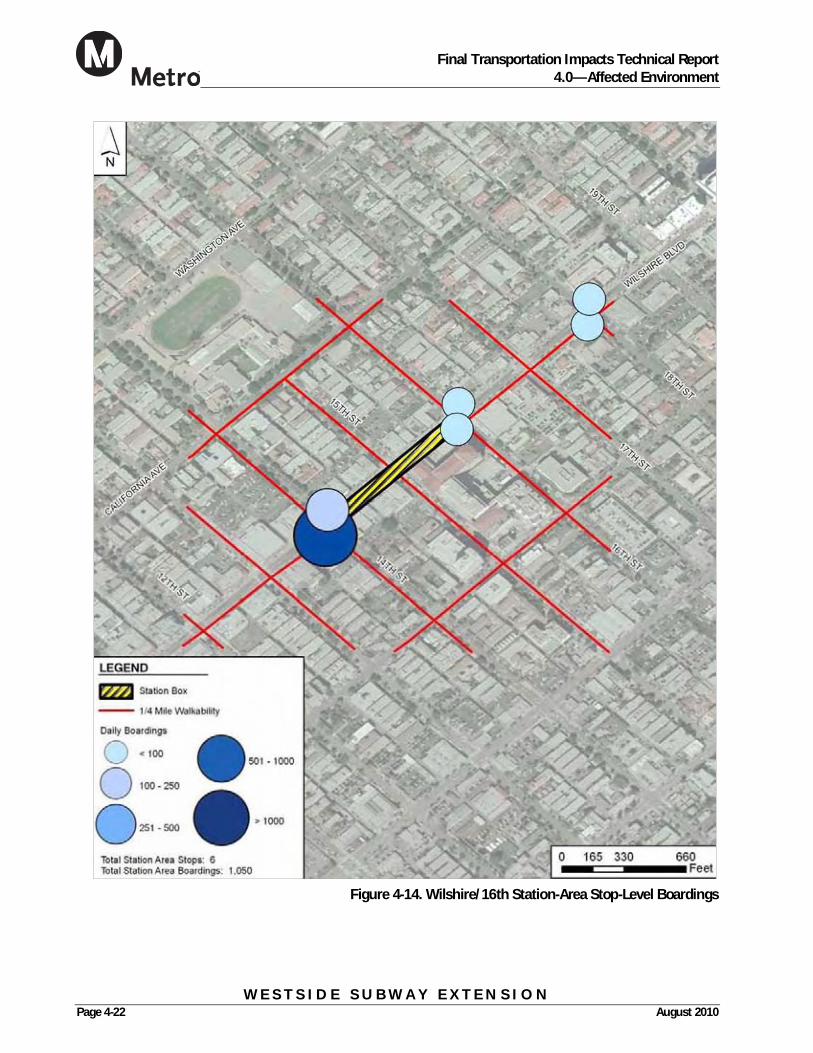
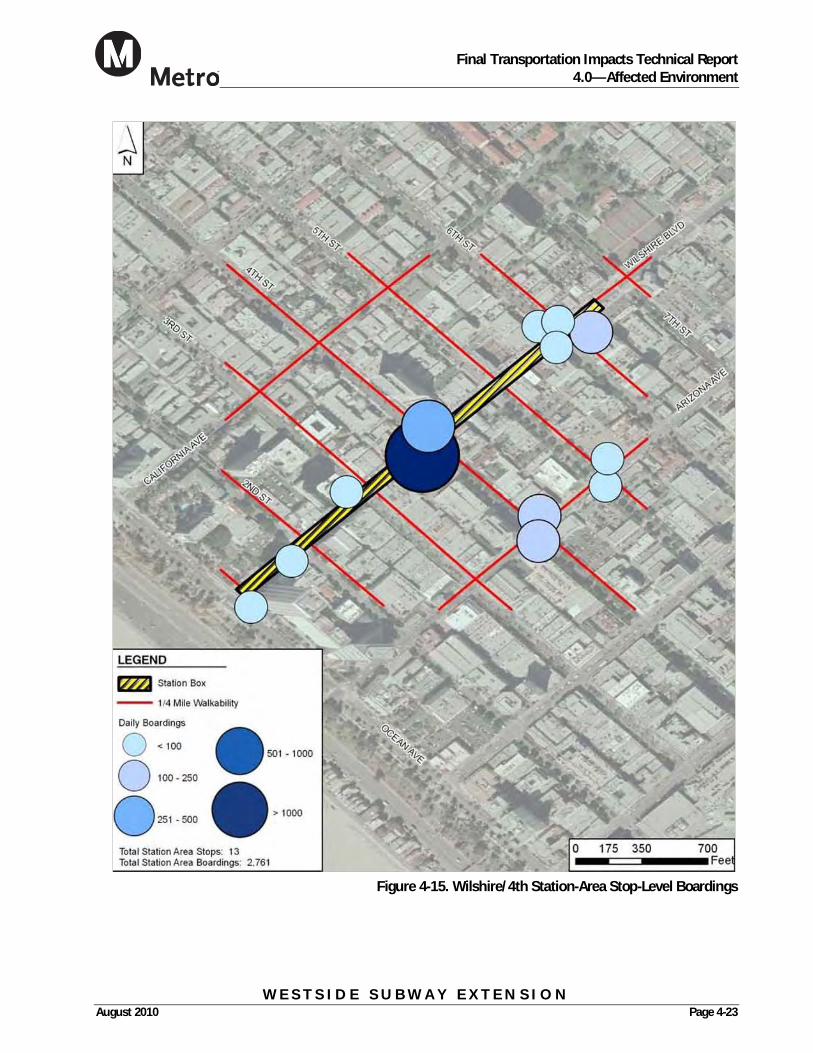
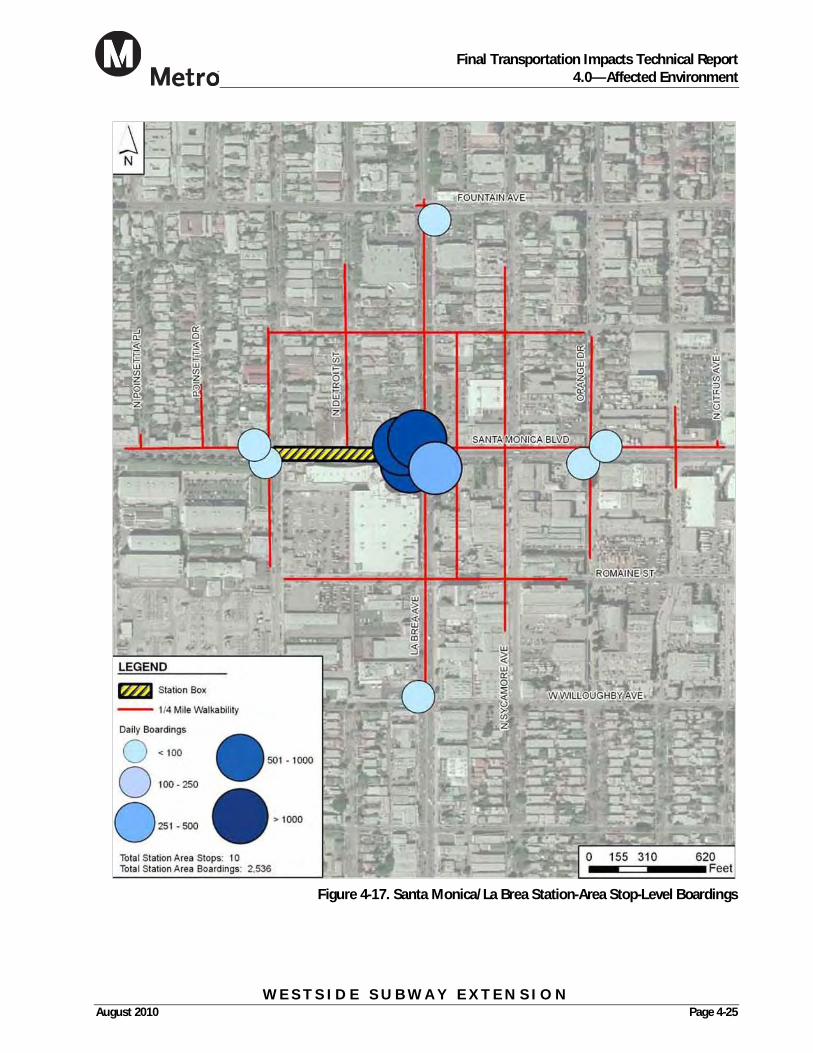
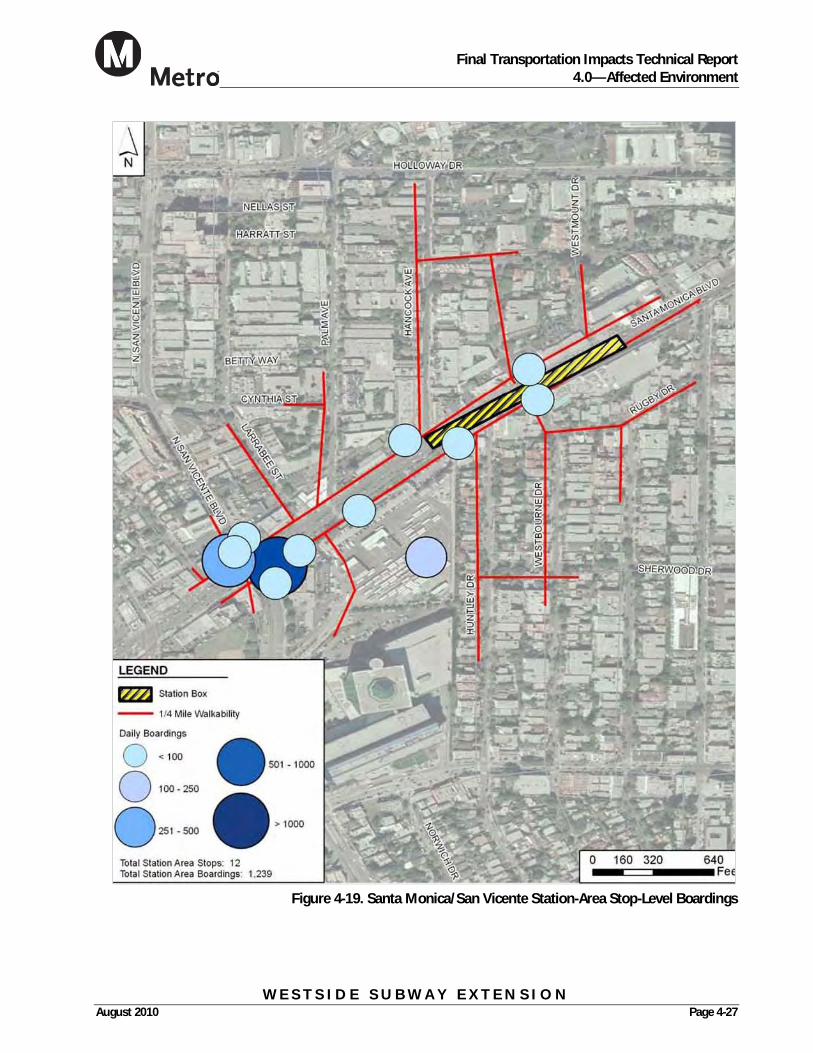
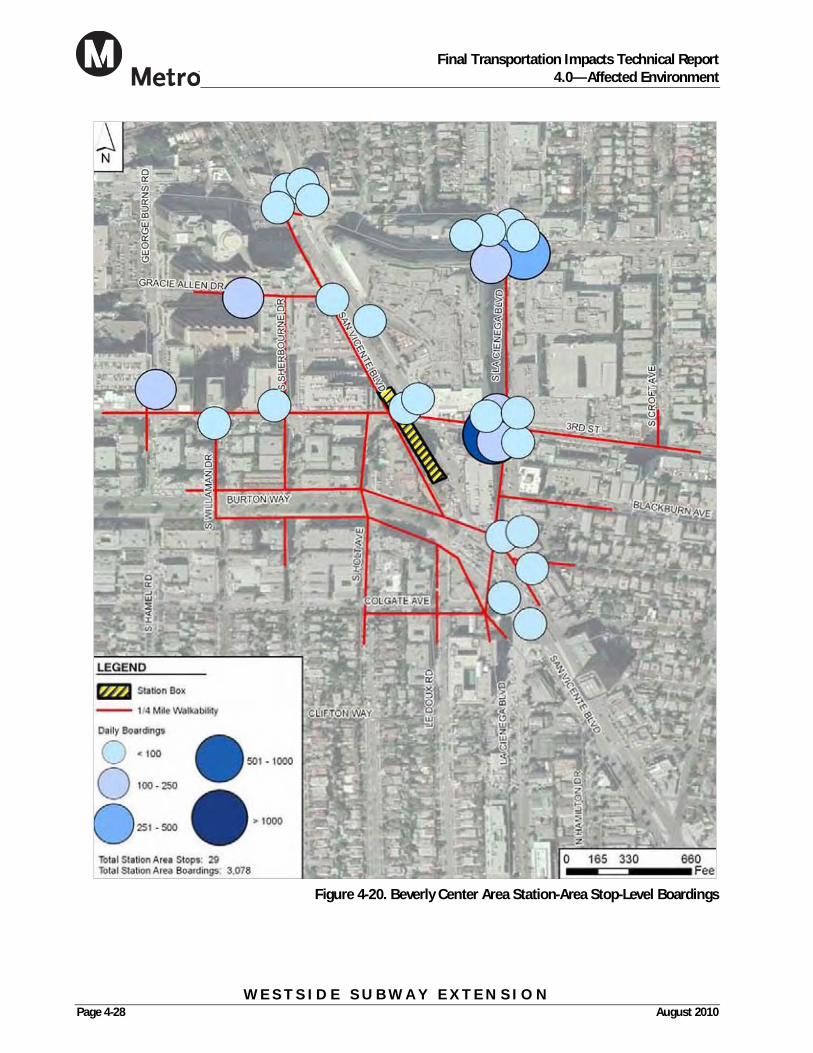
Stop-level bus boarding data for Metro, Santa Monica Big Blue Bus, and Culver CityBus lines at intersections nearest to potential station locations are shown in Figure 4-4 through Figure 4-20. These maps identify stop-level boarding data within a quarter-mile of primary subway station entrances, as measured by traversable paths. The magnitude of stop-level boardings demonstrates the high level of existing transit use at station locations. They also illustrate the suitability of subway station entrance locations, since these are critical points of access for people who use the transit system.
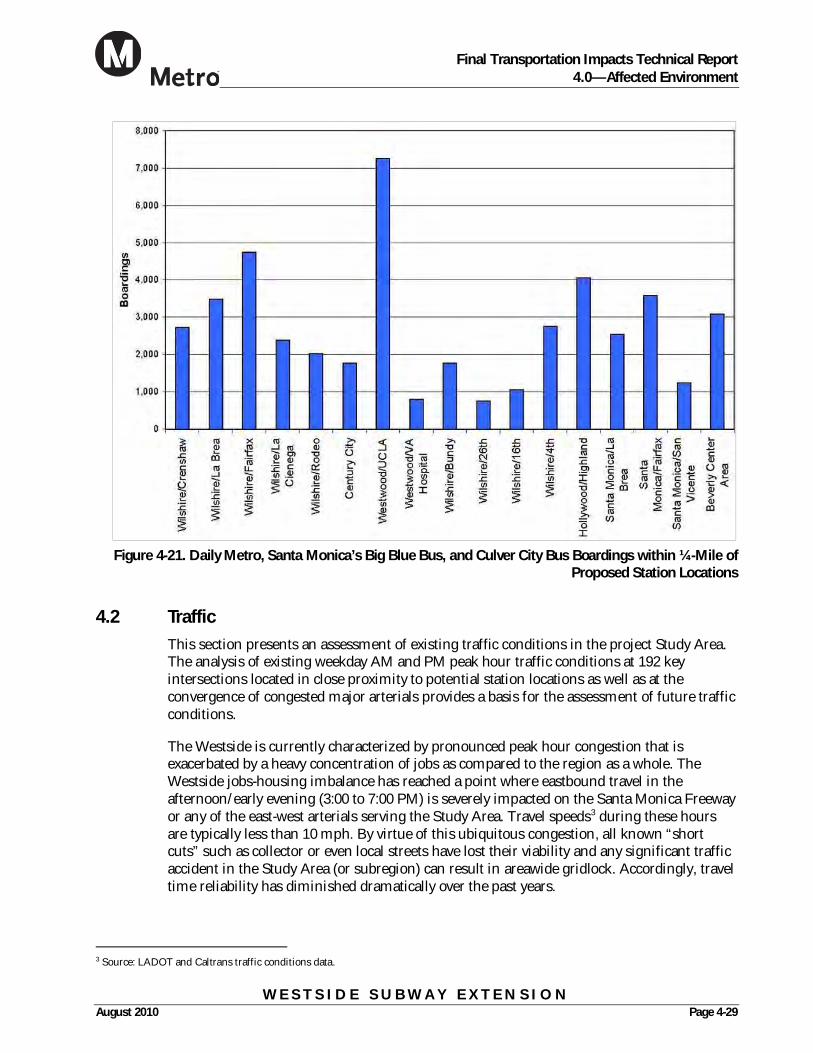
To provide the reader with a visual comparison of ridership, Figure 4-21 aggregates stop-level boarding data for Metro buses within one-quarter mile of each station location. The top six locations are Westwood/UCLA with 7,300 boardings, Wilshire/Fairfax with 4,700 board-ings, Hollywood/Highland with 4,100 boardings, Santa Monica/Fairfax with 3,600 board-ings, Wilshire/La Brea with 3,500 boardings, and Beverly Center Area with 3,100 boardings. This boarding data reflects a strong demand for transit service at station locations.
4.1.4 Peak Hour Roadway Congestion Underlies the Need for Transit Improvements
Los Angeles has the dubious distinction of being the most congested urban area in the country, according to the most recent survey of traffic congestion levels conducted by the Texas Transportation Institute.2 The Westside Subway Extension Study Area in turn contains some of the most congested traffic conditions in Los Angeles.
Typical rush hours on the Westside of Los Angeles extend from 6:30 to 10:00 a.m. and 3:00 to 7:00 p.m. For example, LADOT loop detectors have found that a typical automobile com-mute along Wilshire Boulevard from Santa Monica to Beverly Hills over a distance of eight miles can take upwards of 60 minutes on a typical weekday evening. Morning and evening peak hour speeds along Santa Monica Boulevard in Beverly Hills average less than 7 mph.
With the exception of small segments of the Metro Rail Red and Purple Lines (in the far eastern portion of the Study Area), mixed-flow transit operations make up most transit service in the Westside. Therefore, current traffic conditions described above are also affecting transit service in the Study Area. Although ridership on Westside bus routes is high, congestion on arterial streets and freeways affects bus travel time and reliability thereby resulting in less than optimal service conditions. With high passenger loads, congested roads make reduced bus headways (improved frequency of service) difficult to maintain and result in overcrowded buses.
2 Texas Transportation Institute. The 2009 Urban Mobility Report, Table 1.
Final Transportation Impacts Technical Report
4.0—Affected Environment
W E S T S I D E S U B W A Y E X T E N S I O N Page 4-12 August 2010
Figure 4-4. Wilshire/Crenshaw Station Area Stop-Level Boardings
Final Transportation Impacts Technical Report
4.0—Affected Environment
W E S T S I D E S U B W A Y E X T E N S I O N August 2010 Page 4-13
Figure 4-5. Wilshire/La Brea Station Area Stop-Level Boardings
Final Transportation Impacts Technical Report
4.0—Affected Environment
W E S T S I D E S U B W A Y E X T E N S I O N Page 4-14 August 2010
Figure 4-6. Wilshire/Fairfax Station Area Stop-Level Boardings
Final Transportation Impacts Technical Report
4.0—Affected Environment
W E S T S I D E S U B W A Y E X T E N S I O N August 2010 Page 4-15
Figure 4-7. Wilshire/La Cienega Station Area Stop-Level Boardings
Final Transportation Impacts Technical Report
4.0—Affected Environment
W E S T S I D E S U B W A Y E X T E N S I O N Page 4-16 August 2010
Figure 4-8. Wilshire/Rodeo Station Area Stop-Level Boardings
Final Transportation Impacts Technical Report
4.0—Affected Environment
W E S T S I D E S U B W A Y E X T E N S I O N August 2010 Page 4-17
Figure 4-9. Century City Station-Area Stop-Level Boardings
Final Transportation Impacts Technical Report
4.0—Affected Environment
W E S T S I D E S U B W A Y E X T E N S I O N Page 4-18 August 2010
W E S T S I D E S U B W A Y E X T E N S I O N August 2010 Page 4-25
Figure 4-17. Santa Monica/La Brea Station-Area Stop-Level Boardings
Final Transportation Impacts Technical Report
4.0—Affected Environment
W E S T S I D E S U B W A Y E X T E N S I O N Page 4-26 August 2010
Figure 4-18. Santa Monica/Fairfax Station-Area Stop-Level Boardings
Final Transportation Impacts Technical Report
4.0—Affected Environment
W E S T S I D E S U B W A Y E X T E N S I O N August 2010 Page 4-27
Figure 4-19. Santa Monica/San Vicente Station-Area Stop-Level Boardings
Final Transportation Impacts Technical Report
4.0—Affected Environment
W E S T S I D E S U B W A Y E X T E N S I O N Page 4-28 August 2010
Figure 4-20. Beverly Center Area Station-Area Stop-Level Boardings
Final Transportation Impacts Technical Report
4.0—Affected Environment
W E S T S I D E S U B W A Y E X T E N S I O N August 2010 Page 4-29
Figure 4-21. Daily Metro, Santa Monica’s Big Blue Bus, and Culver City Bus Boardings within ¼-Mile of
Proposed Station Locations
4.2 Traffic
This section presents an assessment of existing traffic conditions in the project Study Area. The analysis of existing weekday AM and PM peak hour traffic conditions at 192 key intersections located in close proximity to potential station locations as well as at the convergence of congested major arterials provides a basis for the assessment of future traffic conditions.
The Westside is currently characterized by pronounced peak hour congestion that is exacerbated by a heavy concentration of jobs as compared to the region as a whole. The Westside jobs-housing imbalance has reached a point where eastbound travel in the afternoon/early evening (3:00 to 7:00 PM) is severely impacted on the Santa Monica Freeway or any of the east-west arterials serving the Study Area. Travel speeds3 during these hours are typically less than 10 mph. By virtue of this ubiquitous congestion, all known “short cuts” such as collector or even local streets have lost their viability and any significant traffic accident in the Study Area (or subregion) can result in areawide gridlock. Accordingly, travel time reliability has diminished dramatically over the past years.
3 Source: LADOT and Caltrans traffic conditions data.
Final Transportation Impacts Technical Report
4.0—Affected Environment
W E S T S I D E S U B W A Y E X T E N S I O N Page 4-30 August 2010
Population and employment densities in the Study Area are among the highest in the metropolitan region. This high density is especially apparent to drivers as they attempt to travel in and through the Study Area during the peak travel periods. Peak periods in the Study Area are atypical, lasting longer on weekdays than in many areas of the country, and on weekends. Under existing conditions, a majority of the 192 study locations are operating at deficient levels of service, especially among major east-west corridors.
The existing conditions analysis includes a description of key Study Area streets and highways, intersection and segment traffic volumes, and current intersection and roadway operating conditions.
4.2.1 Regional Transportation Network
The Study Area is generally well served by a roadway network of arterial streets and freeways, which provide options for travel both north/south and east/west. However, the Study Area contains some of the most congested arterial streets in the County. The built environment throughout the Study Area lacks right-of-way for the construction of new roadways and severely limits the expansion of existing facilities.
4.2.1.1 Freeways Two freeways traverse the Study Area. The San Diego Freeway (I-405) runs north/south through the Study Area just west of Westwood and UCLA and provides the primary access to/from the north and south. The Santa Monica Freeway (I-10) runs just outside the Study Area until Santa Monica city limits but parallels key east-west arterials and provides regional access from the east. Both freeways are widely recognized as some of the most congested in both the Los Angeles region and the nation, and experience high traffic volumes throughout the day, well beyond the traditional peak travel hours. The Study Area freeway network is described below.
I-10 Freeway (Santa Monica Freeway)—The Santa Monica Freeway is a major east/west freeway that traverses the southern portion of the Study Area. It extends from the Pacific Ocean and the City of Santa Monica on the west to Downtown Los Angeles and beyond on the east. Near the proposed project alignment, the Santa Monica Freeway provides five lanes of travel in each direction, including auxiliary lanes. The ramps that lie in the Study Area include the Cloverfield Boulevard, 20th Street and Lincoln Boulevard on- and off-ramps, the 4th/5th Street off-ramps, and the 4th Street on-ramps. Peak hour conditions along the Santa Monica Freeway within or adjacent to the Study Area are generally congested in both directions, with a higher volume of traffic traveling west in the AM peak and east in the PM peak. For this reason, observations of eastbound and westbound on-ramps indicate greater congestion in the peak direction.
I-405 Freeway (San Diego Freeway)—The San Diego Freeway is a major north/south freeway that connects the San Fernando Valley to West Los Angeles, the South Bay area, and Orange County. In the Study Area, the San Diego Freeway provides five to six lanes of travel in each direction, including a southbound carpool lane and auxiliary lanes. The ramps that lie in the Study Area include the Sunset Boulevard, Wilshire Boulevard, Santa Monica Boulevard, and Olympic/Pico Boulevard on- and off-ramps and the Montana Ave off-ramp. Peak hour conditions along the San Diego Freeway are generally congested in both directions. Because the Study Area is jobs rich, the directional flow in the AM peak heavily favors the southbound direction north of the Study Area and the northbound direction south of the Study Area.
Final Transportation Impacts Technical Report
4.0—Affected Environment
W E S T S I D E S U B W A Y E X T E N S I O N August 2010 Page 4-31
Daily Traffic Volumes This section describes freeway volumes at key interchanges and segments in the Study Area.
I-10 Freeway (Santa Monica Freeway)—In the Study Area, the average daily (weekday) traffic4 on the Santa Monica Freeway varies between 148,000 vehicles at the Lincoln Boulevard interchange, 192,000 vehicles at the Cloverfield Boulevard interchange, and 244,000 vehicles at the Bundy Drive interchange. At key interchanges south of the Study Area, average daily traffic varies between 260,000 vehicles at the Overland Avenue Interchange, 267,000 vehicles at the Robertson Boulevard Interchange, 277,000 vehicles at the La Brea Avenue Interchange, and 291,000 vehicles at the Crenshaw Boulevard interchange.
I-405 Freeway (San Diego Freeway)—In the Study Area, the average daily (weekday) traffic on the San Diego Freeway varies between 319,000 vehicles at the Olympic Boulevard interchange, 302,000 vehicles at the Santa Monica Boulevard interchange, 289,000 vehicles at the Wilshire Boulevard interchange, 281,000 vehicles at the Montana Avenue off-ramp, and 283,000 vehicles at the Sunset Boulevard interchange.
4.2.1.2 Arterials The Study Area contains some of the most congested streets in Los Angeles County. The high population and employment densities in the Study Area have resulted in eastbound and westbound directional travel being congested during both the AM and PM peak periods. The arterials in the Study Area serve the employment centers as well as local and regional travel. In addition, they are used as alternates to the I-10 and I-405 freeways during non-recurrent delays such as accidents, breakdowns, lane closures and other random events. Key east/west arterials include Hollywood, Sunset, Santa Monica, Beverly, Wilshire, Olympic, and Pico Boulevards and Melrose Avenue. Key north/south arterials include Crenshaw, La Cienega, San Vicente, Robertson, Beverly Glen, Westwood, Sepulveda, and Lincoln Boulevards; Western, La Brea, and Fairfax Avenues; and Bundy Drive. These key arterials can be classified as one of two street types: a Major Class II Highway or a Secondary Highway. A Major Class II Highway is defined as a 104’ right-of-way (ROW), 12’ sidewalks, 13’ curb lanes (off-peak parking, peak through), four full-time through lanes, and one dedicated left turn lane/median. A Secondary Highway is defined as a 90’ ROW, 10’ sidewalks, 19’ curb lanes (all day parking), four full-time through lanes, and one dedicated left turn lane/median. The key Study Area arterials are described below.
Major East/West Arterials (Listed from North to South) Hollywood Boulevard—Hollywood Boulevard is a major east/west arterial that is
classified as a Major Class II Highway. It extends from Laurel Canyon Boulevard on the west to Sunset Boulevard on the east. In the Study Area, it generally has two travel lanes in each direction. Dedicated left-turn lanes are provided at most major intersections.
Sunset Boulevard—Sunset Boulevard is a major east/west arterial that is classified as a Major Class II Highway. It extends from the Pacific Coast Highway on the west to Grand Avenue in Downtown Los Angeles to the east. In the Study Area, it generally has two full-time travel lanes in each direction, with the parking lane used as a travel lane during peak periods in some locations. Dedicated left-turn lanes are provided at most major intersections.
42008 Traffic Volumes on California State Highways, State of California Department of Transportation, Traffic Operations Division.
Final Transportation Impacts Technical Report
4.0—Affected Environment
W E S T S I D E S U B W A Y E X T E N S I O N Page 4-32 August 2010
Santa Monica Boulevard—Santa Monica Boulevard is a major east/west arterial that is classified as a Major Class II Highway. It extends from Ocean Avenue in Santa Monica on the west to Sunset Boulevard in the Silver Lake neighborhood of Los Angeles on the east. In the Study Area, it generally has two travel lanes in each direction. Dedicated left-turn lanes are provided at most major intersections.
Melrose Avenue—Melrose Avenue is a major east/west arterial that is classified as a Secondary Highway. It extends from Doheny Drive on the west to Hoover Street on the east. In the Study Area, it generally has two travel lanes in each direction. Dedicated left-turn lanes are provided at most major intersections.
Beverly Boulevard—Beverly Boulevard is a major east/west arterial that is classified as a Major Class II Highway. It extends from Santa Monica Boulevard in Beverly Hills on the west to Glendale Boulevard near Downtown Los Angeles on the east. In the Study Area, it generally has two travel lanes in each direction. Dedicated left-turn lanes are provided at most major intersections.
Wilshire Boulevard—Wilshire Boulevard is a major east/west arterial that is classified as a Major Class II Highway. It extends from Ocean Avenue in Santa Monica on the west to Grand Avenue in Downtown Los Angeles on the east. In the Study Area, it generally has two full-time travel lanes in each direction, with the parking lane used as a travel lane during peak periods in many locations. Dedicated left-turn lanes are provided at most major intersections.
Olympic Boulevard—Olympic Boulevard is a major east/west arterial that is classified as a Major Class II Highway. It extends from 5th Street in Santa Monica on the west to Downtown Los Angeles and further on the east. In the Study Area, it generally has two to three full-time travel lanes in each direction, with the parking lane used as a travel lane during peak periods in some locations. Dedicated left-turn lanes are provided at most major intersections.
Pico Boulevard—Pico Boulevard is a major east/west arterial that is classified as a Major Class II Highway. It extends from Ocean Avenue in Santa Monica on the west to Central Avenue in Downtown Los Angeles on the east. In the Study Area, it generally has two full-time travel lanes in each direction, with the parking lane used as a travel lane during peak periods in many locations. Dedicated left-turn lanes are provided at most major intersections.
Major North/South Arterials (Listed from East to West) Western Avenue—Western Avenue is a major north/south arterial that is classified as a
Major Class II Highway. It extends from Los Feliz Boulevard on the north to San Pedro on the south. In the Study Area, it generally has two travel lanes in each direction. Dedicated left-turn lanes are provided at major intersections.
Crenshaw Boulevard—Crenshaw Boulevard is a major north/south arterial that is classified as a Major Class II Highway in the City of Los Angeles. It extends from Wilshire Boulevard on the north to the City of Rancho Palos Verdes on the south. In the Study Area, it generally has two travel lanes in each direction. Dedicated left-turn lanes are provided at most major intersections.
La Brea Avenue—La Brea Avenue is a major north/south arterial that is classified as a Major Class II Highway and above Hollywood Boulevard it is classified as a Secondary
Final Transportation Impacts Technical Report
4.0—Affected Environment
W E S T S I D E S U B W A Y E X T E N S I O N August 2010 Page 4-33
Highway. It extends from La Brea Terrace on the north to Century Boulevard on the south. In the Study Area, it generally has two full-time travel lanes in each direction, with the parking lane used as a travel lane during peak periods in many locations. Dedicated left-turn lanes are provided at most major intersections.
Fairfax Avenue—Fairfax Avenue is a major north/south arterial that is classified as a Major Class II Highway north of Melrose Avenue, and Secondary Highway south of Melrose Avenue. It extends from Hillside Terrace on the north to La Cienega Boulevard on the south. In the Study Area, it has one to two travel lanes in each direction. Dedicated left-turn lanes are provided at most major intersections.
La Cienega Boulevard—La Cienega Boulevard is a major north/south arterial that is classified as a Major Class II Highway. It extends from Sunset Boulevard on the north to El Segundo Boulevard on the south. In the Study Area, it generally has two travel lanes in each direction. Dedicated left-turn lanes are provided at most major intersections.
San Vicente Boulevard—San Vicente Boulevard is a major north/south arterial that is classified as a Major Class II Highway. It extends from Sunset Boulevard on the north to Venice Boulevard on the south. North of Santa Monica Boulevard it becomes a Secondary Highway. In the Study Area, it generally provides two to three travel lanes in each direction. Dedicated left-turn lanes are provided at most major intersections.
Robertson Boulevard—Robertson Boulevard is a major north/south arterial that is classified as a Secondary Highway. It extends from Santa Monica Boulevard (Keith Avenue) on the north to Washington Boulevard on the south. In the Study Area, it generally provides one to two travel lanes in each direction. Dedicated left-turn lanes are provided at most major intersections.
Beverly Glen Boulevard—Beverly Glen Boulevard is a major north/south arterial classified as a Secondary Highway north of Wilshire Boulevard and Major Class II Highway south of Wilshire Boulevard. It extends from Ventura Boulevard on the north to Pico Boulevard on the south. In the Study Area, it generally provides one to two travel lanes in each direction. Dedicated left-turn lanes are provided at most major intersections.
Westwood Boulevard—Westwood Boulevard is a major north/south arterial that is classified as a Major Class II Highway north of Santa Monica Boulevard, and Secondary Highway south of Santa Monica Boulevard. It extends from Le Conte Avenue and the UCLA campus on the north to just south of National Boulevard. In the Study Area, it generally has two travel lanes in each direction. Dedicated left-turn lanes are provided at most major intersections.
Sepulveda Boulevard—Sepulveda Boulevard is a major north/south arterial that is classified as a Major Class II Highway. It extends from the 405 Freeway in the San Fernando Valley on the north to Artesia Boulevard in the City of Hermosa Beach on the south. In the Study Area, it generally has two travel lanes in each direction. Dedicated left-turn lanes are provided at most major intersections.
Bundy Drive—Bundy Drive is a north/south arterial. In the City of Los Angeles, it is classified as a Collector north of Wilshire Boulevard and Secondary Highway south of Wilshire Boulevard. It extends from the hills above Sunset Boulevard on the north to Centinela Avenue on the south. In the Study Area, it generally has one to two travel
Final Transportation Impacts Technical Report
4.0—Affected Environment
W E S T S I D E S U B W A Y E X T E N S I O N Page 4-34 August 2010
lanes in each direction. Dedicated left-turn lanes are provided at most major intersections.
Lincoln Boulevard—Lincoln Boulevard is a major north/south arterial that is classified as a Major Class II Highway. It extends from San Vicente Boulevard in Santa Monica on the north to Sepulveda Boulevard on the south. In the Study Area, it generally has two travel lanes in each direction. Dedicated left-turn lanes are provided at most major intersections.
Daily Traffic Volumes Daily traffic volumes along the Study Area arterials vary by segment. The highest daily traffic volumes for the major east/west and north/south arterials are presented in Table 4-4.
Table 4-4. Traffic Volumes for Key Arterial Segments in the Study Area
Street Name Count Location Total Daily
Volume
East/West Arterials
Wilshire Boulevard west of Veteran Avenue 122,618
Santa Monica Boulevard east of Cotner Avenue 68,277
Sunset Boulevard east of La Cienega Boulevard 66,043
Hollywood Boulevard at Laurel Canyon Boulevard 35,618 **
Olympic Boulevard west of Cotner Avenue 59,388
Pico Boulevard west of Cotner Avenue 46,152
North/South Arterials
Western Avenue south of Beverly Boulevard 38,245
Crenshaw Boulevard at Olympic Boulevard 31,804 *
La Brea Avenue south of Beverly Boulevard 47,440
Fairfax Avenue south of Beverly Boulevard 36,724
La Cienega Boulevard south of Beverly Boulevard 48,774
San Vicente Boulevard east of La Cienega Boulevard 38,611
Beverly Glen Boulevard at Wilshire Boulevard 20,429
4.2.1.3 CMP Monitoring Locations The 2004 Congestion Management Program [CMP] for Los Angeles County (Metro, July 2004) requires that traffic impact analyses be conducted for select regional facilities based on the quantity of project traffic expected to use these facilities when an environmental assessment is prepared for a project. This section lists the locations that will be included in the countywide congestion management analysis. No analysis is conducted as part of this report.
The CMP Highway and Roadway System for Los Angeles County extends more than 1,000 miles, including approximately 500 miles of freeways, 400 miles of state-maintained
Final Transportation Impacts Technical Report
4.0—Affected Environment
W E S T S I D E S U B W A Y E X T E N S I O N August 2010 Page 4-35
arterials, and 100 miles of locally-maintained arterials. The CMP Highway and Roadway System includes facilities that meet the following criteria:
All existing state highways (both freeways and arterials)
Principal arterials, defined as: routes that complete gaps in the state highway system; routes providing connectivity with the CMP systems in adjacent counties; or routes along major inter-jurisdictional travel corridors providing primary, high volume or multimodal transportation.
Freeway Mainline Stations The 2004 Congestion Management Program (CMP) for Los Angeles County lists the following locations in or near the Study Area as the freeway mainline monitoring stations for the countywide congestion management analysis:
I-10 at Lincoln Boulevard (CMP Station 1010)
I-10 east of Overland Avenue (CMP Station 1011) (south of the Study Area)
I-10 east of La Brea Avenue (CMP Station 1012) (south of the Study Area)
I-405 north of Venice Boulevard (CMP Station 1070) (south of the Study Area)
I-405 south of Mulholland Drive (CMP Station 1071) (north of the Study Area)
All of the locations listed, except I-10 at Lincoln Boulevard, experienced poor operating conditions (level of service [LOS] E or worse) during one or both peak hours according to year 2003 volumes in the CMP.
Arterial Monitoring Stations The 2004 CMP for Los Angeles County lists the following locations in the Study Area as the arterial monitoring stations for the countywide congestion management analysis:
Santa Monica Boulevard and Wilshire Boulevard (City of Beverly Hills)
Wilshire Boulevard and La Cienega Boulevard (City of Beverly Hills)
Santa Monica Boulevard and Bundy Drive (City of Los Angeles)
Santa Monica Boulevard and Highland Avenue (City of Los Angeles)
Santa Monica Boulevard and Westwood Boulevard (City of Los Angeles)
Wilshire Boulevard and La Brea Avenue (City of Los Angeles)
Wilshire Boulevard and Sepulveda Boulevard (City of Los Angeles)
Wilshire Boulevard and Western Avenue (City of Los Angeles)
Wilshire Boulevard and Beverly Glenn Boulevard (City of Los Angeles)
Lincoln Boulevard and Pico Boulevard (City of Santa Monica)
Santa Monica Boulevard and Cloverfield Boulevard (City of Santa Monica)
Santa Monica Boulevard and Lincoln Boulevard (City of Santa Monica)
Wilshire Boulevard and 26th Street (City of Santa Monica)
Santa Monica Boulevard and Doheny Drive (City of West Hollywood)
Final Transportation Impacts Technical Report
4.0—Affected Environment
W E S T S I D E S U B W A Y E X T E N S I O N Page 4-36 August 2010
Santa Monica Boulevard and La Cienega Boulevard (City of West Hollywood)
Most of the locations experienced acceptable operating conditions (LOS D or better) during both the AM and PM peak periods according to year 2003 volumes in the CMP.
Santa Monica Boulevard and Wilshire Boulevard, Santa Monica Boulevard and Highland Avenue, Wilshire Boulevard and Sepulveda Boulevard, Santa Monica Boulevard and Doheny Drive, and Santa Monica Boulevard and La Cienega Boulevard all experienced poor operating conditions (LOS E or worse) during one or both peak hours according to year 2003 volumes in the CMP.
4.2.1.4 Programmed Roadway Improvements This section describes the programmed roadway improvements in the Study Area. The only planned roadway improvement in the Study Area is the I-405 Northbound High Occupancy Vehicle (HOV) lane in Sepulveda Pass. This project will consist of a 10-mile northbound HOV lane on I-405 through Sepulveda Pass from I-10 (Santa Monica Freeway) to US 101 (Ventura Freeway). A southbound HOV lane opened for service in portions: between US 101 and Sunset Boulevard in 2002 and south of I-10 in 2009.
Local jurisdictions are not planning any major roadway expansion projects through 2035. Because of the level of buildout and density in the Study Area, local jurisdictions have generally determined through their policies that congestion relief improvements should focus on travel demand management along with increased ride sharing and transit usage rather than highway/arterial physical improvements, such as road widening or new roadways. In a number of cases, local communities that desire to eliminate cut-through and neighborhood traffic to support more livable downtown or commercial areas are supporting initiatives to limit roadway capacity or to slow traffic flow, leaving transit improvements as the only viable alternative to reduce traffic volumes and congestion-related delays.
In the cities on the Westside, policy-makers have taken strong positions against the wholesale widening of streets and narrowing of sidewalks to accommodate more travel lanes. Localized Transportation System Management (TSM) improvements, such as additional turn lanes or signal phasing changes, have been supported, but the arterial network in the Westside is essentially built out. In this highly urbanized area, the types of transportation improvements that have the support of the policy makers include intelligent transportation systems projects and livable communities programs. Future increases in travel demand will have to be accommodated by making the existing highway network work better where possible in conjunction with increased usage of transit and other (i.e., non-motorized) modes of transportation.
4.2.2 Existing Intersection Traffic Volumes and Levels of Service
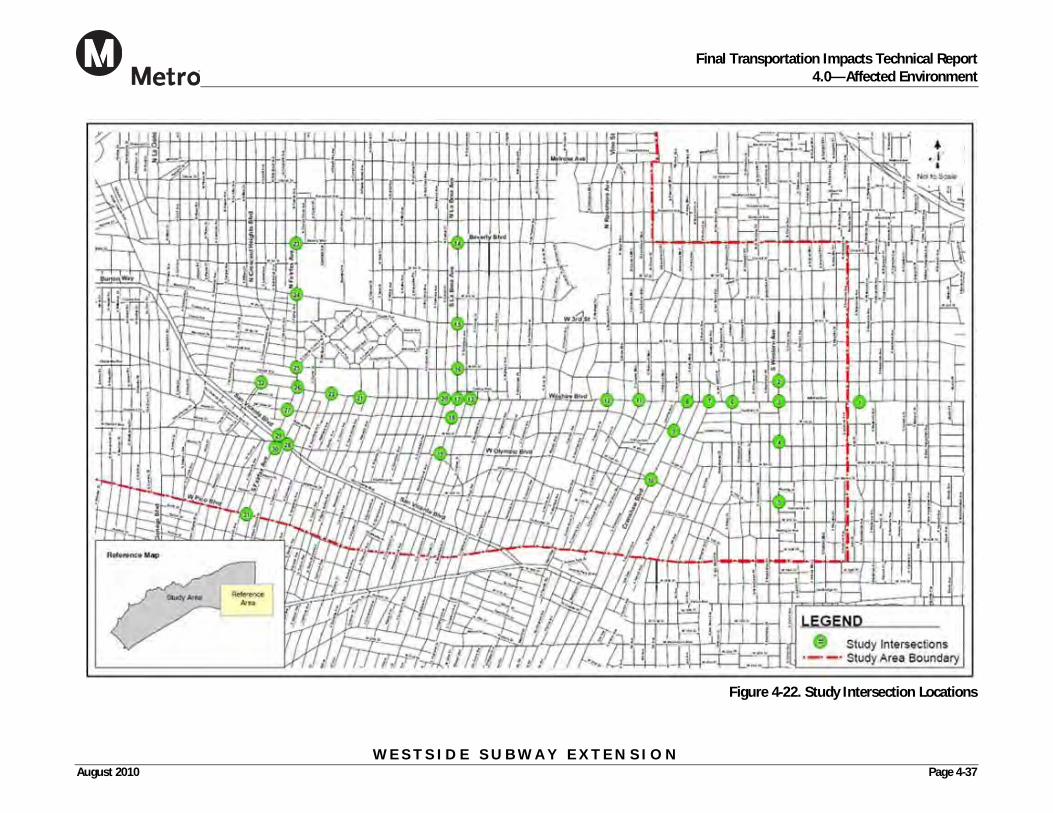
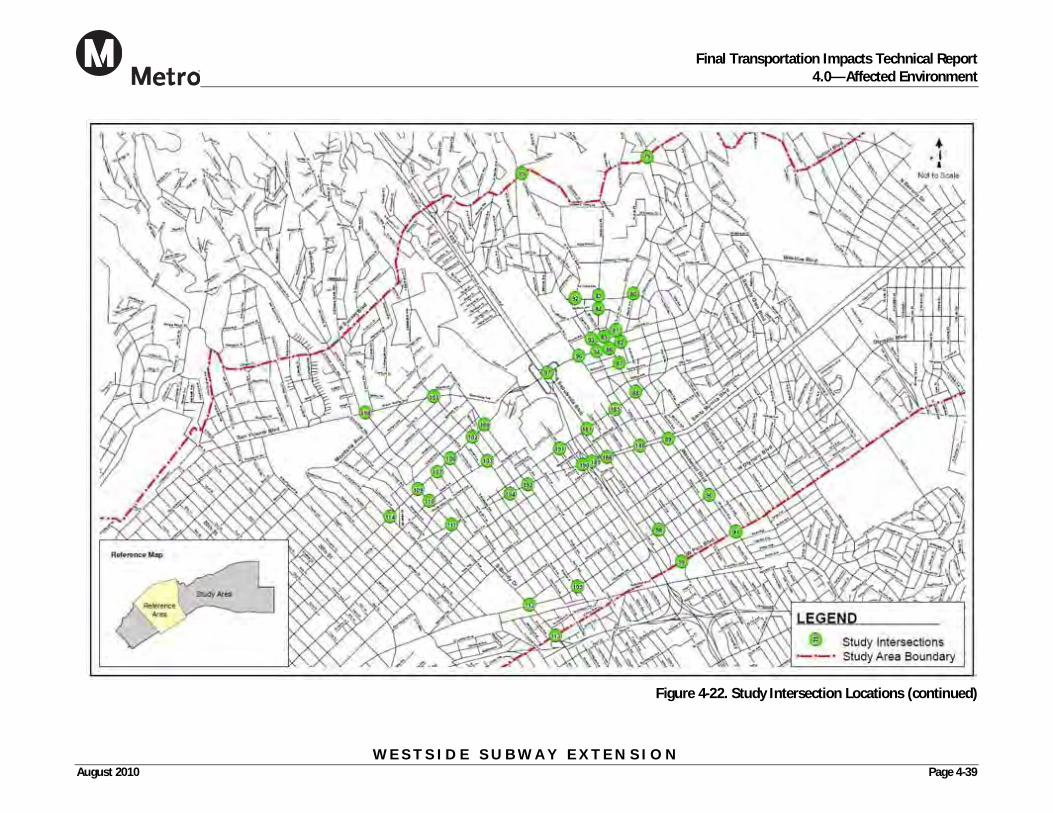
A total of 192 key intersections in the Study Area—at locations in close proximity to potential station locations as well as at the convergence of congested major arterials—were included to represent existing conditions from a traffic operations perspective. This section describes the existing conditions at the study intersections and details the methodology used to conduct the analysis. The 192 study intersections are shown in Figure 4-22. The jurisdictions affected by the Westside Subway Extension include the Cities of Los Angeles, Beverly Hills, West Hollywood and Santa Monica, and the County of Los Angeles. Each jurisdiction was consulted throughout the scoping process and assisted in the selection of study intersections.
Final Transportation Impacts Technical Report
4.0—Affected Environment
W E S T S I D E S U B W A Y E X T E N S I O N August 2010 Page 4-37
Figure 4-22. Study Intersection Locations
Final Transportation Impacts Technical Report
4.0—Affected Environment
W E S T S I D E S U B W A Y E X T E N S I O N Page 4-38 August 2010
Figure 4-22. Study Intersection Locations (continued)
Final Transportation Impacts Technical Report
4.0—Affected Environment
W E S T S I D E S U B W A Y E X T E N S I O N August 2010 Page 4-39
Figure 4-22. Study Intersection Locations (continued)
Final Transportation Impacts Technical Report
4.0—Affected Environment
W E S T S I D E S U B W A Y E X T E N S I O N Page 4-40 August 2010
Figure 4-22. Study Intersection Locations (continued)
Final Transportation Impacts Technical Report
4.0—Affected Environment
W E S T S I D E S U B W A Y E X T E N S I O N August 2010 Page 4-41
Figure 4-22. Study Intersection Locations (continued)
Final Transportation Impacts Technical Report
4.0—Affected Environment
W E S T S I D E S U B W A Y E X T E N S I O N Page 4-42 August 2010
4.2.2.1 Data Collection Effort Detailed AM and PM peak period intersection turning movement counts were conducted in April 2009, May 2009, and January 2010 to represent existing traffic volumes on a typical weekday throughout the Study Area. For some intersections, Fall 2008 counts were obtained from the Wilshire Bus Rapid Transit (BRT) EIR. Counts were taken during typical weekday peak hours from 7:00 to 9:00 AM and 4:00 to 6:00 PM. Traffic counts used in the existing conditions analysis are included in Appendix A. Each analyzed location was field checked to verify lane configurations and signal phasing. Signal timing plans for each study intersection were received from affected jurisdictions.
In addition to the collection of traffic data, pedestrian and bicycle activity was observed at study intersections in close proximity to potential station locations. Peak period pedestrian and bicycle volumes were recorded at study intersections adjacent to and up to a close walking distance from a potential station location. Appendix A contains pedestrian and bicycle counts taken at the 65 study intersections in close proximity to potential station locations.
Existing Traffic Volumes The existing traffic volumes at the 192 study intersections for the analyzed peak hours are shown in Appendix A.
Existing Pedestrian Volumes High pedestrian activity (established as peak hour volumes of 500 or more pedestrians crossing at a study intersection during a peak hour) was observed around these potential station locations:
Wilshire/Fairfax
Wilshire/Rodeo
Century City
Westwood/UCLA
Wilshire/4th
Santa Monica/La Brea
Santa Monica/Fairfax
Santa Monica/San Vicente
Beverly Center
Intersections with high pedestrian activity may experience additional vehicle delay for drivers making unprotected left and right-turn movements. This is due to drivers yielding to pedestrians before traveling through the intersection. High pedestrian activity also results in additional pedestrian “walk calls” (the number of times pedestrians push the button to cross the street), which can increase time allotted to walk phases and associated red phases for vehicles.
Overall, the highest levels of pedestrian activity were recorded in the Westwood/UCLA station area, followed by Downtown Beverly Hills and downtown Santa Monica. Westwood/UCLA is a major employment center and UCLA students, faculty and staff
Final Transportation Impacts Technical Report
4.0—Affected Environment
W E S T S I D E S U B W A Y E X T E N S I O N August 2010 Page 4-43
frequent the area around the station location, resulting in the highest pedestrian activity in the Study Area. Pedestrian activity was also significant in downtown Beverly Hills, downtown Santa Monica, and along the Santa Monica Boulevard corridor in West Hollywood.
Currently, pedestrians experience little difficulty crossing arterials in these areas, as all major intersections are signalized with pedestrian walk phases and crosswalks. A number of intersections have crosswalk treatments that further enhance the pedestrian experience and improve safety through added driver awareness.
4.2.2.2 Level of Service Methodology The commonly accepted operational analysis methodology from 2000 Highway Capacity Manual (HCM) (Transportation Research Board, 2000) was used to estimate delay and corresponding LOS at each study intersection. The operations analysis methodology rates intersection conditions based on the average delay, measured in seconds, experienced by drivers.
LOS is a qualitative measure used to describe the condition of traffic flow, ranging from LOS A (free flow conditions) to LOS F (congested conditions), with LOS E representing the theoretical maximum capacity of a link or intersection before gridlock occurs. Table 4-5 provides LOS definitions for signalized intersections using the HCM methodology. Weekday AM and PM peak hours were selected for analysis because they represent the most critical periods of traffic congestion in the Study Area. The LOS definitions and ranges of delay shown in the following table represent average conditions for all vehicles at an intersection across an entire hour. Delays longer than the average condition are experienced by motorists on certain movements and/or during peak times within the peak hour.
Generally, the minimum acceptable LOS for any intersection in an urbanized area is LOS D. The affected jurisdictions for the Westside Extension Transit Corridor Study Area all consider LOS D the minimum acceptable LOS. Therefore, LOS D will serve as the minimum acceptable standard for the Westside Extension Transit Corridor project.
4.2.2.3 Existing Levels of Service Analysis The SYNCHRO 6.0 software suite was used to develop Study Area roadway and intersection network for traffic analysis. The Synchro model was constructed by drawing the roadway network using aerial photography as a background. The number of lanes and the location of lane additions and drops were confirmed by field observations. Additional detail was incorporated into the SYNCHRO network (posted speed limits, grades, etc.) to better reflect observed field conditions. Traffic signal-related information such as phasing and initial timings (minimum green, maximum green, distance or “gap” between vehicles, etc.) for the signalized intersections was obtained from the affected agencies or during field visits to the site. Additional detail such as turn pocket lengths, saturation flow and intersection spacing was coded based on field measurements. Once the model was developed, AM and PM peak hour intersection turning movement counts and pedestrian volumes were added and the delay and delay-based LOS for each study location was calculated.
Final Transportation Impacts Technical Report
4.0—Affected Environment
W E S T S I D E S U B W A Y E X T E N S I O N Page 4-44 August 2010
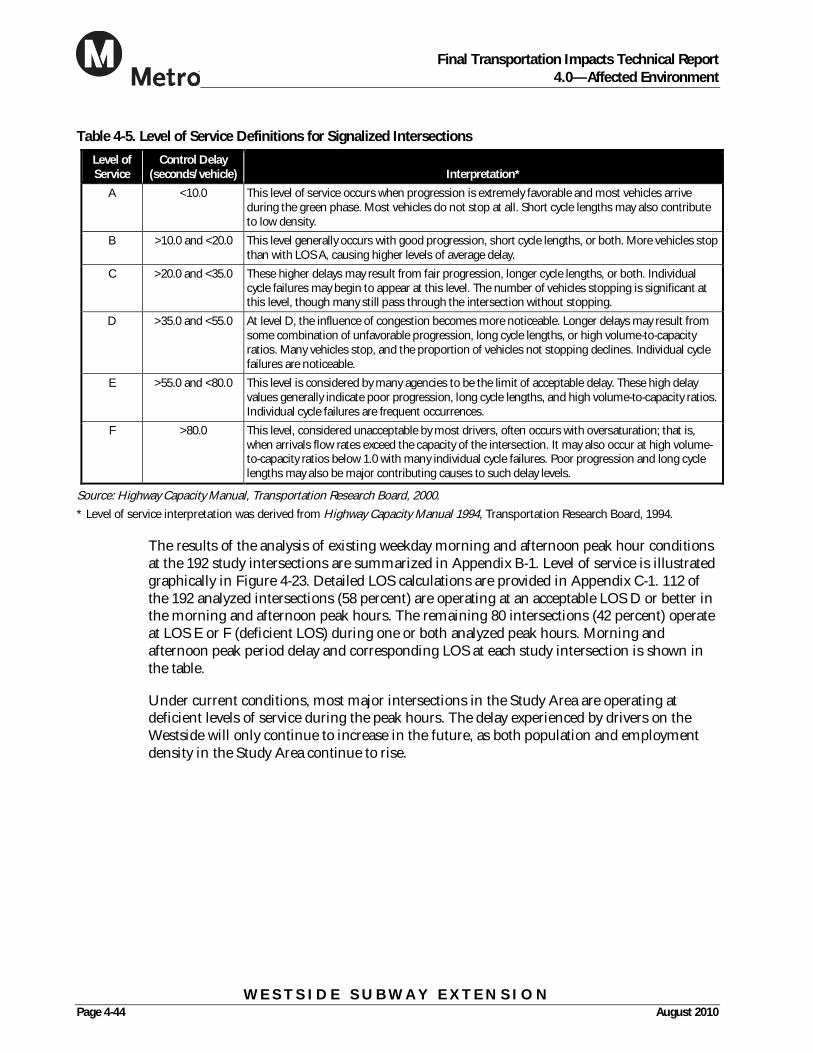
Table 4-5. Level of Service Definitions for Signalized Intersections
Level of Service
Control Delay (seconds/vehicle) Interpretation*
A <10.0 This level of service occurs when progression is extremely favorable and most vehicles arrive during the green phase. Most vehicles do not stop at all. Short cycle lengths may also contribute to low density.
B >10.0 and <20.0 This level generally occurs with good progression, short cycle lengths, or both. More vehicles stop than with LOS A, causing higher levels of average delay.
C >20.0 and <35.0 These higher delays may result from fair progression, longer cycle lengths, or both. Individual cycle failures may begin to appear at this level. The number of vehicles stopping is significant at this level, though many still pass through the intersection without stopping.
D >35.0 and <55.0 At level D, the influence of congestion becomes more noticeable. Longer delays may result from some combination of unfavorable progression, long cycle lengths, or high volume-to-capacity ratios. Many vehicles stop, and the proportion of vehicles not stopping declines. Individual cycle failures are noticeable.
E >55.0 and <80.0 This level is considered by many agencies to be the limit of acceptable delay. These high delay values generally indicate poor progression, long cycle lengths, and high volume-to-capacity ratios. Individual cycle failures are frequent occurrences.
F >80.0 This level, considered unacceptable by most drivers, often occurs with oversaturation; that is, when arrivals flow rates exceed the capacity of the intersection. It may also occur at high volume-to-capacity ratios below 1.0 with many individual cycle failures. Poor progression and long cycle lengths may also be major contributing causes to such delay levels.
Source: Highway Capacity Manual, Transportation Research Board, 2000.
* Level of service interpretation was derived from Highway Capacity Manual 1994, Transportation Research Board, 1994.
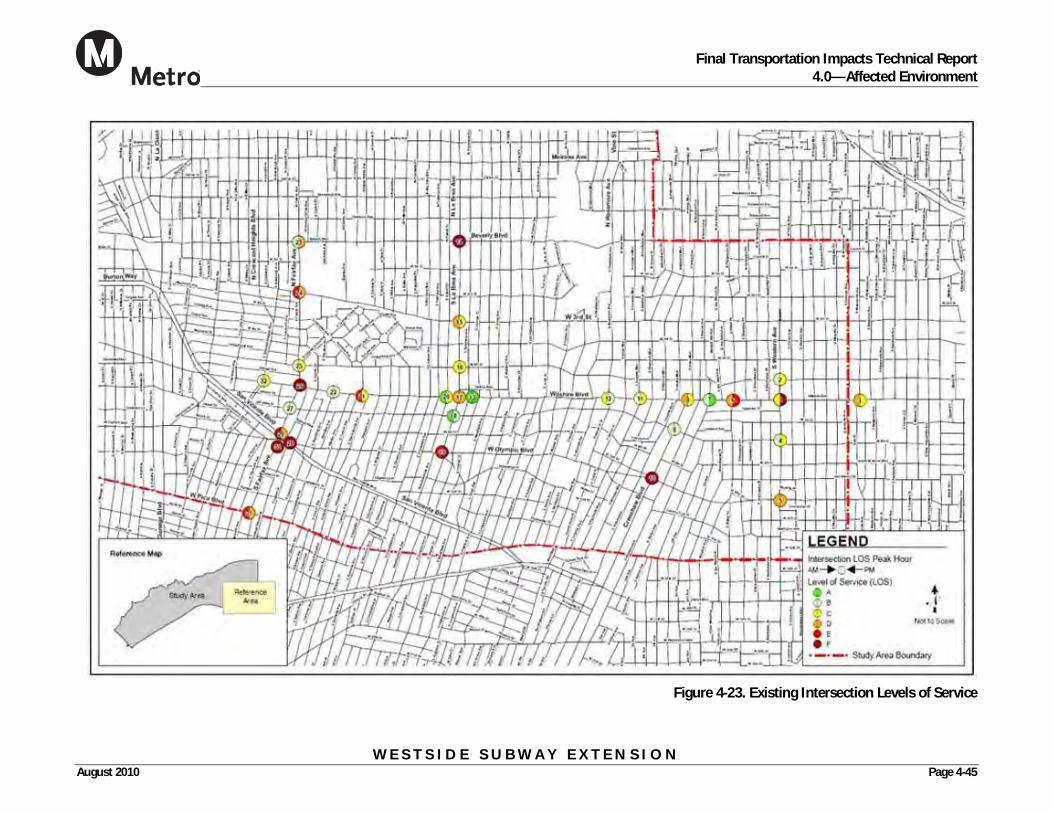
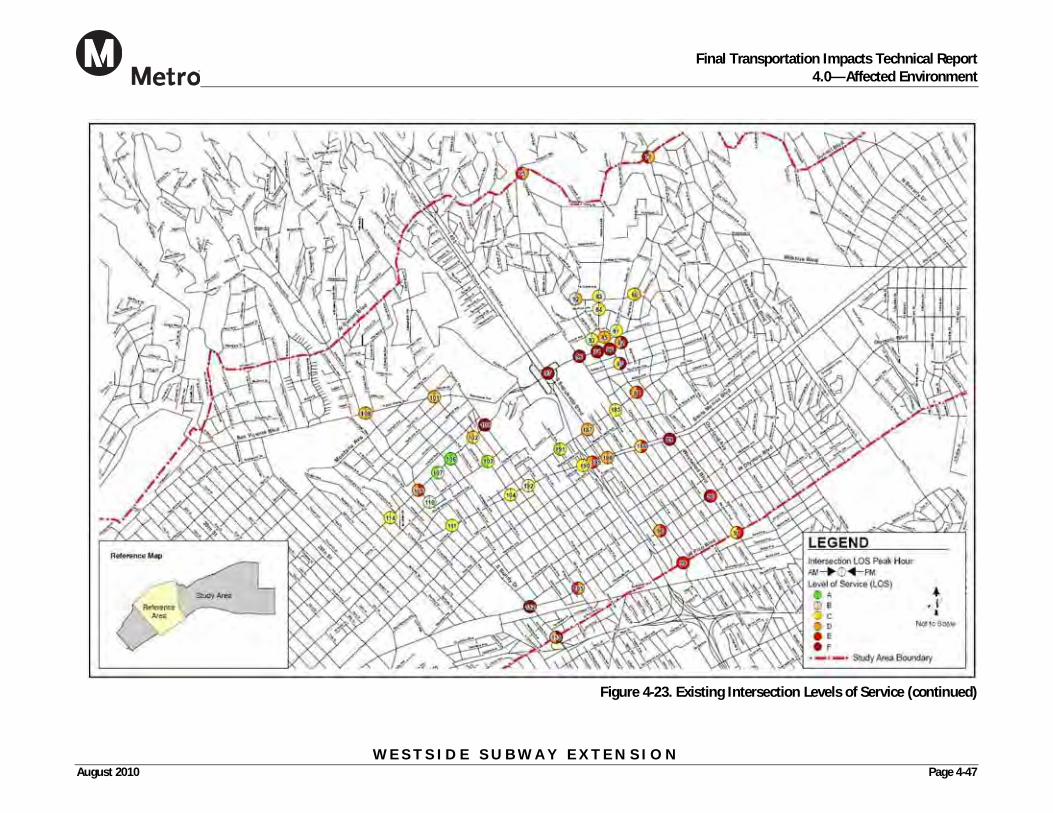
The results of the analysis of existing weekday morning and afternoon peak hour conditions at the 192 study intersections are summarized in Appendix B-1. Level of service is illustrated graphically in Figure 4-23. Detailed LOS calculations are provided in Appendix C-1. 112 of the 192 analyzed intersections (58 percent) are operating at an acceptable LOS D or better in the morning and afternoon peak hours. The remaining 80 intersections (42 percent) operate at LOS E or F (deficient LOS) during one or both analyzed peak hours. Morning and afternoon peak period delay and corresponding LOS at each study intersection is shown in the table.
Under current conditions, most major intersections in the Study Area are operating at deficient levels of service during the peak hours. The delay experienced by drivers on the Westside will only continue to increase in the future, as both population and employment density in the Study Area continue to rise.
Final Transportation Impacts Technical Report
4.0—Affected Environment
W E S T S I D E S U B W A Y E X T E N S I O N August 2010 Page 4-45
Figure 4-23. Existing Intersection Levels of Service
Final Transportation Impacts Technical Report
4.0—Affected Environment
W E S T S I D E S U B W A Y E X T E N S I O N Page 4-46 August 2010
Figure 4-23. Existing Intersection Levels of Service (continued)
Final Transportation Impacts Technical Report
4.0—Affected Environment
W E S T S I D E S U B W A Y E X T E N S I O N August 2010 Page 4-47
Figure 4-23. Existing Intersection Levels of Service (continued)
Final Transportation Impacts Technical Report
4.0—Affected Environment
W E S T S I D E S U B W A Y E X T E N S I O N Page 4-48 August 2010
Figure 4-23. Existing Intersection Levels of Service (continued)
Final Transportation Impacts Technical Report
4.0—Affected Environment
W E S T S I D E S U B W A Y E X T E N S I O N August 2010 Page 4-49
Figure 4-23. Existing Intersection Levels of Service (continued)
Final Transportation Impacts Technical Report
4.0—Affected Environment
W E S T S I D E S U B W A Y E X T E N S I O N August 2010 Page 4-1
4.3 Parking
This section within the Affected Environment section details existing parking conditions, including the total number of unrestricted on-street parking spaces as well as the typical number of occupied parking spaces within a one-half mile walking distance of potential station locations. A ¼ mile walking distance has typically been the pedestrian catchment area assumed for transit. However, recent research has shown that transit riders are willing to walk one-half mile (about a 15 minute walk) to reliable, fixed guideway transit (FTA, 2009; Mineta, 2006; Victoria, 2009). Therefore, a one-half mile walking distance from each station was selected for this analysis, because the potential for project-related parking impacts could occur up to a one-half mile walking distance from each station. Estimates of municipal code parking requirements, as well as parking demand estimates using the shared parking model, for commercial land uses within a one-half mile walking distance of each station are also presented.
In the Environmental Consequences—Mitigation Measures section, the report details future parking conditions to assess the effects of the implementation of the project. Estimates of maximum project parking demand obtained from the Metro Travel Demand Model are detailed, and compared with vacant existing parking supply to determine if project-related parking would have the potential to “spillover”—causing Westside Subway Extension riders that travel to stations by automobile to park in residential neighborhoods. The potential for station parking impacts due to parking removal are also assessed.
The availability of parking throughout the Study Area varies significantly depending on location. On-street (curbside) and off-street parking (public or private facilities) in the vicinity of the proposed project alignments are summarized. Selected occupancy surveys were conducted for areas around station locations with unrestricted on-street parking.
4.3.1 On-Street Parking
4.3.1.1 Parking Restrictions Parking restrictions were noted for every block face of each street located within a one-half mile walking distance of potential station locations. The following restrictions were the most common posted restrictions at station locations:
Metered spaces with time-limit restrictions (illustrated in Figure 4-24)
Time-limit restrictions (illustrated in Figure 4-25)
Daily restrictions (illustrated in Figure 4-26)
Residential permit parking restrictions (illustrated in Figure 4-27)
Street-sweeping restrictions (considered unrestricted in this analysis [illustrated in Figure 4-28])
Peak-period restrictions (considered unrestricted if limited to one peak period only [illustrated in Figure 4-29])
Final Transportation Impacts Technical Report
4.0—Affected Environment
W E S T S I D E S U B W A Y E X T E N S I O N Page 4-2 August 2010
Figure 4-29. Peak-Period
Restrictions
Figure 4-28. Street-
Sweeping Restrictions
Figure 4-27. Residential Permit
Parking Restrictions
Figure 4-26. Daily Restrictions
Figure 4-25. Time-Limit
Restrictions
Figure 4-24. Metered Spaces with
Time-Limit Restrictions
Final Transportation Impacts Technical Report
4.0—Affected Environment
W E S T S I D E S U B W A Y E X T E N S I O N August 2010 Page 4-3
Locations with street-sweeping restrictions, and locations with peak-period restrictions limited to either the AM or PM peak period, were considered “unrestricted” for the purpose of identifying potential spillover parking. The other restrictions summarized above would prevent Westside Subway Extension riders from parking throughout the day, because parkers would be ticketed if they parked their vehicle for longer than two hours, during both peak periods, or did not have a residential permit on their vehicle. Because of this enforcement, spillover parking would not be expected to occur in these locations.
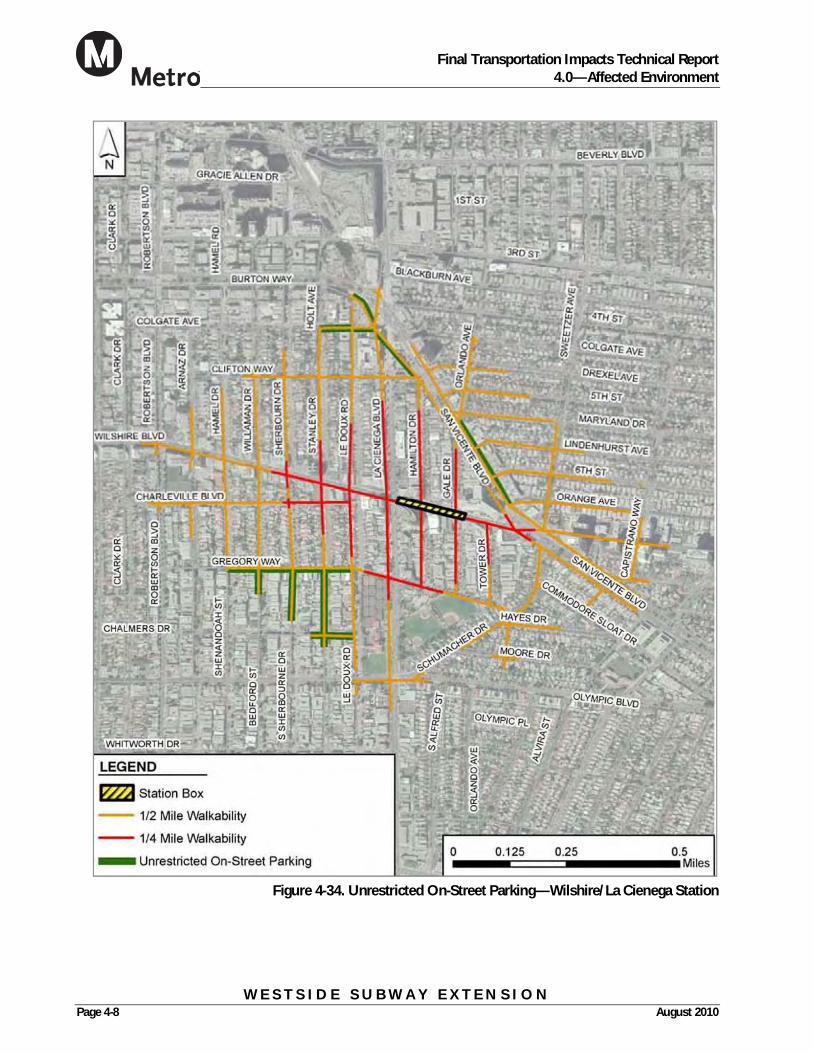
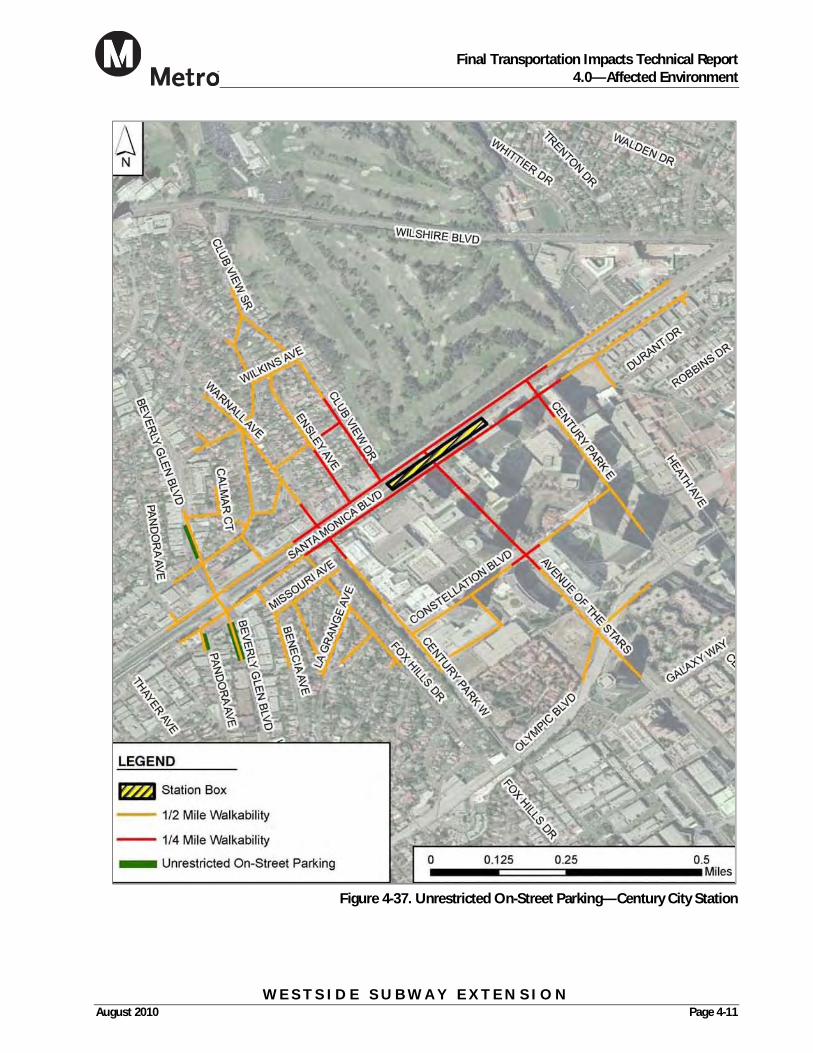
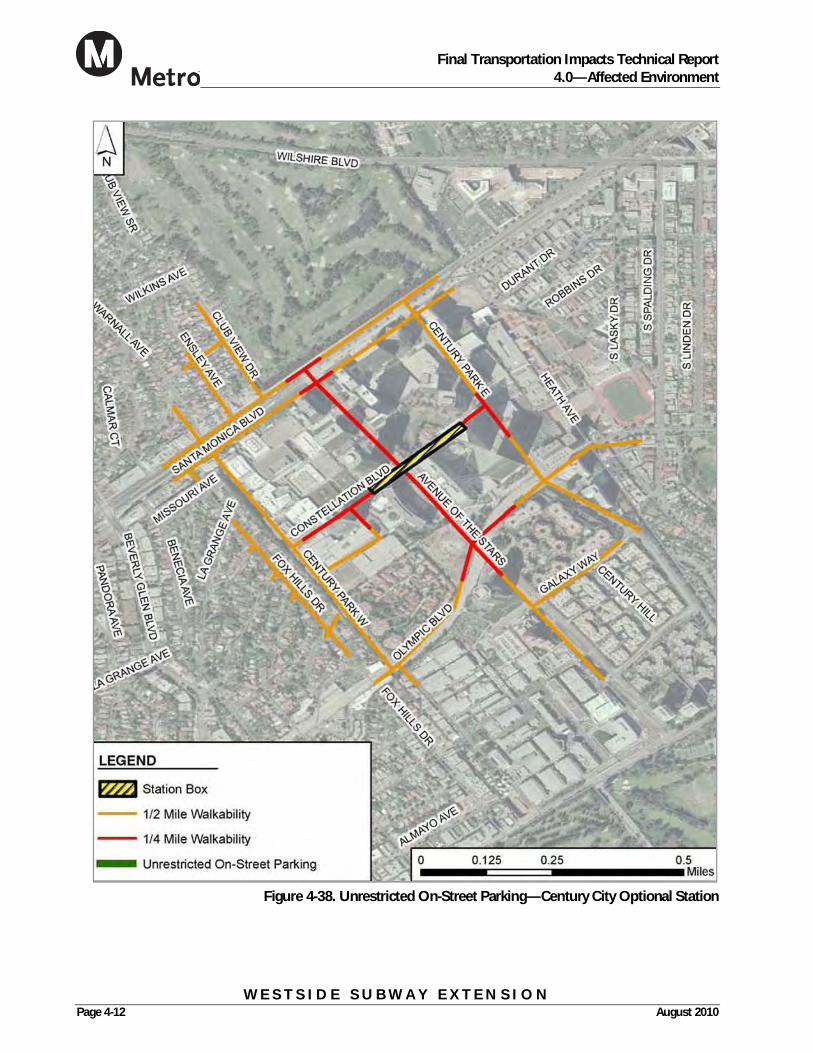
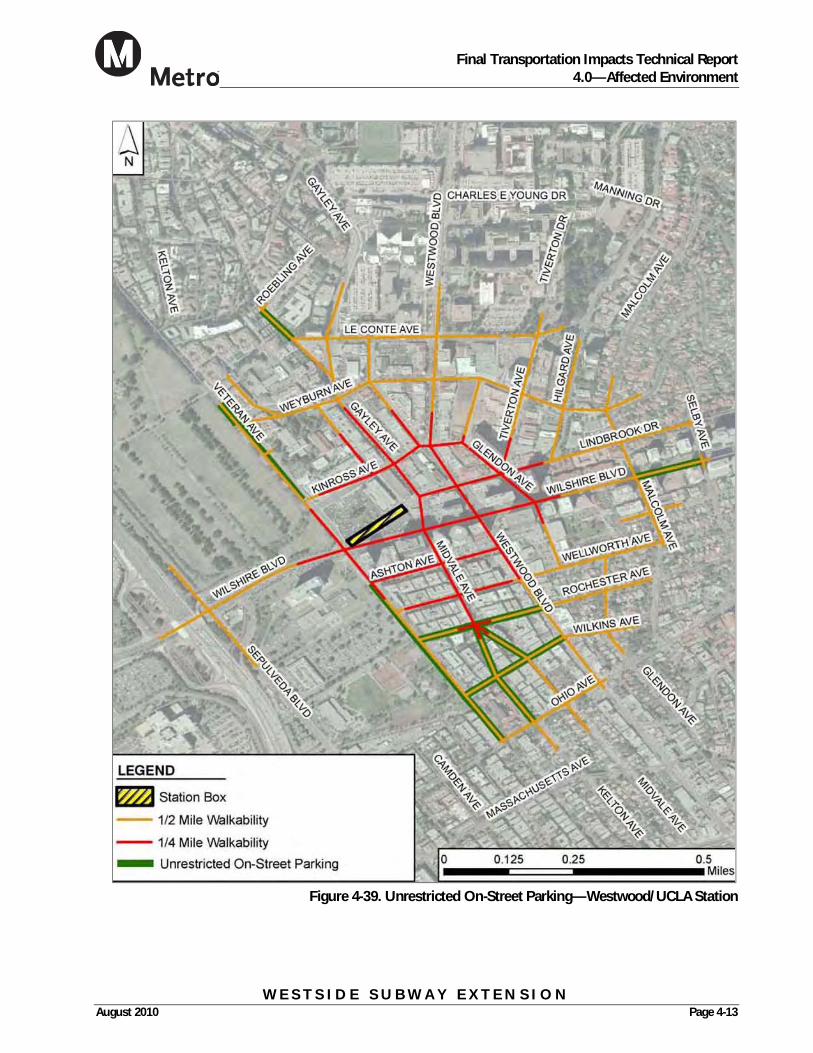
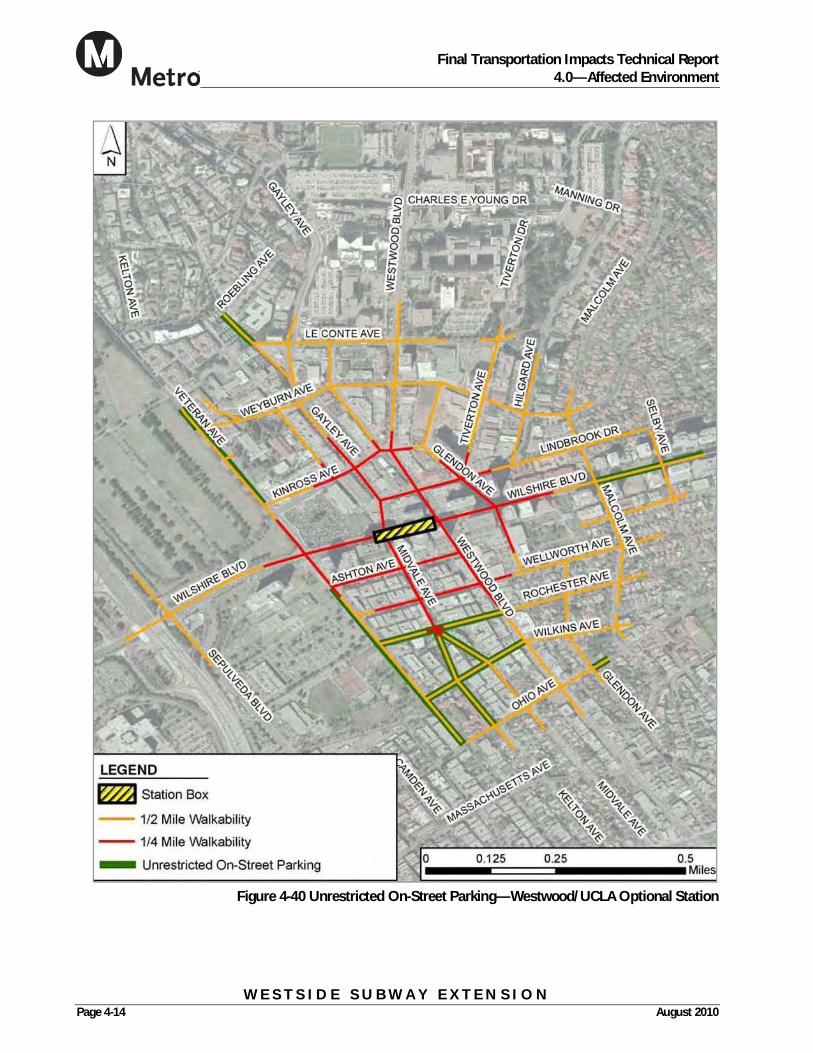
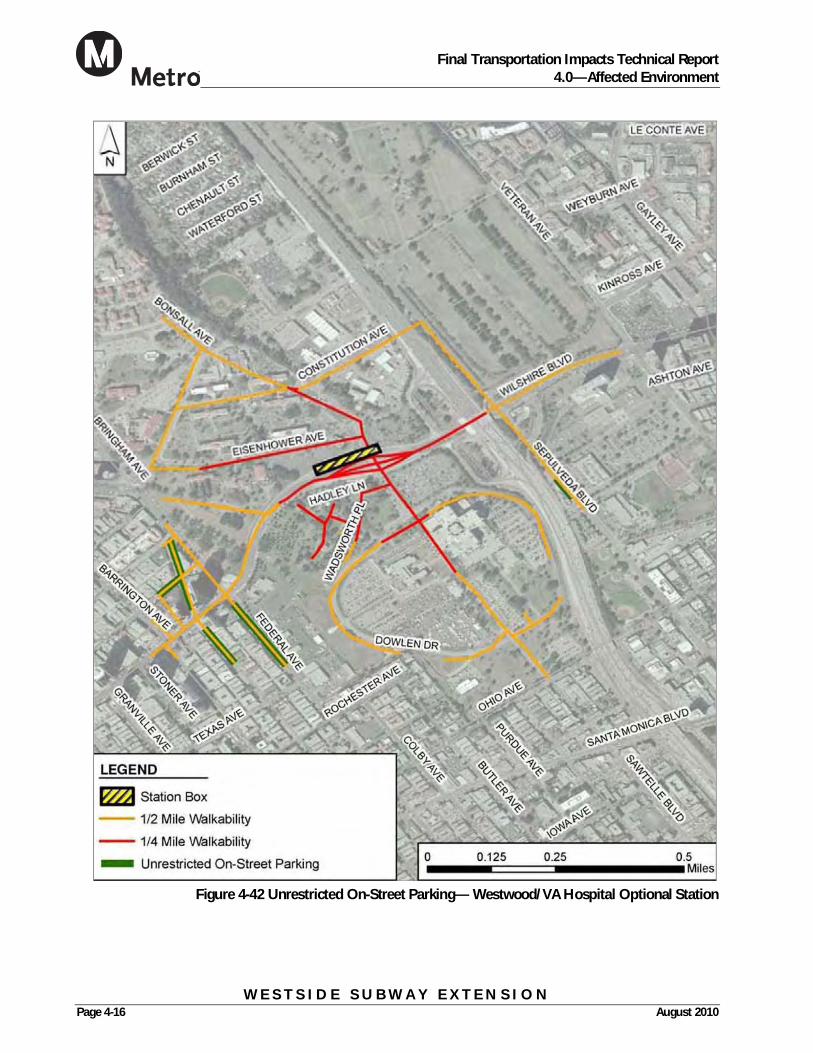
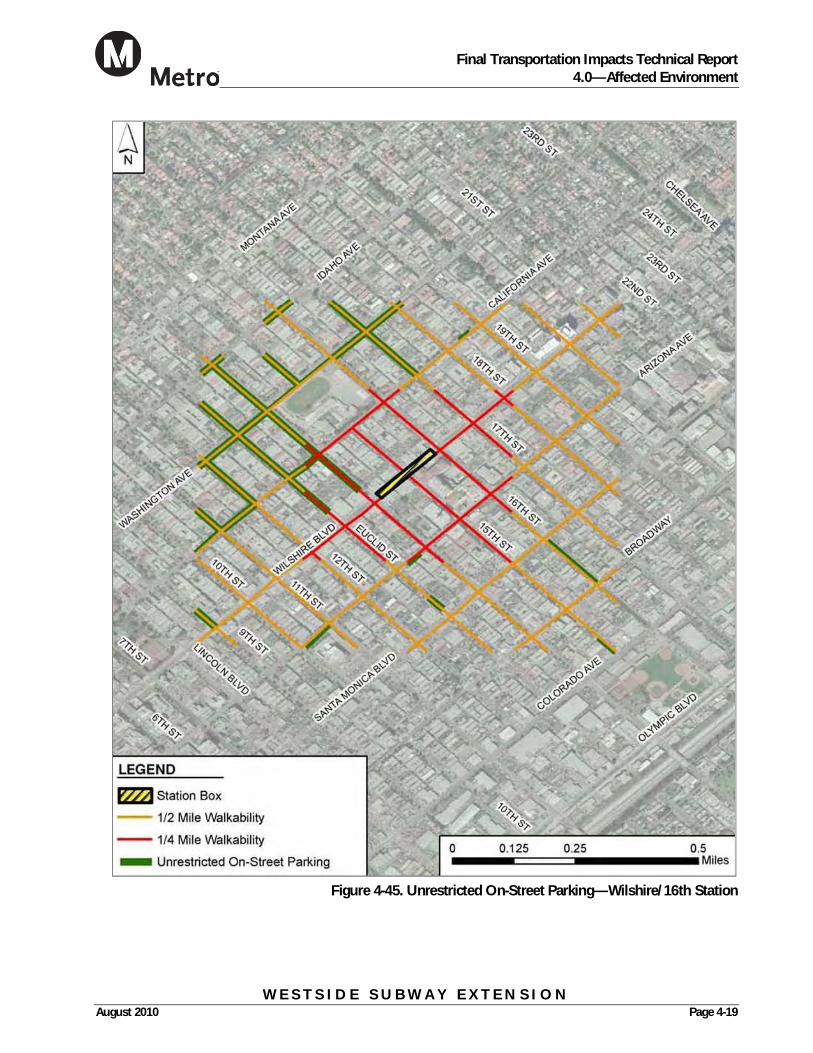
Figure 4-30 through Figure 4-51 illustrate the locations where “unrestricted” parking is currently available around each station — locations that have the potential to attract spillover parking. The unrestricted parking supply around each station is discussed below. In general, street-sweeping restrictions apply on nearly all streets labeled as “unrestricted.”
Wilshire/Crenshaw Station—As illustrated in Figure 4-30, parking is generally unrestricted on residential streets beyond one or two blocks north and south of Wilshire Boulevard. A variety of parking restrictions are in place on the majority of streets within a one-half mile walking distance of this station, including time-limit restrictions, peak-period restrictions and daily restrictions.
Wilshire/La Brea Station—As illustrated in Figure 4-31, several residential streets two to three blocks north of Wilshire Boulevard and one to four blocks south of Wilshire Boulevard have unrestricted parking. A variety of parking restrictions are in place on the remaining streets within a one-half mile walking distance of this station, including time-limit restrictions, peak-period restrictions, and residential permit restrictions. Parking meters with time-limit restrictions are installed along Wilshire Boulevard and La Brea Avenue.
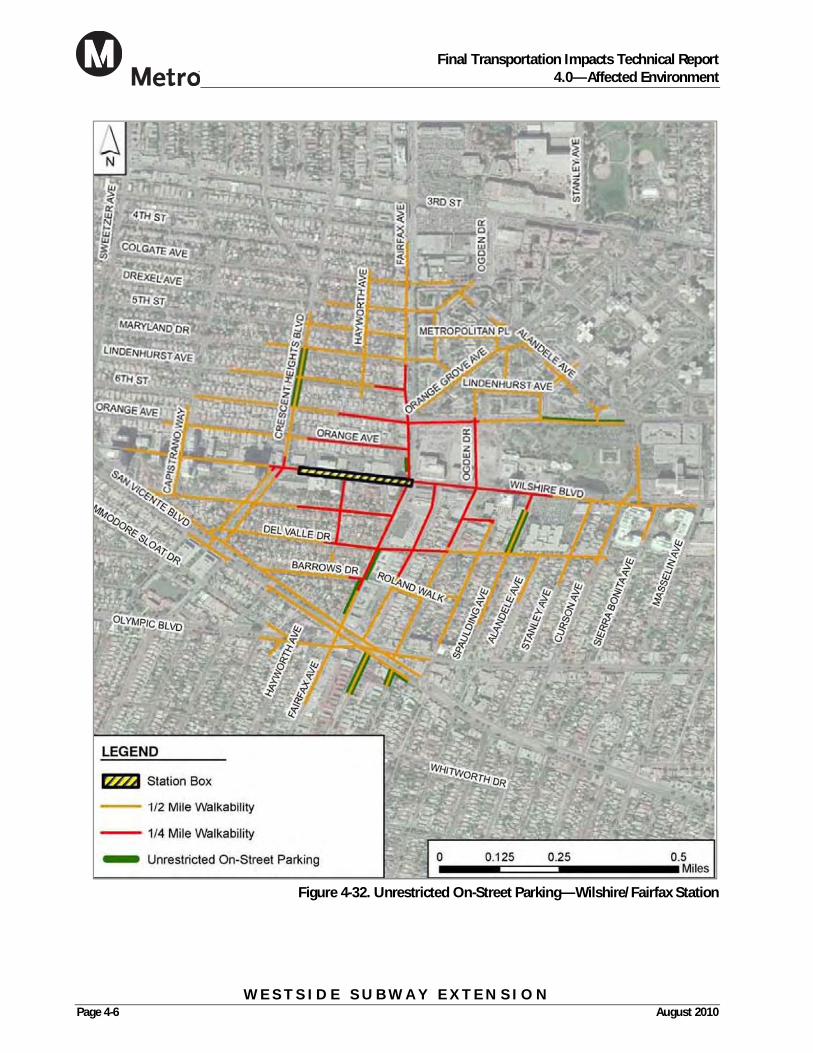
Wilshire/Fairfax Station—As illustrated in Figure 4-32 for this station location, and Figure 4-33 for the optional station location, parking is unrestricted on a few block faces within a one-half mile walking distance of the station, but parking is restricted on most blocks. A variety of parking restrictions are in place within a one-half mile walking distance of this station, including time-limit restrictions, and peak-period restrictions. Parking meters with time-limit restrictions are installed along Wilshire Boulevard and Fairfax Avenue.
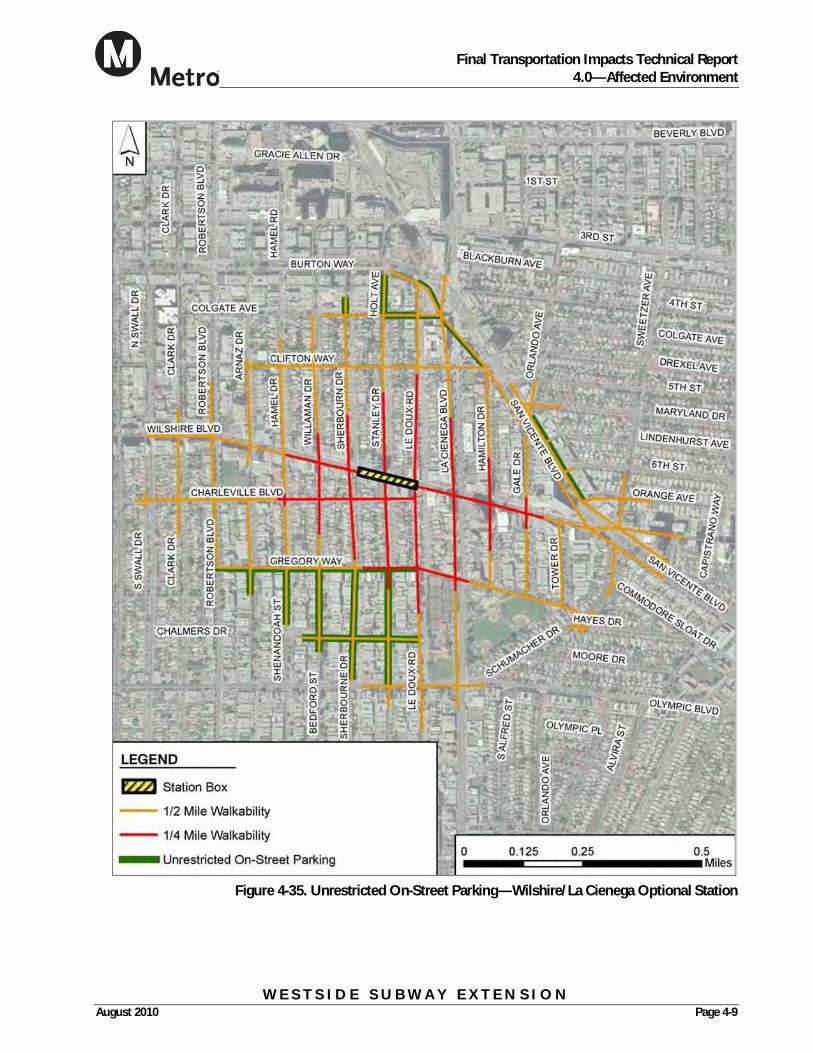
Wilshire/La Cienega Station—As illustrated in Figure 4-34 for this station location, and Figure 4-35 for the optional station location, parking is generally unrestricted beyond two blocks north and south of Wilshire Boulevard. A variety of parking restrictions are in place on the remaining streets within a one-half mile walking distance of this station, including time-limit restrictions, and peak-period restrictions. Parking meters with time-limit restrictions are installed along Wilshire Boulevard and San Vicente Boulevard.
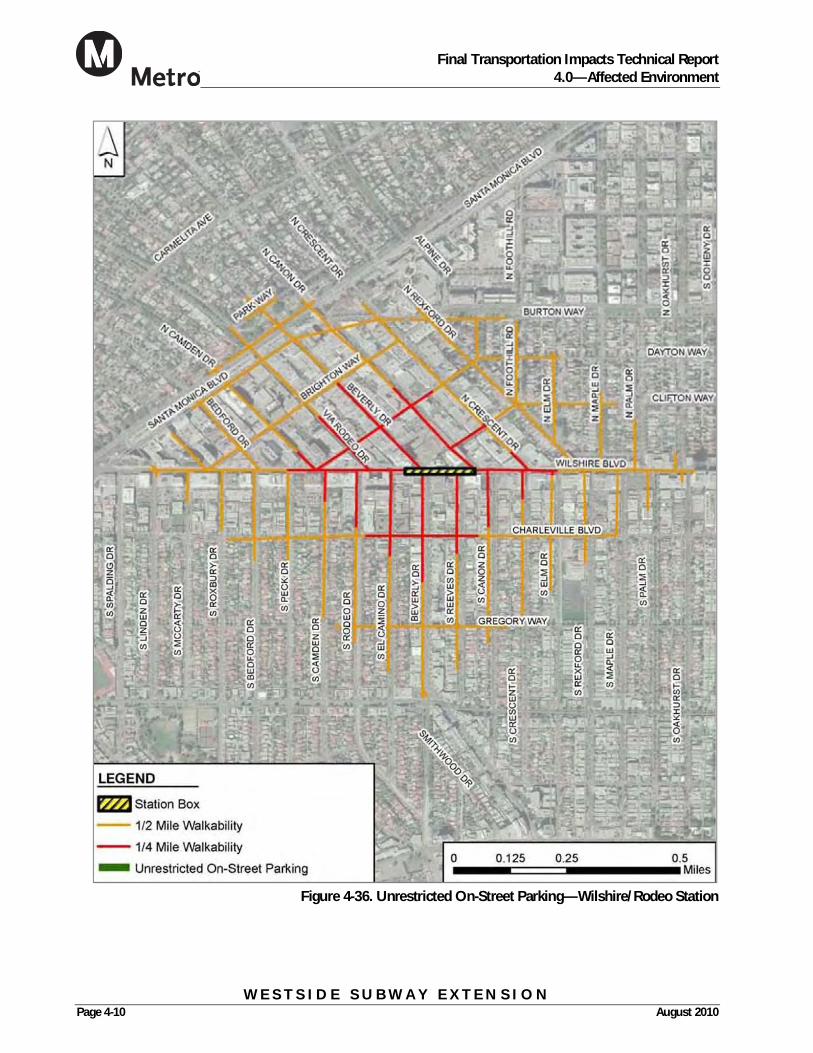
Wilshire/Rodeo Station—As illustrated in Figure 4-36, no unrestricted parking spaces are available within one-half mile walking distance of this station. A variety of parking restrictions are in place, including time-limit restrictions, and residential permit-parking restrictions. Parking meters with time-limit restrictions are installed along Wilshire Boulevard and for one or two blocks north and south of Wilshire Boulevard on most streets in the station area.
Final Transportation Impacts Technical Report
4.0—Affected Environment
W E S T S I D E S U B W A Y E X T E N S I O N Page 4-4 August 2010
Figure 4-30. Unrestricted On-Street Parking—Wilshire/Crenshaw Station
Final Transportation Impacts Technical Report
4.0—Affected Environment
W E S T S I D E S U B W A Y E X T E N S I O N August 2010 Page 4-5
Figure 4-31. Unrestricted On-Street Parking—Wilshire/La Brea Station
Final Transportation Impacts Technical Report
4.0—Affected Environment
W E S T S I D E S U B W A Y E X T E N S I O N Page 4-6 August 2010
Figure 4-32. Unrestricted On-Street Parking—Wilshire/Fairfax Station
Final Transportation Impacts Technical Report
4.0—Affected Environment
W E S T S I D E S U B W A Y E X T E N S I O N August 2010 Page 4-7
Figure 4-33. Unrestricted On-Street Parking—Wilshire/Fairfax Optional Station
Final Transportation Impacts Technical Report
4.0—Affected Environment
W E S T S I D E S U B W A Y E X T E N S I O N Page 4-8 August 2010
Figure 4-34. Unrestricted On-Street Parking—Wilshire/La Cienega Station
Final Transportation Impacts Technical Report
4.0—Affected Environment
W E S T S I D E S U B W A Y E X T E N S I O N August 2010 Page 4-9
Figure 4-35. Unrestricted On-Street Parking—Wilshire/La Cienega Optional Station
Final Transportation Impacts Technical Report
4.0—Affected Environment
W E S T S I D E S U B W A Y E X T E N S I O N Page 4-10 August 2010
Figure 4-36. Unrestricted On-Street Parking—Wilshire/Rodeo Station
Final Transportation Impacts Technical Report
4.0—Affected Environment
W E S T S I D E S U B W A Y E X T E N S I O N August 2010 Page 4-11
Figure 4-37. Unrestricted On-Street Parking—Century City Station
Final Transportation Impacts Technical Report
4.0—Affected Environment
W E S T S I D E S U B W A Y E X T E N S I O N Page 4-12 August 2010
Figure 4-38. Unrestricted On-Street Parking—Century City Optional Station
Final Transportation Impacts Technical Report
4.0—Affected Environment
W E S T S I D E S U B W A Y E X T E N S I O N August 2010 Page 4-13
Figure 4-39. Unrestricted On-Street Parking—Westwood/UCLA Station
Final Transportation Impacts Technical Report
4.0—Affected Environment
W E S T S I D E S U B W A Y E X T E N S I O N Page 4-14 August 2010
Figure 4-40 Unrestricted On-Street Parking—Westwood/UCLA Optional Station
Final Transportation Impacts Technical Report
4.0—Affected Environment
W E S T S I D E S U B W A Y E X T E N S I O N August 2010 Page 4-15
Figure 4-41. Unrestricted On-Street Parking—Westwood/VA Hospital Station
Final Transportation Impacts Technical Report
4.0—Affected Environment
W E S T S I D E S U B W A Y E X T E N S I O N Page 4-16 August 2010
Figure 4-42 Unrestricted On-Street Parking— Westwood/VA Hospital Optional Station
Final Transportation Impacts Technical Report
4.0—Affected Environment
W E S T S I D E S U B W A Y E X T E N S I O N August 2010 Page 4-17
Figure 4-43. Unrestricted On-Street Parking—Wilshire/Bundy Station
Final Transportation Impacts Technical Report
4.0—Affected Environment
W E S T S I D E S U B W A Y E X T E N S I O N Page 4-18 August 2010
Figure 4-44. Unrestricted On-Street Parking—Wilshire/26th Station
Final Transportation Impacts Technical Report
4.0—Affected Environment
W E S T S I D E S U B W A Y E X T E N S I O N August 2010 Page 4-19
Figure 4-45. Unrestricted On-Street Parking—Wilshire/16th Station
Final Transportation Impacts Technical Report
4.0—Affected Environment
W E S T S I D E S U B W A Y E X T E N S I O N Page 4-20 August 2010
Figure 4-46. Unrestricted On-Street Parking—Wilshire/4th Station