Silicon Valley Rapid Transit Corridor Final EIS Affected Environment Noise and Vibration 4.10-1 4.10 NOISE AND VIBRATION This section describes the existing noise and vibration conditions along the alignment based on field measurements. The information provided in this discussion is based on a series of noise reports prepared between 2003 and 2008. A Noise and Vibration Technical Report was prepared in 2003 by Harris Miller Miller & Hanson (HMMH) and updated to incorporate additional field noise and vibration measurements, soil testing, updated modeling assumptions, updated land use information, preliminary engineering details, and design changes. Earth Tech Inc. and ATS Consulting LLC prepared a January 2005 study, Station Noise Mitigation and Acoustical Treatment Study, which outlined the noise and acoustical mitigation measures need to be considered during the design of the BART stations. An update of this study was produced in October 2006, Update Acoustical Design Considerations for SVRT Stations by ATS Consulting LLC. In December 2006, Wilson & Ihrig and Associates, Inc. produced a technical report, Line Segment Wayside Noise Report which further evaluated adverse noise effects from the BEP Alternative. ATS Consulting produced a noise report in 2007 titled, Noise Study Yard & Shops. The most recent studies were performed by Wilson, Ihrig and Associates, Inc. in January and February 2008, titled, Central Area Guideway Groundborne Noise and Vibration Report and Northern Area Berryessa Extension Project Alignment Options Noise and Vibration Report, respectively. These and additional studies are listed in the bibliography and available upon request. 4.10.1 NOISE AND VIBRATION TERMINOLOGY Noise Descriptors Noise is typically defined as unwanted or undesirable sound, where sound is characterized by small air pressure fluctuations above and below the atmospheric pressure. The basic parameters of environmental noise that affect human subjective response are (1) intensity or level, (2) frequency content, and (3) variation with time. The first parameter is determined by how greatly the sound pressure fluctuates above and below the atmospheric pressure and is expressed on a compressed scale in units of decibels (dB). By using this scale, the range of normally encountered sound can be expressed by values between 0 and 120 dB. On a relative basis, a 3-dB change in sound level generally represents a barely-noticeable change outside the laboratory, whereas a 10-dB change in sound level would typically be perceived as a doubling (or halving) in the loudness of a sound. The frequency content of noise is related to the tone or pitch of the sound and is expressed based on the rate of the air pressure fluctuation in terms of cycles per second (called Hertz and abbreviated as Hz). The human ear can detect a wide range of frequencies from about 20 Hz to 17,000 Hz. Because the sensitivity of human
Transcript
Silicon Valley Rapid Transit Corridor Final EIS
Affected Environment Noise and Vibration 4.10-1
4.10 NOISE AND VIBRATION This section describes the existing noise and vibration conditions along the alignment based on field measurements. The information provided in this discussion is based on a series of noise reports prepared between 2003 and 2008.
A Noise and Vibration Technical Report was prepared in 2003 by Harris Miller Miller & Hanson (HMMH) and updated to incorporate additional field noise and vibration measurements, soil testing, updated modeling assumptions, updated land use information, preliminary engineering details, and design changes. Earth Tech Inc. and ATS Consulting LLC prepared a January 2005 study, Station Noise Mitigation and Acoustical Treatment Study, which outlined the noise and acoustical mitigation measures need to be considered during the design of the BART stations. An update of this study was produced in October 2006, Update Acoustical Design Considerations for SVRT Stations by ATS Consulting LLC.
In December 2006, Wilson & Ihrig and Associates, Inc. produced a technical report, Line Segment Wayside Noise Report which further evaluated adverse noise effects from the BEP Alternative. ATS Consulting produced a noise report in 2007 titled, Noise Study Yard & Shops. The most recent studies were performed by Wilson, Ihrig and Associates, Inc. in January and February 2008, titled, Central Area Guideway Groundborne Noise and Vibration Report and Northern Area Berryessa Extension Project Alignment Options Noise and Vibration Report, respectively. These and additional studies are listed in the bibliography and available upon request.
4.10.1 NOISE AND VIBRATION TERMINOLOGY
Noise Descriptors
Noise is typically defined as unwanted or undesirable sound, where sound is characterized by small air pressure fluctuations above and below the atmospheric pressure. The basic parameters of environmental noise that affect human subjective response are (1) intensity or level, (2) frequency content, and (3) variation with time. The first parameter is determined by how greatly the sound pressure fluctuates above and below the atmospheric pressure and is expressed on a compressed scale in units of decibels (dB). By using this scale, the range of normally encountered sound can be expressed by values between 0 and 120 dB. On a relative basis, a 3-dB change in sound level generally represents a barely-noticeable change outside the laboratory, whereas a 10-dB change in sound level would typically be perceived as a doubling (or halving) in the loudness of a sound.
The frequency content of noise is related to the tone or pitch of the sound and is expressed based on the rate of the air pressure fluctuation in terms of cycles per second (called Hertz and abbreviated as Hz). The human ear can detect a wide range of frequencies from about 20 Hz to 17,000 Hz. Because the sensitivity of human
Silicon Valley Rapid Transit Corridor Final EIS
Affected Environment 4.10-2 Noise and Vibration
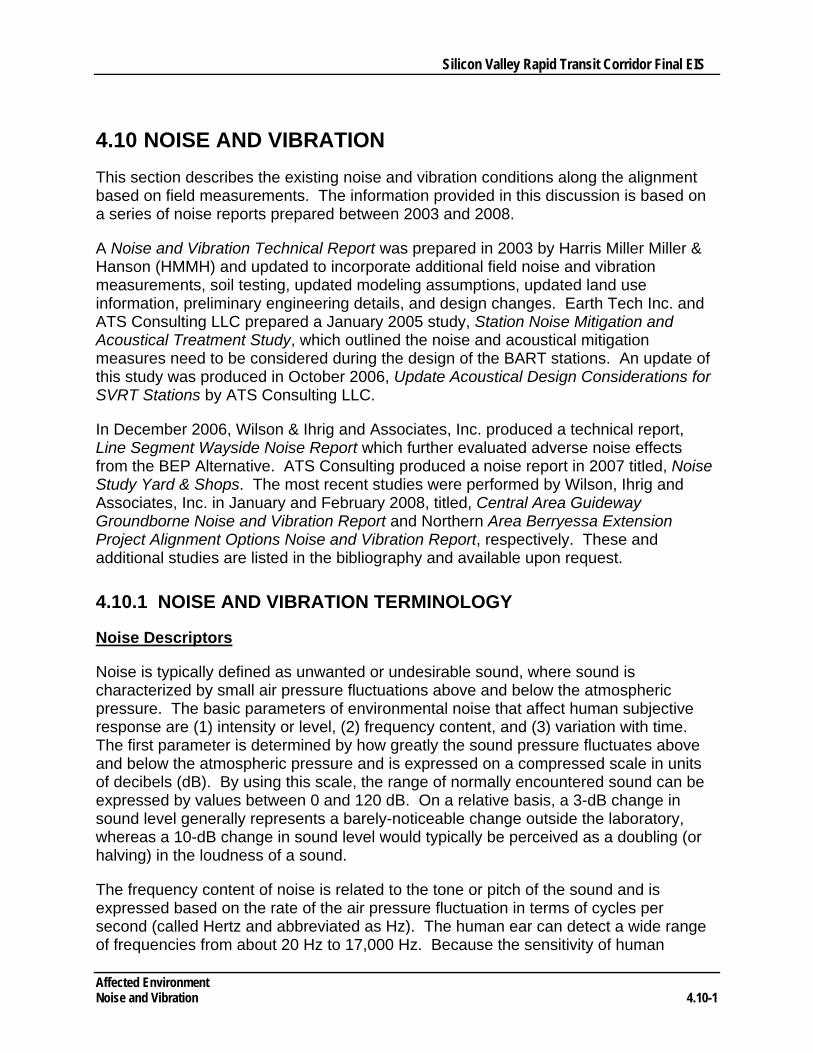
hearing varies with frequency, the A-weighting system is commonly used when measuring environmental noise to provide a single number descriptor that correlates with human subjective response. Sound levels measured using this weighting system are called "A-weighted sound levels” and are expressed in decibel notation as "dBA.” The A-weighted sound level is widely accepted for describing environmental noise. Figure 4.10-1 provides a comparison of representative dBA levels for common noise sources and environments. While the extremes range from 0 dBA (approximate threshold of hearing) to 120 dBA (jet aircraft at 500 feet), most commonly encountered noise levels fall within the range of 40 dBA to 90 dBA.
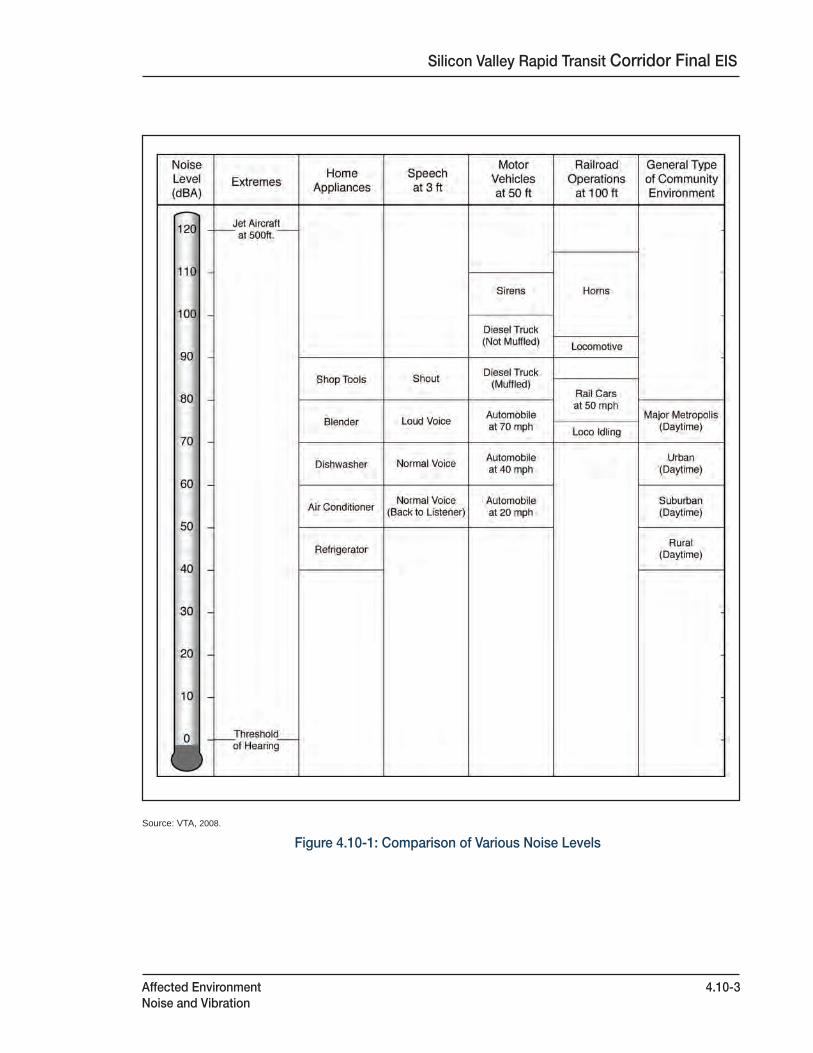
Because environmental noise fluctuates from moment to moment, it is common practice to condense all of this information into a single number called the "equivalent sound level” (Leq). Leq is a measure of sound energy over a period of time, typically 1 hour or 24 hours. It is referred to as the equivalent sound level because it is equivalent to the level of a steady sound that, over a referenced duration and location, has the same sound energy as the actual fluctuating sound. Often Leq values over a 24-hour period are used to calculate cumulative noise exposure in terms of the “day-night equivalent sound level” (Ldn). Ldn is the A-weighted Leq for a 24-hour period with an added 10-dB penalty imposed on noise that occurs during the nighttime hours (between 10 p.m. and 7 a.m.). Many surveys have shown that Ldn is well correlated with human annoyance, and therefore this descriptor is widely used for environmental noise impact assessment. Figure 4.10-2 provides examples of typical noise environment and criteria in terms of Ldn. While the extremes of Ldn range from 35 dBA in a wilderness environment to 85 dBA in noisy urban environments, Ldn generally ranges between 55 dBA and 75 dBA in most communities. As shown in Figure 4.10-2, this spans the range between an "ideal" residential environment and the threshold for an unacceptable residential environment according to the U.S. Department of Housing and Urban Development (HUD) and USEPA.
Environmental noise can also be described statistically using percentile sound levels, Ln, which refer to the sound level exceeded "n" percent of the time. For example, the sound level exceeded 90 percent of the time, denoted as L90, represents the "background" noise in a community. Similarly, the sound level exceeded 33 percent of the time (L33) is often used to approximate the Leq in the absence of loud, intermittent sources such as aircraft and trains.
Ground-Borne Noise and Vibration Descriptors
Some common sources of ground-borne vibration are trains, buses on rough roads, and construction activities such as blasting, pile-driving and operating heavy earth-moving equipment. The effects of ground-borne vibration include the movement of the building floors, rattling of windows, shaking of items on shelves or hanging on walls, and rumbling sounds. The rumbling sound caused by the vibration of room surfaces is called ground-borne noise.
Figure 4.10-1: Comparison of Various Noise Levels
Silicon Valley Rapid Transit Corridor Final EIS
Affected EnvironmentNoise and Vibration
4.10-3
Source: VTA, 2008.
Figure 4.10-2: Examples of Typical Outdoor Noise Exposure
Silicon Valley Rapid Transit Corridor Final EIS
Affected EnvironmentNoise and Vibration
4.10-4
Source: VTA, 2008.
Silicon Valley Rapid Transit Corridor Final EIS
Affected Environment Noise and Vibration 4.10-5
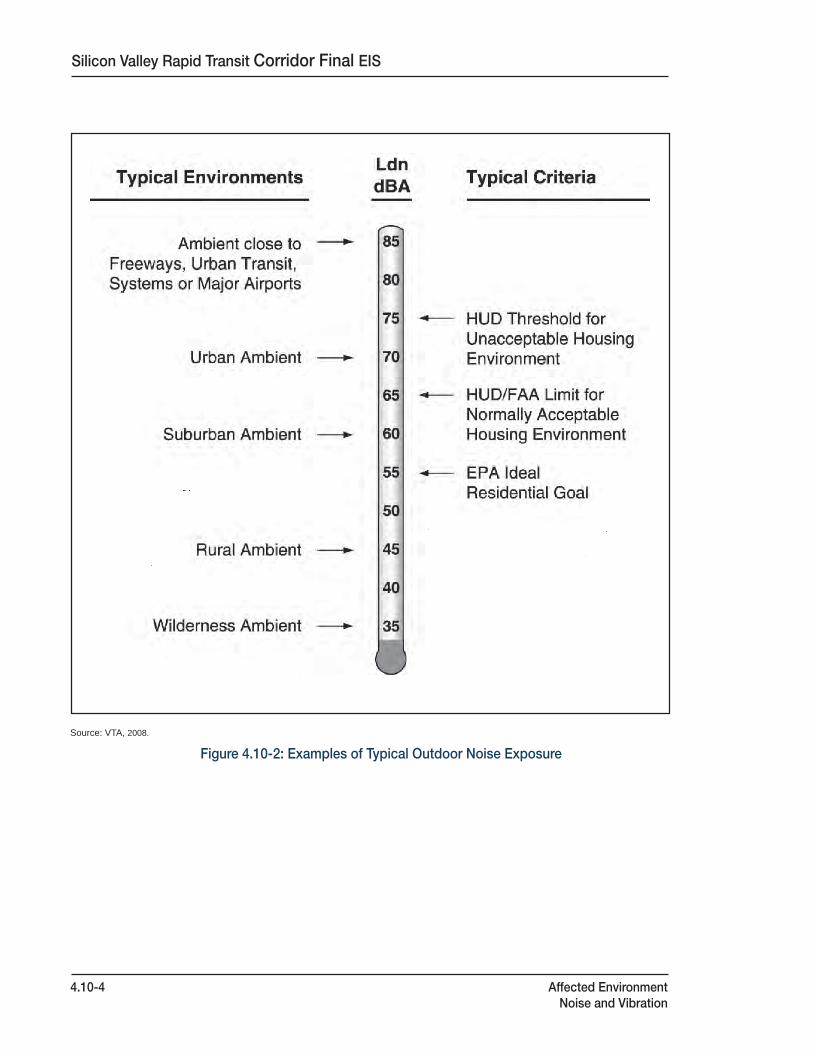
The basic concepts of ground-borne vibration and noise are illustrated for a rail system in Figure 4.10-3. The train wheels rolling on the rails create vibration energy that is transmitted through the track support system into the transit structure. The amount of energy that is transmitted into the transit structure is strongly dependent on factors such as how smooth the wheels and rails are and the resonance frequencies of the vehicle suspension system and the track support system. These systems, like all mechanical systems, have resonances that result in increased vibration response at certain frequencies, called natural frequencies.
The vibration of the transit structure creates vibration waves that propagate through the various soil and rock strata to the foundations of nearby buildings. The vibration propagates from the foundation throughout the building structure. The maximum vibration amplitudes of the floors and walls of a building often will be at the resonance frequencies of various components of the building.
Ground-borne vibration is the oscillatory motion of the ground about an equilibrium position. It can be described in terms of displacement, velocity, or acceleration. Displacement refers to the distance an object moves away from its equilibrium position, velocity refers to the rate of change in displacement or the speed of this motion, and acceleration refers to the time rate of change in the velocity of the object.
Although displacement is easier to understand than velocity or acceleration, it is rarely used for describing ground-borne vibration. One reason for this is that most sensors used for measuring ground-borne vibration are designed to provide output signals proportional to either velocity or acceleration. Even more important, the response of humans, buildings, and equipment to vibration is more accurately described using velocity or acceleration. Sensitivity to vibration typically corresponds to the amplitude of vibration velocity within the low frequency range of most concern for environmental vibration (roughly 5 to 100 Hz). Therefore, vibration velocity is used in this analysis as the primary measure to evaluate the effects of vibration.
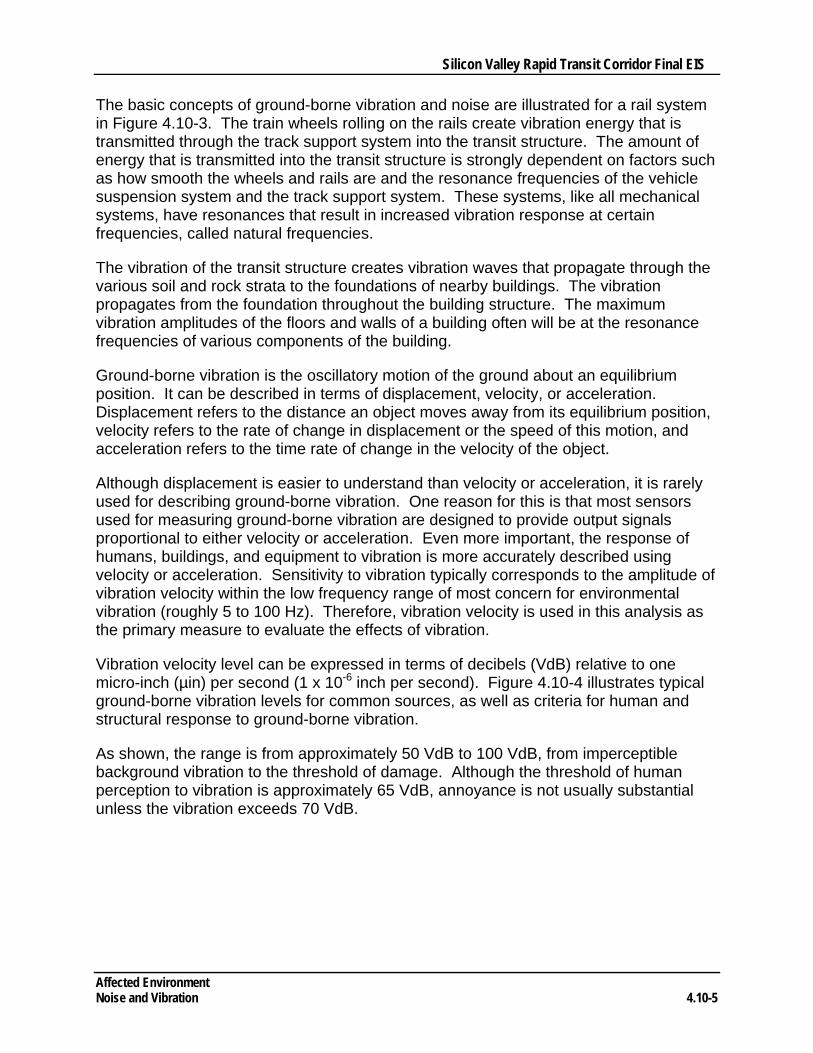
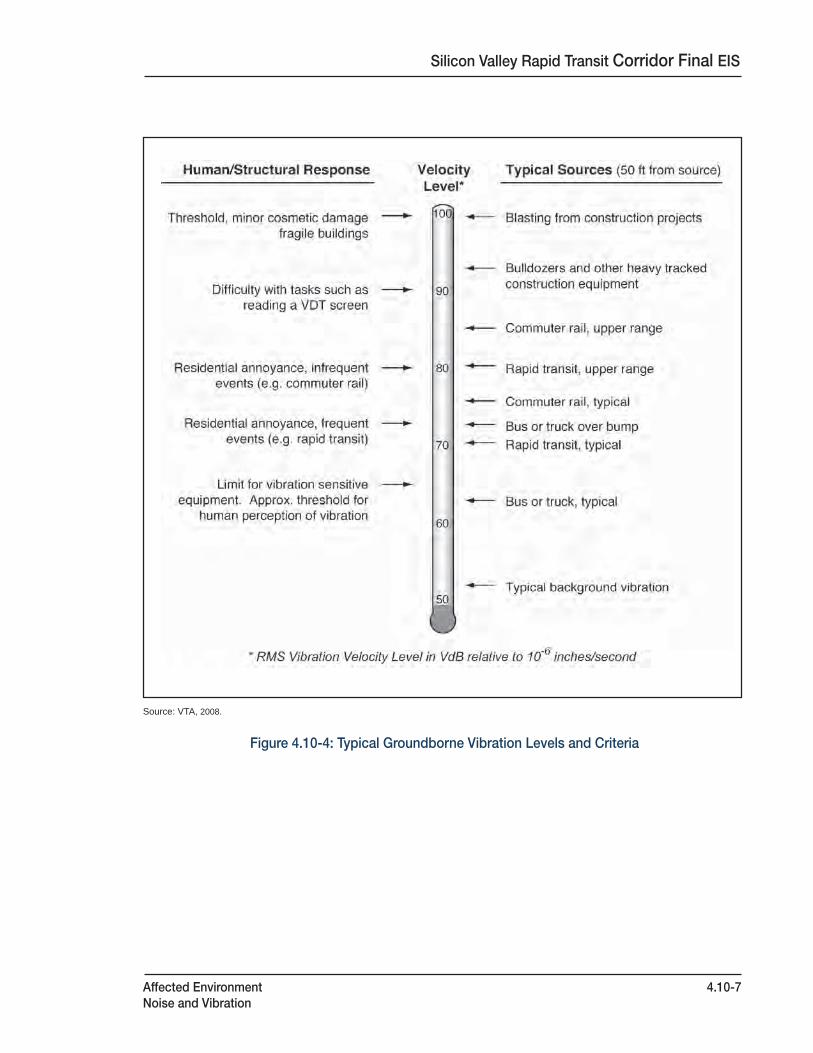
Vibration velocity level can be expressed in terms of decibels (VdB) relative to one micro-inch (µin) per second (1 x 10⁻⁶ inch per second). Figure 4.10-4 illustrates typical ground-borne vibration levels for common sources, as well as criteria for human and structural response to ground-borne vibration.
As shown, the range is from approximately 50 VdB to 100 VdB, from imperceptible background vibration to the threshold of damage. Although the threshold of human perception to vibration is approximately 65 VdB, annoyance is not usually substantial unless the vibration exceeds 70 VdB.
Figure 7-1. Propagation of Ground-Borne Vibration into Buildings
Figure 4.10-3: Propagation of Groundborne Vibration into Buildings
Silicon Valley Rapid Transit Corridor Final EIS
Affected EnvironmentNoise and Vibration
4.10-6
Source: Wilson Ihng, 2008
Figure 4.10-4: Typical Groundborne Vibration Levels and Criteria
Silicon Valley Rapid Transit Corridor Final EIS
Affected EnvironmentNoise and Vibration
4.10-7
Source: VTA, 2008.
Silicon Valley Rapid Transit Corridor Final EIS
Affected Environment 4.10-8 Noise and Vibration
4.10.2 NOISE AND VIBRATION METHODOLOGY
Noise Methodology
To characterize the existing noise conditions along the alignment, field measurements were taken in fall 2001, and spring and fall 2002, fall 2004, and fall 2007. Noise measurement sites were selected based on a review of aerial photographs and visual surveys of noise-sensitive land uses (receptors) along the alignment. Thirty-two sites, designated as Sites LT1 through LT32, were selected for long-term (typically 24-hour) monitoring. Four sites, designated as Sites ST1 through ST9, were selected for short-term (one- to three-hour) monitoring. An additional site, designated Site LTWS, was used from the BART Warm Springs Extension study. Noise measurements conducted for the BART Warm Springs Extension environmental document were used to characterize noise near the BART Warm Springs Station to I-880.
Noise measurements were taken with equipment that conforms to American National Standards Institute (ANSI) Standard S1.4 for Type 1 (Precision) sound level meters. Long-term noise measurements were recorded by unattended Larson Davis Model 820 and 870 portable automatic noise monitors that continuously sampled the A-weighted sound level, typically over one 24-hour period. These monitors recorded hourly results, including the Lmax, the Leq, and the Ln. The Ldn was subsequently computed from the hourly Leq data. Short-term ambient noise measurements were conducted using an attended Larson Davis Model 820 noise monitor to obtain hourly Lmax, Leq, and Ln levels for a one- to three-hour period.
A screening analysis was performed to identify sensitive receptors within 350 feet of the proposed alignment and 250 feet from proposed stations and ancillary equipment. The vast majority of these receptors are single and multi-family residences, falling under FTA Category 2. The remaining receptors were institutional sites falling under FTA Category 3, including two churches and two schools. The receptors were clustered based on distance to the tracks, acoustical shielding between the receptors and the tracks, and location relative to crossovers and grade crossings. The existing noise exposure at each cluster of receptors was estimated based on long- and short-term ambient noise measurements (see Section 4.10.3) and was used to determine the thresholds for moderate and severe impact using the FTA Noise Impact Criteria. In areas where the projections show either moderate or severe impact, mitigation measures were identified.
Ground-Borne Vibration and Noise Methodology
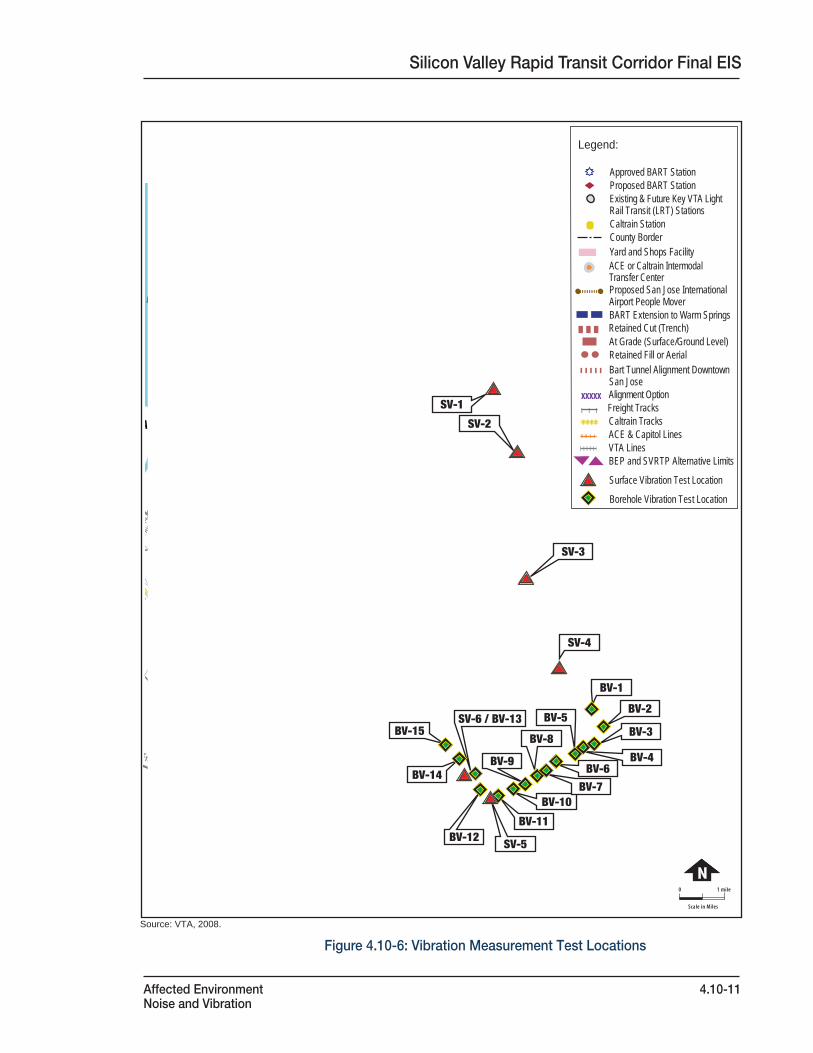
Freight trains along the railroad corridor and heavy truck traffic on nearby roadways are the primary contributors to the existing vibration environment along the alignment. A measurement program was carried out in the fall and winter of 2001, 2002, 2004 and summer 2005 to characterize ground-borne vibration propagation at representative sites. Vibration measurement test sites were selected based on a review of aerial
Silicon Valley Rapid Transit Corridor Final EIS
Affected Environment Noise and Vibration 4.10-9
photographs, supplemented by a visual land-use survey. Twenty-two sites were selected to represent a range of soil conditions in areas along the corridor that include a substantial number of vibration-sensitive receptors.
4.10.3 NOISE AND VIBRATION MEASUREMENTS
Measurements
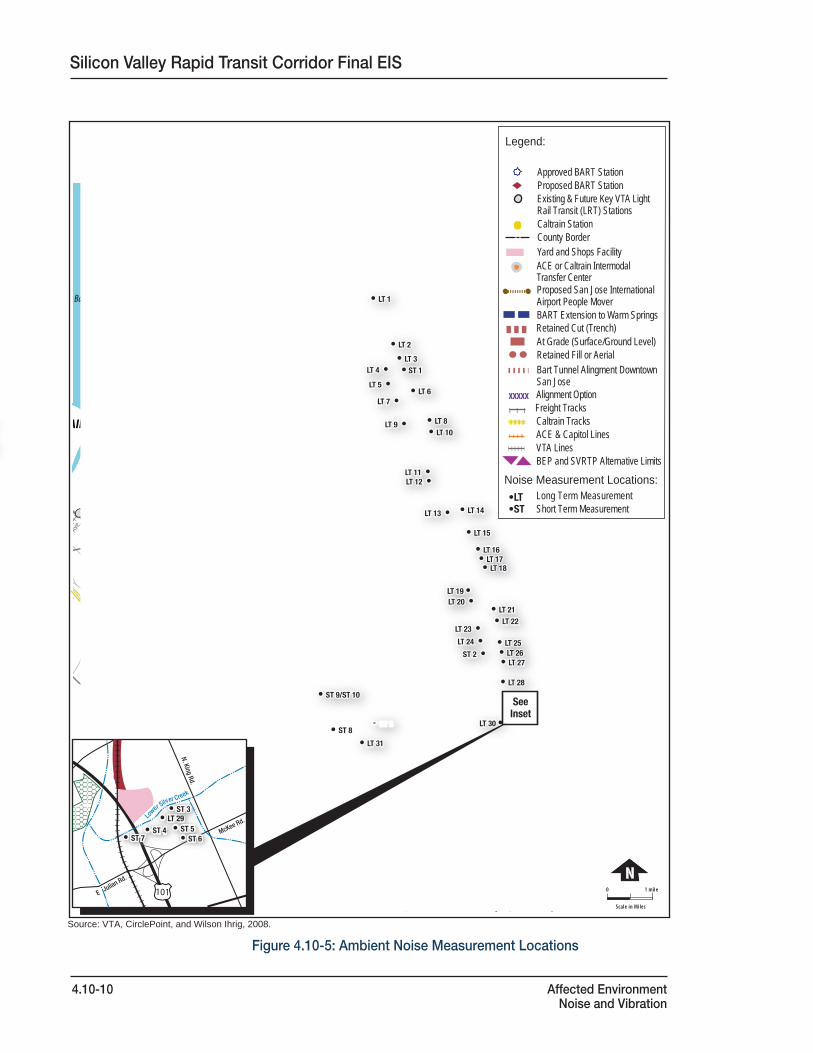
The locations of sites where ambient noise measurements were taken are shown in Figure 4.10-5 and are described below. Long-term measurements were taken at sites LT1 through LT31. Short-term measurements were taken at sites ST1 through ST10. The primary sources observed to contribute to the existing noise environment along the alignment or in the vicinity are motor vehicle traffic on nearby and distant roadways, aircraft overflights, UPRR operations, construction activities, and general community activities. Figure 4.10-6 shows the locations where vibration measurements were taken.
Noise measurement results are shown in Table 4.10-1. The long-term measurements indicate that existing Ldn ranges from 51 to 76 dBA along the corridor; these values are generally within FTA acceptability criteria thresholds. These results were used as a basis for determining existing noise conditions at all noise-sensitive receptors along the proposed BART alignment.
4.10.4 REGULATORY CONSIDERATIONS
Operational noise standards defined in the 2006 FTA manual, Transit Noise and Vibration Impact Assessment are used to determine the noise impacts of the BEP and SVRTP alternatives as discussed in Section 5.10, Noise and Vibration. The FTA Noise Impact Criteria are founded on well-documented research on community reaction to noise and are based on change in noise exposure using a sliding scale.
Construction noise regulations include standards set by local jurisdictions as discussed in Chapter 6.0, Construction.
Ave.
Central Expwy.
Castro St. Middle�eld Rd.
Logue A
ve.
Fair
Oaks
Blvd
.
7th St.S 1st St.
The AlamedaMilmont Dr.
Santa Clara St.
Coleman
E. St. James
Heddi ng St
UniversitySanta Clara
Gish Rd.
N. Math
ilda A
ve.
CaribbeanCentral Expwy.
Arques Ave.
Kifer Rd.
Calaveras Blvd.
Abel St.
Great Mall
Ctr.Civic
San Fernando
America Pkwy.
Miss
ion Bl
vd.
S.
Dixon Landing Rd.
Warm Springs Blvd.
Kato Rd.
Montague Expwy.
Trimble Rd.
Montague
Expwy.
N. King Rd.
Story Rd.
Mabury Rd.
S. King Rd.
Trade Zone
Blvd.
Osgood Rd.
Lundy Ave.
Murphy
McKay Dr.
Brokaw Rd.
Scott Blvd.
De La Cruz Blvd.
Taylor St.
Tully Rd.
Old Oakland Rd.
Central Expwy.
Auto Mall Pkwy.
Hostetter Rd.
Landess Ave.
Jacklin Rd.
Scott Creek Rd.
S. Milpitas Blvd.
Lawr
ence
Expw
y.
San Tomas Expwy.
California Ave.
Evelyn Ave.
El Camino RealAlum Rock
Ave.
McKee Rd.
Berryessa
Rd.
Ringwood
Grimmer
Blvd.
San Jose
StateUniv.
Ave.
Great
Dr.
Former UPRR Now VTA
Julian St.
Arena
N 1st St.
FREMONT
MILPITAS
SAN JOSE
SANTACLARA
SUNNYVALE
MOUNTAINVIEW
ToOakland
ToOakland
To Pleasanton
To PleasantonCivic Civic
CenterCenter
San Jose Int’l Airport
Paramount's
Great America
San Francisco BaySan Francisco BayNational Wildlife RefugeNational Wildlife Refuge
ST3 1603 Melody Lane Vehicle traffic on US 101, aviation noise from San Jose International Airport
10/10/07 1 53
ST4 1505 Marburg Apartments Vehicle traffic on US 101, aviation noise from San Jose International Airport
10/10/07 1 66
ST5 North 33rd Street Vehicle traffic on US 101, aviation noise from San Jose International Airport
10/10/07 0.25 63
ST6 Berrywood Drive/North 33rd Street
Vehicle traffic on US 101, aviation noise from San Jose International Airport
10/11/07 0.25 51
ST7 399 East Court Vehicle traffic on US 101, aviation noise from San Jose International Airport
10/10/07 1 76
ST8 1655 Berryessa Road - 01/15/02 3 67
ST9 Corner of Newhall and Chestnut streets - 03/07/02 1 70
ST10 Railroad Avenue (Santa Clara Station) - 03/08/02 1 71
a Long-term noise exposure (“LT” Site Nos.) is provided in terms of Ldn and short-term noise exposure (“ST” Site Nos.) is provided in terms of Leq Source: HMMH, 2003; Wilson Ihrig 2006; ATS 2007.