ESTABLISHMENT OF AN ENVIRONMENTAL CONTROL TECHNOLOGY LABORATORY WITH A CIRCULATING FLUIDIZED-BED COMBUSTION SYSTEM ESTABLISHMENT OF AN ENVIRONMENTAL CONTROL TECHNOLOGY LABORATORY WITH A CIRCULATING FLUIDIZED-BED COMBUSTION SYSTEM FINAL REPORT COOPERATIVE AGREEMENT NO. DE-FC26-03NT41840 PROJECT PERFORMANCE PERIOD: September 15, 2003 – August 31, 2008 SUBMITTED BY WEI-PING PAN YAN CAO JOHN SMITH INSTITUTE FOR COMBUSTION SCIENCE AND ENIRONMENTAL TECHNOLOGY WESTERN KENTUCKY UNIVERSITY (WKU) 2413 Nashville RD. BOWLING GREEN, KY 42101 PREPARED FOR U.S. DEPARTMENT OF ENERGY NATIONAL ENERGY TECHNOLOGY LABORATORY PITTSBURGH, PENNSYLVANIA 15236 REPORT SUBMITTAL DATE: August 31, 2008 ICSET, WKU Aug 1, 2008
Transcript
ESTABLISHMENT OF AN ENVIRONMENTAL CONTROL TECHNOLOGY LABORATORY WITH A CIRCULATING FLUIDIZED-BED COMBUSTION SYSTEM
ESTABLISHMENT OF AN ENVIRONMENTAL CONTROL TECHNOLOGY LABORATORY WITH A CIRCULATING
FLUIDIZED-BED COMBUSTION SYSTEM
FINAL REPORT
COOPERATIVE AGREEMENT NO. DE-FC26-03NT41840 PROJECT PERFORMANCE PERIOD: September 15, 2003 – August 31, 2008
SUBMITTED BY
WEI-PING PAN
YAN CAO
JOHN SMITH
INSTITUTE FOR COMBUSTION SCIENCE AND ENIRONMENTAL TECHNOLOGY WESTERN KENTUCKY UNIVERSITY (WKU)
2413 Nashville RD. BOWLING GREEN, KY 42101
PREPARED FOR
U.S. DEPARTMENT OF ENERGY NATIONAL ENERGY TECHNOLOGY LABORATORY
PITTSBURGH, PENNSYLVANIA 15236
REPORT SUBMITTAL DATE: August 31, 2008
ICSET, WKU Aug 1, 2008
ESTABLISHMENT OF AN ENVIRONMENTAL CONTROL TECHNOLOGY LABORATORY WITH A CIRCULATING FLUIDIZED-BED COMBUSTION SYSTEM
DISCLAIMER
This report was prepared as an account of work sponsored by an agency of the United States
Government. Neither the United States Government nor any agency thereof, nor any of their
employees, makes any warranty, express or implied, or assumes any legal liability or
responsibility for the accuracy, completeness, or usefulness of any information, apparatus,
product, or process disclosed, or represents that its use would not infringe privately owned rights.
Reference herein to any specific commercial product, process, or service by trade name,
trademark, manufacturer, or otherwise does not necessarily constitute or imply its endorsement,
recommendation, or favoring by the United States Government or any agency thereof. The views
and opinions of authors expressed herein do not necessarily state or reflect those of the United
States Government or any agency thereof.
ICSET, WKU Aug 1, 2008 2
ESTABLISHMENT OF AN ENVIRONMENTAL CONTROL TECHNOLOGY LABORATORY WITH A CIRCULATING FLUIDIZED-BED COMBUSTION SYSTEM
TABLE OF CONTENTS
DISCLOSURE …………………………………………………………...............2
TABLE OF CONTENTS ………………………………………………………...3
LIST OF FIGURES ………………………………………………………………5
LIST OF TABLES ………………………………………………………….........8
1. Background …………………………………………………………………...9
2. Executive Summary ………………………………………………………….11
3. Design and Manufacture ……………………………………………………..17
3.1 Design of 0.6 MW CFBC System ……………………………………………………..17
5.2 Procedures on Firing of CFBC ………………………………………………………53
5.3 Procedures on Air Pollutants Measurement ………………………………………...55
5.4 PRB-fired in CFBC and Switching to Co-firing with Wood Pallet ………………..62
5.5 Co-firing of PRB Coal and Switch to Co-firing with Chicken ……………..............76
5.6 Operation under Full Scale Firing of CFBC ………………………………………...88
6. Conclusion ……………………………………………………………………98
7. Acknowledgement …………………………………………………………..101
8. Publication …………………………………………………………………..102
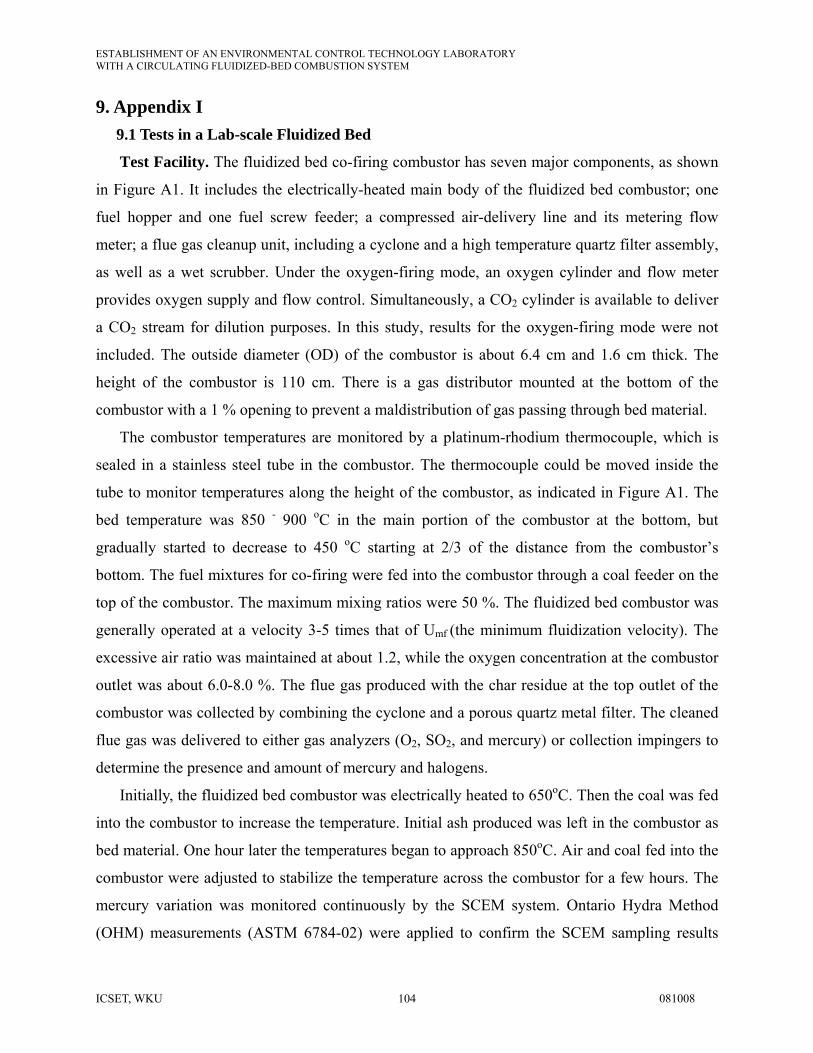
9. Appendix I …………………………………………………………………..104
9.1 Tests in a Lab-scale Fluidized Bed …………………………………………………..104
9.2 Tests in a SCR Slipstream Reactor ………………………………………………….120
9.3 HBr Injection for Hg Emission Control – Development of New Additives on
Effective Mercury Emission Control ……………………………………………...127
9.4 Chemical Looping Combustion ……………………………………………………..148
9.5 Statistics Analysis of CFBC Mercury Emission Rate ……………………………...158
10. References…………………..………………………………………………166
11. Acronyms and Abbreviations ……………………………………………………...170
ESTABLISHMENT OF AN ENVIRONMENTAL CONTROL TECHNOLOGY LABORATORY WITH A CIRCULATING FLUIDIZED-BED COMBUSTION SYSTEM
LIST OF FIGURES
Figure 1. Schematic of 0.6 MW CFBC System …………………………...…………………..23 Figure 2. Schematic of CFBC System with Critical Parts Labeled ………….………………..24 Figure 3. Pictures of Air Delivery and Flue Gas Pass …………………………………………28 Figure 4. Pictures of Loop Seals, Ash Supply, Downcomer and Cyclones ..………………….31 Figure 5-1. Pictures of Cooling System…………………………………………...…………...36 Figure 5-2. Schematic of Cooling System Setup ..…………………………………….............37 Figure 6-1. Feeding Systems of Solid Materials……………………………………………….41 Figure 6-2. Pictures of Fuels and Limestone ………………..………………………………...41 Figure 7-1. Signal Transfer System …………………………………………………………...44 Figure 7-2. Data Collection ……………………………………………………………………45 Figure 8. Particle Size Distribution of Tested Coal ……………………………………………51 Figure 9. Sampling Train for Collection of FPM and CPM ..…………………………………59 Figure 10. Train Configuration on CPM Post-test Nitrogen Purge ………..………………….60 Figure 11. Sampling Train for VOCs and Semi-VOCs ………………………………………..59 Figure 12. Sampling Train for SO3 Measurement ……………………………………………..61 Figure 13-1. Variations of Coal Feeding, Limestone Feeding, WP Feeding and Load during Test
on July 23, 2008 ......……………………………………………………………..67 Figure 13-2. Variations of Supplies of the Primary Air, the Secondary Air and the Loop Seal Air
during Test on July 23, 2008 ………………………………………………….…68 Figure 13-3. Variations of Temperature Profiles over time in CFBC’s Riser during Test on July
23, 2008 …………………………………………………………………..….69 Figure 13-4. Variations of Detailed Temperature Profiles over Time inside CFBC’s Riser during
Test on July 23, 2008 …. ………………………………………………………..70 Figure 13-5. Average Temperature Profiles during the Firing of PRB Coal only and the Co-firing
with WP …………………………………………………………………………71 Figure 13-6. Variations of NO, SO2 and O2 during the Firing of PRB Coal only and the Co-firing
with WP ………………………………………………………………………….72 Figure 13-7. Variations of CO, CO2 and O2 during the Firing of PRB Coal only and the Co-firing
with WP ………………………………………………………………………….73 Figure 14-1. Variations of Coal Feeding, Limestone Feeding, WP Feeding and Load during Tests
on July 30, 2008 ....……………………………………………………………..80 Figure 14-2. Variations of Supplies of the Primary Air, the Secondary Air and the Loop Seal Air
during Test on July 30, 2008 ..…………………………………………………….81 Figure 14-3. Variations of Temperature Profiles over Time in CFBC’s Riser during Test on July
ICSET, WKU Aug 1, 2008 5
ESTABLISHMENT OF AN ENVIRONMENTAL CONTROL TECHNOLOGY LABORATORY WITH A CIRCULATING FLUIDIZED-BED COMBUSTION SYSTEM
30, 2008 ………………………………………………………….………….…..82 Figure 14-4. Average Temperature Profiles during the Firing of PRB Coal only and the Co-firing
with CW …………………………………………………………………………..83 Figure 14-5. Variations of NO, SO2 and O2 during the Firing of PRB Coal only and the Co-firing
with CW …………………………………………………………………………..84 Figure 14-6. Variations of CO, CO2 and O2 during the Firing of PRB Coal only and the Co-firing
with CW …………………………………………………………………………..85 Figure 15-1. Variations of Coal Feeding, Limestone Feeding, WP Feeding and Load during Test
on August 7, 2008…………………………………………………………………92 Figure 15-2. Variations of Supplies of the Primary Air, the Secondary Air and the Loop Seal Air
during Test on August 7, 2008 …….…………………………………………….93 Figure 15-3. Variations of Temperature Profiles over time in CFBC’s Riser during Test on
August 7, 2008 ……………………………………………………………………94 Figure 15-4. Variations of NO, SO2 and O2 at the Full-load Operation and the Load Tuning
Period………………………………………………………………………………95 Figure 15-5. Variations of CO, CO2 and O2 at the Full-load Operation and the Load Tuning
Period………………………………………………. ……………………………..96 Figure A1. The Lab-scale Fluidized Bed Coal Combustor …………………………………….112 Figure A2. The Variation of Mercury Emission during Co-firing of Sub-bituminous Coal and
Biomass ……………………………………………………………………………114 Figure A3. The Mercury Speciation during Co-firing of Sub-bituminous Coal and Biomass…115 Figure A4. The Gas Phase Chlorine Concentration in the Flue Gas during Co-firing in the
Fluidized bed combustor …………………………………………………………...116 Figure A5. The Ratios of (Ca+Mg+Na+K)/Cl in Tested Fuels during Co-firing in the Fluidized
Bed Combustor ……...…………………………………………………………......117 Figure A6. Sulfur Removal Efficiency or (Ca+Mg+Na+K)/S of Mixing Fuels during Co-firing in
the Fluidized Bed Combustor …………………………….…………………..……118 Figure A7. The Correlation of Mercury Emission Rate and Gaseous Cl, the Correlation of
Gaseous Cl and (Ca+Mg+Na+K)/Cl ………………………………………………119 Figure A8. The Schematic of the SCR Slipstream Reactor ……….…………………………...123 Figure A9. The Actual Setup on Site of the SCR Slipstream reactor System ………………....124 Figure A10-1. The NO Reduction Performance of the SCR Slipstream Reactor for Catalyst#1
under Bituminous Coal Flue Gas Atmosphere ………………………………..126 Figure A10-2. The NO Reduction Performance of the SCR Slipstream Reactor for Catalyst#2
ICSET, WKU Aug 1, 2008 6
ESTABLISHMENT OF AN ENVIRONMENTAL CONTROL TECHNOLOGY LABORATORY WITH A CIRCULATING FLUIDIZED-BED COMBUSTION SYSTEM
under Bituminous Coal Flue Gas Atmosphere ………………………………...126 Figure A10-3. NO Reduction by SCR Catalyst#1 and #2 under PRB Coal Flue Gas
Atmosphere …………………………………………………………………….126 Figure A11. The Schematic Configuration of the Slipstream Reactor …………………………139 Figure A12. Effect of HBr Addition on Hg(0) Oxidation …..………………………………….141 Figure A13. Comparison of Effects of Additives on Hg(0) Oxidation in the Empty Bed ……..142 Figure A14. Correlation of HBr Injection Concentrations and Mercury Removal Efficiency in the
Slipstream Reactor ……………………………………………………………….143 Figure A15. Correlation of HBr Injection Concentrations and Mercury Oxidation Efficiency in
the Slipstream Reactor ……………………………………………………….......144 Figure A16. The Mercury Removal Efficiencies by Simultaneous Additions of HBr (at 4ppm)
and Selected Fly Ashes …………………………………………………………..145 Figure A17. The Correlation of Particle-bound Mercury and Fluorine, Chlorine and Bromine
Contents on Fly Ashes …………………………………………………………...146 Figure A18. Comparison of Cross-section BEI Images and EDS Analysis of Alloys (A36, A242,
310, SS316L) before and after Exposure under Testing Atmospheres (LT: 150oC, HT: 350 oC; I: original coupon sample, II: coupon sample after exposure under test environment) ……………………………………………………………………..147
Figure A19-1. Variation of the Thermodynamic Equilibrium Factor for MexOy-CO as a Temperature (calculations based on data from reference) …………156 Function of
Figure A19-2. Variation of the Thermodynamic Equilibrium Factor for MexOy-H2 as a Function of Temperature ……………………………………..……………………………156
Figure A20. Variation of the Thermodynamic Equilibrium Factor for MexOy-C as a Function of Temperature ………………………………………………………………..……157
Figure A21. The Dependence of Mercury Emission Rates on Boiler Types with FF and Coal Ranks………………………………………………………….…………………164
Figure A22. The Factors on Fly Ash Properties ……………………………………………….165
ICSET, WKU Aug 1, 2008 7
ESTABLISHMENT OF AN ENVIRONMENTAL CONTROL TECHNOLOGY LABORATORY WITH A CIRCULATING FLUIDIZED-BED COMBUSTION SYSTEM
ICSET, WKU Aug 1, 2008 8
LIST OF TABLES
Table 1. System Mass Balance Calculation …..…………………………………………………17 Table 2. System Heat Balance ……………..……………………………………………………19 Table 3. Design parameter – Overall Hydrodynamics Calculation ……………..………………20 Table 4. Summary of Design Parameters …...…………………………………………………...21 Table 5. Dimension of CFBC Facility ……...…………………………………………………...22 Table 6-1. Design Calculation on the Primary Cyclone ………...……………………………….32 Table 6-2 . Design Calculation on the Secondary Cyclone ……..……………………………….33 Table 7. Design Calculation on the Loop Seal .………………………………………………….34 Table 8. Coal and Ash Analysis …………..……………………………………………………..52 Table 9-1. Operational Parameters and Emission Rates of Air Pollutants during the Firing of PRB
Coal Only ……………………………………………………………………..……..74 Table 9-2. Operational Parameters and Emission Rates of Air Pollutants during the Co-firing of
with WP ………………………………………………………………...…………...75 Table 10-1. Operational Parameters and Emission Rates of Air Pollutants during the Firing of
PRB Coal only ……………………………………………………………………....86 Table 10-2. Operational Parameters and Emission Rates of Air Pollutants during the Co-firing of
with CW ……………………………………………………………………………..87 Table 11. Operational Parameters and Emission Rates of Air Pollutants during the Co-firing of
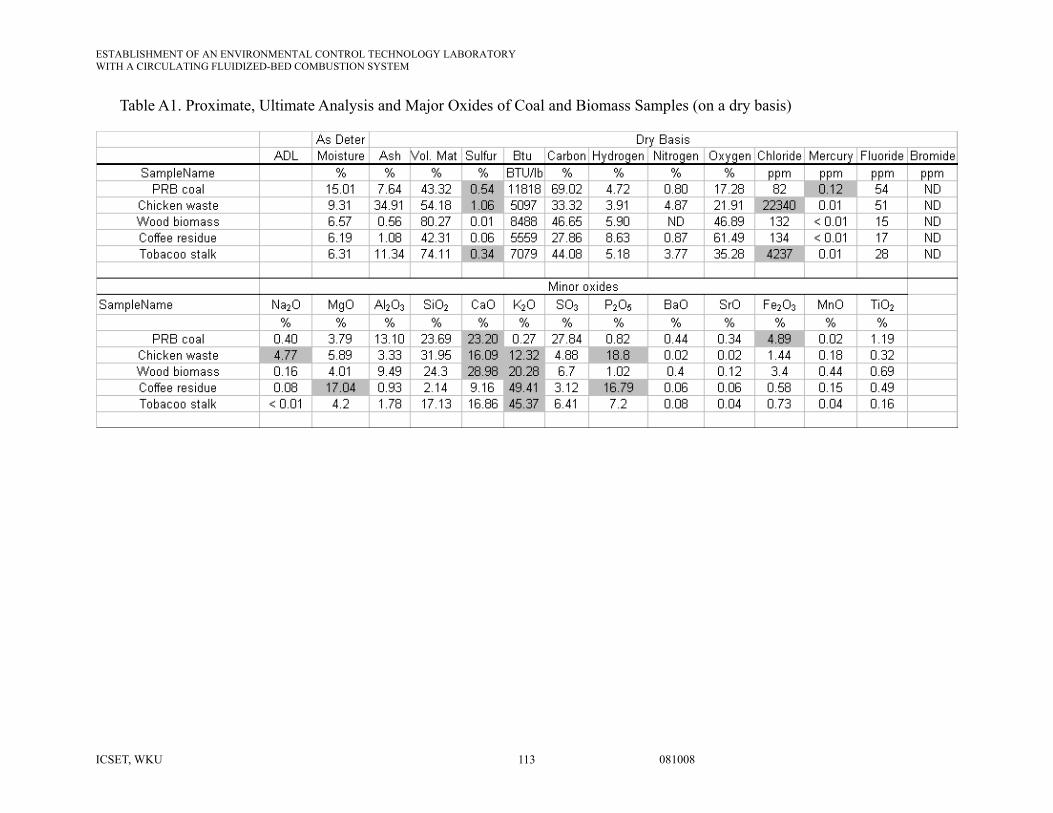
with WP at the Full-load Operation and the Load Tuning Period …………...……...97 Table A1. Proximate, Ultimate Analysis and Major Oxides of Coal and Biomass Samples (on a
dry basis) …...………………………………………………………………………113 Table A2. The Analysis of Coal And Ash Samples During Tests ……………………………...125 Table A3. Characterization of Coals and Collected Ash at the Outlet of Testing Slipstream
Reactor ……………………………………………………………………………..140 Table A4. Physical Properties and Oxygen Transfer Capability of Oxygen Carriers…………..154
Table A5. Enthalpies of Reduction Reaction by Carbon at 1000oC and 1 atm (calculations based on data from reference)………………………………...…………………………155
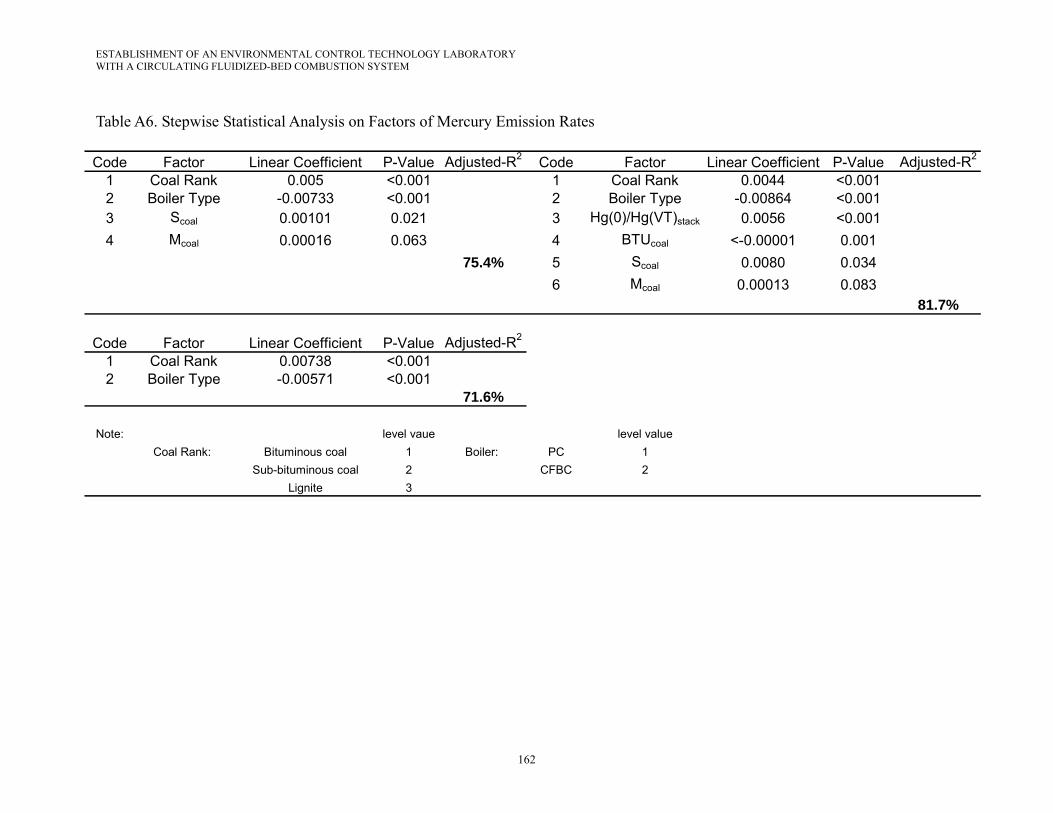
Table A6. Stepwise Statistical Analysis on Factors of Mercury Emission Rates ...……………162 Table A7. Stepwise Statistical Analysis on Factors of Fly Ash Properties …………………….163
ESTABLISHMENT OF AN ENVIRONMENTAL CONTROL TECHNOLOGY LABORATORY WITH A CIRCULATING FLUIDIZED-BED COMBUSTION SYSTEM
1. Background On February 14, 2002, President Bush announced the Clear Skies Initiative, a legislative
proposal to control the emissions of nitrogen oxides (NOx), sulfur dioxide (SO2), and mercury
from power plants. In response to this initiative, the National Energy Technology Laboratory
organized a Combustion Technology University Alliance and hosted a Solid Fuel Combustion
Technology Alliance Workshop. The workshop identified multi-pollutant control; improved
sorbents and catalysts; mercury monitoring and capture; and improved understanding of the
underlying reaction chemistry occurring during combustion as the most pressing research needs
related to controlling environmental emissions from fossil-fueled power plants. The
Environmental Control Technology Laboratory will help meet these challenges and offer
solutions for problems associated with emissions from fossil-fueled power plants.
The goal of this project was to develop the capability and technology database needed to
support municipal, regional, and national electric power generating facilities to improve the
efficiency of operation and solve operational and environmental problems. In order to effectively
provide the scientific data and the methodologies required to address these issues, the project
included the following aspects:
• Establishing an Environmental Control Technology Laboratory using a laboratory-scale,
simulated fluidized-bed combustion (FBC) system;
• Designing, constructing, and operating a bench-scale (0.6 MWth), circulating fluidized-bed
combustion (CFBC) system as the main component of the Environmental Control Technology
Laboratory;
• Developing a combustion technology for co-firing municipal solid waste (MSW), agricultural
waste, and refuse-derived fuel (RDF) with high sulfur coals;
• Developing a control strategy for gaseous emissions, including NOx, SO2, organic
compounds, and heavy metals; and
• Developing new mercury capturing sorbents and new particulate filtration technologies.
Major tasks during this period of the funded project’s timeframe included:
• Conducting pretests on a laboratory-scale simulated FBC system;
• Completing detailed design of the bench-scale CFBC system;
• Contracting potential bidders to fabricate of the component parts of CFBC system;
ICSET, WKU 081008 9
ESTABLISHMENT OF AN ENVIRONMENTAL CONTROL TECHNOLOGY LABORATORY WITH A CIRCULATING FLUIDIZED-BED COMBUSTION SYSTEM
• Assembling CFBC parts and integrating system;
• Resolving problems identified during pretests;
• Testing with available Powder River Basin (PRB) coal and co-firing of PRB coal with first
wood pallet and then chicken wastes.
• Tuning of CFBC load
Following construction system and start-up of this 0.6 MW CFBC system, a variety of
combustion tests using a wide range of fuels (high-sulfur coals, low-rank coals, MSW,
agricultural waste, and RDF) under varying conditions were performed to analyze and monitor
air pollutant emissions. Data for atmospheric pollutants and the methodologies required to
reduce pollutant emissions were provided. Integration with a selective catalytic reduction (SCR)
slipstream unit did mimic the effect of flue gas composition, including trace metals, on the
performance of the SCR catalyst to be investigated. In addition, the following activities were also
conducted:
• Developed advanced mercury oxidant and adsorption additives; and
• Performed laboratory-scale tests on oxygen-fuel combustion and chemical looping
combustion;
• Conducted statistical analysis of mercury emissions in a full-scale CFBC system.
Future work on this CFBC system will include modification of the bench-scale CFBC
system to allow advanced combustion technologies such as “chemical looping” and
“oxygen-enhanced” combustion to be investigated.
• Chemical looping is a process by which the combustion of a hydrocarbon occurs in two
stages. In the first stage, air is used to oxidize a “metal carrier” to a “metal oxide carrier.” In
the second stage, the “metal oxide carrier” is used to oxidize a fuel as it is reduced to its
original “metal carrier” form.
• “Oxygen-enhanced” combustion occurs in a gas mixture of oxygen and recycled carbon
dioxide. The carbon dioxide functions as a heat sink for combustion, much like the nitrogen
in air, but produces a flue gas that is composed of carbon dioxide and water vapor. Removal
of the water vapor results in a sequestration-ready, concentrated carbon dioxide stream.
ICSET, WKU 081008 10
ESTABLISHMENT OF AN ENVIRONMENTAL CONTROL TECHNOLOGY LABORATORY WITH A CIRCULATING FLUIDIZED-BED COMBUSTION SYSTEM
2. Executive Summary All documents for managing this project, including Quarterly Technical Progress Reports,
Project Milestones, a Hazardous Substance Plan and Hazardous Waste Report, have been
prepared and submitted to the U. S. Department of Energy’s (DOE’s) National Energy
Technology Laboratory (NETL).
The renovation of a new space for a 0.6 MWth Circulating Fluidized-Bed Combustion (CFBC)
system and new Combustion Laboratory was completed. The final specifications for the
renovation of the new Combustion Laboratory and the construction of the Circulating Fluidized
Bed (CFB) Combustor Building are compatible with the design of the CFBC system. Half of the
space located under the new Combustion Laboratory has also been allocated to the setup of the
laboratory-scale reactor, which has provided relevant data to help with running the CFBC
system.
Prior to the construction of the 0.6 MWth CFBC facility, the design calculations, including
the mass balances, energy balances, heat transfer, facility strength, and construction dimensions
were intensively discussed. Considerable modifications have been made on the draft design of
the CFBC system based on discussions conducted during the project kick-off meeting held on
January 13, 2004 at the NETL. Comments received from various experts were also used to
improve the design. Finally, the drawings of all assembly parts were completed in order to
develop specifications for the fabrication of individual parts. A detailed design of supporting and
hanging structures for the CFBC was completed in early 2005. The fabrication and
manufacturing contract for the CFBC system was awarded to Sterling Boiler & Mechanical, Inc.
of Evansville, Indiana. Sterling manufactured and assembled all component parts of the CFBC
system. Discussions with a potential contactor regarding the availability of materials and current
machining capabilities was resulted in the first modification of the original designs. At this same
time, the CFBC coolant production and feed-water supply system have been strengthened with
the addition of a boost pump to assure that coolant can be admitted to the cooling system under
all operating conditions. Except for the main body of the CFBC facility, the induced draft fan,
along with its machine base and power supply, was received and installed. The flue gas duct
from the secondary cyclone outlet to the induced draft fan inlet was received and installed, as
well as the induced fan flue gas discharge duct. Additionally, a dust control system has been
installed, which could help maintain a cleaner and safer work environment around the fuel and
ICSET, WKU 081008 11
ESTABLISHMENT OF AN ENVIRONMENTAL CONTROL TECHNOLOGY LABORATORY WITH A CIRCULATING FLUIDIZED-BED COMBUSTION SYSTEM
limestone bunkers during filling operations. Further, all materials for the high temperature
insulation of the riser, both cyclones and the downcomer were installed.
Substantial effort was made on the development and application of software for the effective
operation and safe control of the CFB system, as well as for the display and logging of acquired
data and operating parameters. Electric power distribution for pumps, blowers, variable speed
drives, valves and the bed preheater was completed. Installation of CFBC system temperature,
pressure, coolant and air flow sensors, as well as load cells, were completed, along with actuator
installation and wiring. Calibration, display and logging of pressure and air flow sensor data
were also performed.
Powder River Basin (PRB) coal was used for performance evaluation of the CFBC system.
Slag from an operating Integrated Gasification Combined Cycle (IGCC) facility and fly ash from
a full-scale CFBC utility boilers were used as recirculation fly ash during initiation of CFBC
“hot-modeling” tests. For co-firing tests, biomass (wood pallet and chicken waste) was prepared.
Additional thermal expansion joints were installed, first between the ash supply duct to the
lower loop seal; and second between the lower loop seal to the riser. The purpose of adding up
additional thermal expansion joints is to provide stable support for the riser and downcomer, as
well as safely accommodating the dramatic change that occurs under high temperature operation.
The third modification of the CFBC system began after the initial firing CFBC system in early
2008. Major modifications included an additional heat exchanger and additional sensor ports as
well as sampling ports. During an earlier CFBC system test, high temperatures were detected in
the vicinity of the riser flange joint when the system load was increased. Some riser insulation
components were damaged. The initial design review also indicated that this area of the riser
would likely benefit from additional heat exchange surface below this area.
Three full evaluation tests were conducted on July 23, July 30 and August 7, 2008 under
different loads and different fuel mixtures. A day prior to the initial firing of CFBC system, an
overnight firing was conducted to gradually increase the temperature of the whole system to
normal operational conditions. On July 23, the first full evaluation of the 0.6 MWth CFBC
system was conducted by firing PRB coal in the morning and co-firing of PRB coal and wood
pallets (WP) in the afternoon. On July 30, the second full evaluation of the 0.6 MWth CFBC
system was conducted starting with firing PRB coal at feed rates higher than the test conducted
on July 23. In the afternoon, the system was switched to co-fire PRB coal with chicken waste
ICSET, WKU 081008 12
ESTABLISHMENT OF AN ENVIRONMENTAL CONTROL TECHNOLOGY LABORATORY WITH A CIRCULATING FLUIDIZED-BED COMBUSTION SYSTEM
(CW). An evaluation of the system at its full-load and its tuning were conducted on August 7.
The purpose of this test was to investigate whether different parts of the whole CFBC system
could properly function under full-load or over full-load, during the tuning period. Special focus
was on evaluations of the optimal particle size of feeding fuels, the compatibility of feeding
materials including fuels and air, the maximum Heat Exchanger (HX) capability and ash
recirculation capability by the loop seal. During this period of testing, the co-firing of PRB coal
and wood pallet (WP) was co-fired.
Evaluation of tests on CFBC system performance indicated load tuning, fuel switching and
heat transfer by available heat exchangers were successful. When feeding coal and the delivering
different air streams, the CFBC system performed constant and smooth. The heat expansion joint
worked perfectly to absorb system expansion under high temperatures of the CFBC system.
Better setup of the control system, signal collection and transfer system made CFBC operation
more automated. The current CFBC system could work properly under a low ash re-circulation
rate with the assistance of two cyclones and two loop seals. Loss-of-ignition (LOI) in fly ash at
the flue gas exit of the facility, which were about 18 %, seemed acceptable under the current
initial full-load operation. However, a future modification of the air delivery system into a low
loop seal has been planned, because the loss of ash re-circulation was found during full-load
operation on the last day. Final troubleshooting of the loop seal showed that there was not
enough pressure on the loop seal. Air caused the failure of ash re-circulation. Additional tests
outside the scope of this project will be performed.
Major air pollutants were measured during three full evaluation tests. These included sulfur
Wind box1st segment of riser2nd segment of riserReducer3rd segment of riser4th segment of riser5th segment of riser6th segment of riser7th segment of riser8th segment of riser
9th segment of riser10th segment of riser11th segment of riser
Expansion joint
Loop seal
1st segment of downcomer2nd segment of downcomer
Expansion joint
3rd segment of downcomer4th segment of downcomer5th segment of downcomer6th segment of downcomer
8th segment of downcomer
9th segment of downcomerExpansion joint
Primary cyclone3031
Secondary cyclone
Loop seal of secondary cyclone
Solid flowmeter
32Connection pipe between primary and secondary cyclone
353433
383736
3940
434241
4544
Expansion joint2nd segment of coal feeding pipe3rd segment of coal feeding pipe1st segment of solid feeding pipe2nd segment of solid feeding pipe3rd segment of solid feeding pipeFlexible air ductElectric air preheaterSolid flow monitor 2Coal bunker system Waste material bunker system Limestone bunker system Inert bed material bunker system
Solid flow monitor 1
Thermal Expansion Joint
Primary Cyclone
Secondary Cyclone
E
Middle SectionSitting
Thermal ExpansionJoint
2nd AirNozzles
2nd Air Nozzles
2nd AirNozzles
PeepingWindow
Discharge Tube
Flexible Duct
Electric Air Heater
F
2nd Air Nozzles
1
2
3
4
5
6
7
8
9
10
11
12
13
14
15
16
18
17
19
20
21
22
23
16
24
25
16
26
27
28
2930
31
35
33
34
36
37
38
39 40
42
4344
45
46
33
34
41
32
ESTABLISHMENT OF AN ENVIRONMENTAL CONTROL TECHNOLOGY LABORATORY WITH A CIRCULATING FLUIDIZED-BED COMBUSTION SYSTEM
Figure 2. Schematic of CFBC System with Critical Parts Labeled
ICSET, WKU 081008 24
ESTABLISHMENT OF AN ENVIRONMENTAL CONTROL TECHNOLOGY LABORATORY WITH A CIRCULATING FLUIDIZED-BED COMBUSTION SYSTEM
3.2 CFBC System Tower
A. Structure’s General Description. The CFBC system is primarily housed in an 87-foot tall
insulated, steel framed, steel-sided building comprised of seven steel grate floors, a concrete
ground floor and a small mezzanine. The Tower is equipped with a fire suppression sprinkler
system and with emergency lighting. An internal stairway is provided at the south side of the
tower from ground level to the eighth floor with ladder access to the mezzanine. Two
double-wide personnel doors lead outside from the tower and one personnel door leads to the
remainder of the Combustion Laboratory and to the CFBC System Control Room.
B. Utilities. The Tower is provided with extensive electric power distribution equipment,
including 120/240 volt single phase and 208 volt and 480 volt three phase services. Many of the
circuits are backed-up, in case of a utility power interruption, with an 80 KW natural gas
powered generator set. Each level of the Tower is well lighted with a minimum of eight 90 watt
HID lighting fixtures. The Tower has municipal water supply, as well as waste water drains,
furnished through the sixth floor. Natural gas service is available on the ground floor. Dehydrated
and well-filtered compressed air, produced in an adjacent mechanical room of the Combustion
Laboratory, is distributed to a minimum of four outlets on each level of the tower. Wireless
internet is also provided throughout the tower, as well as, throughout the entire Combustion
Laboratory.
C. Heating and Ventilation. No air conditioning is provided in the Tower. To prevent
winter freezing of water-containing systems, adequate heat is provided by fan coil unit
ventilators at the ground floor level. Ventilation is accomplished with four thermostatically
controlled exhaust fans, each rated at 30,000 cubic feet per minute, located near the apex of the
building and six motorized louvers to the outside at the second floor level.
D. Materials Movement Crane. Presently, a guard rail enclosed lift-way opening of about
six feet by eight feet is located on each floor for transporting bulk quantities of fuel, bed material
and ash, as well as, components required for additional CFBC construction and maintenance. A
1½ ton bridge crane, used extensively for initial combustor assembly when a 20-foot square
central opening was available, is now used to transport a cargo basket or individual components
from one level to another in the Tower.
E. Dust Control. A 7½-HP dust collector system is located on the fifth floor of the tower
adjacent to the fuel and bed material bunker tops. This arrangement greatly reduces the escape
ICSET, WKU 081008 25
ESTABLISHMENT OF AN ENVIRONMENTAL CONTROL TECHNOLOGY LABORATORY WITH A CIRCULATING FLUIDIZED-BED COMBUSTION SYSTEM
of dust when replenishing these supply bunkers, making for a safer and cleaner work
environment.
3.3 Air Supply
3.3.1 Primary Air
A. Regenerative Blowers. Two 21-HP regenerative turbine blowers provide primary
combustion air to the combustor through a six-inch supply duct from an adjacent mechanical
room. Each of these blowers can furnish up to 154 inches of water column pressure and
together will, as presently configured, provide up to 48 pounds per minute of primary
combustion air to the CFBC system.
B. Bed Preheater. Prior to the primary combustion air being admitted to the windbox, a six
inch pneumatically-operated butterfly valve is used to route the combustion air exclusively
through a 36-KW electric air heater capable of increasing the temperature of the flowing air up to
1,500 ºF. The air heater is locally controlled as to temperature and incorporates redundant
safety controls to reduce the risk of equipment damage or fire in case of insufficient air flow.
The high temperature air flow is able to heat the lower riser segments and an initial charge of bed
material (typically 175 pounds of crushed limestone) to the kindling point for coal in about four
hours or less.
C. Windbox. The windbox, as shown in Figure 3, serves as an air plenum at the
bottom-most segment of the CFBC system. It receives primary combustion air either directly
from the forced draft fan and supply duct during normal operation or by way of the bed preheater
during start-up. The windbox is insulated to the same extent as the riser in order to maintain the
temperature during preheating operations.
E. Bubble Plate. The one-inch thick bubble plate serves to separate the primary combustion
air supply from the bed area where the initial fuel combustion occurs. Also known as a
distributor plate, the bubble plate provides the mounting for 30 bubble caps, arranged in three
concentric circles. The design of these bubble caps, along with their placement and the ‘bowl’
shaped area below them, help distribute the combustion and fluidizing air in such a manner as to
uniformly fluidize the bed material.
3.3.2 Secondary Air
ICSET, WKU 081008 26
ESTABLISHMENT OF AN ENVIRONMENTAL CONTROL TECHNOLOGY LABORATORY WITH A CIRCULATING FLUIDIZED-BED COMBUSTION SYSTEM
A. Regenerative Blower. A 15-HP regenerative turbine blower located on the fifth floor of
the tower provides all secondary combustion air supplies for the combustor. This blower is
capable of furnishing up to 195 inches of water-column pressure to the secondary air distribution
system with a total flow capacity of 15 pounds of air per minute. Operation of this blower is
controlled by the process control computer.
B. Secondary Combustion Air Distribution. Secondary combustion air produced by the
regenerative blower is supplied to a manifold that distributes pressurized air to as many as four
levels of the combustor for controlled injection at these levels, as shown in Figure 3.
C. Proportional Air Control Valves. Secondary Combustion Air may be delivered to a set of
three ports and nozzles arranged to establish a control clockwise rotation of the ascending flue
gases at up to four levels of the riser, namely R3, R6, R8 and R10, as indicated in Figure 2.
Provided that a minimum pressure is maintained by the secondary air blower, solenoid valves are
opened at one, two, three or four levels and the proportional valve for that level opens as
required to allow the selected quantity of air flow and to be injected. Secondary air flow
quantities are selected at the user interface and the proportional valves are closed-loop controlled
to maintain the selected rate.
D. Ash Back-flow Prevention. Unwanted ash back-flow into valves, supply ducts and
blowers are of significant concern in that ash back-flow can cause these components to
malfunction. Therefore, if secondary air is supplied to any level(s) of the riser, protective
solenoid valves will only open when the secondary air blower provides sufficient pressure to
insure ash cannot back-flow into unwanted areas. This serves to protect both the solenoid
valves and proportional valves in the secondary air supply system.
E. Solenoid Valves Excess Temperature Protection. Brought about by the need to protect
components of the secondary air supply system from ash back-flow, solenoid valves have been
installed at each of the three ports at each of the four levels used for secondary air injection. As
these valves are close to the riser and subject to excess temperatures, they are periodically pulsed
with a small amount of cooling air to insure their continued function and reliability.
3.3.3 Induced Draft Fan and Flue Gas Path
A. Flue Gas Duct. Ten-inch schedule 10 stainless steel pipe and fittings are used to
connect the secondary cyclone discharge on the eighth floor to the induced draft fan on the
seventh floor of the Tower, as shown in Figure 3.
ICSET, WKU 081008 27
ESTABLISHMENT OF AN ENVIRONMENTAL CONTROL TECHNOLOGY LABORATORY WITH A CIRCULATING FLUIDIZED-BED COMBUSTION SYSTEM
B. Induced Draft Fan. Located on the seventh floor of the Tower is induced draft fan. This
fan is equipped with a 20-HP motor and variable speed drive that operates under programmed
control. This fan is capable of producing more than 20 inches of water column differential
pressure at operating temperatures and inlet pressure conditions. Components of the fan in
contact with the flue gas stream are constructed of 304 stainless steel and rated for operation at
temperature up to 700ºF. A tempering stream of ambient air may be admitted by operating a
motorized valve near the fan intake if flue gas temperature should become excessive. Control of
this valve is accomplished at the user interface. Ordinarily, the induced draft fan is operated to
maintain minus 0.5 inches water column static pressure in the top-most riser segment.
C. Discharge Flue Gas Camera. Aimed at the flue gas discharge duct as it exits the Tower
wall on the seventh floor is a video camera that displays on a monitor in the CFBC system
control room an image of flue gas and any particulate emissions. The images of these emissions
provides additional information about CFBC system operation, particularly during start-up
periods until on-line flue gas analysis is available.
Figure 3. Pictures of Air Delivery and Flue Gas Pass
ICSET, WKU 081008 28
ESTABLISHMENT OF AN ENVIRONMENTAL CONTROL TECHNOLOGY LABORATORY WITH A CIRCULATING FLUIDIZED-BED COMBUSTION SYSTEM
3.4 Riser, Ash Recovery Cyclones, Downcomer and Loop Seals
The design parameters on cyclones and loop seal were listed in Tables 6-1, 6-2, and Table 7.
Figure 4 are pictures of their on-site setup.
A. Construction Materials. All structural portions of the CFBC system that come into
contact with heated bed material, ash and flue gases are fabricated from welded seam, 310
stainless steel, schedule 40 pipe. Class 150 weld flanges are used to join most segments of the
riser, downcomer and cyclones. Class 300 weld flanges are used at points of support for the riser.
High temperature Grafoil® gaskets are used at each of these flanges to insure gas tight
connections.
B. Support Point. As 310 stainless steel alloy has a large thermal expansion coefficient,
special design considerations were employed to avoid structural support problems. The Tower
building structural framing supports the riser at only two points. Riser segments R1, R2, R3
and R4 (as indicated in Figure 2), as well as, the transition segment (12” to 16”) and the windbox
segment are suspended from the forth floor. As these segments are heated to the operating
temperature, the bottom-most windbox approaches the ground floor level by approximately four
inches. Additionally, the fourth floor frame also supports riser segments R5, R6, R7 and R8 (as
indicated in Figure 2), which expand upward as they approach the operating temperature. Riser
segments R9, R10 and R11 (as indicated in Figure 2), supported at the eighth floor of the tower,
expand downward with increased temperature.
C. Thermal Expansion Joints. This latter thermal expansion of riser segments supported
between the fourth and eighth floor is accommodated by a thermal expansion joint located
between riser segment R8 and R9 (as indicated in Figure 2). This joint is constructed with an
interior telescoping construction designed to maintain alignment of the column of risers. This
joint is fitted with programmed purge air to reduce ash accumulation, which otherwise would
interfere with its required freedom of movement. Additionally, there are a total of nine
conventional expansion joints located throughout the downcomer segments, fuel supply ducts
and the primary combustion air duct, in order to accommodate the temperature induced
displacements of these components.
D. Loop Seals. The CFBC system employs two loop seals. The upper loop seal is located
below the secondary cyclone and is provided to reduce the possibility of unwanted circulation of
ash between the primary and secondary cyclone discharges. Only a smaller quantity of ash
ICSET, WKU 081008 29
ESTABLISHMENT OF AN ENVIRONMENTAL CONTROL TECHNOLOGY LABORATORY WITH A CIRCULATING FLUIDIZED-BED COMBUSTION SYSTEM
accumulates below the secondary cyclone. The lower loop seal receives ash from both primary
and secondary cyclones through the downcomer and controls overall recirculation of this ash
back to the R1 riser segment (as indicated in Figure 2). Each loop seal has control air provided
by individually regenerative blowers by computer.
E. Viewing Ports. There are five inclined viewing ports on the riser segments. These ports
are equipped with round quartz windows and preheated purge air supplies. The lowest most
riser port has proven effective for observing the action on the bed surface and of the combustion
process. A video recording can be made from this view. Distributed along the downcomer is a
total of six rectangular quartz windows beginning approximately 24-feet above and extending to
within 5 feet of the lower loop seal. Purge air is applied to these windows as well. These
windows have provided important information on ash flow and ash height in the downcomer
segments. Additionally, there is a rectangular quartz window in the ash supply duct to monitor
the ash level used to precharge the lower loop seal. Finally, there is a rectangular quartz window
in the fuel supply duct and two pairs of round quartz windows below each rotary air-lock valve
for a fuel flow subsystem.
F. Insulation. The complete riser segments, both cyclones, both loop seals and the entire
downcomer segments are encased with a combination of high temperature, high performance
insulation components. Except in areas where heat exchanger jackets are present, the exterior
surfaces listed above may reach temperatures in excess of 1,800ºF. Therefore, careful inspections
and material selection of insulation components were needed. An important goal of the insulation
system installation was to not only limit the unwanted loss of heat from all areas of the process
operation, but also to limit the potential exposure of personnel to nuisance or hazardous materials
and to dangerously high temperatures during normal combustor operations.
G. Ash/Combustion Gas Sampling Ports. There are ten, 3-inch ports along the riser and flue
gas duct on the path to the induced draft fan intake that can accommodate sample probes. These
sample probe are capable of collecting ash and gas samples from the combustion process. Each
of these sample ports has a nearby temperature and pressure sensor for data acquisition. Also,
cooling water supply and returns are provided near each sampling port location for those
occasions when probe cooling is required. Additionally, a port on the upper most riser segment,
R11 (as indicated in Figure 2), has been installed to provide a filtered and dehydrated gas sample
to an IMR 5000 flue gas analyzer. This analyzer has been interfaced with the data acquisition and
ICSET, WKU 081008 30
ESTABLISHMENT OF AN ENVIRONMENTAL CONTROL TECHNOLOGY LABORATORY WITH A CIRCULATING FLUIDIZED-BED COMBUSTION SYSTEM
process control computer, providing an on-line display of carbon monoxide and oxygen
concentration at the user interface. Ash samples may also be taken from each loop seal and
from the bottom of the bed area during regular operation.
Figure 4. Pictures of Loop Seals, Ash Supply, Downcomer and Cyclones
ICSET, WKU 081008 31
ESTABLISHMENT OF AN ENVIRONMENTAL CONTROL TECHNOLOGY LABORATORY WITH A CIRCULATING FLUIDIZED-BED COMBUSTION SYSTEM
Table 6-1. Design Calculation on the Primary Cyclone
ICSET, WKU 081008 32
ESTABLISHMENT OF AN ENVIRONMENTAL CONTROL TECHNOLOGY LABORATORY WITH A CIRCULATING FLUIDIZED-BED COMBUSTION SYSTEM
Table 6-2 . Design Calculation on the Secondary Cyclone
ICSET, WKU 081008 33
ESTABLISHMENT OF AN ENVIRONMENTAL CONTROL TECHNOLOGY LABORATORY WITH A CIRCULATING FLUIDIZED-BED COMBUSTION SYSTEM
Table 7. Design Calculation on the Loop Seal
3.5 Process Cooling, Heat Rejection and Water Treatment
System cooling is shown in Figure 5-1 and Figure 5-2.
A. Cooling Jacket Heat Exchangers. The riser segments of the CFBC system and both
cyclones are constructed with a total of 15 heat exchangers of a cooling jacket or band type
design. Riser segments R1, R4, R5, R7, R9, R10 and R11 (as indicated in Figure 2) are
provided with a single heat exchanger. Riser segment R3 and the 12-inch by 16-inch transition
joint segments were not initially equipped with heat exchanger, a new heat exchanger was
installed after preliminary tests demonstrated a need for these additions. R2 is equipped with two
heat exchangers; the primary cyclone has three heat exchangers and the secondary cyclone has
one heat exchanger. All heat exchangers are 12 inches in height and vary in circumference
according to the segment to which they are welded. Each heat exchanger is supplied with coolant
through a solenoid valve and discharges through either a proportional valve for control of regular
coolant recirculation or through a steam-rated solenoid valve used when a heat exchanger is
taken off-line. At maximum design flow, each of these heat exchangers can capture up to
ICSET, WKU 081008 34
ESTABLISHMENT OF AN ENVIRONMENTAL CONTROL TECHNOLOGY LABORATORY WITH A CIRCULATING FLUIDIZED-BED COMBUSTION SYSTEM
360,000 Btu per hour. Each coolant solenoid and proportional valve is controlled at the user
interface.
B. Internal Loop Coolant Pumps. Coolant is pumped through the CFBC system heat
exchangers described above by a 10-HP pump. This pump is capable of circulating more than
100 gallons per minute through the internal coolant loop. Upon discharge from each heat
exchanger, coolant passes through a 240-gallon separator tank located on the mezzanine above
the eighth floor of the Tower to insure that steam and dissolved gases are separated from the
return flow. The internal loop pump is located on the ground floor of the Tower and is preceded
by a 120-gallon still well tank. An identical back-up pump is arranged in parallel with the
primary pump and a 2-HP single phase circulator pump, is also arranged in parallel with the
other pumps, The back-up pump is to reduce the likelihood of serious damage to the combustor
in case of pump failure. The status of all the pumps is available and is controlled at the user
interface.
C. Coolant-to-Coolant Heat Exchanger. Part of the internal coolant loop is a
liquid-to-liquid heat exchanger, which couples heat recovered from the combustor to an external
cooling system.
D. External Loop Heat Rejection System. A heat rejection system consisting of a
liquid-to-liquid heat exchanger, outdoor fan coils, expansion tank, circulator pump and controls
is used to reject the heat load from the CFBC system operation. The coolant employed by this
external heat rejection system is a propylene-glycol and water mixture. This heat rejection
system is capable of rejecting more than 2 million Btu per hour.
E. Water Treatment System. Due to the design of the CFBC system band type heat
exchangers, when a heat exchanger is taken off-line, for example to minimize heat removal from
the on-going combustion or start-up process, the residual coolant must be vaporized for removal.
To prevent accumulation of mineral deposits in these heat exchangers, a water-treatment system
is provided. Municipal water supply is piped to the sixth floor of the tower where the water
treatment system has been installed. The water transfer system consists of a municipal water
pressure boost pump, pressurized storage tank, filtration and water softening equipment and
controls.
F. Make-up Coolant System. De-mineralized water produced by the water treatment system
is stored under pressure and is automatically added to the return coolant loop to maintain a
ICSET, WKU 081008 35
ESTABLISHMENT OF AN ENVIRONMENTAL CONTROL TECHNOLOGY LABORATORY WITH A CIRCULATING FLUIDIZED-BED COMBUSTION SYSTEM
specified level in the coolant separator tank. The majority of make-up coolant is required to
replace that which is lost when CFBC system heat exchangers are put on-line or taken off-line.
The make-up coolant system is capable of furnishing a sustained 12 gallons per minute.
Figure 5-1. Pictures of Cooling System
ICSET, WKU 081008 36
ESTABLISHMENT OF AN ENVIRONMENTAL CONTROL TECHNOLOGY LABORATORY WITH A CIRCULATING FLUIDIZED-BED COMBUSTION SYSTEM
Figure 5-2. Schematic of Cooling System Setup
ICSET, WKU 081008 37
ESTABLISHMENT OF AN ENVIRONMENTAL CONTROL TECHNOLOGY LABORATORY WITH A CIRCULATING FLUIDIZED-BED COMBUSTION SYSTEM
3.6 Solid Materials Delivery
3.6.1 Fuel Blending and Delivery
Delivery systems of solid materials are shown in Figure 6-1. Delivery materials are shown
in Figure 6-2.
A. Gravimetric Fuel Bunkers. There are two fuel bunkers, made of 304 stainless steel, that
are equipped with load cells. The larger bunker can hold approximately 600-pound of RDF
(wood pellets) and the smaller bunker can hold approximately 550-pound of coal. Both bunkers
are replenished at the fifth-floor level from 55-gallon drums and both are equipped with a slide
gate at the bottom outlet to facilitate servicing and change-overs.
B. Fuel Blending Augers. Each fuel bunker discharges through a bellows connection to the
respective variable speed auger. Each auger is driven by a stepper gear motor that allows on-line
fuel blend ratios change as experimental design and combustion results require. The coal feed
auger can transport more than 150-pound of coal per hour. The RDF feed auger can transport
more than 100-pound of RDF per hour as wood pellets. The speed of each stepper motor is
controlled at the user interface and is used to set the firing rate for the CFBC system. The
individual fuel bunker augers discharge into a blend receiver.
C. Transport Auger. The blend receiver discharges fuel into the transport auger which
serves to further mix and transport supply materials where they will drop into a rotary air-lock
valve in the supply duct. The transport auger rotational speed is controlled at the user interface
and is set to not impede the flow of combined supply material.
D. Rotary Air-Lock Valves. Two rotary air-lock valves are used in series to provide better
pressure isolation and back-flow reduction that insure high-temperature gases are unable to
escape upstream into the fuel supply area. The rotational speed of the rotary air-lock valves’ is
controlled at the user interface and is likewise, set to not impede the flow of supply materials.
3.6.2 Bed Material/Sorbent Delivery
A. Gravimetric Bunker. Similar to the fuel supply bunkers, the bed material bunker is
constructed from 304 stainless steel and is fitted with load cells. This bunker can hold as much as
700 pounds of finely crushed limestone and is also replenished at the fifth floor level from 55-
gallon drums. This bunker is also provided with a bottom mounted slide gate to facilitate
servicing and discharging the contents of the bunker
ICSET, WKU 081008 38
ESTABLISHMENT OF AN ENVIRONMENTAL CONTROL TECHNOLOGY LABORATORY WITH A CIRCULATING FLUIDIZED-BED COMBUSTION SYSTEM
B. Supply Auger. The bed material bunker discharges through a bellows connection to its
own variable speed supply auger. This auger is also driven by a stepper gear motor, controlled
from the user interface to allow for on-line proportioning of limestone or other sorbent materials
as the experimental design and combustion results require. The bed material auger can transport
more than 20 pounds of bed material per hour as limestone. This auger discharges, along with the
fuel supply auger(s), into the blend receiver.
3.6.3 Pre-Operation Ash Delivery
A. Storage Bunker. This bunker is provided for pre-operation ash delivery. Approximately
450 pounds of ash can be held in this bunker which is used for pre-charging the lower loop seal
prior to a CFBC system tests. This bunker is not provided with load cells as the ash flow rate is
generally unimportant and accomplished in advance of a combustion run. A slide valve is located
at the bottom of this bunker to facilitate auger servicing.
B. Supply Auger. This auger is used for transporting ash from the ash storage bunker into a
separate ash duct and into the lower loop seal. The auger is capable of moving up to 150 pounds
of ash per hour.
C. Ash Duct to Lower Loop Seal. A dedicated three-inch supply duct receives ash from the
ash supply auger and delivers it to the downcomer side of the lower loop seal.
ICSET, WKU 081008 39
ESTABLISHMENT OF AN ENVIRONMENTAL CONTROL TECHNOLOGY LABORATORY WITH A CIRCULATING FLUIDIZED-BED COMBUSTION SYSTEM
Figure 6-1. Feeding Systems of Solid Materials Figure 6-2. Pictures of Fuels and Limestone
ICSET, WKU 081008 40
ESTABLISHMENT OF AN ENVIRONMENTAL CONTROL TECHNOLOGY LABORATORY WITH A CIRCULATING FLUIDIZED-BED COMBUSTION SYSTEM
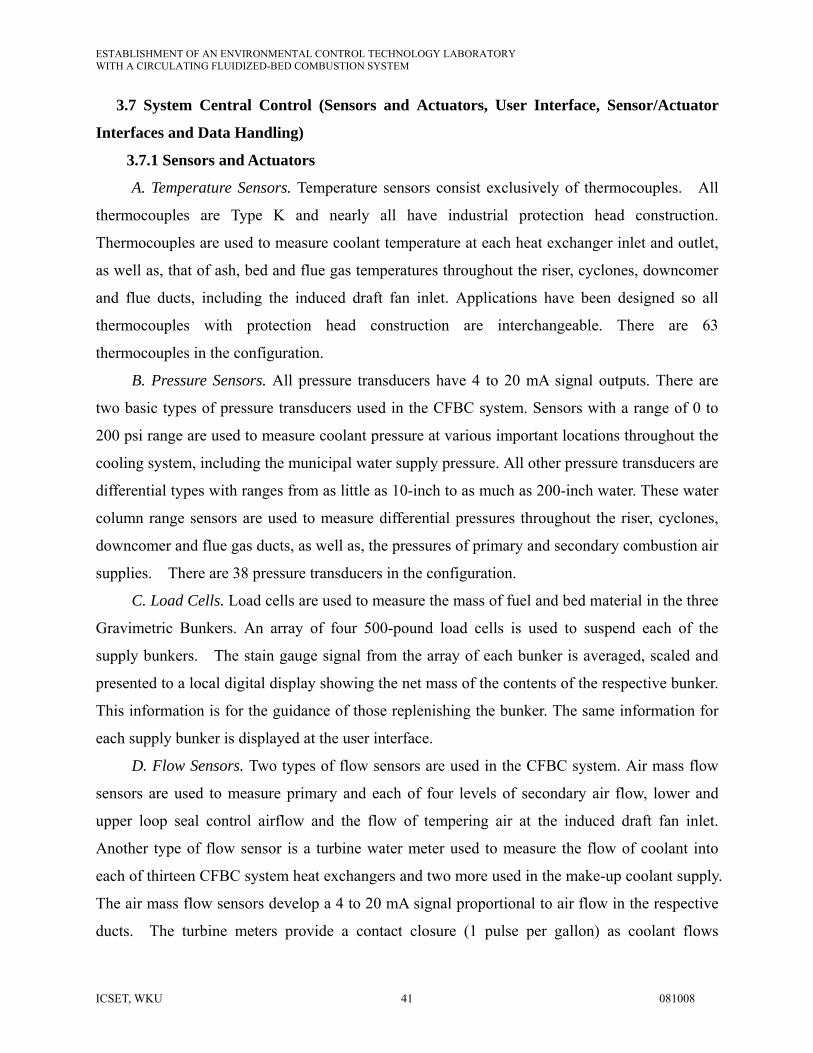
3.7 System Central Control (Sensors and Actuators, User Interface, Sensor/Actuator
Interfaces and Data Handling)
3.7.1 Sensors and Actuators
A. Temperature Sensors. Temperature sensors consist exclusively of thermocouples. All
thermocouples are Type K and nearly all have industrial protection head construction.
Thermocouples are used to measure coolant temperature at each heat exchanger inlet and outlet,
as well as, that of ash, bed and flue gas temperatures throughout the riser, cyclones, downcomer
and flue ducts, including the induced draft fan inlet. Applications have been designed so all
thermocouples with protection head construction are interchangeable. There are 63
thermocouples in the configuration.
B. Pressure Sensors. All pressure transducers have 4 to 20 mA signal outputs. There are
two basic types of pressure transducers used in the CFBC system. Sensors with a range of 0 to
200 psi range are used to measure coolant pressure at various important locations throughout the
cooling system, including the municipal water supply pressure. All other pressure transducers are
differential types with ranges from as little as 10-inch to as much as 200-inch water. These water
column range sensors are used to measure differential pressures throughout the riser, cyclones,
downcomer and flue gas ducts, as well as, the pressures of primary and secondary combustion air
supplies. There are 38 pressure transducers in the configuration.
C. Load Cells. Load cells are used to measure the mass of fuel and bed material in the three
Gravimetric Bunkers. An array of four 500-pound load cells is used to suspend each of the
supply bunkers. The stain gauge signal from the array of each bunker is averaged, scaled and
presented to a local digital display showing the net mass of the contents of the respective bunker.
This information is for the guidance of those replenishing the bunker. The same information for
each supply bunker is displayed at the user interface.
D. Flow Sensors. Two types of flow sensors are used in the CFBC system. Air mass flow
sensors are used to measure primary and each of four levels of secondary air flow, lower and
upper loop seal control airflow and the flow of tempering air at the induced draft fan inlet.
Another type of flow sensor is a turbine water meter used to measure the flow of coolant into
each of thirteen CFBC system heat exchangers and two more used in the make-up coolant supply.
The air mass flow sensors develop a 4 to 20 mA signal proportional to air flow in the respective
ducts. The turbine meters provide a contact closure (1 pulse per gallon) as coolant flows
ICSET, WKU 081008 41
ESTABLISHMENT OF AN ENVIRONMENTAL CONTROL TECHNOLOGY LABORATORY WITH A CIRCULATING FLUIDIZED-BED COMBUSTION SYSTEM
through them. There are eight air mass flow sensors and 15 turbine water meters in the
configuration. All flow data in displayed at the user interface.
E. Video Camera. As described in the previous section, a video display of the flue gas and
particulate exiting the induced draft fan discharge is located in the CFBC system control room.
This display provides useful information about the combustion performance. When combustion
efficiency is high, there is very little particulate that is visible. Only diffraction patterns are
visible.
F. Variable Speed Drives. Variable speed drives have found extensive use in the CFBC
system design. Variable frequency inverter drives are used for many three-phase motors to
effectively control their speed, allowing fan and blower capacity to be easily adjusted to match
operating requirements. The same properties make these drives useful for controlling the rate
of material transport by augers and rotary air-lock valves, with the notable exception of the fuel
and bed material bunker augers. These bunker augers were instead operated with stepper gear
motors because of the highly repeatable and reliable correlation between the control signal
applied to the stepper motor drives and the actual rate of auger rotation. As the bunker augers
are the feed rate determiners for fuel and bed material, the stepper motor solution was selected
for this application.
G. Solenoid Valves. Many solenoid valves are employed in the heat exchanger coolant
management system with a supply solenoid and a steam-rated coolant drain solenoid used for
each CFBC system heat exchanger. Additionally, each heat exchanger supply circuit has a
by-pass solenoid valve that opens a path by-passing coolant directly to the coolant return
manifold whenever the supply solenoid valve is closed. This by-pass helps maintain the overall
coolant loop flow volume, thereby reducing excess pressures when some circuits are closed and
helps insulate water meters and supply solenoid valves from high temperature steam damage.
When a heat exchanger is brought on-line or taken off-line, the steam-rated drain valve is opened
for a short-term deluge to reduce prolonged steam development in the heat exchanger. Further,
this valve remains open to drain when the respective heat exchanger is off-line, thus preventing
high pressure steam from developing internally. Other solenoid valves are used in protecting
secondary air and loop seal control air components from ash backflow. Also, solenoid valves
are employed to control compressed air used to operate the primary air bed-preheater bypass
ICSET, WKU 081008 42
ESTABLISHMENT OF AN ENVIRONMENTAL CONTROL TECHNOLOGY LABORATORY WITH A CIRCULATING FLUIDIZED-BED COMBUSTION SYSTEM
valve and the riser thermal expansion joint ash purge. There are 57 solenoid valves in the
configuration.
H. Proportional Valves. Each of the CFBC system heat exchangers is provided with a
coolant flow control proportional valve after their respective heat exchanger discharge. These
valves are used to adjust flow of coolant over a range of about 0.8 to 18 gallons per minute.
This arrangement provides a significant control of the heat uptake from the nearby combustion
process and/or flue gas stream, while maintaining the maximum pressure in the heat exchanger
for reduction of any tendency to boil the coolant. Proportional valves are also used in
controlling the amount of secondary combustion air delivered to each level of the riser. By
using proportional valves at each level, one supply blower can furnish all secondary air
requirements with individual levels receiving a regulated flow as required. All proportional
valves are controlled at the user interface. There are 19 proportional valves in the configuration.
I. Motorized Valves. There are two electric, motorized valves used in the CFBC system.
One valve controls the amount of tempering air admitted at the induced draft fan intake. This
valve actuator either opens, or by selecting the reverse direction, closes a four-inch butterfly
valve, admitting ambient air to the induced draft fan as needed to keep combined inlet
temperatures below 700 ºF. A second motorized valve is a part of an emergency cooling
method that uses municipal water directly in the case when all circulation pumps fail or when a
back-up generator fails during a combustion test. This valve and a solenoid valve directs
municipal water through all CFBC system heat exchangers and to the drain, helping to reduce
equipment damage that might otherwise occur.
3.7.2 User Interface, Sensor/Actuator Interfaces and Data Handling
A. Process Control Computer. The entire CFBC system process control, support of user
interface, and all data logging is accomplished by a Dell Optiplex GX620 duel core work station
computer. instruNET ® software installed on this computer manages digital data communication
to and from peripheral interfaces and devices and a custom user interface program developed by
Visual Basic® which serves as an operating environment. Many computer screens have been
developed, including graphical representations of parameters such as hourly temperature trends,
current data tables organized by types (e.g., pressures or flows) and screens that show crucial
operating parameters, along with virtual control buttons or slider controls. If a parameter reaches
a pre-programmed limit, the data field flashes to alert the operator of the limit condition. If a
ICSET, WKU 081008 43
ESTABLISHMENT OF AN ENVIRONMENTAL CONTROL TECHNOLOGY LABORATORY WITH A CIRCULATING FLUIDIZED-BED COMBUSTION SYSTEM
parameter on a screen not currently displayed reaches a limit condition, the selection tab for that
screen flashes, as well.
B. Sensor/Actuator Interfaces. As shown in Figure 7-2, sensor/actuator interfaces are
housed in equipment cabinets located in the Tower on floors two through seven. These interfaces
provide digital input/output (I/O) channels that can control a solid-state relay for power
switching (e.g., solenoid valves) or can monitor switch contact closures (e.g., coolant level
switch in separator tank). These interfaces provide analog voltage inputs for such devices as
thermocouples or the voltage developed across a viewing resistor (e.g., the output of a 4 to 20
mA transducer developing 1 to 5 volts across a 250 ohm resistor). Finally, these interfaces
provide an analog voltage output used to control devices (e.g., a proportional valve opening or,
through a drive, the speed of a stepper motor). Through the use of these interfaces on most floors
of the Tower, sensor and actuator wiring lengths are greatly reduced with only a data cable
connecting these interfaces to the process control computer.
C. Data Logging and Data Log Exportation to Excel® Spread Sheet. Data logging is
continuous whenever the control program is running with updates logged to file once every
minute. Both sensor data and actuator status are logged. A program is resident on the process
control computer, as presented in Figure 7-2, that supports the exportation of logged data in an
Excel® file format.
Figure 7-1. Signal Transfer System
ICSET, WKU 081008 44
ESTABLISHMENT OF AN ENVIRONMENTAL CONTROL TECHNOLOGY LABORATORY WITH A CIRCULATING FLUIDIZED-BED COMBUSTION SYSTEM
Figure 7-2 Data Collection
4. System Modification 4.1 Additional Thermal Expansion Joints
A. Ash Supply Duct to Lower Loop Seal. Although not described in the final version of the
mechanical drawings for the CFBC system, points of support for each assembly of riser and
downcomer segments had to be chosen in consideration of the Tower structural framing locations
and the need to provide stable support for the riser and downcomer components, while at the
same time, safely accommodating the dramatic change in combustor lengths resulting from
temperature change. Accordingly, the riser segments were designed to be supported between R4
and R5 segments (as indicated in Figure 2) by the fourth floor framing of the Tower and at the
top of R11 by the eighth floor framing.
It was decided to support the downcomer at the fourth floor. This simplified the task of
providing proper support for the ash bunker and contents, its auger and gear motor drive.
Further, it was decided that in consideration of its weight, the lower loop seal and its associated
ICSET, WKU 081008 45
ESTABLISHMENT OF AN ENVIRONMENTAL CONTROL TECHNOLOGY LABORATORY WITH A CIRCULATING FLUIDIZED-BED COMBUSTION SYSTEM
components should be firmly supported from under the third floor framing so that the expansion
joint (16A) located just above the lower loop seal in the downcomer could work properly. As the
downcomer segments DC1, DC2, DC3 (as indicated in Figure 2), and the ash duct AD1, AD2
and AD3 (as indicated in Figure 2) form a loop that will experience different temperatures at
different times, it was decided to add an expansion joint in the ash duct to prevent stress on these
components. For this reason, AD3 was shortened to accommodate this expansion joint
installation.
B. Lower Loop Seal to Riser R1 Segment. Again, referring to the rigid mounting of the lower
loop seal under the third floor framing, a loop is formed between the third floor framing, the
lower loop seal, the riser segments R1, R2, R3 and R4 (as indicated in Figure 2) and the fourth
floor framing. Clearly, as the riser below the fourth floor lengthened with increasing temperature,
stress would develop in the lower loop seal connecting the duct and the lower-loop seal supports.
Therefore, it was decided to add an expansion joint in this connecting duct to prevent stress in
these components. The portion of the connecting duct from R1 (as indicated in Figure 2) was
shortened to accommodate this expansion joint installation.
4.2 Additional Sensor Ports
Although not provided in the final mechanical drawings, a design review concluded that
additional temperature and pressure measurement points would be useful in such an important
area of the CFBC system riser. These additional measurement points were expected to play a
major roll in bed height management strategies and in actual tests. The value of these
additional measurement point have proven.
A. Riser R1 Segment. The existing set of pressure and temperature sensor ports were located
in the approximate middle of the riser R1 (as indicated in Figure 2) vertical dimension. Two
additional sensor ports were installed, one above and one below the existing ports, dividing this
distance in half again, and yielding a pressure and temperature port at about every 15-inch.
Riser R1 now has a total of three pressure and temperature sensing ports. Also, a different
utilization of all temperature and pressure ports has been adopted throughout the riser and
downcomer segments.
As originally designed, a sensor port, whether temperature or pressure, was constructed by
wielding a ½ inch pipe nipple equipped with pipe threads on the outer end to the riser wall and.
These ports were set up in pairs about three inches apart at every sensor position. Industrial
ICSET, WKU 081008 46
ESTABLISHMENT OF AN ENVIRONMENTAL CONTROL TECHNOLOGY LABORATORY WITH A CIRCULATING FLUIDIZED-BED COMBUSTION SYSTEM
protection head thermocouples have ½ inch male pipe threads to connect to the process.
Instead of using a pipe coupling to connect the thermocouple to the riser pipe nipple, which
would immerse the thermocouple junction in the process, a pipe tee was used. This provided
another port to be used to obtain pressure measurements. This arrangement works well to hold a
plug of quartz wool in the side-leg of the tee that acts as an ash filter for protection of the
pressure sensor. As a result, all added pressure and temperature sensor ports require only one
pipe nipple installation.
B. Riser R2 Segment. Similarly, three pressure and temperature sensor ports have been added
to the riser R2 segment (as indicated in Figure 2). The choice of location for these additional
ports was somewhat restricted due to the presence of two band- or jacket-type heat exchangers.
However, a reasonable distribution of these ports has been achieved to provide representative
temperature and pressure measurements from this riser segment. Riser R2 (as indicated in
Figure 2) now has four pressure and temperature sensing ports.
C. Riser R3 Segment. In the same way, two pressure and temperature sensor ports have been
added to the riser R3 segment (as indicated in Figure 2). These additional ports were able to
achieve a more uniform distribution as, at this time, there were no heat exchanger(s) to work
around. The resulting pressure and temperature sensor ports are located approximately
15-inche apart and provide representative temperature and pressure measurements from this riser
segment. Riser R3 (as indicated in Figure 2) now has three pressure and temperature sensing
ports.
D. Riser R4 Segment. One additional pressure and temperature sensor port has been added to
the Riser R4 segment (as indicated in Figure 2). This additional sensor port has been installed
approximately 15 inches above the lower flange of this segment, which is about halfway between
this flange and the formerly-existing sensor port. Riser R4 now has two pressure and
temperature sensing ports.
4.3 Additional Heat Exchangers
During an earlier CFBC test, excess temperatures were detected in the vicinity of the R3/R4
riser flange joint. Some riser insulation components were damaged (aluminum sheeting was
melted; Kevlar® outer jacket was charred). No flange gasket damage was detected. Also, 1,800
and 1,900 ºF temperatures were measured inside the riser at the same time. Subsequently,
improved insulation application methods have been employed to assure better coverage in flange
ICSET, WKU 081008 47
ESTABLISHMENT OF AN ENVIRONMENTAL CONTROL TECHNOLOGY LABORATORY WITH A CIRCULATING FLUIDIZED-BED COMBUSTION SYSTEM
areas to reduce the likelihood of a recurrence. However, design review indicates that this area of
the riser would benefit from additional heat exchange surface below this area.
A. Riser Transition Joint. Using a similar design to the existing heat exchangers, an
additional heat exchanger coolant jacket was constructed over the existing riser transition joint
segment. Additional coolant piping, solenoid and proportional valves, flow meters and
thermocouples, similar to those used with other existing CFBC system heat exchangers, were
installed. This heat exchanger provides an additional 5.6 square feet of heat exchange surface
area. With the advent of this heat exchanger installation and another installed on riser R3
segment, much better temperature stability and freedom from extreme temperature excursions
has been observed.
B. Riser R3 Segment. Again, using similar design and construction to existing heat
exchangers, a heat exchanger coolant jacket was constructed on the Riser R3 segment somewhat
below the upper flange joint. This heat exchanger, being 12 -inch in height, adds 4.2 square
feet of heat exchange surface area.
4.4 Modification of the Loop Seal Air Supply
A combustion test was terminated after more that 24 hours of continuous operation when ash
recirculation could not be maintained. After disassembly, inspection of residual material on the
riser side of the lower loop seal above the bubble plate conclusively revealed the presence of an
appreciable quantity of bed material. Also, the bubble caps, exclusively on the riser side of the
loop seal bubble plate, showed indications of very high temperatures. Furthermore, ash was
found to have migrated into the common supply piping used to furnish loop seal control air. It is
hypothesized that the downcomer side and the riser side of the loop seal have significantly
different control air requirements of pressure and flow. Therefore independently adjustable
supplies were provided to sustain and better regulate ash circulation. Finally, an improved control
air piping configuration aided in reducing the restriction of control air flow by ash accumulations
therein.
Modifications that allow evaluation of the use of two independent control air supplies for the
lower loop seal are relatively straight forward. As described in the foregoing, the existing
regenerative blower, along with its variable speed drive, was connected exclusively to the riser
side of the lower loop seal plenum. Speed control and the resulting display of control air flow are
available at the user interface. The loop seal plenum now has a baffle plate welded in place
ICSET, WKU 081008 48
ESTABLISHMENT OF AN ENVIRONMENTAL CONTROL TECHNOLOGY LABORATORY WITH A CIRCULATING FLUIDIZED-BED COMBUSTION SYSTEM
separating the two supply paths from each other.
For test purposes, a second regenerative blower will have its capacity manually controlled. A
rotameter is used to measure air flow. This second blower is temporarily positioned on the third
floor of the combustor Tower building near the downcomer viewing ports, allowing an operator
to adjust the volume of air flow and observe the results on the ash in the downcomer.
Both control air supply paths, in order to reduce unwanted backward ash migration toward
the supply blowers, are piped in such a manner as to create what is we expected to perform like
ash traps. The bottom of each plenum port was with a short vertical pipe. Working back toward
the supply, a tee and drain valve is installed allowing any accumulated ash present in this first
vertical leg that has fallen through the bubble plate to be drained. The side-leg of this tee
connects to about 12 inches of horizontal pipe and to an up-turned elbow. Connected to this
up-turned elbow is about 24 inches of vertical pipe, another elbow, a short horizontal pipe, a
down-turned elbow and finally another vertical run of pipe. What is formed is an up-turned loop
(drainable, if required) that leads back to each control air blower. Further, each trap may be
blown out with higher pressure compressed air, if needed. At the very least, there are several new
“inspection ports” in these traps that may provide additional information if ash migration
continues to be a problem.
Standard operating protocol will require each control air blower to be operated at a low
stand-by pressure whenever there is any ash in the downcomer or loop seal or whenever primary
combustion air is being applied to the bed region of the riser.
5. Experimental Section 5.1 Fuel Characterization
One sub-bituminous coal (Powder River Basin (PRB) coal) and two types of solid waste,
(wood pallet (WP) and chicken waste (CW)), were used to evaluate the performance of the 0.6
MWth pilot-scale CFBC. Raw PRB coal was purchased from a coal-fired power plant in Illinois.
The CW was collected from a local farm after natural drying. Its moisture content and heating
value were 20 % and 9197 Btu/lb, respectively. The WP was purchased from a local wood
residue factory. These two solid wastes had a much lower bulk density, were generally moist (6
% for WP and 20 % for CW), and had lower heating values (7752 Btu/lb for WP and 5255 Btu/lb
for CW) than PRB coal used. Limestone, used in CFBC system for sulfur capture, had the total
ICSET, WKU 081008 49
ESTABLISHMENT OF AN ENVIRONMENTAL CONTROL TECHNOLOGY LABORATORY WITH A CIRCULATING FLUIDIZED-BED COMBUSTION SYSTEM
effective constituents (calcium oxides (CaO) and magnesium oxide (MgO)) at over 95% (Ca at
91 % and Mg at 4.3 %). It was purchased local limestone mines from Kentucky. PRB coal was
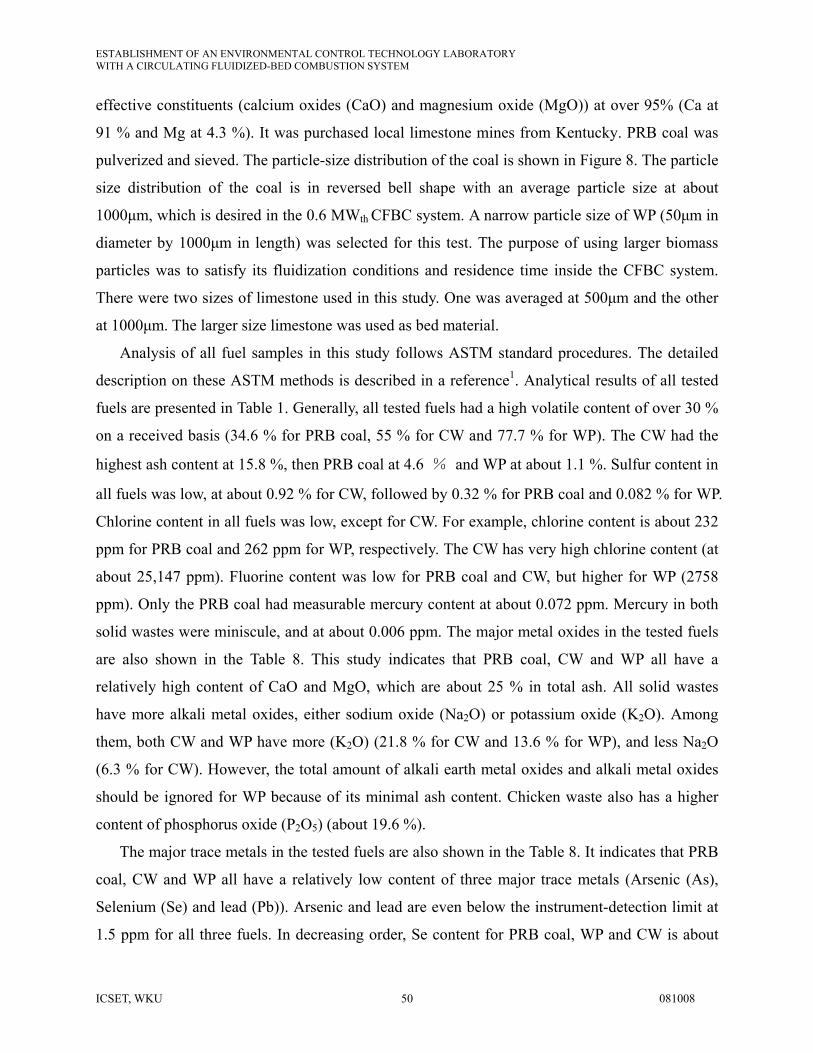
pulverized and sieved. The particle-size distribution of the coal is shown in Figure 8. The particle
size distribution of the coal is in reversed bell shape with an average particle size at about
1000μm, which is desired in the 0.6 MWth CFBC system. A narrow particle size of WP (50μm in
diameter by 1000μm in length) was selected for this test. The purpose of using larger biomass
particles was to satisfy its fluidization conditions and residence time inside the CFBC system.
There were two sizes of limestone used in this study. One was averaged at 500μm and the other
at 1000μm. The larger size limestone was used as bed material.
Analysis of all fuel samples in this study follows ASTM standard procedures. The detailed
description on these ASTM methods is described in a reference1. Analytical results of all tested
fuels are presented in Table 1. Generally, all tested fuels had a high volatile content of over 30 %
on a received basis (34.6 % for PRB coal, 55 % for CW and 77.7 % for WP). The CW had the
highest ash content at 15.8 %, then PRB coal at 4.6 % and WP at about 1.1 %. Sulfur content in
all fuels was low, at about 0.92 % for CW, followed by 0.32 % for PRB coal and 0.082 % for WP.
Chlorine content in all fuels was low, except for CW. For example, chlorine content is about 232
ppm for PRB coal and 262 ppm for WP, respectively. The CW has very high chlorine content (at
about 25,147 ppm). Fluorine content was low for PRB coal and CW, but higher for WP (2758
ppm). Only the PRB coal had measurable mercury content at about 0.072 ppm. Mercury in both
solid wastes were miniscule, and at about 0.006 ppm. The major metal oxides in the tested fuels
are also shown in the Table 8. This study indicates that PRB coal, CW and WP all have a
relatively high content of CaO and MgO, which are about 25 % in total ash. All solid wastes
have more alkali metal oxides, either sodium oxide (Na2O) or potassium oxide (K2O). Among
them, both CW and WP have more (K2O) (21.8 % for CW and 13.6 % for WP), and less Na2O
(6.3 % for CW). However, the total amount of alkali earth metal oxides and alkali metal oxides
should be ignored for WP because of its minimal ash content. Chicken waste also has a higher
content of phosphorus oxide (P2O5) (about 19.6 %).
The major trace metals in the tested fuels are also shown in the Table 8. It indicates that PRB
coal, CW and WP all have a relatively low content of three major trace metals (Arsenic (As),
Selenium (Se) and lead (Pb)). Arsenic and lead are even below the instrument-detection limit at
1.5 ppm for all three fuels. In decreasing order, Se content for PRB coal, WP and CW is about
ICSET, WKU 081008 50
ESTABLISHMENT OF AN ENVIRONMENTAL CONTROL TECHNOLOGY LABORATORY WITH A CIRCULATING FLUIDIZED-BED COMBUSTION SYSTEM
ICSET, WKU 081008 51
1.8 ppm, 8.2 ppm and 6.7 ppm, respectively. Except for CW with a higher content of copper (at
478 ppm), magnesium (at 642 ppm) and zinc (at 528 ppm), all other toxic trace metals
(Beryllium(Be) , Cadmium(Cd), Cobalt(Co), Chromium(Cr), antimony(Sb)) are lower and
generally below 10 ppm.
Figure 8. Particle Size Distribution of Tested Coal
0.00
5.00
10.00
15.00
20.00
25.00
30.00
35.00
40.00
<106 106-300 300-500 500-1000 1000-2000 >2000
Particle size (um)
Per
cent
(%)
ESTABLISHMENT OF AN ENVIRONMENTAL CONTROL TECHNOLOGY LABORATORY WITH A CIRCULATING FLUIDIZED-BED COMBUSTION SYSTEM
Table 8. Coal and Biomass Analysis
ICSET, WKU 081008 52
ESTABLISHMENT OF AN ENVIRONMENTAL CONTROL TECHNOLOGY LABORATORY WITH A CIRCULATING FLUIDIZED-BED COMBUSTION SYSTEM
5.2 Procedures for Firing the CFBC System
A. Preparation. Preparation for CFBC operation consists of working through a checklist
that insures that electric power is available to all interface cabinets, variable speed drives, etc.,
that all sensors are functioning normally, that adequate coolant is present and that all actuators
such as pumps, solenoid and proportional valves are operating within normal parameters.
Preparation also includes the development of a “Test Matrix” to guide the operation of the CFBC
system to achieve the established goals for operation and insure that all materials, including fuel
types and quantities, and bed/sorbent materials and quantities, are in place for operation.
B. Bed Preheating. Good tests have been achieved by using 175 pounds of crushed
limestone with a particle size of 20 to 6 mesh, with minimal dust. HX 1, 2 and 3, covering the
dense zone of the riser, are drained of coolant. About 6.8 pounds per minute of primary
combustion air is directed through the preheater. Bed temperature can reach 680 ºF within about
four hours, which has been sufficient for initiating the firing of PRB coal.
C. Ignition. After fuel kindling has been achieved and a sustained rise in bed temperature is
observed, the bed preheater is switched off and the butterfly valve is opened from the user
interface. This permits combustion air to flow through the air heater (now de-energized) and
directly to the windbox. Fuel feed and primary combustion air flow are increased to bring the
bed area and subsequently the entire riser and cyclones to operating temperature.
D. Temperature Management. Typically, a process temperature throughout the riser of 1560
ºF has been desired. As much as 12 hours of fired operation may be required to arrive at this
temperature throughout the riser segments. During this stabilization interval, fuel feed and
combustion air supplies are optimized with high combustion efficiency as a primary goal.
Sufficient primary combustion air flow is required to completely fluidize the bed, but excess air
will cool the bed. As the operating temperature is approached, limestone feeding is required to
maintain the bed height, but also has a cooling effect. As ash circulation commences to the bed, a
cooling effect may also be observed. As lower portions of the bed approach the operating
temperature, dense zone heat exchangers are put on-line to help regulate the bed temperature.
Secondary combustion air is applied mostly to the lower (R3 and R6) levels of the riser to
increase the upper segments of the riser and the cyclones to the desired operating temperature.
Long term operation at process temperatures in excess of 1,800 ºF are avoided to measure the
reliability of the system components.
ICSET, WKU 081008 53
ESTABLISHMENT OF AN ENVIRONMENTAL CONTROL TECHNOLOGY LABORATORY WITH A CIRCULATING FLUIDIZED-BED COMBUSTION SYSTEM
E. Heat Exchanger Management. On the “flow screen” of the user interface, all CFBC
system heat exchangers are easily monitored and controlled. Coolant flow and discharge
temperatures are displayed and coolant flow is adjusted with a virtual slider control for each heat
exchanger. Coolant discharge temperatures should not be greater than 240 ºF as damage to the
proportional flow control valve damage may occur above this temperature. As the CFBC system
reaches stable operations, coolant flow rates through each heat exchanger will have a discernable
effect upon the process temperature in the vicinity of that heat exchanger.
F. Circulated Ashflow Management. Each loop seal has control air provided by its own
dedicated regenerative blower. These blowers are controlled at the user interface. Ash captured
by the cyclones will flow through a loop seal from an area of higher pressure to an area of lower
pressure when it is fluidized by the loop seal control air. If the loop seal and stand-pipe
(downcomer) have too low a level of ash, unwanted flow from the higher pressure riser to the
lower pressure cyclone will occur and ash recirculation will be prevented.
G. Fuel Blending and Fuel Flow Monitoring. As described previously, fuel blending results
from the relative rotational rate of each stepper gear motor for each fuel supply bunker. An
approximate prediction of blend ratios by volume can be made based upon the ratios of the
stepper motor speed setting on the user interface sliders. However, due to different fill
percentages for the respective augers, the best measure of flow rate is to observe mass loss from
the respective bunkers over a period of time to allow sufficient averaging of data.
H. Air-to-Fuel Management. Theoretical estimates of flow rates for fuels and combustion
air flows may serve as a starting point for optimizing air-to-fuel ratios. Added to temperature
response data as fuel and air flows are finely adjusted, better air-to-fuel ratio management comes
from on-line flue gas analysis for carbon monoxide and oxygen concentration. The IMR 5000
flue gas analyzer provides this data for displays on the user interface “main screen”.
I. Bed Material Height Management. Bed material height may be inferred by static
pressures measured in the dense zone of the riser. As bed material height increases, windbox
pressure rises and inter-port pressures in the dense zone of the riser increase. Primary air flow
rate, bed temperature and bed material particle-size distribution all affect these pressures as well.
Once stable operation is achieved, maintaining a steady bed-static pressure indicates a
reasonably constant bed height in riser.
ICSET, WKU 081008 54
ESTABLISHMENT OF AN ENVIRONMENTAL CONTROL TECHNOLOGY LABORATORY WITH A CIRCULATING FLUIDIZED-BED COMBUSTION SYSTEM
J. Emergency Recovery. The CFBC system has, thus far, demonstrated a robust and tolerant
design and construction and therefore should have little need for recovery from emergency
conditions. Structurally, the CFBC system components seem well supported by the Tower
framing. Redundant measures have been taken to insure adequate cooling and safe shut-down
during normal operation and during unscheduled electric power interruption. The process control
computer, the sensor/actuator interfaces, all sensors and all essential actuators are powered by
on-line uninterruptible power supplies, which are in turn supported by a stand-by 80 KW
generator set. The process control computer has been programmed to provide alarms and to
prevent many possible missteps that might lead to troubled operation. The worst outcome of a
potential emergency situation should be that fuel flow is terminated and the run comes to a halt.
Upon elimination of the condition, normal operation should resume.
K. Routine Shut-down. Upon the completion of an CFBC system test, a working checklist
directs the steps to be taken to accomplish a routine shut-down. These steps essentially consist of
terminating the feeding of all fuel and bed material. Generally, 30 minutes after fuel feed is
terminated, primary air may be reduced to about 8 pounds per minute. Internal and external
coolant circulation pumps are unchanged at this time. All CFBC system heat exchangers may be
reduced to a slider control position of 40 % of maximum. Induced draft fan operation is
unchanged at this time. Secondary combustion air is to be set for a flow of about 1.2 pounds
per minute flow at R3 and 0.4 pounds per minute at R6. Loop seal blowers may be shut down at
this time. Upon reaching an indicated R1 middle temperature of about 500 ºF, primary
combustion air may be reduced to about 4 pounds per minute. The CFBC system should be
operated under these conditions for a minimum of 8 hours to insure a gradual and uniform cool
down. After this time has elapsed, coolant circulation pumps and the secondary air blower may
be shut-down. As long as there is used bed material in the riser, the downcomer or the loop seals,
the induced draft fan and forced draft fan should remain in operation and the bed preheater
should be programmed to operate at about 240ºF to keep this bed material from becoming
hydrated.
5.3 Procedures for Air Pollutant Measurement
5.3.1 Measurement of Combustion Source Flue Gas by Teledyne API.
ICSET, WKU 081008 55
ESTABLISHMENT OF AN ENVIRONMENTAL CONTROL TECHNOLOGY LABORATORY WITH A CIRCULATING FLUIDIZED-BED COMBUSTION SYSTEM
The concentrations of SO2, NOx, CO were measured by Teledyne API M100E, M200E, and
M300E, respectively. The M100E is a fluorescence spectroscopy instrument, which measures
the intensity of fluorescence that occurs when SO2 is excited by ultraviolet light. The M200E
measures the NOx concentration by detecting the chemiluminescence, which occurs when nitrogen
oxide (NO) reacts with ozone (O3). A molybdenum oxide is used to convert NO2 to NO for the
chemiluminescence reaction. The Model 300E/EM uses a high energy heated element to generate
a beam of broad band Infrared Radiation (IR) light with a known intensity (measured during
Instrument calibration). This beam is directed through multi-pass cell filled with sample gas. The
sample cell uses mirrors at each end to reflect the IR beam back and forth through the sample gas a
number of times. The total length that the reflected light travels is directly related to the intended
sensitivity of the instrument. The instrument was calibrated using zero air and a standard gas
provided by Airgas Co. (Bowling Green, KY) every day before the measurements started. Data
collected during testing period was processed by internal data acquisition systems.
5.3.2 Measurement of Speciated Mercury by Mercury CEM and OHM.
PS Analytical Semi-continuous Emission Monitor was used as mercury semi-continuous
emission monitor (CEM) in this test. The (PS) analytical SCEM system consists of six major
components, including an inertial sampling probe, heated Teflon sample line, which is normally
kept at 150oC, the mercury speciation conversion module for measurement of speciated mercury,
the analyzer, and the data collection system. The system also has a mercury-vapor generator. This
device supplies a constant stream of mercury vapor at typically 14 liters per minute. These gases
go through the valve-switching box and can be directed to the probe to completely check the
system bias. This mercury CEM system uses a gold trap to collect the mercury from the flue gas
before analysis with an atomic fluorescence detector. Without the aid of a pretreatment system,
the atomic fluorescence detector is not protected from the acidic flue gas and is also unable to
determine mercury speciation. The pretreatment system splits the incoming flue gas into two
streams prior to entering mercury speciation conversion module. One stream passes through a
potassium chloride solution, which removes oxidized mercury; thereby allowing only elemental
mercury to reach the detector. The other stream passes through a stannous chloride solution,
which reduces oxidized mercury to elemental mercury, thus facilitating the measurement of total
mercury. Both solutions also serve the dual purpose of removing acidic gases that could damage
ICSET, WKU 081008 56
ESTABLISHMENT OF AN ENVIRONMENTAL CONTROL TECHNOLOGY LABORATORY WITH A CIRCULATING FLUIDIZED-BED COMBUSTION SYSTEM
the gold detector.
The EPA Ontario Hydro Method, approved by ASTM Method D6784-2, plus the inertial
sampling technique, which is to prevent measurement bias from involvement of fly ash during
sampling, is used in this test. The OHM data is used to verify data from mercury CEM. The
recovery solutions were digested and analyzed using the Hydra Prep mercury solution digestion
equipment and the Hydra AA mercury solution analyzer from the Leeman Instrument Company.
This mercury analyzer is an automated unit employing a dual beam, cold vapor atomic
absorption spectrometer (AAS). This system has a detection limit of 1 part per trillion (ppt)
mercury. This method is currently the only available standard method for speciated mercury
measurements. Laboratory and field validations have indicated relative standard deviations of
10%, far better than the minimum criteria set by EPA Method 301. The versatile Apex
Instruments sampling train was used to conduct sampling. Approximately over one hour of
sampling time was required to collect gas samples with a certain volume of flue gas, which is
dependent on mercury concentration in the flue gas.
Early indications of a low bias in elemental mercury measurements with high levels of SO2
in the flue gas were corrected by adding an impinger containing nitric acid/hydrogen peroxide
before the acidified permanganate solutions to avoid a possible reduction reaction. Another
concern was the possible presence of Hg1+ species in the flue gas, which would be captured in
potassium chloride impingers and converted to Hg2+ in acidified permanganate solutions during
subsequent solution recovery. The Hg1+ species gives the same results as Hg2+ and is therefore
counted as oxidized mercury or Hg2+. However, it is generally assumed that all forms of oxidized
mercury in the hot flue gas occur as Hg2+. This is a reasonable assumption since Hg2Cl2 is not
thermodynamically stable in the flue gas and disappear rapidly to produce Hg0 and Hg2+.
LECO AMA-254 Advanced Mercury Analyzer. Fly ash collected from the OHM standard
filter, mechanical hoppers and electric precipitator (ESP) hoppers were analyzed with the LECO
AMA-254 mercury analyzer. This direct combustion mercury analyzer was the principal
instrument used to develop the newest ASTM standard method of analysis for mercury in coal
and combustion residues, D6722. The AMA-254 has a 0.01 ng mercury detection limit, a
working range from 0.05 to 600 ng, reproducibility smaller than 1.5 %, and a five-minute
analysis time.
5.3.3 Measurement of Speciated Halogens by EPA M26A.
ICSET, WKU 081008 57
ESTABLISHMENT OF AN ENVIRONMENTAL CONTROL TECHNOLOGY LABORATORY WITH A CIRCULATING FLUIDIZED-BED COMBUSTION SYSTEM
This method is applicable for determining emissions of hydrogen halides (HX) [HCl, HBr,
and HF] and halogens (X2) [Cl2 and Br2] from stationary sources. Hydrogen halides and halogens
were captured by a 0.1N sulfuric acid and 0.1N hydrogen peroxide solution, respectively. The
solution was recovered from the impingers immediately after the sampling, and sent to the
analyzer based on ion chromatography. Similar sampling train, as OHM, is applied while
conducting EPA M26A. The only difference is in the sampling impinger train that contains
different sampling solutions. After sampling, the solution will be analyzed by ion
chromatography (IC).
5.3.4 Measurement of Gaseous Trace Metals by EPA M29.
This method is applicable to the determination of trace metal emissions from stationary
sources. Measurement of trace metals include Sb, As, Ba, B, Be, Cd, Co, Cr, Cu, Pb, Mn, Ni, P,
Se, Ag, Tl, and Zn. The absorption solution (5 %HNO3/10 %H2O2) was recovered from the
impingers and then acid digestion followed the standard procedure. The samples were prepared
and analyzed using inductively-coupled plasma emission spectroscopy. Similar sampling trains,
as OHM, are applied while conducting EPA M29. The only difference is in the sampling
impinger train containing different sampling solutions. After sampling, solution will be analyzed
by ICP-ES.
5.3.5 Measurement of Condensable Particulate Matter (CPM) by modified EPA OTM 28.
A modified condensable particle matter (CPM) method, as indicated in modified EPA
OTM 28, is applied to take CPM samples during tests. APEX particle matter (PM)10&2.5
cyclones are cleaned by detergent, de-ionized water, acetone and dried. Before sampling starts,
all used sampling impingers, 100 ml, and 50 ml beakers need to be cleaned using soap, tap water,
de-ionized water, acetone and finally methylene chloride (CH2Cl2). All these containers are
baked at 300 oC for 6 hours. The cleaned, dry beakers, FPM filters and CPM filters are
desiccated at least 24 hours at room temperature in a desiccator containing anhydrous calcium
sulfate, and then are weighed at intervals at least six hours to a constant weight (=< 0.5 mg
change from previous weighing) and recorded to the nearest 0.1 mg. The setup of the CPM
sampling train is indicated in Figure 9. As soon as possible after the post-test leak check and
impingers weighting purge, the impingers train at 20 liters per minute for one hour as seen in
Figure 10. After post-test nitrogen purge, FPM and CPM samples together with one field blank
will be processed as the processing flow chart shown method.
ICSET, WKU 081008 58
ESTABLISHMENT OF AN ENVIRONMENTAL CONTROL TECHNOLOGY LABORATORY WITH A CIRCULATING FLUIDIZED-BED COMBUSTION SYSTEM
Figure 9. Sampling Train for Collection of FPM and CPM
Figure 10. Train Configuration on CPM Post-test Nitrogen Purge
ICSET, WKU 081008 59
ESTABLISHMENT OF AN ENVIRONMENTAL CONTROL TECHNOLOGY LABORATORY WITH A CIRCULATING FLUIDIZED-BED COMBUSTION SYSTEM
5.3.6 Measurement of Volatile Organic Compounds (VOCs) and Semi-VOCs.
As shown in Figure 11, EPA Method 0010 is used to characterize VOCs and Semi-VOCs,.
Sample traps are delivered to Pyrolysis-gas chronograph mass spectroscopy (GCMS) for
analysis.
Figure 11. Sampling Train for VOCs and Semi-VOCs
5.3.7 Measurement of Ammonia (NH3) by EPA OTM27.
This method is used to collect ammonia emissions from the coal-fired boiler at power
plants. The impinger system for collecting ammonia consists of 100 mL of 0.1N sulfuric acid
(H2SO4) in the first and second impingers, an empty third impinger, and 200-300 grams of
indicating silica gel in the fourth impinger. All four impingers are weighed for calculate moisture.
After sampling, all four impingers are weighed for moisture. An ion chromatograph (IC)
equipped with a conductivity detector is used for ammonium ion separation and quantization. A
daily calibration curve is prepared using at least six standards that bracket the expected range of
sample concentrations before sample solution analysis starts. Calibration standards are prepared
in 0.04 N H2SO4; the same concentration of acid as in the diluted samples. The setup of IC is as
followed:
Instrument: Dionex Model 2120i or high grade
Separator Column: Dionex HPIC-CS1
Suppressor Column: Dionex Cation Micromembrane
ICSET, WKU 081008 60
ESTABLISHMENT OF AN ENVIRONMENTAL CONTROL TECHNOLOGY LABORATORY WITH A CIRCULATING FLUIDIZED-BED COMBUSTION SYSTEM
Effluent: 0.005 N Hydrochloric Acid
Effluent flow rate: 2.3ml/min
Reagent: 0.1 M Trtrabutylammonium hydroxide
Sample Loop Volume: 100 L
5.3.8 Measurement of SO2/SO3 by ASTM Selective Condensation Method.
This method is specially-designed to collect SO3 in coal-derived flue gas. The principle of
this method is to separate SO3 from SO2 based on the maximum difference in condensation
kinetics of SO3 and SO2 at temperature of about 60 to 65 oC. CONSOL Energy, Inc. developed
this method 15 years ago. It was reported to be accurate in SO3 collection in the coal-derived flue
gas by extensive SO3 sampling. This method, as shown in Figure 12, is reliable, reproducible and
sensitive. Its standard deviation is below 1 ppmv of SO3 with the relative standard deviation at
about 10 %. In this method, the SO3 sampling probe (initial probe herein) is set up at about 250 oC, and thus, eliminates the negative bias from the condensation of SO3 in the sampling probe.
Recent experience of explaining this method indicates that at a temperature of about 60 to 65 oC
in the condenser and sampling rate of about 3 liters per minute are needed to ensure the
completeness of SO3 condensation. Other experience also indicated that this method would likely
have a negative bias due to the setup of its ash filtration system in front of sampling probe,
whose temperature is close to the flue gas temperature inside the ductwork. Filtered fly ash will
likely collect SO3 in the gas stream before it enters the SO3 condenser. In these tests, an inertial
probe is always used so that bias brought on by fly ash can be largely eliminated.
Figure 12. Sampling Train for SO3 Measurement
ICSET, WKU 081008 61
ESTABLISHMENT OF AN ENVIRONMENTAL CONTROL TECHNOLOGY LABORATORY WITH A CIRCULATING FLUIDIZED-BED COMBUSTION SYSTEM
Checking and analyzing all reagent blanks including De-ionized water, acetone and
methylene chloride with 100 ml. (Reagent blank should be within 0.001 percent by weight) are
required throughout all of EPA standard methods.
5.4 PRB-Fired operation in CFBC System and Switching to Co-firing with Wood Pallet
In the afternoon of July 22, 2008, the firing of the CFBC system started. Overnight firing
gradually increased the temperature of the whole system, which was ready for performance
evaluation under normal operating conditions. On July 23 2008, the first full evaluation of the
0.6 MWth CFBC system was conducted while firing PRB coal in the morning and co-firing of
PRB coal and wood pallets (WP) in the afternoon.
As indicated in Figure 13-1 and Table 9-1, the PRB coal only feed rate was kept nearly
constant and averaged about 137 pounds per hour. Therefore, the CFBC system was operated at a
thermal input of 320 kW by coal. The thermal output of 206 kW was maintained by heat
exchangers (HX), which was over half of the full setting load (600 kW by coal thermal input). As
indicated in Figure 13-2 and Table 9-1, the feed rate of the primary air was kept constant and
averaged about 9.4 pounds per minute (at standard condition) and a rate of 3.9 pounds per minute
on avaerager for the secondary air on average. The ratio of secondary air to total air was about
29.4 %. The air delivery into CFBC system through low loop seal was about 1.74 pounds per
minute, a ratio was at 13.1%. Throughout tests, the limestone feeding rate was kept constant. The
Ca/S ratio was about 7.3 during the firing of the PRB coal only. The limestone feed was
over-supplied for sulfur capture because the limestone also served as initial bed material. The
operation seemed very stable throughout testing during the firing of PRB coal only, which was
mainly presented by the control of CFBC system temperatures at different locations. As indicated
in Figure 13-3 and more detailed in Figure 13-4 which shows the temperature profiles over time
at different locations, variations of temperature can be controlled within 100oF. As indicated in
Table 9-1 and Figure 13-5, the average temperatures along CFBC system height gradually
decreased. Just above the windbox, the temperature was the highest of the whole facility at about
1530oF. In the major parts (from R1 to R8 inside CFBC system riser, the temperature could be
controlled above 1300oF. At the secondary cyclone, the temperature dropped to 673oF. The
purpose of the higher temperature at the bottom of the riser was to maintain the activity of the
limestone for sulfur capture; the lower temperatures at the middle and top of the riser resulted
ICSET, WKU 081008 62
ESTABLISHMENT OF AN ENVIRONMENTAL CONTROL TECHNOLOGY LABORATORY WITH A CIRCULATING FLUIDIZED-BED COMBUSTION SYSTEM
from testing the functions of HX.
As indicated in Figure 13-1 and Table 9-2, the feed rate of coal was kept slightly lower, about
109 pounds per hour, but WP started to be fed at an average rate of 66 pounds per hour when the
CFBC system was switched to operation in the co-firing mode. Therefore, the thermal input by
fuels being fed reached 350 kW and thermal output by HX was increased to about 242 kW.
Throughout the tests, the limestone feed rate was also kept constant. The feed rate of the primary
air was kept constant and averaged at about 13.5 pounds per minute (at standard condition) and
2.7 pounds per minute for the secondary air on average. The ratio of secondary air to total air
was decreased to about 16.6 %. The air delivery into the CFBC system through low the loop seal
was still at about 1.74 pounds per minute, the ratio of which was decreased to about 10.8 %
because of increases of the total air input. The average air to coal ratio (air/coal) was kept at 0.15
lb/lb. The Ca/S ratio was 10.1 during co-firing with the PRB coal and the WP for the same
purpose previously mentioned. Similarly, the operation seemed stable after the initial period of
feeding WP into the CFBC system during the co-firing of PRB coal. As indicated in Figure 13-3
and more detailed in Figure 13-4, which show the temperature profiles over time at different
locations, variations of temperature can be controlled within 100oF. As indicated in Table 9-2 and
Figure 13-5, similar temperatures could be found during co-firing compared to that during the
firing of PRB coal only, but slightly higher with comparison to two cases at different locations.
Just above the windbox, the temperature was increased to about 1580oF at R1. In the majority of
parts (from R1 to R8 inside CFBC system riser) temperature could be controlled above 1400oF.
Temperature inside the secondary cyclone increased to about 759oF.
Figures 13-6 and 13-7 presented variations of major combustion-source gases (including CO,
CO2 and O2) and major air pollutants (SO2 and NO) during the firing of PRB coal only and for
the co-firing of PRB coal and WP. There were no major differences on the operational side,
which was represented by O2 and CO2 concentrations in the flue gas. Under both operational
conditions, flue gas O2 and CO2 at the flue gas exit were about 1.1 % and 18 %, respectively.
Major differences were represented by air pollutant emissions of SO2, NO and N2O, as well as
CO at the exit. Carbon monoxide was averaged at 358ppm during the firing of PRB coal, which
was lower than 584 ppm during the co-firing of PRB coal and WP. It seemed there was no
significant correlation between NO and CO concentrations despite a slight decrease of NO from
164ppm under PRB coal firing to 142 ppm under co-firing. However, Figure 13-6 clearly shows
ICSET, WKU 081008 63
ESTABLISHMENT OF AN ENVIRONMENTAL CONTROL TECHNOLOGY LABORATORY WITH A CIRCULATING FLUIDIZED-BED COMBUSTION SYSTEM
the correspondence between NO and O2. With increasing O2, concentrations of NO followed to
increase abruptly under both operational conditions. During the same period, the average CFBC
system temperatures increased with the increase of O2 concentration. Therefore, variations of NO
should be attributed to generation of thermal NO during temperature increases by adjusting
excessive air ratio. The system temperature also has a major impact on effectiveness of sulfur
capture by limestone. As indicated in Figure 13-6, under the operational mode of co-firing, the
system temperature was maintained at the normal temperature at 1500oF starting from the initial
period of WP feeding to the final stable feeding. Sulfur dioxide emissions continuously dropped
and finally stabilized. Considering the constant feeding of limestone throughout test, the drop of
SO2 seemed to be attributed to the system temperature. It is generally accepted that the optimal
temperature to allow limestone to effectively capture SO2 is 1550 oF. Because of the larger
particle size (average 1000 um) and the higher density of limestone used in this test, a larger
portion of limestone remained at the bottom of the bed as bed material, where generally the
highest temperature were at both operational conditions. Sulfur dioxide emissions, measured by
emission CEM, were about 3.69 ppm and 10.9 ppm, respectively for both operational conditions.
Results were verified by the EPA wet chemical method that SO2 emissions were about 3.74 ppm
and 4.57 ppm, respectively. Due to the lower system operational temperatures and also a lower
occurrence of SO2 in the flue gas, SO3 emissions were also low at 1.38 ppm. Higher system
temperatures also helped to control CO emissions on co-firing, which was represented by the
drop of CO concentration when system temperature and O2 feeding increased (as indicated in
Figure 13-7).
Results from mercury CEM indicated that the total vapor phase mercury (Hg(VT)) was about
7.16 ug/NM3 with over 94 % of Hg(VT) being the elemental mercury (Hg(0)) present during
firing of PRB coal only. This result was verified by OHM, which reported similar results of
Hg(VT) at 7.69 ug/NM3 with 98 % of Hg(VT) being Hg(0). After operations began switching
from firing of PRB coal only to co-firing of coal with WP, Hg(VT) dropped to 5.22 ug/NM3 with
similar mercury speciation. These CEM results were also verified by OHM, which reported
similar Hg(VT) at 5.66 ug/NM3. Compared to firing PRB coal only, the mercury emissions
decreased. This drop is attributed to the decrease of mercury input, represented by the decrease
of total mercury input in the fed fuels fed to the system because there is no mercury content in
WP. The analysis of collected fly ash during the co-firing period, as shown in Table 8, show the
ICSET, WKU 081008 64
ESTABLISHMENT OF AN ENVIRONMENTAL CONTROL TECHNOLOGY LABORATORY WITH A CIRCULATING FLUIDIZED-BED COMBUSTION SYSTEM
miniscule amount of mercury captured by fly ash (at about 0.006 ppm) although LOI of
collected fly ash was high at about 14.2 %. The lack of mercury capture by fly ash was attributed
the very high Hg(0) portion in the flue gas, which was about 95 % Hg(VT). The greater
occurrence of Hg(0) in the flue gas was the consequence of very little halogen species in the flue
gas in both operational modes, as indicated in Table 9-1 and Table 9-2. Total concentrations of
HCl, HF, HBr Cl2, F2 and Br2 were all very low (either below 1ppm or below the instrument
detection limit for both operational modes). It’s understandable because of the lower content of
halogens in the PRB coal. This probably made the transformation of halogens present in the flue
gas less effective. However, higher fluorine content was found in the WP, as indicated in Table 8,
which did not result in higher content of HF or F2 in the flue gas. There must be a mechanism
that caused the gaseous halogen to be captured by fly ash inside the CFBC system, such as the
calcited limestone.
Except mercury, emissions of other major trace metals were lower, as indicated in Table 9-1
and 9-2. When firing PRB coal only, the emissions of all trace metals were below 3.41 ug/NM3;
when co-firing PRB coal and WP, emissions rates of all trace metals were below 3.78 ug/NM3.
Measurement results of CPM at the flue gas exit are also shown in Table 9-1 for firing PRB
coal only and Table 9-2 for co-firing PRB coal with WP. Because of the inertial filter used for
CPM sampling, there were no results for the filterable particulate matter (FPM). Results from
firing PRB coal only indicated that the total CPM was about 30.13 mg/NM3 for the first test and
decreased to 18.33 mg/NM3 for the second run. Because the organic CPM was only about 3.41
mg/NM3 for the first test and 1.83 mg/NM3 for the second test, more than 90 % of CPM was
inorganic CPM. Similarly, for co-firing, the major portion of CPM was also inorganic at about
12.66 mg/NM3 for the first test and 11.76 mg/NM3 for the second test. The organic CPM was
only about 2.02 mg/NM3 for the first test and increased to 6.72 mg/NM3 during the second test.
The reason for the increase of organic CPM was likely the increase of unburned hydrocarbon
concentrations in the flue gas when co-firing the highly-volatile WP, as indicated in Table 8.
To better understand the species that form CPM, major ions inside inorganic CPM were also
analyzed by an IC instrument, including sulfate ion (SO42-), nitrate ion (NO3
2-), ammonium ion
(NH4+), calcium ion (Ca2+), magnesium ion (Mg2+), potassium ion (K+) and sodium ion (Na+).
When firing PRB coal only, the NH4+ ion in the inorganic portion of CPM was highest at about
6.62 and 8.02 mg/NM3 for two runs. Chlorine (Cl-1) ion in the inorganic portion of CPM was
ICSET, WKU 081008 65
ESTABLISHMENT OF AN ENVIRONMENTAL CONTROL TECHNOLOGY LABORATORY WITH A CIRCULATING FLUIDIZED-BED COMBUSTION SYSTEM
ICSET, WKU 081008 66
higher (10.43 mg/NM3) for the first run. Sulfate (SO42-) ion in CPM should only be derived from
sulfuric acid mist (SO3) in the flue gas, as suggested by the Electric Power Research Institute
(EPRI) research group. As indicated in Table 9-1 and 9-2, SO3 concentrations were as low as
1.38 ppmv by better controlling sulfur with limestone feeding, which was equivalent to 1.11
mg/NM3 SO42- ion in CPM. This trend did not change when co-firing. Major organic species,
including VOCs and semi-VOCs, in the flue gas were determined by GC-MS. Results, as
indicated in Table 9-1 and 9-2, show that the emissions of VOCs and semi-VOCs were both
below the detection limit of the instrument during the period of co-firing, except for benzene in
the VOC. Benzene was about 21.5 ug/NM3 during test.
ESTABLISHMENT OF AN ENVIRONMENTAL CONTROL TECHNOLOGY LABORATORY WITH A CIRCULATING FLUIDIZED-BED COMBUSTION SYSTEM
ICSET, WKU 081008 67
0
50
100
150
200
250
300
0:00 2:24 4:48 7:12 9:36 12:00 14:24 16:48 19:12
time
feed
ing
rate
,lb/h
r
-50.0
50.0
150.0
250.0
350.0
450.0
550.0
CFB
C lo
ad, K
W
Coal feeding Limestone feeding WP feedingload (output by HX) load (input by fuels)
PRB Coal Only Co-firing of PRB Coal and WP
Figure 13-1. Variations of Coal Feeding, Limestone Feeding, WP Feeding and Load during Tests Conducted on July 23, 2008
ESTABLISHMENT OF AN ENVIRONMENTAL CONTROL TECHNOLOGY LABORATORY WITH A CIRCULATING FLUIDIZED-BED COMBUSTION SYSTEM
ICSET, WKU 081008 68
0
5
10
15
20
25
30
35
0:00 2:24 4:48 7:12 9:36 12:00 14:24 16:48 19:12
time
air f
eedi
ng ra
te, l
b/m
in
0.0
5.0
10.0
15.0
20.0
25.0
30.0
35.0
40.0
45.0
50.0
seco
ndar
y pr
esen
tage
, %
Primary air, lb/min total secondary air, lb/min
lower loop seal air, lb/min secondary air precentage, %
PRB Coal Only Co-firing of PRB Coal and WP
Figure 13-2. Variations of Supplies of the Primary Air, the Secondary Air and the Loop Seal Air during Test Conducted on July 23,
2008
ESTABLISHMENT OF AN ENVIRONMENTAL CONTROL TECHNOLOGY LABORATORY WITH A CIRCULATING FLUIDIZED-BED COMBUSTION SYSTEM
ICSET, WKU 081008 69
500.0
700.0
900.0
1100.0
1300.0
1500.0
1700.0
1900.0
0:00 2:24 4:48 7:12 9:36 12:00 14:24 16:48 19:12
time
aver
age
tem
epra
ture
,F
R1 R2 R3
R4 R5-R8 R9-R11
PRB Coal Only Co-firing of PRB Coal and WP
Figure 13-3. Variations of Temperature Profiles over Time in CFBC System Riser during Test Conducted on July 23, 2008
ESTABLISHMENT OF AN ENVIRONMENTAL CONTROL TECHNOLOGY LABORATORY WITH A CIRCULATING FLUIDIZED-BED COMBUSTION SYSTEM
ICSET, WKU 081008 70
500
700
900
1100
1300
1500
1700
1900
0:00 4:48 9:36 14:24 19:12 0:00 4:48time
tem
pera
ture
,
R1 low
R1 middle
R1 upper
R2 low
R2 lower-middle
R2 upper-middle
R2 upper
F R3 lower
R3 middle
R3 upper
R4 lower
R4 upper
R5
R6
R7
R8
R9
R10
R11
Figure 13-4. Variations of Detailed Temperature Profiles over Time inside CFBC System Riser During Test Conducted on July 23,
2008
ESTABLISHMENT OF AN ENVIRONMENTAL CONTROL TECHNOLOGY LABORATORY WITH A CIRCULATING FLUIDIZED-BED COMBUSTION SYSTEM
ICSET, WKU 081008 71
500
1000
1500
2000
R1 Low
erR1 M
iddle
R1 Upp
erR2 L
ower
R2 Low
er-Midd
le
R2 Upp
er-Midd
leR2 U
pper
R3 Low
erR3 M
iddle
R3 Upp
erR4 L
ower
R4 Upp
er R5 R6 R7 R8 R9
R10 R11
locations
aver
age
tem
epra
ture
, F
PRB coal firingCo-firing of PRB coal and WP
Figure 13-5. Average Temperature Profiles during the Firing of PRB Coal Only and the Co-Firing with WP
ESTABLISHMENT OF AN ENVIRONMENTAL CONTROL TECHNOLOGY LABORATORY WITH A CIRCULATING FLUIDIZED-BED COMBUSTION SYSTEM
0
100
200
300
400
7:55:12 AM 10:19:12 AM 12:43:12 PM 3:07:12 PM 5:31:12 PM 7:55:12 PMTime
NO
or S
O2,
ppm
0
1
2
3
4
5
O2,
%
NO(ppm) SO2(ppm) O2(%)
CO-firing of PRB coal and WPPRB coal Firing
limestone feeding
Figure 13-6. Variations of NO, SO2 and O2 during the Firing of PRB Coal Only and the Co-Firing with WP
ICSET, WKU 081008 72
ESTABLISHMENT OF AN ENVIRONMENTAL CONTROL TECHNOLOGY LABORATORY WITH A CIRCULATING FLUIDIZED-BED COMBUSTION SYSTEM
ICSET, WKU 081008 73
0
1000
2000
3000
4000
7:55:12 AM 10:19:12 AM 12:43:12 PM 3:07:12 PM 5:31:12 PM 7:55:12 PMTime
CO
, ppm
0
5
10
15
20
25
30
O2
or C
O2,
%
CO(ppm) O2(%) CO2(%)
PRB coal Firing CO-firing of PRB coal and Wood Pallet
Figure 13-7. Variations of CO, CO2 and O2 during the Firing of PRB Coal Only and the Co-Firing with WP
ESTABLISHMENT OF AN ENVIRONMENTAL CONTROL TECHNOLOGY LABORATORY WITH A CIRCULATING FLUIDIZED-BED COMBUSTION SYSTEM
Table 9-1. Operational Parameters and Emission Rates of Air Pollutants during the Firing of PRB Coal Only
ICSET, WKU 081008 74
ESTABLISHMENT OF AN ENVIRONMENTAL CONTROL TECHNOLOGY LABORATORY WITH A CIRCULATING FLUIDIZED-BED COMBUSTION SYSTEM
ICSET, WKU 081008 75
Table 9-2. Operational Parameters and Emission Rates of Air Pollutants during the Co-firing of with WP
ESTABLISHMENT OF AN ENVIRONMENTAL CONTROL TECHNOLOGY LABORATORY WITH A CIRCULATING FLUIDIZED-BED COMBUSTION SYSTEM
5.5 Co-firing of PRB Coal and Switching to Co-firing with Chicken Waste
On the afternoon of July 29 2008, the second firing of the CFBC system continued. As with
the previous test, overnight firing was conducted to increase the system temperature close to the
normal operating conditions. The following morning, the second full evaluation of the 0.6 MWth
CFBC system was conducted starting with firing PRB coal, at an even higher than the test
conducted on July 23, 2008. In the afternoon, the system was switched to co-firing PRB coal and
chicken waste (CW).
As indicated in Figure 14-1 and Table 10-1, PRB coal feeding was kept nearly constant after
an initial temperature ramp. Therefore, the CFBC system was operated close to 60 % of the full
setting load (600 kW by coal thermal input) at a thermal input by the coal of 320 kW (the
thermal output by the HX at about 263.3 kW). As indicated in Figure 14-2 and Table 10-1, the
feed rate of the primary air was kept constant and averaged about 12.37 pounds per minute (at
standard condition) and 2.48 pounds per minute for the secondary air. The ratio of secondary air
to total air decreased to about 16.7 % compared to that in the first firing on July 23, 2008. The
purpose of decreasing the secondary air was the evaluation of its impact on air pollutant
emissions. The air delivery into CFBC system through the lower loop seal also decreased to
about 1.07 pounds per minute, a ratio of at 7.3 %. Throughout the tests, the limestone feed rate
was not kept constant in the initial stage because of frequent jams of limestone screw auger. The
operation seemed stable after load tuning when the measurement of air pollutants began. Smaller
sizes of limestone were used during this test. The Ca/S ratio was set at about 4.5. Temperatures
of the CFBC system at different locations are shown in Figure 14-3. It seemed variations of
temperatures could be controlled within 100 oF. As indicated in Table 10-1 and Figure 14-4, the
average temperatures along the CFBC system height gradually decreased as those did in the
previous test. Just above the windbox, the temperature was the highest at about 1547 oF. In the
major parts (from R1 to R8 inside CFBC system riser), the temperature could be controlled
above 1350 oF. Only the temperature of R5 in the riser was unusually low (1285 oF) because of
the larger coolant flow rate was used. The temperature of the secondary cyclone at the top of the
CFBC system was about 768 oF.
As indicated in Figure 14-1 and Table 10-2, the coal feed rate was kept slightly lower, about
146.3 lb/hr, but CW started to be fed at an average rate of 32.1 pounds per hour when the CFBC
system was switched for operations at a co-firing mode. Therefore, the thermal input by the fuels
ICSET, WKU 081008 76
ESTABLISHMENT OF AN ENVIRONMENTAL CONTROL TECHNOLOGY LABORATORY WITH A CIRCULATING FLUIDIZED-BED COMBUSTION SYSTEM
feed was about 385 kW and thermal output by HX was increased to about 254 kW. The feed rate
of the primary air was also kept constant and averaged at about 12.37 pounds per minute (at
standard condition) and 2.87 pounds per minute for the secondary air on average. The ratio of
secondary air to the total air was about 18.8 %. The air delivery into the CFBC system through
the lower loop seal was still at about 1.08 pounds per minute, a ratio of about 7.1%. Throughout
the testing, the limestone feed rate was kept constant. The Ca/S ratio was slightly lower at 3.7
during co-firing of the PRB coal and the CW. Operational conditions during co-firing were
maintained really equivalent to those used during the firing of PRB coal only.
The operation was stable, as shown in Figure 14-3 which illustrates temperature variation
over time. Temperature variations at different locations can be controlled within 100 oF, except at
location R4 to R8. As indicated in Table 10-1 and Figure 14-4, similar temperatures could be
found during co-firing compared to during PRB coal firing only, but was slightly higher
compared to two cases at different locations. Just above the windbox, the temperature was
maintained at about 1546oF at R1 for the firing of PRB coal only, versus 1537oF for co-firing. In
the majority of locations (from R1 to R8 inside CFBC system riser, temperatures were
appreciably lower than expected and varied between 1200 oF and 1400 oF during co-firing.
Figures 14-5 and 14-6 present variations of CO, CO2 and O2, SO2 and NO during when firing
PRB coal only or co-firing PRB coal and CW. There were no major differences in operations,
which are represented by O2 and CO2 concentrations. Under both operational conditions, O2 and
CO2 at the flue gas exit varied between 0.68 % and 1.1 % and between 18.9 % and 16.9 %,
respectively. Major differences were measured by air pollutant emissions of SO2, NO, N2O, as
well as CO at the flue gas exit. Carbon monoxide averaged 266 ppm under PRB coal only firing,
which was significantly lower than 5663 ppm on average under co-firing with PRB coal and CW.
Consequently, NO was very low under co-firing conditions: about 12 ppm. Higher
concentrations of reducing agents, such as CO present at concentrations at above 5000 ppm, was
likely responsible for the additional drop of NO during co-firing of PRB coal and CW. Nitrogen
oxide was about 34 ppm under PRB coal firing only. Similar to tests conducted on July 23, a
clear correspondence between NO and O2 was observed, as indicated in Figure 14-5. Therefore, a
better combustion performance inside the CFBC system should be responsible for the lower NO
emissions when firing PRB coal only. It is believed that these factors also impacted N2O
emissions, because lower emissions of N2O were found in both cases during tests conducted on
ICSET, WKU 081008 77
ESTABLISHMENT OF AN ENVIRONMENTAL CONTROL TECHNOLOGY LABORATORY WITH A CIRCULATING FLUIDIZED-BED COMBUSTION SYSTEM
July 30, 2008. Upon the firing of PRB coal only, the N2O emission rate was averaged at about
170ppm, and decreased to 110 ppm upon co-firing PRB coal and CW when CO is higher.
Despite this, high CO concentrations are not acceptable for the CFBC system. The higher CO
emissions could be attributed to lower system temperature caused by a lower secondary air ratio,
especially in the upper parts of system. A well maintained bottom temperature at R1 (1537 oF)
and a smaller size limestone improved the capture efficiency of SO2 by limestone in both cases
although the CW had an increased sulfur content. With these operational conditions, SO2
emissions were about 3.14 ppm for PRB coal only firing and was even lower at 1.25 ppm during
co-firing of PRB coal and CW.
Mercury CEM reported similar mercury emissions when firing only PRB coal in two tests on
July 23 and July 30, 2008. The total vapor gas mercury (Hg(VT)) was about 9.03 ug/NM3 with
over 89 % of Hg(VT) being elemental mercury (Hg(0)). After operations were switched to
co-fire coal with CW, Hg(VT) dropped slightly to 8.6 ug/NM3 on average with similar mercury
speciation. The CEM results also were verified by OHM, which reported similar Hg(VT) by 8.18
ug/NM3. A slight drop of mercury emissions are attributed to a decrease of mercury input, as
represented by the decrease of total mercury input in the fuels due to minimal mercury content in
the CW. The analysis of fly ash collected during the co-firing period, as shown in Table 8, also
supported this issue by reporting the miniscule amount of mercury captured by fly ash (about
0.006ppm) although LOI of collected fly ash was as high as about 30.2 %. The ineffectiveness of
fly ash to capture mercury was attributed to the higher Hg(0) content in the flue gas, which was
more than 90% Hg(VT). The higher occurrence of Hg(0) in the flue gas was the consequence of
a very low content of halogen species present in the flue gas in both operational modes, as
indicated in Table 10-1 and Table 10-2. The total halogen concentrations in the flue gas were
very low (below 1 ppm for both operational modes). Less halogen in the PRB coal may have
made transformation of the fuel’s halogen in the flue gas less effective. However, the high
chlorine content in the CW, as indicated in Table 8, seemed not to be the result of high mercury
oxidation. Investigation of a temperature profile inside the riser of the CFBC system revealed
that the likelihood of an optimal temperature range for halogen capture not only in limestone, but
also a higher content of alkali metal oxides or alkali earth metal oxides in fuels. The occurrence
of temperatures lower than 650oC in the upper part of the fluidized-bed combustor seemed to be
responsible for the reduction of gaseous chlorine as well as other halogen species, and
ICSET, WKU 081008 78
ESTABLISHMENT OF AN ENVIRONMENTAL CONTROL TECHNOLOGY LABORATORY WITH A CIRCULATING FLUIDIZED-BED COMBUSTION SYSTEM
ICSET, WKU 081008 79
consequently limited mercury emission reductions during co-firing. This study identified the
important impacts of temperature profiles and oxides of alkali metal (alkali earth metal) on
mercury emissions during co-firing in the circulating fluidized-ed combustor. Results obtained in
the 0.6MWth CFBC system matched those from the laboratory-BC facility, as indicated in the
Appendix of this report.
Trace metal measurement was only conducted when co-firing PRB coal and CW. As
indicated in Table 10-2, emissions of major trace metals were still lower although several major
trace metals such as Cu, Mn and Zn in fed CW were higher, It seemed that Cu and Mn were
easily bound to the fly ash because of their lower concentration in flue gas (below 4.35 ug/NM3
which is the detection limit of the instrument). This was not true for Se and Zn, whose
concentrations were about 16.69 ug/NM3 and 22.50 ug/NM3 in the flue gas, respectively. It was
understandable to find a higher occurrence of Zn in the flue gas with its lower vapor pressure. A
surprisingly higher amount of Se also occurred in the flue gas. This may have been attributed to
operational conditions.
Measurements of CPM at the flue gas exit are also shown in Table 10-1 for firing PRB coal
only. Results from firing PRB coal only indicated that the total CPM was extremely low at 2.46
mg/NM3. The organic portion was only about 0.15 mg/NM3. Better combustion performance
seemed to help control the CPM emissions during when firing only PRB coal only.
Characterization of ions in inorganic CPM indicated that the major ion was HNO3-1, which was
about 1.98 mg/NM3.
The major organic species found during co-firing of PRB coal and CW, including VOCs and
semi-VOCs, is reported in Table 10-2. Emissions of the VOCs and semi-VOCs were both below
the detection limit of instrument during co-firing, except for unusual higher level of benzene at
12.8mg/NM3 and styrene at 15.3ug/NM3in the VOCs, and pysidine at 21.3 ug/NM3. Co-firing
PRB coal with CW should be repeated in a future study to eliminate CO and VOC and
semi-VOCs,.
ESTABLISHMENT OF AN ENVIRONMENTAL CONTROL TECHNOLOGY LABORATORY WITH A CIRCULATING FLUIDIZED-BED COMBUSTION SYSTEM
ICSET, WKU 081008 80
0
100
200
300
400
500
600
700
800
0:00 2:24 4:48 7:12 9:36 12:00 14:24 16:48time
feed
ing
rate
,lb/
hr
0.0
100.0
200.0
300.0
400.0
500.0
600.0
CFB
C lo
ad, K
W
coal feeding limestone feeding PRB Coal Only Co-firing of PRB Coal and CWCW feeding load output by HXLoad by fuels input
Figure 14-1. Variations of Coal Feeding, Limestone Feeding, WP Feeding and Load during Tests Conducted on July 30, 2008
ESTABLISHMENT OF AN ENVIRONMENTAL CONTROL TECHNOLOGY LABORATORY WITH A CIRCULATING FLUIDIZED-BED COMBUSTION SYSTEM
ICSET, WKU 081008 81
0
5
10
15
20
25
30
0:00 2:24 4:48 7:12 9:36 12:00 14:24 16:48
time
air f
eedi
ng ra
te, l
b/m
in
0
5
10
15
20
25
30
seco
ndar
y ai
r pre
sent
age
Primary air feeding
total secondary air feeding
loop seal air
secondary air presentage,%
PRB Coal Only Co-firing of PRB Coal and CW
Figure 14-2. Variations of Supplies of the Primary Air, the Secondary Air and the Loop Seal Air during Tests Conducted on July 30, 2008
ESTABLISHMENT OF AN ENVIRONMENTAL CONTROL TECHNOLOGY LABORATORY WITH A CIRCULATING FLUIDIZED-BED COMBUSTION SYSTEM
ICSET, WKU 081008 82
500.0
1000.0
1500.0
0:00 2:24 4:48 7:12 9:36 12:00 14:24 16:48
time
aver
age
tem
epra
ture
, F
R1 R2 R3
R4 R5-R8 R9-R11
PRB Coal Only Co-firing of PRB Coal and CW
Figure 14-3. Variations of Temperature Profiles over Time in CFBC System Riser during Tests Conducted on July 30, 2008
ESTABLISHMENT OF AN ENVIRONMENTAL CONTROL TECHNOLOGY LABORATORY WITH A CIRCULATING FLUIDIZED-BED COMBUSTION SYSTEM
ICSET, WKU 081008 83
500
1000
1500
2000
R1 Low
erR1 M
iddle
R1 Upp
erR2 L
ower
R2 Low
er-Midd
le
R2 Upp
er-Midd
leR2 U
pper
R3 Low
erR3 M
iddle
R3 Upp
erR4 L
ower
R4 Upp
er R5 R6 R7 R8 R9
R10 R11
locations
aver
age
tem
pera
ture
,F
PRB coal firingCo-firing PRB coal and CW
Figure 14-4. Average Temperature Profiles during the Firing of PRB Coal only and the Co-firing of PRB Coal with CW
ESTABLISHMENT OF AN ENVIRONMENTAL CONTROL TECHNOLOGY LABORATORY WITH A CIRCULATING FLUIDIZED-BED COMBUSTION SYSTEM
ESTABLISHMENT OF AN ENVIRONMENTAL CONTROL TECHNOLOGY LABORATORY WITH A CIRCULATING FLUIDIZED-BED COMBUSTION SYSTEM
Figure 15-4. Variations of NO, SO2 and O2 at the Full-Load Operation and the Load Tuning Period
0
100
200
300
400
7:55:12 AM 10:19:12 AM 12:43:12 PM 3:07:12 PM 5:31:12 PMTime
NO
or S
O2,
ppm
0
1
2
3
4
5
O2,
%
NO(ppm) SO2(ppm) O2(%)
Full Load & Co-Firing
ICSET, WKU 081008 95
ESTABLISHMENT OF AN ENVIRONMENTAL CONTROL TECHNOLOGY LABORATORY WITH A CIRCULATING FLUIDIZED-BED COMBUSTION SYSTEM
ICSET, WKU 081008 96
Figure 15-5. Variations of CO, CO2 and O2 at the Full-Load Operation and the Load Tuning Period
0
1000
2000
3000
4000
5000
7:55:12 AM 10:19:12 AM 12:43:12 PM 3:07:12 PM 5:31:12 PMTime
CO
, ppm
0
5
10
15
20
25
30
O2
or C
O2,
%
CO(ppm) O2(%) CO2(%)
Full Load & Co-
ESTABLISHMENT OF AN ENVIRONMENTAL CONTROL TECHNOLOGY LABORATORY WITH A CIRCULATING FLUIDIZED-BED COMBUSTION SYSTEM
ICSET, WKU 081008 97
Table 11. Operational Parameters and Emission Concentrations of Air Pollutants during the Co-firing of with WP at the Full-load Operation and the Load Tuning Period.
ESTABLISHMENT OF AN ENVIRONMENTAL CONTROL TECHNOLOGY LABORATORY WITH A CIRCULATING FLUIDIZED-BED COMBUSTION SYSTEM
6. Conclusion The renovation of a new space for a 0.6 MWth Circulating Fluidized-Bed Combustor (CFBC)
system, which is also a new combustion laboratory, was completed and fully compatible with the
designed CFBC system. Half of the space is underground in relationship to this new combustion
laboratory and has also been used to set up the laboratory-scale reactor, which generated a large
quantity of relevant data to facilitate the operation of the 0.6MWth CFBC system.
Prior to the design of the 0.6 MWth CFBC system, the design calculations, including the mass
balances, energy balances, heat transfer, facility strength, and construction dimensions were
completed following intensive discussions. Comments received from various experts were also
used to improve the design. A detailed design of supporting and hanging structures for the CFBC
system was also completed. Discussions with potential contactors regarding the availability of
materials and current machining capabilities resulted in the first modification of the original
design. The CFBC system coolant production and feed water supply system were strengthened
with the addition of a boost pump to assure that coolant can be applied to the cooling system
under all operating conditions. Except for the main body of the CFBC facility, the induced draft
fan, along with its machine base and power supply, was received and installed. The flue gas duct
from the secondary cyclone outlet to the induced draft fan inlet was received and installed, as
well as the induced fan flue gas discharge duct. Additionally, a dust control system was installed,
which helps maintain a cleaner and safer work environment around the fuel and limestone
bunkers during filling operations. Further, all materials for the high temperature insulation of the
riser, both cyclones and the downcomer, have been installed. Additional thermal expansion joints
were installed, first from the ash supply duct to the lower loop seal; and second from lower loop
seal to the riser at R1. The purpose of installing additional thermal expansion joints provides a
stable support for the riser and downcomer, as well as safely accommodating the dramatic
change in length experienced under high temperature operations. The third modification of the
CFBC system started after the initial firing in early 2008. Major modification included an
additional heat exchanger and sensor ports as well as sampling ports. During an earlier CFBC
system test, excessive temperatures were experienced in the at R3/R4 riser flange joint when
system load was brought up. Some riser insulation components were damaged. A design review
also indicated that this area of the riser would likely benefit from additional heat exchange
surface below this area.
ICSET, WKU 081008 98
ESTABLISHMENT OF AN ENVIRONMENTAL CONTROL TECHNOLOGY LABORATORY WITH A CIRCULATING FLUIDIZED-BED COMBUSTION SYSTEM
Substantial progress was made on the development and application of software for the
effective operation and safe control of the CFB system, as well as for the display and logging of
data and operating parameters. Electric power distribution for pumps, blowers, variable speed
drives, valves and the bed preheater was completed. Installation of CFBC system temperature,
pressure, coolant and air flow sensors, as well as, load cells were completed, along with actuator
installation and wiring. Calibration, display and logging of pressure and air flow sensor data was
complete.
Powder River Basin (PRB) coal was used for performance evaluation of this CFBC system.
Slag from an operating integrated gasification combined cycle (IGCC) facility and a fly ash from
a full-scale CFBC utility boiler were used to recirculate fly ash during initial “hot-modeling”
tests. For co-firing tests, biomass (wood pallet and chicken waste) was prepared. Wood pallet has
a higher fluorine content, and CW has very high chlorine content.
Three full evaluation tests were conducted under different loads and firing of different
mixtures of fuels. Finally, an evaluation of the 0.6 MWth CFBC system at its full-load and its
tuning were conducted on August 7, 2008. The purpose of this test was to investigate whether
different sections of the CFBC system can properly function under full-load or over full-load, as
well as during tuning. Special focus was on evaluating the optimal particle size of the feed fuels;
the compatibility of feeding materials including fuels and air; the maximum heat exchange
capability; and ash recirculation capability by the loop seal. During this period, PRB coal and
WP were co-fired.
Evaluation of tests on CFBC system performance indicated that load tuning, fuel switching
and the heat transfer by available heat exchangers were successful. Feeding the coal and
delivering different air streams inside the CFBC system was constant and smooth. The heat
expansion joint worked perfectly to absorb system expansion under high temperatures. Improved
setup of the control system and signal collection and transfer system made CFBC system
operation less personnel intensive. The current CFBC system could work properly under a low
ash recirculation rate with the assistance of two cyclones and two loop seals. Loss on ignition
(LOI) in fly ash at the flue gas exit of the CFBC system, which was about 18%, was acceptable
under the current initial full-load operation. However, a future modification of the air delivery
system into a low loop seal was initiated to reduce the probability of losing ash re-circulation that
occurred during full-load operation on the final test. Finally, a lack of enough high pressure air
ICSET, WKU 081008 99
ESTABLISHMENT OF AN ENVIRONMENTAL CONTROL TECHNOLOGY LABORATORY WITH A CIRCULATING FLUIDIZED-BED COMBUSTION SYSTEM
ICSET, WKU 081008 100
was found to be responsible for the failure of ash recirculation in the loop seal. A few additional
tests will be performed after this report is submitted.
Major air pollutant concentrations (including SO2, NO, N2O, CO, mercury (Hg), condensable
particulate matters (CPM), sulfuric mist (SO3), halogens, trace metals) were measured during the
three full evaluation tests. Test results indicated that limestone could effectively control SO2
emissions, but its effectiveness was dependent on the temperature profile of the CFBC system
and the particle size distribution of the limestone. Oxygen concentration, available reducing
agents, and system temperature profiles had major impacts on both NO and N2O emission
concentrations. Co-firing coal and biomass could increase CO and VOCs and semi-VOC
emissions. Good combustion performance inside CFBC system could largely abate emissions of
CO, VOCs and semi-VOCs. Trace metals were not a major issue during the test firing. However,
mercury was not efficiently controlled. Several major halogens, which impacted mercury
oxidation, were probably effectively controlled by limestone and also alkali earth metal oxides in
the feed materials Higher portions of the elemental mercury inside the flue gas seemed to have
less chance of being adsorbed on the fly ash. On the other hand, lack of availability of common
air pollutant control devices (APCD), which have been applied in the industrial CFBC facility,
made the unexpected mercury removal efficient.
ESTABLISHMENT OF AN ENVIRONMENTAL CONTROL TECHNOLOGY LABORATORY WITH A CIRCULATING FLUIDIZED-BED COMBUSTION SYSTEM
7. Acknowledgement Financial support for this project was provided by the U. S. Department of Energy National
Energy Technology Laboratory (Cooperative Agreement NO. DE-FC26-03NT41840). Financial
support of the Electric Power Research Institute (EPRI) on field testing for development of
advanced additives on the mercury oxidation and adsorption, which is also part of this project, is
also greatly appreciated.
The contributions of utilities to the success of this project are also recognized. They are:
Eastern Kentucky Power Cooperative (EKPC)
We-Energies
Electric Energy, Inc. (EEI)
Southern Illinois Power Cooperative (SIPC)
Illinois Clean Coal Institute (ICCI)
The efforts of the following key members of project task are recognized:
Emissions monitoring – Cheng-Li Wu, Junjie Fan, Tuo Zhou
Engineering and Mechanics Task – Martin Cohron, Roiha Kimmo (VTT), Kevin Duckett
Wendall Myers, Richie Botkin
Finally, the contributions of the project team members and test crews who actually executed the
project work are greatly appreciated.
ICSET, WKU 081008 101
ESTABLISHMENT OF AN ENVIRONMENTAL CONTROL TECHNOLOGY LABORATORY WITH A CIRCULATING FLUIDIZED-BED COMBUSTION SYSTEM
8. Publications 1. Yan, Cao; Chin-Min, Cheng; Chien-Wei, Chen; Mingchong, Liu; Chia-Wei, Wang; Wei-Ping, Pan. “Abatement of Mercury Emissions in the Coal Combustion Process Equipped with a Fabric Filter Baghouse,” Fuel 87,3322-3330, 2008. 2. Yan, Cao; Zhengyang, Cao; Jing, Jin; Hongcang, Zhou; Martin, Cohron; Houyin, Zhou; Hongying, Liu; Wei-Ping, Pan. “Synthesis Gas Production with an Adjustable H2/CO Ratio through the Coal Gasification Process: Effects of Coal Ranks and Methane Addition,” Energy & Fuel, 2008, 22, 1720–1730. 3. Yan, Cao; Zhengyang, Gao; Jiashun, Zhu; Quanhai, Wang; Yaji, Huang; Chengchung, Chui; Bruce, Bruce; Paul, Paul; Wei-Ping, Pan; " Impact of Halogen Additions on Mercury Oxidation in a Slipstream Selective Catalyst Reduction (SCR), Reactor When Burning Sub-Bituminous Coal," Environmental Science & Technology, 2008, 42, 256-261. 4. Hongcang, Zhou; Yan, Cao; Houyin, Zhao; Hongying, Liu; Wei-Ping, Pan. “Investigation of H2O and CO2 Reforming and Partial Oxidation of Methane” Catalytic Effects of Coal Char and Coal Ash,” Energy & Fuel,22, 2341-2345, 2008. 5. Yan, Zhang; Hong, Cui; Riko, Ozao; Yan, Cao; Bobby, Chen; Chia-Wei, Wang; Wei-Ping, Pan. “Characterization of Activated carbon Prepared From Chicken Waste and Coal,” Energy & Fuels, 2007, 21, 3735-3739. 6. Hong, Cui; Yan, Cao; Wei-Ping, Pan. “Preparation of Activated Carbon for Mercury Capture from Chicken Waste and Coal,” J. Anal. Appl. Pyrolysis, 2007, 80(2), 319-324. 7. Songgeng, Li; Andy, Wu; Shuang, Deng; Wei-Ping, Pan. “Effect of Co-combustion for Chicken Litter and Coal on Emissions in a Laboratory-scale Fluidized Bed Combustor,” Fuel Processing Technology, 2007, 89, 7-12. 8. Yan, Cao; Quanhai, Wang; Chien-wei, Chen; Bobby, Chen: Martin, Cohron; Y-chuan, Tseng; Paul, Chu; Wei-Ping, Pan. “Investigation of Mercury Transformation by HBr Addition in a Slipstream Reactor with Real Flue Gas Atmospheres of Bituminous Coal and Powder River Basin (PRB) Coal,” Energy & Fuels, 2007, 21, 2719-2730. 9. Yan Cao, Bobby Chen, Jiang Wu, Hong Cui, John Smith, Chi-Kuan Chen, Paul Chu and Wei-Ping Pan, “Study of Hg Oxidation by Selective Catalytic Reduction Catalyst in a Pilot-scale Slipstream Reactor at a Utility Boiler Burning Bituminous Coal” . Energy & Fuels, 2007, 21, 145-156. 10. Nathan Whitely*, Riko Ozao, Ramon Artiaga, Yan Cao and Wei-Ping Pan, “Multi-utilization of Chicken Litter as Biomass Source – Part I. Combustion,” Energy & Fuels, 2006, 20, 2660-2665 . 11. Nathan Whitely*, Riko Ozao, Yan Cao and Wei-Ping Pan, “Multi-utlization of Chicken Litter as Biomass Source – Part II. Pyrolysis,” Energy & Fuels, 2006, 20, 2666-2671.
ICSET, WKU 081008 102
ESTABLISHMENT OF AN ENVIRONMENTAL CONTROL TECHNOLOGY LABORATORY WITH A CIRCULATING FLUIDIZED-BED COMBUSTION SYSTEM
ICSET, WKU 081008 103
13. Yan Cao, Bianca Casenas*, and Wei-Ping Pan, “Investigation of Chemical Looping Combustion by Solid Fuels 2. Redox Reaction Kinectics and Product Characterization with Coal, Biomass and Solid Waste as Solid Fuels and CuO as Oxygen Carrier,” Energy & Fuels, 2006, 20, 1845-1854. 14. Yan Cao, Yang Wang, Joho T.Rily, W.-P. Pan, “A novel biomass air gasification process for producing tar-free higher heating value fuel gas,”Fuel Processing Technology 87 (2006) 343-353 15. R. Ozao, T. Okabe, T. Arii, Y. Nishimoto, Yan. Cao, N. Whitely, and W.-P. Pan, “Gas and Mecury Adsorption Properties of Woodceramics Made from Chicken Wastes,” Energy & Fuels , 2005, 19,1729-1734. 16. Yan Cao, Quan-Hai Wang, Jun Li, Jen-Chieh Cheng, Chia-Chun Chan, Marten Cohron, and Wei-Ping Pan. “Enhancement of Mercury Capture by the Simultaneous Addition of Hydrogen Bromide (HBr) and Fly Ashes in a Slipstream Facility” Environmental Science & Technology ,submitted. 17. Yan Cao, Hou-Zhao, Quan-hai Wang, Jun Li, Jen-Chieh Cheng, Chia-Chun Chan, Wei-Ping Pan. “Impact of the Addition of Hydrogen Bromide on Lower Temperature Ductwork Corrosion in a Powder River Basin Flue Gas Atmosphere: Slipstream Test Results”. Fuel Processing Technology, submitted. 18. Yan Cao, Hongcang Zhou, Junjie Fan, Houyin Zhao, Tupo Zhou, Pauline Hack, Chia-Chun Chan, Wei-Ping Pan. “Mercury Emissions during Co-firing of Sub-bituminous Coal and Biomass (Chicken Waste, Wood, Coffee Residue and Tobacco Stalk) in a Lab-Scale Fluidized Bed Combustor” Environmental Science & Technology, submitted.
ESTABLISHMENT OF AN ENVIRONMENTAL CONTROL TECHNOLOGY LABORATORY WITH A CIRCULATING FLUIDIZED-BED COMBUSTION SYSTEM
9. Appendix I 9.1 Tests in a Lab-scale Fluidized Bed
Test Facility. The fluidized bed co-firing combustor has seven major components, as shown
in Figure A1. It includes the electrically-heated main body of the fluidized bed combustor; one
fuel hopper and one fuel screw feeder; a compressed air-delivery line and its metering flow
meter; a flue gas cleanup unit, including a cyclone and a high temperature quartz filter assembly,
as well as a wet scrubber. Under the oxygen-firing mode, an oxygen cylinder and flow meter
provides oxygen supply and flow control. Simultaneously, a CO2 cylinder is available to deliver
a CO2 stream for dilution purposes. In this study, results for the oxygen-firing mode were not
included. The outside diameter (OD) of the combustor is about 6.4 cm and 1.6 cm thick. The
height of the combustor is 110 cm. There is a gas distributor mounted at the bottom of the
combustor with a 1 % opening to prevent a maldistribution of gas passing through bed material.
The combustor temperatures are monitored by a platinum-rhodium thermocouple, which is
sealed in a stainless steel tube in the combustor. The thermocouple could be moved inside the
tube to monitor temperatures along the height of the combustor, as indicated in Figure A1. The
bed temperature was 850 - 900 oC in the main portion of the combustor at the bottom, but
gradually started to decrease to 450 oC starting at 2/3 of the distance from the combustor’s
bottom. The fuel mixtures for co-firing were fed into the combustor through a coal feeder on the
top of the combustor. The maximum mixing ratios were 50 %. The fluidized bed combustor was
generally operated at a velocity 3-5 times that of Umf (the minimum fluidization velocity). The
excessive air ratio was maintained at about 1.2, while the oxygen concentration at the combustor
outlet was about 6.0-8.0 %. The flue gas produced with the char residue at the top outlet of the
combustor was collected by combining the cyclone and a porous quartz metal filter. The cleaned
flue gas was delivered to either gas analyzers (O2, SO2, and mercury) or collection impingers to
determine the presence and amount of mercury and halogens.
Initially, the fluidized bed combustor was electrically heated to 650oC. Then the coal was fed
into the combustor to increase the temperature. Initial ash produced was left in the combustor as
bed material. One hour later the temperatures began to approach 850oC. Air and coal fed into the
combustor were adjusted to stabilize the temperature across the combustor for a few hours. The
mercury variation was monitored continuously by the SCEM system. Ontario Hydra Method
(OHM) measurements (ASTM 6784-02) were applied to confirm the SCEM sampling results
ICSET, WKU 081008 104
ESTABLISHMENT OF AN ENVIRONMENTAL CONTROL TECHNOLOGY LABORATORY WITH A CIRCULATING FLUIDIZED-BED COMBUSTION SYSTEM
during test periods. The detailed description of two mercury test methods and QA/QC procedures
may be found in the references1-2. For every testing condition, at least two tests were conducted.
If no abnormal results were found, the average data was accepted.
Materials. One sub-bituminous coal and four types of biomass, (chicken waste (CW), wood
pallet (WP), coffee residue (CR) and tobacco stalk (TS)), were studied. Biomass has a much
lower bulk density, is generally moist, and has lower heating values and particle densities than
coal. Therefore, all raw fuels were first pulverized and sieved. The particle size of the coal
sample was 500 to 1000 μm, and those of the biomass were 1000 to 2000μm. The purpose of
using slightly larger biomass particles was to satisfy its fluidization conditions and residence
time. The selected coal and biomass was pre-mixed before being fed into the combustor. All
samples were dried in an oven at 100oC overnight before testing.
Analysis of all fuel samples in this study followed ASTM standard procedures. The detailed
description of these ASTM methods was described in a previous study1. Analysis results of all
tested fuels are presented in Table A1. All tested fuels have a high volatile content.
Sub-bituminous coal, CW and CR have comparable volatile content, which varies between 43.3
% and 54.2 % on a dry basis. Much higher volatile content was found in WP and TS, which are
both above 75%. CW had the highest ash content at 34.9 %, TS was 11.3 % and sub-bituminous
coal was below 10 %. Ash content in WP and CR was generally close to or below 1%. Sulfur
content in all fuels was low, at about 1% for CW, followed by 0.54 % for sub-bituminous coal
and 0.34 % for TS. Sulfur in CR and WP are even low. Chlorine content in all fuels was below
150ppm, except for CW and TS. CW had very high chlorine content (about 22300ppm). TS had
medium chlorine content (about 4500ppm). Only coal had measurable mercury at about 0.12ppm.
Mercury in all others was miniscule. The major metal oxides in the tested fuels are also shown in
the Table 1. This study indicates that sub-bituminous coal and CW and WP have a relatively high
content of CaO and MgO, which are about 25 % in total ash. All biomass has a higher occurrence
of alkali metal oxides, such as Na2O and K2O. Among them, CR and TS have more K2O, but no
N2O. However, the total amount of alkali earth metal oxides and alkali metal oxides should be
ignored for WP and CR because of their negligible ash contents. One may notice that CW and
CR also have a higher content of P2O5, which is about 17.5 %.
Impacts of Co-firing on Air Pollutants Emissions. Co-combustion tests of coal with CW
have been performed in a laboratory-scale fluidized bed combustor to study the effect of CW
ICSET, WKU 081008 105
ESTABLISHMENT OF AN ENVIRONMENTAL CONTROL TECHNOLOGY LABORATORY WITH A CIRCULATING FLUIDIZED-BED COMBUSTION SYSTEM
mass fraction and secondary air on the combustion and emission characteristics of the major
gaseous pollutants. Major conclusions from the test results can be summarized as follows:
• As CW mass fraction increases, the bed temperature decreases and the temperature in
the freeboard region increases. This is attributed to low fixed carbon and high volatile
matter contained in CW.
• The introduction of high volatile matter in CW causes CO emissions to be increased.
• SO2 emissions are lowered by adding CW as a result of fuel-S dilution and CW ash
derived natural desulfurization. The ratio of H2S to SO2 increases with a decrease of CW
mass fraction because high volatile matter released from CW creates a strong reducing
atmosphere that suppresses the oxidation of H2S.
• Introduction of CW at low concentrations causes higher NO emissions because more
fuel-N is introduced. However, high levels of CW may reduce NO emissions due to the
larger amount of released volatile matter, which suppresses the formation of NO.
• Secondary air introduction contributes to lower pollutant emissions.
Hg Emission during Co-firing. The mercury emission rates and removal efficiencies for the
test fuels are summarized in Figure A2 and A3. To accurately estimate the mercury emission
rates and removal efficiency during co-firing, a commonly-acceptable unit of mercury emission
rates (lb/TBtu) was used. The calculation of mercury emission rates was based on the calculation
of F-Factor in Eq (A1) and elemental analysis of fuels, which was introduced in EPA Part 75 -
Appendix A - Method 19. The mercury emission rate, during firing of sub-bituminous coal only,
was about 6.25 lb/TBtu. When co-firing CW and sub-bituminous coal (weight ratio of CW
introduction at 30 %), the mercury emission rate was largely reduced to about 1.27 lb/TBtu on
average. Increasing the introduction ratio of CW to 50 % during co-firing with sub-bituminous
coal, the mercury emission rate was continuously reduced to 1.02 lb/TBtu. It seemed that
mercury emissions were not significantly reduced when continuously increasing CW into the
combustor. Regardless of originally occurring alkali metal oxides and alkali earth metal oxides in
coal and CW, the additional alkali metal oxides (limestone) at Ca/S ratio of about 2.5 for SOx
capture were fed in the combustor during co-firing of 30 % CW and 70 % sub-bituminous coal.
The mercury emissions rate was about 3.48 lb/TBtu, which was much higher than when
limestone was introduced into the combustor. Limestone introduction resulted in increased
mercury emissions, although it was still lower than burning sub-bituminous coal alone.
ICSET, WKU 081008 106
ESTABLISHMENT OF AN ENVIRONMENTAL CONTROL TECHNOLOGY LABORATORY WITH A CIRCULATING FLUIDIZED-BED COMBUSTION SYSTEM
Switching co-firing fuels from CW to WP, CR or TS at the same mixing ratio, mercury
emissions were similar to co-firing CW and sub-bituminous coal, but with the introduction of
limestone. Mercury emission rates of co-firing WP, CR and TS with sub-bituminous coal were
about 3.32 lb/TBtu, 2.67 lb/TBtu and 3.21 lb/TBtu, respectively. In all cases, the co-firing
reduced mercury emission rates compared to burning sub-bituminous coal alone. Based on the
same thermal output in per trillion Btu, mercury emissions for co-firing CW with a greater
chlorine content was lowest. Co-firing with different biomass and limestone additions seemed to
affect mercury emission rates and mercury removal efficiencies. We achieved a 37.9 % mercury
removal efficiency for burning sub-bituminous coal alone. Co-firing with CW at 30 % and 50 %
greatly improved mercury removal efficiency at 83.6 % and 84 %, respectively. Limestone
introduction reduced mercury removal efficiency to 55.7 % when co-firing CW at a ratio of 30 %.
Co-firings of WP, CR and TS with sub-bituminous coal (at ratio of 30 % biomass to 70% coal)
had similar mercury removal efficiencies (52.9 %, 62.1 % and 59.1 %, respectively).
Because only a filter was used to remove mercury by deposited fly ash on the filter when
co-firing biomass and sub-bituminous coal, reductions of mercury emissions likely suggested an
increase of the particle-bound mercury. Co-firing CW with more chlorine indicated more
particle-bound mercury was gained, but not always when the introduction of CW to weight ratio
was continuously increased from 30 - 50 %. The higher chlorine content in CW may have helped
to enhance the mercury capture by fly ash generated. However, this effect was eliminated by the
introduction of limestone. Limestone introduction may have decreased the availability of
chlorine on mercury oxidation and consequently may have decreased the mercury capture by fly
ash. Co-firing biomass with lower chlorine content, such as WP and CR, did not significantly
reduce mercury emission rates compared to those during co-firing with CW. Chlorine content in
co-firing fuels seemed to be essential on mercury emission rates. However, this was not true for
TS. Although it has an appreciable amount of chlorine in it, its mercury emission rate was
comparable to those of fuel mixtures with low chlorine content.
F = F-factor (dscf/mmBtu)
F = 106[3.64(% H) + 1.53(% C) + 0.57(% S) + 0.14(% N) - 0.46(% 0)]/GCV
Eq(A1)
Where % H, % C, % S, % N and O %) = weight percent (dry basis) of each element as
obtained from the elemental fuel analysis.
ICSET, WKU 081008 107
ESTABLISHMENT OF AN ENVIRONMENTAL CONTROL TECHNOLOGY LABORATORY WITH A CIRCULATING FLUIDIZED-BED COMBUSTION SYSTEM
GVC = gross calorific value of fuel (Btu/lb, dry basis).
The mercury speciation at the fluidized bed combustor outlet (after the filter), is shown in
Figure A3. Almost 90 % of the total gaseous mercury was elemental mercury after flue gas
passed through the filter, when sub-bituminous coal or a combination of sub-bituminous coal and
WP, CR and TS was burned. When the co-fired fuel was CW and sub-bituminous coal, the
mercury speciation analysis indicated about 50 % of the total gaseous mercury was elemental
mercury. Therefore, almost 50 % of the oxidized mercury still in flue gas after fly ash filtration
and the oxidized mercury were not fully captured by the fly ash generated when CW was
co-fired. With the introduction of limestone, the elemental mercury was 90 % even when
co-firing with CW.
It has been reported that the oxidized mercury has more affinity to the surface of fly ash than
the elemental mercury3. The adsorption of the oxidized mercury on the fly ash occurred instead
of the elemental mercury. The elemental mercury needs the additional oxidization step on the fly
ash surface prior to its adsorption. However, effectiveness of the oxidized mercury capture by fly
ash was also dependent on its contact efficiency with fly ash and residence time. Co-firing CW,
inefficient capture (nearly 50 %) of the oxidized mercury by fly ash on the filter may suggest less
residence time for its capture by fly ash. This assumption seems reasonable because higher
contacting efficiency was generally found for mercury and fly ash on the filter. In those cases of
firing fuels with less chlorine content, occurrences of almost 90 % of the elemental mercury may
suggest either not much oxidized mercury in flue gas before the filtration step, or little elemental
mercury can be oxidized by generated fly ash on the filter after flue gas passes through the fly
ash cake on the filter. Therefore, it is difficult to conclude that the mercury adsorption on the fly
ash was strongly correlated to the occurrence of the oxidized mercury in the flue gas. In this
study, only the temperature of the filter (about 150 oC) was suitable for mercury adsorption on
the fly ash, but not for the fly ash in the cyclone because of a temperature greater than 250 oC.
Mercury oxidation is strongly dependent on chlorine content in the flue gas. This was
corroborated during the investigation of chlorine content in flue gas, which is shown in Figure
A4. When sub-bituminous coal was burned, HCl and Cl2 concentrations in the flue gas were 1.42
ppm and 1 ppm, respectively. When it was co-fired with CW at 30 %, HCl and Cl2
concentrations dramatically increased to 28.2 ppm and 1.85 ppm, respectively. Continuously
ICSET, WKU 081008 108
ESTABLISHMENT OF AN ENVIRONMENTAL CONTROL TECHNOLOGY LABORATORY WITH A CIRCULATING FLUIDIZED-BED COMBUSTION SYSTEM
increasing the co-firing ratio of CW to 50 %, HCl and Cl2 concentrations also increased to 36.5
ppm and 1.91 ppm, respectively.
It seemed that the introduction of limestone largely controlled the occurrence of chlorine
species in the flue gas, which made occurrences of HCl and Cl2 drop to 1.81 ppm and 1.01 ppm,
respectively. This was similar to burning sub-bituminous coal only. Co-firing WP and CR had
similar HCl and Cl2 profiles, which were 1.23 ppm and 1.25 ppm during co-firing of WP and
1.46 ppm and 106 ppm during the co-firing of CR. Hydrogen chloride (HCl) and Cl2 were about
7.32 ppm and 2.05 ppm for co-firing TS, which corresponded to its higher chlorine content in
feeding TS. The mercury emission rates and mercury speciation strongly correlated to the
occurrence of chlorine in the flue gas. Introducing CW greatly increased the occurrence of the
total availability of chlorine species in the flue gas, which was supposed to contribute to the
oxidation of the elemental mercury. Introduction of limestone in co-firing CW greatly eliminated
the occurrence of chlorine in flue gas, which resulted in the reduction of the mercury oxidation.
This was very similar to cases when co-firing biomass with low chlorine content, such as WP
and CR. Comparably high chlorine content was found in both CW and TS. But the majority of
chlorine in these two co-firing fuels did not occur in the gas phase. However, it did in the fly ash,
based on the assumption of mass balance closure of chlorine. This could explain why the
increasing co-firing ratio of CW and co-firing of high chlorine TS did not significantly increase
the partition of particle-bound mercury and further reduction of gaseous mercury emission rates.
This also agreed with the previous study that stated the increase of chlorine inputs did not
necessarily lead to increased oxidized mercury4-5.
The presence of less chlorine in the gas phase was better explained by the investigation of
greater content of alkali metal oxides (Na2O and K2O) and alkali earth metal oxides (CaO and
MgO) in tested fuels. The mole ratios of the total CaO, MgO, Na2O and K2O to chlorine (ROMC)
in tested fuels are shown in Figure A5. This ratio was as high as approximately 250 oC for
sub-bituminous coal, mainly due to the higher content of CaO and less chlorine in the
sub-bituminous coal. The ROMC greatly decreased to approximately eight when co-firing CW
with sub-bituminous coal because of very high chlorine content found in the CW. This ratio was
again close to that of burning sub-bituminous coal at approximately 190 oC during tests with
limestone introduction during the co-firing of CW and sub-bituminous coal. When co-firing 30
% WP and CR, The ROMCs were still higher because of less chlorine in these fuels. A
ICSET, WKU 081008 109
ESTABLISHMENT OF AN ENVIRONMENTAL CONTROL TECHNOLOGY LABORATORY WITH A CIRCULATING FLUIDIZED-BED COMBUSTION SYSTEM
considerable amount of ash occurred and higher content of CaO and K2O in TS made TS has
higher ROMC.
Alkali metal and alkali earth metal oxides can capture Cl in the flue gas more efficiently at a
temperature below 650 oC6. This typical temperature zone was found in the fluidized bed
combustor in this study. The major reactions between oxides of alkali metals and alkali earth
metals with sulfur in the flue gas occurred at temperatures about 800 oC. However, this could not
totally consume all oxides of alkali metals and alkali earth metals. Generally, ratios of alkali
metal oxides and alkali earth metals to sulfur were higher than three for the tested fuels, which
were far more than sufficient for sulfur capture. Considering just partial sulfur was generally
captured by these metal oxides, the utilization of available metal oxides for sulfur capture was
below 1, as indicated in Figure A6. The remaining metal oxides will be better reactants and also
sufficient for Cl capture. Previous studies by both thermodynamics equilibrium calculations7 and
co-firing tests4,8-9 indicated that their was a smaller occurrence of HCl and Cl2 in the flue gas,
especially when burning low-sulfur coal at temperatures below 800 oC. The availability of alkali
metal oxides should retain Cl species in the solid phase, which decreases gaseous Cl. Statistical
analysis correlating the amount of oxides of alkali metals and alkali earth metals (Ca+Mg+Na+K)
and the total gaseous chlorine is shown in Figure A7. This correlation was negative (increasing
metal oxides decreased the occurrence of gaseous Cl) and strong with the linear R-square value
of 0.98. Similarly, the correlation between gaseous chlorine and mercury emission rates is shown
in Figure A7. The linear R-square value was 0.75 for the gaseous chlorine and the mercury
emission rate correlation. Therefore, the lower occurrence of Cl in the gas phase, which was
attributed to a lower mercury oxidation rate, is a major reason for less mercury capture by fly ash
for all fuels except CW. A previous study10 by ICSET of WKU in a 0.1 MW FBC facility found
different trends on mercury speciation and mercury adsorption by fly ash co-firing high chlorine
coal with high chlorine PVC. Results indicated that when using high-chlorine coal in an FBC
system, the gas-phase mercury, which was around 45 % of the total mercury input, was primarily
in the oxidized state (40 % of the total mercury input), while only a small portion (4.5 % of total
mercury input) still existed as elemental mercury in the flue gas. Close to 55 % of the total
mercury input was found in the solid phase.
In this previous study, higher oxidized gaseous mercury and particle-bound mercury may
have contributed to the use of secondary air and lower oxide content of alkali metal and alkali
ICSET, WKU 081008 110
ESTABLISHMENT OF AN ENVIRONMENTAL CONTROL TECHNOLOGY LABORATORY WITH A CIRCULATING FLUIDIZED-BED COMBUSTION SYSTEM
ICSET, WKU 081008 111
earth metal in the tested bituminous coal. Generally, higher sulfur content was found in the
bituminous coal. Therefore, a lower ROMC ratio should be true when bituminous coal was
burned, even though limestone was introduced. Additionally, the secondary air may have
produced higher carbon-content fly ash, which is critical for mercury adsorption11. Furthermore,
the secondary air also increased the temperature in the upper portion of the fluidized bed
compared to secondary air injection. It was assumed that higher temperatures at the upper
portion of the combustor made captured Cl by limestone inefficient, and thus, more Cl remained
in the gas phase to oxidize the elemental mercury. Therefore, both higher content of alkali metal
oxides or alkali earth metal oxides in tested biomass, and the occurrence of temperatures lower
than 650 oC in the upper part of the fluidized bed combustor seemed to be responsible for the
reduction of gaseous chlorine, and consequently limited mercury emissions reduction during
co-firing. This study identified the important impacts of temperature profile and oxides of alkali
metals (alkali earth metals) on mercury emissions during co-firing in the fluidized bed
combustor.
ESTABLISHMENT OF AN ENVIRONMENTAL CONTROL TECHNOLOGY LABORATORY WITH A CIRCULATING FLUIDIZED-BED COMBUSTION SYSTEM
Figure A1. The Lab-scale Fluidized Bed Coal Combustor
0
20
40
60
80
100
120
140
0 250 500 750 1000
temperature, c
Dis
tanc
e, c
m
Measurement 1 Measurement 2
ICSET, WKU 081008 112
ESTABLISHMENT OF AN ENVIRONMENTAL CONTROL TECHNOLOGY LABORATORY WITH A CIRCULATING FLUIDIZED-BED COMBUSTION SYSTEM
ICSET, WKU 081008 113
Table A1. Proximate, Ultimate Analysis and Major Oxides of Coal and Biomass Samples (on a dry basis)
ESTABLISHMENT OF AN ENVIRONMENTAL CONTROL TECHNOLOGY LABORATORY WITH A CIRCULATING FLUIDIZED-BED COMBUSTION SYSTEM
Figure A2. The Variation of Mercury Emission during Co-firing of Sub-bituminous Coal and Biomass
0
2
4
6
8
10
12
PRB
70%PRB+3
0%CW
50%PRB+5
0%CW
70%PRB+3
0%CW
+2.5C
a/S
70%PRB+3
0%WP
70%PRB+3
0%CR
70%PRB+3
0%TS
Hg in Fuels
mer
cury
in c
oal o
r mer
cury
em
issi
on ra
te, l
b/TB
tu Hg emission rates-SCEM
Hg emission rates-OHM
83.8%84%
55.7% 52.9%62.1%
59.1%
37.9%
ICSET, WKU 081008 114
ESTABLISHMENT OF AN ENVIRONMENTAL CONTROL TECHNOLOGY LABORATORY WITH A CIRCULATING FLUIDIZED-BED COMBUSTION SYSTEM
ICSET, WKU 081008 115
Figure A3. The Mercury Speciation during Co-firing of Sub-bituminous Coal and Biomass
0.0%
20.0%
40.0%
60.0%
80.0%
100.0%
PRB
70%PRB+3
0%CW
50%PRB+5
0%CW
70%PRB+3
0%CW+2
.5Ca/S
70%PRB+3
0%W
P
70%PRB+3
0%CR
70%PRB+3
0%TS
Hg(
0)/H
g(V
T), %
ESTABLISHMENT OF AN ENVIRONMENTAL CONTROL TECHNOLOGY LABORATORY WITH A CIRCULATING FLUIDIZED-BED COMBUSTION SYSTEM
ICSET, WKU 081008 116
Figure A4. The Gas Phase Chlorine Concentration in the Flue Gas during Co-firing in the Fluidized Bed Combustor
0
5
10
15
20
25
30
35
40
PRB
70%PRB+3
0%CW
50%PRB+5
0%CW
70%PRB+3
0%CW+2
.5Ca/S
70%PRB+3
0%W
P
70%PRB+3
0%CR
70%PRB+3
0%TS
HC
l or C
l2, p
pm
HCl Cl2
ESTABLISHMENT OF AN ENVIRONMENTAL CONTROL TECHNOLOGY LABORATORY WITH A CIRCULATING FLUIDIZED-BED COMBUSTION SYSTEM
ICSET, WKU 081008 117
Figure A5. The Ratios of (Ca+Mg+Na+K)/Cl in Tested Fuels during Co-firing in the Fluidized Bed Combustor
0.00
50.00
100.00
150.00
200.00
250.00
300.00
PRB 70% PRB +30% CW
50% PRB +50% CW
70% PRB +30% CW + 2.5
Ca/S
70% PRB +30% WP
70% PRB +30% CR
70% PRB +30% TS
(Ca+
Mg+
Na+
K)/C
l, m
ol/m
ol
ESTABLISHMENT OF AN ENVIRONMENTAL CONTROL TECHNOLOGY LABORATORY WITH A CIRCULATING FLUIDIZED-BED COMBUSTION SYSTEM
ICSET, WKU 081008 118
Figure A6. Sulfur Removal Efficiency or (Ca+Mg+Na+K)/S of Mixing Fuels during Co-firing in the Fluidized Bed Combustor
0.0%
100.0%
200.0%
300.0%
400.0%
500.0%
600.0%
700.0%
800.0%
900.0%
1000.0%
PRB
70%PRB+3
0%CW
50%PRB+5
0%CW
70%PRB+3
0%CW
+2.5C
a/S
70%PRB+3
0%W
P
70%PRB+3
0%CR
70%PRB+3
0%TS
Sul
fur r
emov
al e
ffici
ency
in %
, or (
Ca+
Mg+
Na+
K)/S
Sulfur Removal Efficiency, %Ratio of (Ca+Mg+Na+K+Na)/S
ESTABLISHMENT OF AN ENVIRONMENTAL CONTROL TECHNOLOGY LABORATORY WITH A CIRCULATING FLUIDIZED-BED COMBUSTION SYSTEM
ICSET, WKU 081008 119
Figure A7. The Correlation of Mercury Emission Rate and Gaseous Cl, the Correlation of Gaseous Cl and (Ca+Mg+Na+K)/Cl
1
10
100
1 10 100 1000
gaseous Cl in ppm, or (Ca+Mg+Na+K)/Cl
mer
cury
em
issi
on in
lb/T
Btu
, or g
aseo
us C
l
Correlation between mercury emission and gaseous chlorine Correlation between gaseous Cl and ((Ca+Mg+Na+K)/Cl)
R2 = 0.976
R2 = 0.747
ESTABLISHMENT OF AN ENVIRONMENTAL CONTROL TECHNOLOGY LABORATORY WITH A CIRCULATING FLUIDIZED-BED COMBUSTION SYSTEM
9.2 Tests in an SCR Slipstream Reactor Test Facility. A pilot-scale slipstream SCR reactor has been designed to simulate the
"full-scale" applications of an SCR system, as shown in Figure A8. The site setup picture is
shown in Figure A9. The SCR reactor was designed and manufactured in a concentric
configuration with inside pass for SCR catalyst loading where the main stream of flue gas passes
through, and an outside pass for the bypassed flue gas to pass through. The flue gas, which is
extracted from the well-insulated intake pipe before the SCR slipstream reactor, is split into two
streams whose ratio is controlled by manual flashboard valves to adjust the slot area of the
outside flue gas pass. The bypassed flue gas functions as a “strengthened” heat insulation due to
its higher temperature, which minimizes the heat transfer rate by decreasing the temperature
difference between the introduced main stream of flue gas and the bypassed flue gas stream.
Thus, this slipstream reactor was well insulated so that the temperature drop across the SCR
slipstream reactor was below 20 ºC. The section of inside pass is 0.152 by 0.152 square meter
(m2) and square in shape, and the outside pass is a one inch slot around the inside square. The
total height of the reactor is 6.6 meter (m). The pilot-scale SCR has a two-layer catalyst to
simulate variations in the residence time for gas-solid contact. Each catalyst chamber is 1 meter n
height. The specific locations of the sampling ports are in relation to the locations of the catalysts.
There are three sampling ports, which are located at inlets and outlets of each SCR catalyst bed.
The “inlet” refers to the location before the first catalyst layer, “middle” refers to the location
between the first and the second catalyst layers, and the “outlet” is the outlet of the second
catalyst layer.
To prevent the fly ash from depositing on the SCR catalysts, an ash-blower using compressed
air was designed and installed. The ash-blower control allows each catalyst layer to have the ash
purged with high-velocity compressed-air independently. Along with the ash-blower, their ports
have also been adapted to allow for pressure differential monitoring using a manometer. The
overall ash-blowing cycle time is determined by the length of time it takes for the pressure
differential to reach the upper limit. Generally, the first catalyst layer can be set for a blow cycle
of five seconds blowing at 30-minute intervals, while the second catalyst layer has a blow cycle
of eight seconds blowing at 30 minute intervals. With the aid of cross-catalyst differential
pressure monitoring, the ash buildup can be monitored and when the pre-determined upper
pressure level is reached, the ash-blowing sequence is activated to blow the ash, thereby bringing
120
ESTABLISHMENT OF AN ENVIRONMENTAL CONTROL TECHNOLOGY LABORATORY WITH A CIRCULATING FLUIDIZED-BED COMBUSTION SYSTEM
the pressure differential back to normal levels.
To ensure the control and even distribution of spike-gas injection, three static mixers were
built and installed at different locations in the SCR slipstream reactor. The first static-mixer is
located one duct-diameter below the spiking gas injection ports to ensure homogeneous
distribution of spiking gas before reaching the first catalyst layer. The second and third
static-mixers have been installed at the bottom of each catalyst layer to ensure homogeneous
concentrations of other gases after the flue gas exits each catalyst layer. The precise control of
spiking gas addition was achieved through the construction of a multi-port mass-flow controller
that has the capability of being set to inject a predetermined amount of gas from one to four
attached cylinders. All injection ports for spiking gases are set up below the first sampling port,
which leave the “inlet” sampling port unaffected. The injection of NH3 is separated from other
spiking gas lines to ensure operational safety. Considering the actual injection ratio of NH3 in the
commercial SCR facility, the ratio of NH3 injection is set at NH3:NO=1 to 1.1. Due to the
low-NOx burner used, the NOx level was about 250 ppm during tests.
SCR Catalysts. Commercial monolith (Honeycomb) SCR catalysts were provided by two
vendors. Catalyst #1 had an 8.4 mm pitch, and the square cross section had an array of 18 x 18
channels. Catalyst #2 had an approximate 7.5 mm pitch, and the square cross had an array of 20
x 20 channels. Each catalyst section was one meter in length; therefore, the total length of the
catalyst was two meters. The SCR catalysts are designed to be operated at a space velocity of
1800 hr-1, which is the actual space velocity used on full-scale coal-fired SCR reactors18. These
two catalysts were tested in two coal-fired power plants burning eastern bituminous coals and
sub-bituminous PRB coal. Two tested honeycomb SCR catalysts were provided by two
commercial vendors, which are BASF/CERAM, Inc. and Hitachi, Inc. The pitch sizes and cell
numbers are 10 mm and 15 x 16 for Catalyst #3 (BASF/CERAM, Inc.). The main components of
SCR catalysts are V2O5-WO3-TiO2.
Coal and Ash Analysis. Bituminous coal, with medium sulfur and chlorine content, and PRB
coal, with low sulfur and chlorine content, were burned during tests with the HBr addition. Coal
and ash samples were collected once daily during tests. The proximate analysis, elemental
analyses, and mineral metal analysis of the coal samples are shown in Table A2. Analysis of fly
ash samples from the ESP hopper, which was the front row, is also shown in Table A2. All data
was presented on a dry basis and the testing methods for all these samples can be found in the
121
ESTABLISHMENT OF AN ENVIRONMENTAL CONTROL TECHNOLOGY LABORATORY WITH A CIRCULATING FLUIDIZED-BED COMBUSTION SYSTEM
reference1. The average sulfur, chlorine and mercury content in the tested bituminous coal were
about 1.31 %, 1328 ppm and 0.11 ppm, respectively. In comparison, the average sulfur, chlorine
and mercury content in the tested PRB coal was about 0.61 %, 170 ppm and 0.08 ppm during
tests, respectively. Based on approximate mass balance, 90 % of the sulfur and chlorine content
in coal existed in the flue gas during its combustion. CaO, Fe2O3 and LOI were about 1.71 %,
17.51 % and 7.13 % for collected fly ash of tested bituminous coal, and 22.95 % and 4.91 % and
0.64 % for collected fly ash of tested PRB. The bromine content in tested coals were under the
detection limit.
Selective Catalytic Reduction - NOx emission Control (the Case of Bituminous coal fired
site). The reduction performance of the SCR slipstream reactor was evaluated by monitoring the
NO concentration at the inlet and outlet locations of the SCR slipstream reactor. Due to the
low-NOx burner installed in the test unit, NO concentrations at the inlet were found to be about
280-300 ppm during the SCR slipstream validation tests. Nitrous Oxide (NO) concentration at
the outlet location was almost the same as that at the inlet location with the same O2
concentration. After the NH3 addition started with a molar ratio of NO:NH3 at about 1, the NO
concentration decreased gradually, and finally was reduced below 20 ppm, as shown in Figure
A10-1 for Catalyst #1 and Figure A10-2 for Catalyst #2. Both catalysts in the SCR slipstream
reactor worked properly as expected with above 95 % NO reduction.
122
ESTABLISHMENT OF AN ENVIRONMENTAL CONTROL TECHNOLOGY LABORATORY WITH A CIRCULATING FLUIDIZED-BED COMBUSTION SYSTEM
123
Figure A8. The Schematic of the SCR Slipstream Reactor
NH3 Injection
Pitot and Thermocouples Thermocouples
Spike gases
Inlet OHM Inlet SCEM
Thermocouples and pressure sensor
ID Fan
Middle OHM temperature and pressure
Outlet OHM Outlet SCEM
Thermocouples
waste port
Platform 2
Platform 1
SCR inlet ductAbout 300-350 Deg C
Ground floor
Thermocouples
SO3 or HBr Injection
Support Rack
1st SCR catalyst layer
2nd SCR catalyst layer
Static Mixer
Static Mixer
Mixing zone
Insulation
ESTABLISHMENT OF AN ENVIRONMENTAL CONTROL TECHNOLOGY LABORATORY WITH A CIRCULATING FLUIDIZED-BED COMBUSTION SYSTEM
Figure A9. The Actual Setup on Site of the SCR Slipstream Reactor System
124
ESTABLISHMENT OF AN ENVIRONMENTAL CONTROL TECHNOLOGY LABORATORY WITH A CIRCULATING FLUIDIZED-BED COMBUSTION SYSTEM
LISHMENT OF AN ENVIRONMENTAL CONTROL TECHNOLOGY LABORATORY A CIRCULATING FLUIDIZED-BED COMBUSTION SYSTEM
ESTABLISHMENT OF AN ENVIRONMENTAL CONTROL TECHNOLOGY LABORATORY WITH A CIRCULATING FLUIDIZED-BED COMBUSTION SYSTEM
Figure A16. The Mercury Removal Efficiencies by Simultaneous Additions of HBr (at 4 ppm) and Selected Fly Ashes
0.0%
10.0%
20.0%
30.0%
40.0%
50.0%
60.0%
70.0%
80.0%
90.0%
Baseli
ne
HBr=4pp
m
HBr = 4
ppm + 2l
b/MMac
f Darc
o-LH
HBr = 4
ppm +10
lb/MMac
f Bitu
minous
#1PC fly
ash
HBr = 4
ppm + 30
lb/MMac
f Bitu
minous
#1 P
C fly as
h
HBr = 4
ppm + 30
lb/M
Macf B
itumino
us#2
PC fly
ash
HBr = 4
ppm + 30
lb/M
Macf C
FBC botto
m ash
HBr = 4
ppm + 10
lb/M
Macf P
C SB fly
ash
HBr = 4
ppm + 30
lb/M
Macf P
C SB fly
ash
HBr=4pp
m + 10lb/
MMacf L
ignite
PC fly
ash
HBr=4 pp
m + 30lb/
Mmacf li
gnite
PC fly
ash
Hg
rem
oval
effi
cien
cy, %
3.0%
44.4%
76%
60.8%
72.5%76.2%
58.4%
65.7%
80.1%
41.6%41.6%
145
ESTABLISHMENT OF AN ENVIRONMENTAL CONTROL TECHNOLOGY LABORATORY WITH A CIRCULATING FLUIDIZED-BED COMBUSTION SYSTEM
Figure A17. The Correlation of Particle-bound Mercury and Fluorine, Chlorine and Bromine Contents on Fly Ashes
6.00
R2 = 0.7672
0.00
1.00
2.00
3.00
4.00
5.00
0 100 200 300 400 500 600 700 800F, Cl and Br content on fly ash, ppm
Hg(
P) p
artic
le-b
ound
mer
cury
, ppm
F(P)-Hg(P) Cl(P)-Hg(P)
Br(P)-Hg(P) Log. (Br(P)-Hg(P))
146
ESTABWITH
147
Figure A18. Comparison of Cross-section BEI Images and EDS Analysis of Alloys (A36, A242, 310, SS316L) Before and After Exposure Under Testing Atmospheres (LT: 150 oC, HT: 350 oC; I: Original coupon sample, II: coupon sample after exposure under test environment)
LISHMENT OF AN ENVIRONMENTAL CONTROL TECHNOLOGY LABORATORY A CIRCULATING FLUIDIZED-BED COMBUSTION SYSTEM
Coupon sample of carbon steel (A36 and A242) Coupon sample of carbon steel (SS310 and 316L)
ESTABLISHMENT OF AN ENVIRONMENTAL CONTROL TECHNOLOGY LABORATORY WITH A CIRCULATING FLUIDIZED-BED COMBUSTION SYSTEM
9.4 Chemical Looping Combustion
Theoretical Analysis and Selection of Oxygen Carriers.
■ Kinetics. The metal oxides with its reduced metal oxides or metals, which are used as
oxygen carriers in the CLC must have sufficient reaction activity in reduction and oxidation and
enough strength to limit particle breakage and attrition. A number of metals have been discussed
in the literature21,22-38
, such as Fe, Ni, Co, Cu, Mn, and Cd, as well as some metal composites.
The investigation of the oxidation and reduction kinetics of selected metal oxides have been
intensively carried out in either a TGA, a lab-scale fixed bed or a fluidized bed using gaseous
fuels such as H2, CO or CH
4. The kinetics of reactions varied widely depending upon the type of
metal oxide, particle size (70 μm-2 mm), reduction gas (H2, CO and CH
4) and temperature
(600-1000oC). Generally, Cu, Ni and Co and their oxides showed higher oxidation and reduction
reaction activity and greater durability after repeated oxidation and reduction cycles than Fe. It
was also found that an impregnated type of oxygen carrier could increase the reactivity,
attrition-resistance and durability, even with their particle size being as large as about 2 mm in
diameter. Almost full conversion of reactants could be achieved in minutes for the impregnated
type of oxygen carriers. The candidates for the inert support materials could be SiO2, Al
2O
3,
yttria-stabilized zirconium (YSZ), TiO2
and MgO. However, different combinations of active
materials of oxygen carriers with inert support materials showed different crushing strength and
sintering temperature.33-34
During the experiments with CH4, carbon deposition may have
occurred, which could cause a dramatic loss of reactivity. However, a high concentration of
water vapor available in the reducer could help to eliminate carbon deposition.28,33,35
Based on an
oxygen transfer capability, energy balance analysis and thermodynamics analysis, copper (Cu)
seems to be the better choice as an oxygen carrier for the CLC system of solid fuels. The
CuO-Cu series will be used as oxygen carriers for developing CCLPCM.
■ Physical properties of Oxygen Carriers. For a reactor in which solid particles are flowing,
moving and re-circulating, the possibility of the particle agglomeration should be avoided. For
metal-based oxygen carriers, the melting points of the selected metals, reduced metal oxides and
metal oxides are important parameters in evaluating their agglomeration tendencies. The melting
of oxygen carriers may also have resulted in the loss of reactivity. The melting points of oxygen
148
ESTABLISHMENT OF AN ENVIRONMENTAL CONTROL TECHNOLOGY LABORATORY WITH A CIRCULATING FLUIDIZED-BED COMBUSTION SYSTEM
carrier candidates are shown in Table A439
. The majority of metals and their metal oxides have
very high melting points, which are always higher than 1200 oC, except those with melting
points around 1050 oC, which are within the operational temperature range of CLC processing
such as Cu, CuO, and Mn2O
3, which are highlighted in light gray. Some metals and their metal
oxides have very low melting points such as PbO, CdO and Co3O
4, which are highlighted with
dark gray and must be removed from the candidate list to be oxygen carriers in the CLC process.
Operating temperatures of the CLC process are also dependent on the acceptable reactivity of
oxygen carriers. Previous studies indicated that Cu-based oxygen carriers had reactivity of 100 %
reduction within minutes at lower temperatures (600-900 oC)
37-40 in the fixed bed or fluidized bed
testing facilities. When copper oxide was doped on substrate, it indicated that most of its oxygen
is active for reaction with methane, and the highest efficiency could be achieved with reduction
rates up to 100 %/min and oxidation rates up to 25 %/min.28,33,35
■ Oxygen Transfer Capability of Oxygen Carriers. The utilization efficiency of an oxygen
carrier depends on its oxygen transfer capability, which is listed in Table A4 as the mol of metal
per mol of oxygen transfer (N). On the other hand, the re-circulation of the oxygen carrier
required energy consumption, which is proportional to the pressure drop across the reactor38
. In a
fast fluidization bed oxidizer, the pressure drop is proportional to the terminal velocity Ut41
; and
in a bubble fluidization or moving bed reducer, the pressure drop is proportional to the minimum
velocity Umf41
. As indicated in Eq(A23) and Eq(24), ρp which is the particle density of oxygen
carriers, is the most important parameter affecting the Ut (factor value at 0.5) and Umf (factor
value at 1). These two parameters can be multiplied by N relative to the same parameters of the
CuO-Cu system, which are (Nxρp)/ (Nxρp)Cu-CuO
or (Nxρp)/(Nxρp0.5)
Cu-CuO, to evaluate the relative
energy consumption by using different oxygen carriers.
Ut = [4dp(ρp- ρg)g /(3ρgCD)]1/2 Eq(A23)
Umf = [dp2(ρp- ρg)g( εmf
3Фs2)]/ [(150μ)(1- εmf)] Eq(A24)
As shown in Table 1, N values and (Nxρp)/(Nxρp)Cu-CuO
or (Nxρp)/(Nxρp0.5)
Cu-CuO values
follow the same trend so we can focus on the N value to evaluate energy consumption. The best
candidates for oxygen carriers should be those with a smaller N values. The minimum value of N
149
ESTABLISHMENT OF AN ENVIRONMENTAL CONTROL TECHNOLOGY LABORATORY WITH A CIRCULATING FLUIDIZED-BED COMBUSTION SYSTEM
is 0.67 for reactions (9) and (15) and the next is 0.75 for reactions (5) and (11) and (17) for
Co-based, some of Mn-based and some of Fe-based oxygen carriers. N values of other reactions
are close to 1 for Cu-, Ni-, and some of Co-based and some of Fe-based oxygen carriers. By
similarly evaluating the parameters of (Nxρp)/(Nxρp)Cu-CuO and (Nxρp)/(Nxρp
0.5)Cu-CuO
, the same
conclusion can be made. Any candidates without a gray mark have passed the selection criteria.
They include Ni-based (NiO-Ni), Co-based (CoO-Co), Mn-based (Mn3O4-Mn, MnO-Mn) and
Fe-based (Fe2O3-Fe, Fe3O4-Fe, FeO-Fe) to be oxygen carrier candidates. Copper-based oxygen
carriers are also included in this list due to their perfect reactivity even at lower temperatures.
■ Energy Balance Analysis. The oxygen carrier reduction process by solid fuel is far more
complicated compared to that by gaseous fuels. The process is governed by the prevailing
chemical thermodynamics and kinetics. If the indirect path (gasification of solid fuels followed
by reduction of metal oxides by gaseous gasification products) is dominant, the properties of
pyrolysis and gasification of solid fuels should be considered. All reactions related to the
pyrolysis and gasification of fossil fuel are endothermic, as illustrated by Eq (A25), (A26) and
(A27). All enthalpy data are based on 1 atm and 25oC.
39 In conventional gasification
technologies, self-combustion of solid fuel is needed to provide the heat request of the
endothermic pyrolysis and gasification processes. This is called the auto-thermal process. In the
proposed CLC system, the gasification process for solid fuel occurs simultaneously with a
reduction process for the oxygen carrier in the reducer where no oxygen exists. There are two
ways to supply heat for the solid fuel gasification process. One is the reduction of the oxygen
carrier indirectly by solid fuels or their product gases. .The other method is to use a heat-transfer
material with a high-heat capacity to transfer heat from the oxidizer to the reducer. Obviously,
the previous one is the better choice to prevent additional energy consumption by recycling the
heat-transfer material.
CnH
mO
p → aCO
2 + bH
2O + cCH
4+ dCO + eH
2 +f(C
2-C
5), 20.9 kJ/mol Eq(A25)
C + H2O → CO + H
2, 118.3 kJ/mol Eq(A26)
C + CO2 → 2CO, 160.5 kJ/mol Eq(A27)
Until now, just a few metal oxides that have been examined as oxygen carriers for the CLC
process show exothermic properties when reacted with carbon or syngas. The possible reactions
related to oxygen carrier candidates and carbon in the reducer, are shown in Table A5. There are
150
ESTABLISHMENT OF AN ENVIRONMENTAL CONTROL TECHNOLOGY LABORATORY WITH A CIRCULATING FLUIDIZED-BED COMBUSTION SYSTEM
two steps (oxidizing and reducing) in the process of chemical looping for solid fuel combustion.
Thus, the enthalpy of solid fuel combustion in the chemical looping process is equal to the sum
of the enthalpies of the two steps. For the different oxygen carriers shown, there is a different
distribution of enthalpies in two steps, and even the endothermic and exothermic reactions may
be changed. Copper-based and CoO-Co oxygen carriers are the only three choices whose
reduction is exothermic due to the smaller enthalpy of the oxidation compared to the direct
combustion of solid fuel. The Mn3O
4-MnO oxygen carrier should be removed from the
suggested candidate list due to the reason (N=6) previously mentioned. Despite endothermic
properties in the reducer, oxygen carriers such as NiO-Ni, CoO-Co, Co3O
4-Co, Mn
3O
4-MnO and
Fe2O
3-Fe
3O
4 have smaller reaction enthalpies so they can be included as candidates for oxygen
carriers if heat-transfer materials will be used for heat transfer in the reducer. Due to the reason
previous mentioned (melting points and N values), Co3O
4-Co, Mn
3O
4-MnO and Fe
2O
33O
4 can be
removed from the suggested candidate list.
■ Thermodynamics Analysis. Chemical reaction thermodynamics are important for the
control of CO2
purity. From the standard Gibbs free energy changes, the equilibrium constants
can be calculated for the various reactions of metal oxide reduction and solid fuel gasification for
a wide range of operating temperatures. The phase diagram for the reduction reactions using the
reducing agents CO and H2
produced from the solid fuel gasification process at atmospheric
pressure are shown in Figures A19-1 and A19-2, respectively.
Figure A19-1 shows the equilibrium gas ratio of PCO2
/PCO
as a function of temperature for the
reduction of various metal oxides. It shows that the ratio varies from approximately 105
for the
reduction of CuO to Cu, Cu2O to Cu, Mn
3O
4 to MnO and Fe
2O
3 to Fe
3O
4, to values on the order
of 10-5
or less for the reduction of MnO to its elemental state of Mn. Information related to the
Boudouard reaction, as illustrated in Equation (5), is also presented in Figure A19-1. For the
reduction of a metal oxide with CO in the absence of solid carbon, the oxides of copper and
nickel will be reduced to the elemental form at gas ratios between 105
and 102. Therefore, the
completeness of the reaction could be achieved and a highly concentrated CO2
stream will be
obtained in the proposed CLC system. On the other hand, the reduction of MnO requires a
CO2-free environment, which is practically impossible for the CLC of solid fuel to achieve.
151
ESTABLISHMENT OF AN ENVIRONMENTAL CONTROL TECHNOLOGY LABORATORY WITH A CIRCULATING FLUIDIZED-BED COMBUSTION SYSTEM
Because carbon is also present in the reaction mixture in the proposed reducer, the reduction of
metal oxide and carbon gasification to CO occurs simultaneously. As shown in Figure A20,
above the simultaneous equilibrium temperature where two curves for the reduction of metal
oxides and the Boudouard reaction intersect, Fe3O
4 will be converted to FeO above 650
oC and
then to Fe above 700 oC under a low P
CO2/P
CO ratio of ~10. In contrast, the curves for CuO, Cu
2O,
NiO and Fe2O
3 do not intersect with the carbon curve even at the interested temperature range
(600-1200 oC). The simultaneous reactions are not limited by thermodynamics; they are
determined entirely by kinetics. In this case the gas constituents produced will have an
intermediate impact on the value of the PCO2
/PCO
ratio. Generally, the reduction reaction of metal
oxide is faster than the solid fuel gasification in the CLC process. Hydrogenis another product
from the solid fuel gasification process using H2O as the gasification agent. Figure A19-2 is the
thermodynamics diagram for the PH2O
/PH2
equilibrium system, similar to the PCO2
/PCO
system
presented in Figure A19-1. The reduction of metal oxides with H2
is less exothermic than its
corresponding reaction with CO. Moreover, equilibrium of the water-gas reaction will occur and
shift to the right at lower temperatures. This shows that H2
at high temperatures is a better
reducing agent than CO for oxygen carriers. Solid fuel pyrolysis and gasification may produce
some CH4
in the reducing stream. Thermodynamics shows that CH4
could be a better reducing
agent than either CO or H2 at high temperatures. The tendency of CH
4 decomposition to result in
oxygen carrier deactivation by carbon deposit may be largely eliminated under higher partial
pressure of H2O and CO
2 in the reducer.
The main constituent of solid fuels is carbon. The possibility of directly reducing metal
oxides with carbon can also be calculated using thermodynamic theory39
. All these reduction
reactions with carbon are heterogeneous reactions with only one gaseous species included. Based
on thermodynamics theory, if the gas (CO2) is ideal, the equilibrium constant expressions for
these reactions can not include the solid phase due to the fact that pure solid phases are nearly
equal to unity for moderate pressures. Thus, a phase diagram relating the partial pressure of CO2
and temperature can be constructed as shown in Figure A20. In this figure the equilibrium line
for each oxygen carrier divides the 2-D area of temperature and CO2 partial pressure (P
CO2) into
152
ESTABLISHMENT OF AN ENVIRONMENTAL CONTROL TECHNOLOGY LABORATORY WITH A CIRCULATING FLUIDIZED-BED COMBUSTION SYSTEM
153
two zones in the temperature range of interest. Metal oxides, reduced metal oxides or metals,
carbon and CO2
are present simultaneously only at the equilibrium line correlating the reaction
temperature and CO2 partial pressure. Above this equilibrium line, metal oxides and carbon can
have a stable existence. Under this equilibrium line, metal or reduced metal oxides can have a
stable existence. The temperature and CO2
partial pressure are the parameters that control
reaction extent and have a higher equilibrium at about 10, but it still needs to be rejected as an
oxygen carrier due to a high N value, which was mentioned previously.. Figure A20 indicates
that CO2
partial pressure (PCO2
) of Cu-based, Ni-based and Co-based oxygen carriers can reach
above 103 so that 99.999 % purity of the CO
2 stream can be assured in view of the reduction of a
metal oxide directly by carbon in the temperature range of interest. Above 1000 oC, Fe-based
oxygen carriers can only assure the PCO2
to be above 10 with a CO2
stream purity of 90 %.
Generally, Mn-based oxygen carriers lack practicality due to a very low PCO2
, at about 10-7
for
MnO-Mn and 10-3
Mn3O
4-MnO reaction systems
17
ESTABLISHMENT OF AN ENVIRONMENTAL CONTROL TECHNOLOGY LABORATORY WITH A CIRCULATING FLUIDIZED-BED COMBUSTION SYSTEM
154
Table A4. Physical Properties and Oxygen Transfer Capability of Oxygen Carriers
NO. Reduction reaction
Melting point of the reduced metal form, oC
Melting point of the oxidized metal form, oC
Specific density of the reduced metal form ρR, kg/m3
Specific density of the oxidized metal form ρO, kg/m3
mol of metal per mol of oxygen transfer N, mol/mol
(NxρR)M/(NxρR)Cu
in reducer(NxρO
0.5)M/(NxρO0.5)CuO in
oxidizer
1 2CuO + C = 2Cu + CO2 1083 1026 8920 6450 1 1.0 1.02 2Cu2O + C = 4Cu + CO2 1083 1235 8920 6000 2 2.0 1.93 2NiO + C = 2Ni + CO2 1452 1452 8900 7450 1 1.0 1.14 2Co3O
4 + C = 6CoO + CO2 1480 895 8900 6070 3 3.0 2.95 1/2Co3O4 + C = 3/2Co + CO2 1480 895 8900 6070 0.75 0.7 0.76 2CoO + C = 2Co + CO2 1480 1800 8900 5680 1 1.0 0.97 6Mn2O3 + C = 4Mn3O4 + CO2 1564 1080 4856 4810 6 3.3 5.28 2Mn2O3 + C = 4MnO + CO2 1650 1080 5180 4810 2 1.2 1.79 2/3Mn2O3 + C = 4/3Mn + CO2 1260 1080 7200 4810 0.67 0.5 0.610 2Mn3O4 + C = 6MnO + CO2 1650 1564 5180 4856 3 1.7 2.611 1/2Mn3O4 + C = 3/2Mn + CO2 1260 1564 7200 4856 0.75 0.6 0.712 2MnO + C = 2Mn + CO2 1260 1650 7200 5180 1 0.8 0.913 6Fe2O3 + C = 4Fe3O4 + CO2 1538 1560 5200 5120 6 3.5 5.314 2Fe2O3 + C = 4FeO + CO2 1420 1560 5700 5120 2 1.3 1.815 2/3Fe2O3 +C = 4/3Fe + CO2 1275 1560 7030 5120 0.67 0.5 0.616 2Fe3O4 + C = 6FeO + CO2 1420 1538 5700 5200 3 1.9 2.717 1/2Fe3O4 + C = 3/2Fe + CO2 1275 1538 7030 5200 0.75 0.6 0.718 2FeO + C = 2Fe + CO2 1275 1420 7030 5700 1 0.8 0.919 2PbO + C = 2Pb + CO2 327.5 886 11340 8000 1 1.3 1.120 2CdO + C =2Cd + CO2 320.9 900 8650 8150 1 1.0 1.1
ESTABLISHMENT OF AN ENVIRONMENTAL CONTROL TECHNOLOGY LABORATORY WITH A CIRCULATING FLUIDIZED-BED COMBUSTION SYSTEM
Table A5. Enthalpies of Reduction Reaction by Carbon at 1000oC and 1 atm (calculations based on data from reference).
Endothermic Exothermic2 NiO + C → 2 Ni + CO2, 75.21kJ/mol 2 CuO + C → 2Cu + CO2, -96.51 kJ/mol2 CoO + C → 2 Co + CO2, 73.92 kJ/mol 2 Cu2O + C → 4 Cu + CO2, -61.04 kJ/mol1/2 Co3O4 + C → 3/2 Co + CO2, 53.9 kJ/mol 6Co3O4 + C = 6CoO + CO2, -8.63 kJ/mol2/3 Mn2O3 + C = 4/3 Mn + CO2, 239.61 kJ/mol 6Mn2O3 + C = 4Mn3O4 + CO2, -216.63 kJ/mol6 Mn3O4 + C = 4 MnO + CO2, 54.21 kJ/mol 2Mn2O3 + C = 4MnO + CO2, -36.07 kJ/mol1/2 Mn3O4 + C → 3/2 Mn + CO2, 296.65 kJ/mol 2 MnO + C → 2 Mn + CO2, 378.98 kJ/mol6 Fe2O3 + C → 4 Fe3O4 + CO2, 83.56 kJ/mol2 Fe2O3 + C → 4 FeO + CO2, 158.40 kJ/mol2/3 Fe2O3 + C → 4/3 Fe + CO2, 146.37 kJ/mol2 Fe3O4+ C = 6 FeO + CO2, 195.78 kJ/mol1/2 Fe3O4+ C = 3/2 Fe + CO2, 151.27 kJ/mol2FeO + C = 2 Fe + CO2, 136.44 kJ/mol
C+ O2 → CO2, -392.75 KJ/mol
155
ESTABLISHMENT OF AN ENVIRONMENTAL CONTROL TECHNOLOGY LABORATORY WITH A CIRCULATING FLUIDIZED-BED COMBUSTION SYSTEM
Figure A19-1. Variation of the Thermodynamic Equilibrium Factor for MexOy-CO as a Function of Temperature (calculations based on data from reference).
600 800 1000 1200 1400 1600
-6
-4
-2
0
2
4
6
Mn3O4-MnO
Fe2O3-Fe3O4
CuO-Cu
Log(
PC
O2/P
CO
)
Temperature, OC
Cu2O-Cu
CoO-Co
NiO-Ni
C+CO2=2CO
Fe3O4- FeO
FeO-Fe
MnO-Mn
Figure A19-2. Variation of the Thermodynamic Equilibrium Factor for MexOy-H2 as a Function of Temperature
600 800 1000 1200 1400 1600
-6
-4
-2
0
2
4
6Fe2O3-Fe3O4
CoO-Co
CuO-Cu
Log(
PH2O
2/PH
2)
Temperature, OC
Cu2O-Cu
NiO-Ni
Fe3O4-FeO
FeO-Fe
MnO-Mn
Mn3O4-MnO
156
ESTABLISHMENT OF AN ENVIRONMENTAL CONTROL TECHNOLOGY LABORATORY WITH A CIRCULATING FLUIDIZED-BED COMBUSTION SYSTEM
157
Figure A20. Variation of the Thermodynamic Equilibrium Factor for MexOy-C as a Function of Temperature
-30
-20
-10
0
10
20
30
0 200 400 600 800 1000 1200
Temperature, oC
2
CuO-Cu
Cu2O-CuCoO-Co NiO-Ni
Fe2O3-Fe
Fe3O4-FeFeO-Fe MnO-Mn
Mn3O4-MnO
Mn2O3-Mn3O4
)Lo
g (C
O
ESTABLISHMENT OF AN ENVIRONMENTAL CONTROL TECHNOLOGY LABORATORY WITH A CIRCULATING FLUIDIZED-BED COMBUSTION SYSTEM
9.5 Statistics Analysis of CFBC Mercury Emission Rate
Methods. Mercury emissions data were collected from data bases of the EPA’s mercury ICR
program and WKU ICSET mercury field testing. The EPA ICR data are from sampling activities,
which were obtained based on ASTM D6784 Ontario Hydro Method (OHM). Besides ASTM
OHM used, ICSET data were also from sampling activities by the semi-continuous Mercury
Monitor (SCEM) and EPA Appendix K method. The EPA ICR data were collected upstream of
the last air pollutant control device and the stack. The ICSET data were collected from sampling
activities, which have been extended to varied APCD locations and boiler operation conditions.
Thus, it could provide additional information about the dependence of mercury transformation at
different locations and mercury emission rates on the boiler performance. Boilers equipped with
Fabric Filter (FF) were selected in this study because FF was predicted to be more efficient for
mercury emission control than ESP. In the collected ICR data, there were 18 PC units, one
cyclone unit, nine CFBC units, three stoker-fired units and 2 IGCC units. Coals burned in these
units included bituminous, sub-bituminous, lignite and their blends. All ash characterization data
were from the ICSET database. The mercury emission rate, which is commonly expressed as
lb/TBtu, was not used in this study. It does not include information on mercury input levels so
that it is not accurate herein. In this study, the new mercury emission rate (μg/NM3/(ug/g ·
Btu/lb)) is defined as mercury emissions in the stack (Hgstack, μg/NM3), per the mercury content
(Hgcoal, μg/g) and also per heating value of the (BTucoal,, Btu/lb), see Eq (A28). This factor can be
used to evaluate the mercury emission rates, which are dependent upon the mercury content of
the coal (Hgcoal) and coal heating value (Btucoal). We found loss of information in ICR data (for
example, a complete analysis of coal) to calculate F-Factor for every case and thus to correlate
BTU and flue gas volume to make its unit have a simple look.
ESTABLISHMENT OF AN ENVIRONMENTAL CONTROL TECHNOLOGY LABORATORY WITH A CIRCULATING FLUIDIZED-BED COMBUSTION SYSTEM
165
0
5
10
15
20
25
0 5 10 15 20 25 30 35 40 45
Spe
cific
sur
face
are
a (B
ET,
m2 /g
) or P
ore
size
, nm
0
0.005
0.01
0.015
0.02
0.025
0.03
0.035
0.04
0.045
0.05
Por
e V
olum
e, c
m2 /g
BET SSA, m2/g Pore size, nm Pore Volume, cm³/g
CFBC Stoker PC
Bituminous Sub-Bituminous Lignite
Figure A22. The Factors on Fly Ash Properties
ESTABLISHMENT OF AN ENVIRONMENTAL CONTROL TECHNOLOGY LABORATORY WITH A CIRCULATING FLUIDIZED-BED COMBUSTION SYSTEM
10. References
1. Cao Y.; Duan, Y. F.; Kellie, K; Li, L. C.; Xu, W. B.; Riley, J. T.; Pan, W. P. Impact of coal chlorine on mercury speciation and emission from a 100-MW utility boiler with cold-side electrostatic precipitators and low-NOx Burners. Energy & Fuels 2005, 19, 842-854. 2. Kellie, S.; Cao, Y.; Duan, Y.D.; Li, L. C.; Chu, P.; Mehta, A.; Carty, R.; Riley, J. T.; and Pan. W.P. Factors affecting mercury speciation in a 100-MW coal-fired boiler with low-NOx burners. Energy & Fuels 2005, 19, 800-806. 3. Pavlish JH, Scondreal E A, Mann MD, Olson ES, Galbreath KC, Laudal DL, Benson SA. Status review of mercury control options for coal-fired power plant. Fuel Processing Technology 2003; 82: 89-165. 4. Hilber, Th.; Thorwarth, H.; Stack-Lara, V.; Schneider, M.; Maier, J.; Scheffknecht. Fate of mercury and chlorine during SRF co-combustion. Fuel 2007, 86, 1935-1946. 5. Zhang, Y.; Miller, S. J. Impact of supplemental firing of tire-derived fuel (TDF) on mercury species and mercury capture with the advanced hybrid filter in a western subbituminous coal flue gas. Energy&Fuel 2006, 20, 1039-1043. 6. Sable, S. P.; Jong, W. D.; Meij, R.; Spliethoff, H. Effect of secondary fuels and combustor temperature on mercury speciation in pulversized fuel CO-combustion: Part 1. Energy & Fuel 2007, 21, 1883-1890. 7. Gupta, R. P. Coal research in Newcastle—past, present and future. Fuel 2005, 84(10), 1176-1188. 8. Olsson, J. G.; Jaglid, U.; Pettersson, J. B. C.; Hald, P. Alkali metal emission during pyrolysis of biomass. Energy & Fuels 1997, 11(4), 779-784. 9. Jenkins, B. M.; Baxter, L. L.; Miles Jr., T. R.; Miles, T. R. Combustion properties of biomass. Fuel Process. Technol., 1998, 54(1-3), 17-46. 10. Liu, K. L.; Gao, Y.; Riley, J. T.; Pan, W. P.; Mehta, A. K.; Ho, K. K.; Smith, S. R. An investigation of mercury emission from FBC system fired with high-chlorine coals. Energy&Fuel 2001, 15(5), 1173-1180. 11. Sable, S. P.; Jong, W. D.; Meij, R.; Spliethoff, H. Effect of air-staging on mercury speciation in pulversized fuel co-combustion: Part 2. Energy & Fuel 2007, 21, 1891-1894.
ESTABLISHMENT OF AN ENVIRONMENTAL CONTROL TECHNOLOGY LABORATORY WITH A CIRCULATING FLUIDIZED-BED COMBUSTION SYSTEM
12. Vosteen, B. W.; Kanefke, R.; Koser,H. Bromine-enhanced mercury abatement from combustion flue gases - recent industrial applications and laboratory research. VGB Power Tech, International Journal for Electricity and heat Generation, 2006, 86(3), 70-75. 13. Sakuri, M.; Nakajima, H.; Onuki, K.; Ikenoya, K.; Shimizu, S. Prelinary process analysis for the closed cycle operation of the iodine-sulfur thermochemical hydrogen production process. International Journal of Hydrogen Energy, 1999, 24, 603-612. 14. Giaconia, A.; Caputo, G.; Ceroli, A.; Diamanti, M.; Barbarossa, V.; Taruini, P.; Sau, S. Experimental study of two phase separation in the bunsen section of the sulfur- iodine thermochemical cycle. International Journal of Hydrogen Energy 2007, 32, 531-536. 15. Cao, Y.; Chen, B.; Wu, J.; Cui, H.; Li, S. G.; Herren, S. M.; Smith, J.; Chu, P.; and Pan, W. P. Study of mercury oxidation by selective catalytic reduction catalyst in a pilot-scale slipstream reactor at a utility boiler burning bituminous coal. Energy & Fuels, 2007, 21, 145-156. 16. Nebergell, W. H.; Schmidt, F. C.; Jr. Holtzclaw, H. F. In College Chemistry with Qualitative Analysis. 5th Edition, D.C. Heath and Company, 1976. 17. Calvert, J. G.; Lindberg, S. E. The potential Influence of iodine-containing compounds on the chemistry of the troposphere in the polar spring. II. mercury depletion. Atmosphere Environment, 2004, 38, 5105-5116. 18. Geoffrey D. S. Senior, C. L.; O’Palko, A. Analysis of Bromine-Mercury Reactions in Flue Gas. In University Coal Research / Historically Black Colleges and Universities & Other Minority Institutions Contractors Review Meeting, U.S. Department of Energy, 2007. 19. Cao, Y; Wang, Q. H.; Chen, W. C.; Chen, B.; Cohron, M.; Chiu, C. C.; Tseng, Y. C.; Chu, P.; Pan W. P. Investigation of mercury transformation by HBr addition in a slipstream facility with real flue gas atmospheres of bituminous coal and Powder River Basin (PRB) Coal. Energy & Fuels, 2007, 21, 2719-2730.
20. Geoffrey D. S. Senior, C. L.; O’Palko, A. Analysis of Bromine-Mercury Reactions in Flue Gas. In University Coal Research / Historically Black Colleges and Universities & Other Minority Institutions Contractors Review Meeting, U.S. Department of Energy, 2007. 21. Ishida, M.; Jin, H. A Novel Combustor Based on Chemical Looping Reactions and its Reaction Kinetics. J. Chem. Eng. Japan 1994, 27, 296. 22. Ishida, M.; Jin, H. “Novel Chemical-looping Combustor without NO
x Formation,” Industrial
and Engineering Chemistry Research, 1996, 35, 2469–2472. 23. Ishida, M.; Jin, H.; Okamoto, T. “A Fundamental Study of a New Kind of Medium Material for Chemical-looping Combustion,” Energy & Fuels, 1996, 10, 958–963. 24 Ishida, M.; Jin, H.; Okamoto, T. “Kinetic Behaviour of Solid Particle in Chemical-looping Combustion: Suppressing Carbon Deposition in Reduction,” Energy & Fuels, 1998, 12, 223–229.
167
ESTABLISHMENT OF AN ENVIRONMENTAL CONTROL TECHNOLOGY LABORATORY WITH A CIRCULATING FLUIDIZED-BED COMBUSTION SYSTEM
25. Ishida, M.; Yamamoto, M.; Ohba, T. “Experimental Results of Chemical-looping Combustion with NiO/NiAl
2O
4 Particle Circulation at 1200C,” Energy Conversion and Management, 2002,
43, 1469. 26. Jin, H.; Ishida, M. “Reactivity Study on Natural-gas-fueled Chemical-looping Combustion by a Fixed Bed,” Ind. Eng. Chem. Res., 2002, 41, 4004-4007. 27. Jin, H.; Okamoto, T.; Ishida, M. “Development of a Novel Chemical-looping Combustion: Synthesis of a Looping Material with a Double Metal Oxide of CoO–NiO,” Energy & Fuels, 1998, 12, 272–1277. 28. Jin, H.; Okamoto, T.; Ishida, M. “Development of a Novel Chemical-looping Combustion: Synthesis of a Solid Looping Material of NiO-NiAl
2O
4,” Industrial and Engineering Chemistry
Research, 1999, 38, 126–132. 29. Cho, P.; Mattisson, T.; Lyngfelt, A. Comparison of iron-, nickel-, copper- and manganese-based oxygen carriers for chemical looping combustion. Fuel 2004, 83, 1215-1225. 30. Mattisson, T.; Johansson, M.; Lyngfelt, A. Multi-cycle reduction and oxidation of different types of iron oxide particles Application to chemical-looping combustion. Energy Fuels 2004, 18, 628-637. 31. Johansson, M.; Mattisson, T.; Lyngfelt, A. Investigation of Fe
2O
3 with MgAl
2O
4 for
chemical-looping combustion. Ind. Eng.Chem. Res. 2004, 43, 6978-6987. 32. Mattisson, T.; Ja¨rdna¨s, A.; Lyngfelt, A. Reactivity of some metal oxides supported on alumina with alternating methane and oxygens Application for chemical-looping combustion. Energy Fuels 2003, 17, 643-651. 33. Adanez, J.; de Diego, L. F.; Garcia-Labiano, F.; Gayan, P.; Abad, A. Selection of Oxygen Carriers for Chemical-Looping Combustion. Energy Fuels 2004, 18, 371-377. 34. de Diego, L. F.; Garcia-Labiano, F.; Adanez, J.; Gayan, P.; Abad, A.; Corbella, B. M.; Palacios, J. M. Development of Cu-based Oxygen Carriers for Chemical-Looping Combustion. Fuel 2004, 83, 1749-1757. 35. Cho, P.; Mattisson, T.; Lyngfelt, A. Carbon Formation on Nickel and Iron Oxide-Containing Oxygen Carriers for Chemical- Looping Combustion. Ind. Eng. Chem. Res. 2005, 44, 668-676. 36. Mattisson, T.; Lyngfelt, A.; Cho, P. The use of iron oxide as an oxygen carrier for chemical-looping combustion of methane with inherent separation of CO
2. Fuel 2001, 80,
1953-1962. 37. Mattisson, T.; Jarders, A.; Lyngfelt, A. “Reactivity of some Metal Oxide Support on Alumina with Alternating Methane and Oxygen-application for Chemical-looping Combustion,” Energy & Fuels, 2003, 17, 643-651. 38. Lyngfelt, A.; Leckner, B.; Mattisson, T. A fluidized-bed combustion process with inherent CO2 separation; application of chemical-looping combustion. Chem. Eng. Sci. 2001, 56, 3101-
168
ESTABLISHMENT OF AN ENVIRONMENTAL CONTROL TECHNOLOGY LABORATORY WITH A CIRCULATING FLUIDIZED-BED COMBUSTION SYSTEM
3113. 39. Perry, R. H.; Green, D. W. Perry’s Chemical Engineers’ Handbook, seventh edition, 1997, The McGraw-Hill Companies, Inc. 40. Zafar, Q.; Mattisson, T.; Gevert, B. R. Integrated Hydrogen and Power Production with CO
2 Capture Using Chemical-Looping Reforming Redox Reactivity of Particles of CuO, Mn
2O
3, NiO,
and Fe2O
3 Using SiO
2 as a Support. Ind. Eng. Chem. Res., 2005, 44(10).
41. Kunii, D.; Levenspiel, O. Fluidization Engineering. Second edition, 1990, Butterworth-Heineman series in Chemical Engineering, ISBN: 0-409-90233-0. 42. Cao, Y.; Pan, W. P. Chemical Reversal Cycle of Solid Oxygen Carrier for Producing Pure Oxygen or Oxygen Rich Gas Stream. Prepr. Pap.-Am. Chem. Soc., Div. Fuel Chem. 2005, 51, 415-416. 43. Behra P, Bonnissel-Gissinger P, Alnot M, Revel R, Ehrhardt J. XPS and XAS study of the sorption of Hg0 onto Pyrite. Langmui. 2001; 17: 3970-3979. 44.Rio S, Delebarre A. Removal of mercury in aqueous solution by fluidized bed plant fly ash. Fuel. 2003; 82: 153-159.
169
ESTABLISHMENT OF AN ENVIRONMENTAL CONTROL TECHNOLOGY LABORATORY WITH A CIRCULATING FLUIDIZED-BED COMBUSTION SYSTEM
11. Acronyms and Abbreviations
• APCD: Air Pollutant Control Devices • BEI: Backscatter Electron Images • CEM: Continuous Emission Monitoring • CFBC: Circulating Fluidized Bed Combustor • CPM: Condensable particulate Matter • CR: Coffee Residue • CW: Chicken Waste • DOE: U.S. Department of Energy • EDS: Energy-dispersive X-Ray • EEI: Electric Energy, Inc. • EKPC: Eastern Kentucky Power Cooperative • EPA: Environmental Protection Agency • EPRI: Electric power Research institute • FBC: Fluidized Bed Combustor • FF: Fabric Filter • FPM: Filterable Particulate Matter • GVC: Gross Calorific Value • HID: Human Interface Device • HP: Horse Power • HX: Heat Exchanger • I/O: Input / Output • IC: Ion Chromatograph • ICCI: Illinois Clean Coal Institute • ICSET: Institute for Combustion Science
&Environmental Technology • IGCC: Integrated Gasification combined Cycle • LOI: Loss of Ignition • MSW: Municipal Solid Waste • NETL: National Energy Technology Laboratory • OHM: Ontario Hydro Method • PPM: Parts Per Million • PPT: Parts Per Trillion • PRB: Powder River Basin • PVC:` Polyvinyl Chloride • QA/QC Quality Assurance / Quality Control • RDF: Refuse-derived Fuel
170
ESTABLISHMENT OF AN ENVIRONMENTAL CONTROL TECHNOLOGY LABORATORY WITH A CIRCULATING FLUIDIZED-BED COMBUSTION SYSTEM
171
• ROMC: Region of Minimum Choice • SCR: Selective Catalytic Reduction • SEM: Scanning Electron Microscopy • SIPC: Southern Illinois Power Cooperative • TS: Tobacco Stalk • VOC: Volatile Organic Compound • WKU: Western Kentucky University • WP: Wood Pellets