334
U.S. Department of Education 42nd Annual Report to Congress on the Implementation of the Individuals with Disabilities Education Act, 2020
U.S. Department of Education
42nd Annual Report to Congress on the Implementation of the
Individuals with Disabilities Education Act, 2020
Discrimination Prohibited
In addition to implementing the Individuals with Disabilities Education Act, the U.S. Department of Education’s (Department) Office for Civil Rights (OCR) is responsible for enforcing several Federal civil rights laws. These Federal civil rights laws prohibit discrimination in programs or activities that receive Federal financial assistance from the Department. Discrimination on the basis of race, color, and national origin is prohibited by Title VI of the Civil Rights Act of 1964; sex discrimination in any education program or activity is prohibited by Title IX of the Education Amendments of 1972; discrimination on the basis of disability is prohibited by Section 504 of the Rehabilitation Act of 1973; and age discrimination is prohibited by the Age Discrimination Act of 1975. Additionally, Title II of the Americans with Disabilities Act of 1990 prohibits disability discrimination by public entities, whether or not they receive Federal financial assistance from the Department. Also, the Boy Scouts of America Equal Access Act provides that no public elementary school or State or local education agency that provides an opportunity for one or more outside youth or community groups to meet on school premises or in school facilities before or after school hours shall deny equal access or a fair opportunity to meet to, or discriminate against, any group officially affiliated with the Boy Scouts of America or any other youth group listed in Title 36 of the United States Code as a patriotic society.
For more information, please see OCR’s website at https://www2.ed.gov/about/offices/list/ocr/.
42nd Annual Report to Congress on the Implementation of the
Individuals with Disabilities Education Act, 2020
Individuals with Disabilities Education Act: to ensure the free appropriate public education
of all children with disabilities
Office of Special Education and Rehabilitative Services U.S. Department of Education
This report was produced under U.S. Department of Education Contract No. ED-OSE-17-O-0021 with New Editions Consulting, Inc. Richelle Davis served as the contracting officer’s representative. The views expressed herein do not necessarily represent the positions or policies of the U.S. Department of Education. No official endorsement by the U.S. Department of Education of any product, commodity, service, or enterprise mentioned in this publication is intended or should be inferred. For the reader’s convenience, this publication contains information about and from outside organizations, including hyperlinks and URLs. Inclusion of such information does not constitute an endorsement by the U.S. Department of Education.
U.S. Department of Education Mitchell Zais Acting Secretary
Office of Special Education and Rehabilitative Services (OSERS) Mark Schultz Delegated the authority to perform the functions and duties of the Assistant Secretary for the Office of Special Education and Rehabilitative Services
Office of Special Education Programs (OSEP) Laurie VanderPloeg Director
January 2021
This report is in the public domain. Authorization to reproduce it in whole or in part is granted. While permission to reprint this report is not necessary, the citation should be U.S. Department of Education, Office of Special Education and Rehabilitative Services, Office of Special Education Programs, 42nd Annual Report to Congress on the Implementation of the Individuals with Disabilities Education Act, 2020, Washington, D.C. 2021.
This report is available on the Department’s website at: http://www.ed.gov/about/reports/annual/osep.
To order copies of this report, Write to: ED PUBS, Education Publications Center, U.S. Department of Education, P.O. Box 22207, Alexandria, VA 22304. Or fax your request to: 703-605-6794. Or email your request to: [email protected]. Or call in your request toll-free to: 1-877-433-7827 (1-877-4-ED-PUBS). Those who use a telecommunications device for the deaf (TDD) or a teletypewriter (TTY) should call 1-877-576-7734. If 877 service is not available in your area, call 1-800-872-5327 (1-800-USA-LEARN). Or order online at: https://orders.gpo.gov/EDU/EDUPubs.aspx.
Availability of Alternate Formats Requests for documents in alternate formats such as braille or large print should be submitted to the Alternate Format Center by calling 202-260-0852 or by contacting the 504 coordinator via email at [email protected].
Notice to Limited English Proficient Persons If you have difficulty understanding English, you may request language assistance services for Department information that is available to the public. These language assistance services are available free of charge. If you need more information about interpretation or translation services, please call 1-800-USA-LEARN (1-800-872-5327) (TTY: 1-800-437-0833), or email us at: [email protected]. Or write to: U.S. Department of Education, Information Resource Center, LBJ Education Building, 400 Maryland Ave. SW, Washington, DC 20202.
Content Contact: Richelle Davis Phone: 202-245-7401 Email: [email protected]
iii
Contents
Page
List of Exhibits ........................................................................................................................................... vi
Preface ........................................................................................................................................................ xv
Key Findings at the National Level ........................................................................................................ xxi
Data Sources Used in This Report ............................................................................................................. 1
Section I. Summary and Analysis of IDEA Section 618 Data at the National Level ............................ 9
Infants and Toddlers Served Under IDEA, Part C ......................................................................... 11
Numbers and Percentages of Infants and Toddlers Birth Through Age 2 Served Under IDEA, Part C ........................................................................................................................... 12
Primary Early Intervention Service Settings for Infants and Toddlers Birth Through Age 2 Served Under IDEA, Part C .................................................................................................... 17
Part C Exiting ................................................................................................................................. 20Dispute Resolution for Infants and Toddlers Served Under IDEA, Part C.................................... 22
Children Ages 3 Through 5 Served Under IDEA, Part B ..........................................................27
Numbers and Percentages of Children Ages 3 Through 5 Served Under IDEA, Part B ..............28Educational Environments for Children Ages 3 Through 5 Served Under IDEA, Part B ............32Special Education Teachers and Paraprofessionals Employed to Serve Children Ages 3
Through 5 Under IDEA, Part B .......................................................................................35
Students Ages 6 Through 21 Served Under IDEA, Part B ........................................................38
Numbers and Percentages of Students Ages 6 Through 21 Served Under IDEA, Part B .............39Educational Environments for Students Ages 6 Through 21 Served Under IDEA, Part B ..........53Part B Participation and Performance on State Assessments ....................................................58Part B Exiting.......................................................................................................................67Special Education Teachers and Paraprofessionals Employed to Serve Students Ages 6
Through 21 Under IDEA, Part B .....................................................................................73
Children and Students Ages 3 Through 21 Served Under IDEA, Part B ...................................75
Personnel Employed to Provide Related Services for Children and Students Ages 3 Through 21 Served Under IDEA, Part B ..........................................................................75
Disciplinary Removals of Children and Students From Their Educational Placements ...............77Dispute Resolution for Children and Students Served Under IDEA, Part B ...............................81Coordinated Early Intervening Services .................................................................................85
iv
Contents (continued)
Page
Section II. Summary and Analysis of IDEA Section 618 Data at the State Level ............................... 87
Introduction ..............................................................................................................................89
Notes Concerning the Exhibits in Section II ..............................................................................90
Infants and Toddlers Birth Through Age 2 Served Under IDEA, Part C .................................... 91
Part C Child Count ......................................................................................................................... 91Part C Primary Early Intervention Service Settings ..................................................................... 102Part C Exiting ............................................................................................................................... 105Part C Dispute Resolution ............................................................................................................ 109
Children Ages 3 Through 5 Served Under IDEA, Part B ............................................................. 113
Part B Child Count .............................................................................................................113Part B Educational Environments ........................................................................................120Part B Personnel .................................................................................................................128
Students Ages 6 Through 21 Served Under IDEA, Part B ......................................................131
Part B Child Count .............................................................................................................131Part B Educational Environments ........................................................................................147Part B Participation on State Assessments ............................................................................159Part B Exiting.....................................................................................................................171Part B Personnel .................................................................................................................178
Children and Students Ages 3 Through 21 Served Under IDEA, Part B .................................181
Part B Discipline ................................................................................................................181Part B Dispute Resolution ...................................................................................................190
Section III Findings and Determinations Resulting From Reviews of State Implementation of IDEA ................................................................................................................................................... 197
Findings and Determinations Resulting From Reviews of State Implementation of IDEA ...... 199
The State Performance Plan and Annual Performance Report ................................................199Indicators ...........................................................................................................................200The Determination Process ..................................................................................................204Enforcement .......................................................................................................................215Determination Status ..........................................................................................................216Status of Selected Indicators ................................................................................................219
v
Contents (continued)
Page
Section IV. Summary of Research Conducted Under Part E of the Education Sciences Reform Act of 2002 ............................................................................................................................................... 227
Section V. Summary of Studies and Evaluations Under Section 664 of IDEA .................................. 259
Section VI. Extent and Progress of the Assessment of National Activities ........................................ 265
Appendix A. Infants, Toddlers, Children, and Students Served Under IDEA, by Age Group and State .................................................................................................................................................. 271
Appendix B. Developmental Delay Data for Children Ages 3 Through 5 and Students Ages 6 Through 9 Served Under IDEA, Part B ................................................................................................ 283
Appendix C. IDEA, Part B Maintenance of Effort (MOE) Reduction and Coordinated EarlyIntervening Services ................................................................................................................................ 291
vi
Exhibits
Page
Exhibit 1 Number of infants and toddlers birth through age 2 served under IDEA, Part C, and percentage of the population served, by year: Fall 2009 through fall 2018 ............... 12
Exhibit 2 Percentage of the population birth through age 2 served under IDEA, Part C, by year and age group: Fall 2009 through fall 2018 .............................................................. 13
Exhibit 3 Number of infants and toddlers birth through age 2 served under IDEA, Part C, and percentage of the population served (risk index), comparison risk index, and risk ratio for infants and toddlers birth through age 2 served under IDEA, Part C, by race/ethnicity: Fall 2018 .............................................................................................. 14
Exhibit 4 Cumulative number of infants and toddlers birth through age 2 served under IDEA, Part C, in 12-month reporting period and percentage of the population served (risk index), comparison risk index, and risk ratio for infants and toddlers birth through age 2 served under IDEA, Part C, by race/ethnicity: 12-month reporting period, 2017–18 ................................................................................................. 16
Exhibit 5 Percentage of infants and toddlers birth through age 2 served under IDEA, Part C, by primary early intervention service setting: Fall 2018 ...................................... 17
Exhibit 6 Percentage of infants and toddlers birth through age 2 served under IDEA, Part C, within racial/ethnic groups, by primary early intervention service setting: Fall 2018 ........................................................................................................................... 19
Exhibit 7 Percentage of infants and toddlers birth through age 2 served under IDEA, Part C, by exiting category: 2017–18 ............................................................................... 20
Exhibit 8 Percentage of infants and toddlers served under IDEA, Part C, who reached age 3 and were eligible to exit Part C, by Part B eligibility status: 2017–18 ............................. 21
Exhibit 9 Percentage of written, signed complaints for infants and toddlers birth through age 2 served under IDEA, Part C, by complaint status: 2017–18 ..................................... 23
Exhibit 10 Percentage of due process complaints for infants and toddlers birth through age 2 served under IDEA, Part C, by complaint status: 2017–18 .............................................. 24
Exhibit 11 Percentage of mediation requests for infants and toddlers birth through age 2 served under IDEA, Part C, by request status: 2017–18 ................................................... 25
Exhibit 12 Number of children ages 3 through 5 served under IDEA, Part B, and percentage of the population served, by year: Fall 2009 through fall 2018 ........................................ 28
Exhibit 13 Percentage of children ages 3 through 5 served under IDEA, Part B, by disability category: Fall 2018 ........................................................................................................... 29
vii
Exhibits (continued)
Page
Exhibit 14 Number of children ages 3 through 5 served under IDEA, Part B, and percentage of the population served (risk index), comparison risk index, and risk ratio for children ages 3 through 5 served under IDEA, Part B, by race/ethnicity: Fall 2018 .................................................................................................................................. 31
Exhibit 15 Percentage of children ages 3 through 5 served under IDEA, Part B, by educational environment: Fall 2018 .................................................................................. 32
Exhibit 16 Percentage of children ages 3 through 5 served under IDEA, Part B, within racial/ethnic groups, by educational environment: Fall 2018 ........................................... 34
Exhibit 17 Number of full-time equivalent (FTE) special education teachers and number and percentage of FTE fully certified special education teachers employed to provide special education and related services for children ages 3 through 5 served under IDEA, Part B: Fall 2017 .............................................................................. 35
Exhibit 18 Number of full-time equivalent (FTE) special education paraprofessionals and number and percentage of FTE qualified special education paraprofessionals employed to provide special education and related services for children ages 3 through 5 served under IDEA, Part B: Fall 2017 .............................................................. 37
Exhibit 19 Number of students ages 6 through 21 served under IDEA, Part B, and percentage of the population served, by year: Fall 2009 through fall 2018 ...................... 39
Exhibit 20 Percentage of the population ages 6 through 21 served under IDEA, Part B, by year and age group: Fall 2009 through fall 2018 .............................................................. 40
Exhibit 21 Percentage of students ages 6 through 21 served under IDEA, Part B, by disability category: Fall 2018............................................................................................ 41
Exhibit 22 Percentage of the population ages 6 through 21 served under IDEA, Part B, by year and disability category: Fall 2009 through fall 2018 ................................................ 43
Exhibit 23 Percentage of the population ages 6 through 21 served under IDEA, Part B, that was reported under the category of autism, by year and age group: Fall 2009 through fall 2018 ............................................................................................................... 44
Exhibit 24 Percentage of the population ages 6 through 21 served under IDEA, Part B, that was reported under the category of other health impairment, by year and age group: Fall 2009 through fall 2018 ................................................................................... 45
Exhibit 25 Percentage of the population ages 6 through 21 served under IDEA, Part B, that was reported under the category of specific learning disability, by year and age group: Fall 2009 through fall 2018 ................................................................................... 46
viii
Exhibits (continued)
Page
Exhibit 26 Number of students ages 6 through 21 served under IDEA, Part B, and percentage of the population served (risk index), comparison risk index, and risk ratio for students ages 6 through 21 served under IDEA, Part B, by race/ethnicity: Fall 2018 ........................................................................................................................... 48
Exhibit 27 Risk ratio for students ages 6 through 21 served under IDEA, Part B, within racial/ethnic groups, by disability category: Fall 2018 ..................................................... 49
Exhibit 28 Percentage of students ages 6 through 21 served under IDEA, Part B, within racial/ethnic groups, by disability category: Fall 2018 ..................................................... 51
Exhibit 29 Percentage of students ages 6 through 21 served under IDEA, Part B, by educational environment: Fall 2018 .................................................................................. 53
Exhibit 30 Percentage of students ages 6 through 21 served under IDEA, Part B, by year and educational environment: Fall 2009 through fall 2018 ..................................................... 54
Exhibit 31 Percentage of students ages 6 through 21 served under IDEA, Part B, within disability categories, by educational environment: Fall 2018 ........................................... 56
Exhibit 32 Percentage of students ages 6 through 21 served under IDEA, Part B, within racial/ethnic groups, by educational environment: Fall 2018 ........................................... 57
Exhibit 33 Percentages of students served under IDEA, Part B, in grades 3 through 8 and high school classified as participants and nonparticipants in State math assessments: School year 2017–18 ................................................................................... 58
Exhibit 34 Percentages of students served under IDEA, Part B, in grades 3 through 8 and high school classified as participants and nonparticipants in State reading assessments: School year 2017–18 ................................................................................... 60
Exhibit 35 Percentages of students served under IDEA, Part B, in grades 3 through 8 and high school who participated in State math assessments, by assessment type: School year 2017–18 ........................................................................................................ 61
Exhibit 36 Percentages of students served under IDEA, Part B, in grades 3 through 8 and high school who participated in State reading assessments, by assessment type: School year 2017–18 ........................................................................................................ 62
Exhibit 37 Numbers of States assessing students served under IDEA, Part B, in grades 3 through 8 and high school in math and median percentages of those students who were proficient, by assessment type: School year 2017–18 .............................................. 64
Exhibit 38 Numbers of States assessing students served under IDEA, Part B, in grades 3 through 8 and high school in reading and median percentages of those students who were proficient, by assessment type: School year 2017–18 ...................................... 65
ix
Exhibits (continued)
Page
Exhibit 39 Percentage of students ages 14 through 21 exiting IDEA, Part B, by exiting category: 2017–18 ............................................................................................................ 67
Exhibit 40 Percentages of students ages 14 through 21 exiting IDEA, Part B, and school, who graduated with a regular high school diploma or dropped out of school, by year: 2008–09 through 2017–18 ...................................................................................... 68
Exhibit 41 Percentage of students ages 14 through 21 exiting IDEA, Part B, and school, who graduated with a regular high school diploma, by year and disability category: 2008–09 through 2017–18 ................................................................................................ 70
Exhibit 42 Percentage of students ages 14 through 21 exiting IDEA, Part B, and school, who dropped out of school, by year and disability category: 2008–09 through 2017–18 ............................................................................................................................ 72
Exhibit 43 Number of full-time equivalent (FTE) special education teachers and number and percentage of FTE fully certified special education teachers employed to provide special education and related services for students ages 6 through 21 served under IDEA, Part B: Fall 2017 .............................................................................. 73
Exhibit 44 Number of full-time equivalent (FTE) special education paraprofessionals and number and percentage of FTE qualified special education paraprofessionals employed to provide special education and related services for students ages 6 through 21 served under IDEA, Part B: Fall 2017 ............................................................ 74
Exhibit 45 Number of full-time equivalent (FTE) personnel and number and percentage of FTE fully certified personnel employed to provide related services for children and students ages 3 through 21 served under IDEA, Part B, by personnel type: Fall 2017 ........................................................................................................................... 75
Exhibit 46 Numbers of children and students ages 3 through 21 who were served under IDEA, Part B; removed from their educational placements for disciplinary purposes; and removed per 10,000 children and students ages 3 through 21 served under IDEA, Part B, by type of disciplinary removal: School year 2017–18 ............................................................................................................................ 77
Exhibit 47 Numbers of children and students ages 3 through 21 served under IDEA, Part B, who were removed to an interim alternative educational setting and suspended or expelled for more than 10 days per 10,000 children and students ages 3 through 21 served under IDEA, Part B, by disability category and type of disciplinary removal: School year 2017–18 ......................................................................................... 79
Exhibit 48 Percentage of written, signed complaints for children and students ages 3 through 21 served under IDEA, Part B, by complaint status: 2017–18 ......................................... 82
x
Exhibits (continued)
Page
Exhibit 49 Percentage of due process complaints for children and students ages 3 through 21 served under IDEA, Part B, by complaint status: 2017–18 .............................................. 83
Exhibit 50 Percentage of mediation requests for children and students ages 3 through 21 served under IDEA, Part B, by request status: 2017–18 ................................................... 84
Exhibit 51 Number and percentage of children and students ages 3 through 21 served under IDEA, Part B, in 2017 who received coordinated early intervening services (CEIS) in school years 2015–16, 2016–17, or 2017–18: Fall 2018 .................................. 86
Exhibit 52 Percentage of the population birth through age 2 served under IDEA, Part C, by year and State: Fall 2009 and fall 2018 ............................................................................ 91
Exhibit 53 Percentage of the population birth through age 2 served under IDEA, Part C, for each racial/ethnic group, by State: Fall 2018 .................................................................... 94
Exhibit 54 Percentage of the population birth through age 2 served under IDEA, Part C, for each racial/ethnic group, cumulatively during 12-month reporting period, by State: 2017–18 .................................................................................................................. 98
Exhibit 55 Percentage of infants and toddlers birth through age 2 served under IDEA, Part C, by year, primary early intervention service setting, and State: Fall 2009 and fall 2018 ................................................................................................................... 102
Exhibit 56 Percentage of infants and toddlers birth through age 2 exiting or continuing in IDEA, Part C, by exiting category and State: 2017–18 .................................................. 105
Exhibit 57 Number of written, signed complaints; due process complaints; and mediation requests for infants and toddlers per 1,000 infants and toddlers birth through age 2 served under IDEA, Part C, by State: 2017–18 ........................................................... 110
Exhibit 58 Percentage of the population ages 3 through 5 served under IDEA, Part B, by year and State: Fall 2009 and fall 2018 .......................................................................... 113
Exhibit 59 Percentage of the population ages 3 through 5 served under IDEA, Part B, for each racial/ethnic group, by State: Fall 2018 .................................................................. 116
Exhibit 60 Percentage of children ages 3 through 5 served under IDEA, Part B, by educational environment and State: Fall 2018 ................................................................ 120
Exhibit 61 Percentage of children ages 3 through 5 served under IDEA, Part B, who were English learners, by educational environment and State: Fall 2018 .............................. 124
Exhibit 62 Number of full-time equivalent (FTE) special education teachers employed to provide special education and related services for children ages 3 through 5 per 100 children ages 3 through 5 served under IDEA, Part B, by certification status and State: Fall 2017 ........................................................................................................ 128
xi
Exhibits (continued)
Page
Exhibit 63 Percentage of the population ages 6 through 21 served under IDEA, Part B, by year and State: Fall 2009 and fall 2018 .......................................................................... 131
Exhibit 64 Percentage of the population ages 6 through 21 served under IDEA, Part B, for each racial/ethnic group, by State: Fall 2018 .................................................................. 134
Exhibit 65 Percentage of students ages 6 through 21 served under IDEA, Part B, who were reported under the category of autism, by year and State: Fall 2009 and fall 2018 ........ 138
Exhibit 66 Percentage of students ages 6 through 21 served under IDEA, Part B, who were reported under the category of other health impairment, by year and State: Fall 2009 and fall 2018 .......................................................................................................... 141
Exhibit 67 Percentage of students ages 6 through 21 served under IDEA, Part B, who were reported under the category of specific learning disability, by year and State: Fall 2009 and fall 2018 .......................................................................................................... 144
Exhibit 68 Percentage of students ages 6 through 21 served under IDEA, Part B, by educational environment and State: Fall 2018 ................................................................ 147
Exhibit 69 Percentage of students ages 6 through 21 served under IDEA, Part B, who were English learners, by educational environment and State: Fall 2018 .............................. 150
Exhibit 70 Percentage of students ages 6 through 21 served under IDEA, Part B, who were reported under the category of emotional disturbance, by educational environment and State: Fall 2018 ................................................................................... 153
Exhibit 71 Percentage of students ages 6 through 21 served under IDEA, Part B, who were reported under the category of intellectual disability, by educational environment and State: Fall 2018 ........................................................................................................ 156
Exhibit 72 Percentages of students served under IDEA, Part B, in grades 4, 8, and high school who participated and did not participate in a State math assessment, by State: School year 2017–18 ........................................................................................... 159
Exhibit 73 Percentages of students served under IDEA, Part B, in grades 4, 8, and high school who participated in State math assessments, by assessment type and State: School year 2017–18 ...................................................................................................... 162
Exhibit 74 Percentages of students served under IDEA, Part B, in grades 4, 8, and high school who participated and did not participate in a State reading assessment, by State: School year 2017–18 ............................................................................................ 165
Exhibit 75 Percentages of students served under IDEA, Part B, in grades 4, 8, and high school who participated in State reading assessments, by assessment type and State: School year 2017–18 ............................................................................................ 168
xii
Exhibits (continued)
Page
Exhibit 76 Percentages of students ages 14 through 21 exiting IDEA, Part B, and school who graduated with a regular high school diploma or dropped out of school, by year and State: 2009–10 and 2017–18 ............................................................................ 171
Exhibit 77 Percentage of students ages 14 through 21 exiting IDEA, Part B, by exiting category and State: 2017–18 ........................................................................................... 175
Exhibit 78 Number of full-time equivalent (FTE) special education teachers employed to provide special education and related services for students ages 6 through 21 per 100 students served under IDEA, Part B, by certification status and State: Fall 2017 ................................................................................................................................ 178
Exhibit 79 Number of children and students ages 3 through 21 served under IDEA, Part B, who were removed unilaterally to an interim alternative educational setting by school personnel for drug, weapons, or serious bodily injury offenses per 10,000 children and students ages 3 through 21 served under IDEA, Part B, by State: School year 2017–18 ...................................................................................................... 181
Exhibit 80 Number of children and students ages 3 through 21 served under IDEA, Part B, who were suspended out of school or expelled for more than 10 days during the school year per 10,000 children and students ages 3 through 21 served under IDEA, Part B, by State: School year 2017–18 ................................................................ 184
Exhibit 81 Number of children and students ages 3 through 21 served under IDEA, Part B, who were reported under the category of emotional disturbance and suspended out of school or expelled for more than 10 days during the school year per 10,000 children and students ages 3 through 21 served under IDEA, Part B, who were reported under the category of emotional disturbance, by State: School year 2017–18 .......................................................................................................................... 187
Exhibit 82 Numbers of written, signed complaints; due process complaints; and mediation requests for children and students served under IDEA, Part B, per 10,000 children and students ages 3 through 21 served, by State: 2017–18 ............................... 191
Exhibit 83 Number of complaints for children and students served under IDEA, Part B, per 10,000 children and students ages 3 through 21 served, by complaint status and State: 2017–18 ................................................................................................................ 194
Exhibit 84 Compliance and results indicators for determining the extent to which each State met IDEA, Part B, requirements: Federal fiscal year 2017 ............................................ 201
Exhibit 85 Compliance and results indicators for determining the extent to which each State met IDEA, Part C, requirements: Federal fiscal year 2017 ............................................ 203
Exhibit 86 Process for determining the extent to which each State met IDEA, Part B and Part C, requirements: Federal fiscal year 2017 ............................................................... 205
xiii
Exhibits (continued)
Page
Exhibit 87 States determined in 2019 to have met IDEA, Part B, requirements, by determination status: Federal fiscal year 2017 ................................................................ 216
Exhibit 88 States determined in 2019 to have met IDEA, Part C, requirements, by determination status: Federal fiscal year 2017 ................................................................ 217
Exhibit 89 Number of States determined in 2018 and 2019 to have met IDEA, Part B, requirements, by determination status and change in status: Federal fiscal years 2016 and 2017 ................................................................................................................. 218
Exhibit 90 Number of States determined in 2018 and 2019 to have met IDEA, Part C, requirements, by determination status and change in status: Federal fiscal years 2016 and 2017 ................................................................................................................. 219
Exhibit 91 Number of States, by percentage of children exiting IDEA, Part C, who received timely transition planning by the child’s third birthday, by sub-indicators of Part C Indicator 8: Federal fiscal year 2017 ................................................................... 221
Exhibit 92 Number of States, by percentage of children referred to IDEA, Part B, by Part C prior to age 3 who were found eligible for Part B and who had IEPs developed and implemented by the child’s third birthday (Indicator B12): Federal fiscal year 2017 ................................................................................................................................ 222
Exhibit 93 Number of States, by percentage of infants and toddlers with IFSPs who were below age expectation for the outcome when entering Part C who demonstrated improvement by age 3 or exit from Part C, by sub-indicators of Part C Indicator 3: Federal fiscal year 2017 .............................................................................................. 223
Exhibit 94 Number of States, by percentage of infants and toddlers with IFSPs who were functioning at age expectation for the outcome at age 3 or upon exiting Part C, by sub-indicators of Part C Indicator 3: Federal fiscal year 2017........................................ 224
Exhibit 95 Number of States, by percentage of children with IEPs who were below age expectation for the outcome when entering Part B who demonstrated improvement by age 6 or exit from Part B, by sub-indicators of Part B Indicator 7: Federal fiscal year 2017 .............................................................................................. 225
Exhibit 96 Number of States, by percentage of children with IEPs who were functioning at age expectation for the outcome at age 6 or upon exiting Part B, by sub-indicators of Part B Indicator 7: Federal fiscal year 2017 .............................................. 226
Exhibit A-1 Number and percentage of the population of infants and toddlers birth through age 2 served under IDEA, Part C, and children and students ages 3 through 21 served under IDEA, Part B, by age group and State: Fall 2018...................................... 273
xiv
Exhibits (continued)
Page
Exhibit A-2 Number of infants and toddlers birth through age 2 served under IDEA, Part C, by race/ethnicity and State: Fall 2018 ............................................................................. 276
Exhibit A-3 Number of children ages 3 through 5 served under IDEA, Part B, by race/ethnicity and State: Fall 2018 .................................................................................. 278
Exhibit A-4 Number of students ages 6 through 21 served under IDEA, Part B, by race/ethnicity and State: Fall 2018 .................................................................................. 280
Exhibit B-1 Number of States reporting children ages 3 through 5 served under IDEA, Part B, under the category of developmental delay and percentage of the population ages 3 through 5 served under IDEA, Part B, that was reported under the category of developmental delay, by year: Fall 2009 through fall 2018 ............................................ 286
Exhibit B-2 Number of States reporting students ages 6 through 9 served under IDEA, Part B, under the category of developmental delay and percentage of the population ages 6 through 9 served under IDEA, Part B, that was reported under the category of developmental delay, by year: Fall 2009 through fall 2018 ............................................ 287
Exhibit B-3 States reporting children ages 3 through 5 and students ages 6 through 9 served under IDEA, Part B, under the category of developmental delay, by State: Fall 2018 ................................................................................................................................ 288
Exhibit C-1 Number of students who received CEIS and number and percentage of LEAs or ESAs that were required to reserve 15 percent of IDEA Sections 611 and 619 funds for comprehensive CEIS due to significant disproportionality or that voluntarily reserved up to 15 percent of IDEA Sections 611 and 619 funds for CEIS, by State: School year 2017–18 ............................................................................. 294
Exhibit C-2 Number and percentage of LEAs or ESAs that met the IDEA, Part B, requirements under 34 C.F.R. § 300.600(a)(2), had an increase in IDEA Section 611 allocations, and took the maintenance of effort (MOE) reduction pursuant to IDEA Section 613(a)(2)(C), by State: School year 2017–18 .......................................... 296
xv
Preface
Since the enactment of the Education for All Handicapped Children Act of 1975 (EHA), Public Law (P.L.) 94-142 and its successor statute, the Individuals with Disabilities Education Act (IDEA, or Act), the Secretary of the U.S. Department of Education (Secretary) and her predecessor, the Commissioner of Education at the U.S. Department of Health, Education, and Welfare, have been required to transmit to Congress an annual report to inform Congress and the public of the progress being made in implementing the Act. The annual reports to Congress reflect a history of persistent commitment and effort to expand educational opportunities for children with disabilities.
The most recent reauthorization of IDEA (P.L. 108-446) occurred in December 2004, and Section 664(d) of IDEA continues to require the annual report to Congress. With the reauthorization of IDEA, the nation reaffirmed its commitment to improving the early intervention and educational results and functional outcomes for infants, toddlers, children, and youths with disabilities (collectively, this group may be referred to in this report as “children with disabilities”).
The 42nd Annual Report to Congress on the Implementation of the Individuals with Disabilities Education Act, 20201 describes our nation’s progress in (1) providing a free appropriate public education (FAPE) for children with disabilities under IDEA, Part B, and early intervention services to infants and toddlers with disabilities and their families under IDEA, Part C; (2) ensuring that the rights of these children with disabilities and their parents are protected; (3) assisting States and localities in providing IDEA services to all children with disabilities; and (4) assessing the effectiveness of efforts to provide IDEA services to children with disabilities. The report focuses on children with disabilities being served under IDEA, Part B and Part C, nationally and at the State level. Part B of IDEA provides funds to States to assist them in making FAPE available to eligible children ages 3 through 21 with disabilities who are in need of special education and related services, whereas Part C of IDEA provides funds to States to assist them in developing and implementing statewide, comprehensive, coordinated, multidisciplinary interagency systems to make early intervention services available to all eligible children from birth through age 2 with disabilities and their families.2 Throughout this report, children with disabilities who
1 The year in the title reflects the U.S. Department of Education’s target year for submitting the report to Congress. The most
current data in this report were collected from July 2017 through December 2018. These data have been available to the public prior to their presentation in this report. Subsequent references to this report and previously published annual reports will be abbreviated as the “XX Annual Report to Congress, Year” and will not include “on the Implementation of the Individuals with Disabilities Education Act.”
2 A State may elect to make Part C services available to infants and toddlers with disabilities beyond age 3, consistent with IDEA Sections 632(5)(B) and 635(c) and 34 Code of Federal Regulations (C.F.R.) § 303.211. Data on these children are included in the annual reporting requirements for Part C under IDEA Sections 616, 618, and 642.
xvi
receive services under IDEA, Part B, or under IDEA, Part C, are referred to as children served under IDEA, Part B; students served under IDEA, Part B; or infants and toddlers served under IDEA, Part C. “Special education services” is a term used throughout this report to represent services provided under IDEA, Part B. Similarly, “early intervention services” is a term used synonymously with services provided under IDEA, Part C.
This 42nd Annual Report to Congress, 2020 follows the 41st Annual Report to Congress, 2019 in sequence and format, and it continues to focus on IDEA results and accountability. Similar to the 41st Annual Report to Congress, 2019, the 42nd Annual Report to Congress, 2020 contains the following six major sections that address the annual report requirements contained in Section 664(d) of IDEA. The sections are (1) a summary and analysis of IDEA Section 618 data at the national level; (2) a summary and analysis of IDEA Section 618 data at the State level;3 (3) a summary and analysis of the U.S. Department of Education’s (Department) findings and determinations regarding the extent to which States are meeting the requirements of IDEA, Part B and Part C; (4) a summary of special education research conducted under Part E of the Education Sciences Reform Act of 2002; (5) a summary of national special education studies and evaluations conducted under Section 664(a) and (c) of IDEA; and (6) a summary of the extent and progress of the assessment of national activities, which focus on determining the effectiveness of IDEA and improving its implementation.
The content of this report differs from that of the 41st Annual Report to Congress, 2019 in several ways. The most recent data presented in this report represent the following applicable reporting periods: fall 2018, school year 2017–18, or a 12-month reporting period during 2017–18. Where data are presented for a 10-year period, the oldest data are associated with fall 2009. The 42nd Annual Report to Congress, 2020 also reflects changes in categories within four data collections—Part B child count, assessment, exiting, and personnel (see Changes in Data Categories and Subcategories on p. 5).
A summary of each of the six sections and three appendices that make up the 42nd Annual Report to Congress, 2020 follows.
3 Section 618 data consist of (1) the number of infants and toddlers served under IDEA, Part C; the settings in which they
receive program services; information on the transition at age 3 out of Part C; and dispute resolution information under IDEA Part C; and (2) the number of children and students served under IDEA, Part B; the environments in which they receive education; their participation in and performance on State assessments; information on their exiting special education services; the personnel employed to provide educational services to them; disciplinary actions that affect them; and dispute resolution information under IDEA, Part B.
xvii
Section I. Summary and Analysis of IDEA Section 618 Data at the National Level
Section I contains national data pertinent to Part B and Part C of IDEA. It contains four subsections. The four subsections focus on infants and toddlers served under IDEA, Part C; children ages 3 through 5 served under IDEA, Part B; students ages 6 through 21 served under IDEA, Part B; and children and students ages 3 through 21 served under IDEA, Part B. The exhibits provide information about the characteristics of infants, toddlers, children, and students receiving services under Part B and Part C; their disabilities; the settings in which they receive services; their participation in and performance on State assessments; their exits from Part B and Part C programs; their disciplinary removals; and their legal disputes. Also addressed are the characteristics of the personnel employed to provide special education and related services for the children and students. The data presented in the exhibits and discussed in the bulleted text represent the 50 States, the District of Columbia (DC), the Commonwealth of Puerto Rico (Puerto Rico/PR herein), and the four outlying areas of American Samoa, Guam, the Commonwealth of the Northern Mariana Islands (the Northern Mariana Islands herein), and the Virgin Islands. In addition, the exhibits that concern special education and related services provided under IDEA, Part B, include data for schools operated or funded by the Bureau of Indian Education (BIE) (referred to as Bureau of Indian Education schools or BIE schools, herein) within the U.S. Department of the Interior, and the three freely associated states: the Federated States of Micronesia, the Republic of Palau, and the Republic of the Marshall Islands.
Section II. Summary and Analysis of IDEA Section 618 Data at the State Level
Section II contains State-level data regarding Part B and Part C of IDEA. This section is organized into four subsections that focus on infants and toddlers served under IDEA, Part C; children ages 3 through 5 served under IDEA, Part B; students ages 6 through 21 served under IDEA, Part B; and children and students ages 3 through 21 served under IDEA, Part B. Each subsection addresses questions about the characteristics of infants, toddlers, children, and students receiving services under Part B and Part C; their disabilities; the settings in which they receive services; their participation in State assessments; their exits from Part B and Part C programs; their disciplinary removals; and their legal disputes. The characteristics of the personnel employed to provide special education and related services for the children and students are also addressed. The data presented in exhibits and discussed in the bulleted text represent the 50 States, the District of Columbia, Bureau of Indian Education schools, and Puerto Rico.
xviii
Section III. Findings and Determinations Resulting From Reviews of State Implementation of IDEA
Sections 616(d) and 642 of IDEA require the Secretary to make an annual determination as to the extent to which each State’s Part B and Part C programs are meeting the requirements of IDEA. To fulfill this requirement, the Secretary considers the State performance plan (SPP)/annual performance report (APR) of each State. Based on the information provided by the State in the SPP/APR, information obtained through monitoring reviews, and any other public information made available, the Secretary determines if the State meets the requirements and purposes of IDEA, needs assistance in implementing the requirements, needs intervention in implementing the requirements, or needs substantial intervention in implementing the requirements. In June 2019, the Department issued determination letters on implementation of IDEA for Federal fiscal year (FFY) 2017 to 60 State education agencies (SEAs) for Part B and to 56 State lead agencies for Part C. Section III presents the results of the determinations.
Section IV. Summary of Research Conducted Under Part E of the Education Sciences Reform Act of 2002
When Congress reauthorized IDEA in December 2004, it amended the Education Sciences Reform Act of 2002 (P.L. 107-279) by adding a new Part E to that Act. The new Part E established the National Center for Special Education Research (NCSER) as part of the Institute of Education Sciences (IES). NCSER began operation on July 1, 2005. As specified in Section 175(b) of the Education Sciences Reform Act of 2002, NCSER’s mission is to—
• Sponsor research to expand knowledge and understanding of the needs of infants, toddlers, children, and students with disabilities in order to improve the developmental, educational, and transitional results of such individuals;
• Sponsor research to improve services provided under, and support the implementation of, IDEA [20 United States Code (U.S.C.) § 1400 et seq.]; and
• Evaluate the implementation and effectiveness of IDEA in coordination with the National Center for Education Evaluation and Regional Assistance.
Section IV of this report describes the research projects funded by grants made during FFY 2019 (October 1, 2018, through September 30, 2019) by NCSER under Part E of the Education Sciences Reform Act of 2002.
Section V. Summary of Studies and Evaluations Under Section 664 of IDEA
In the December 2004 reauthorization of IDEA, Congress required the Secretary to delegate to the Director of IES responsibility to carry out studies and evaluations under Section 664(a), (b), (c),
xix
and (e) of IDEA. As specified in Section 664(a) of IDEA, IES, either directly or through grants, contracts, or cooperative agreements awarded to eligible entities on a competitive basis, assesses the progress in the implementation of IDEA, including the effectiveness of State and local efforts to provide (1) FAPE to children and students with disabilities and (2) early intervention services to infants and toddlers with disabilities and infants and toddlers who would be at risk of having substantial developmental delays if early intervention services were not provided to them. Section V of this report describes the studies and evaluations authorized by Section 664(a) and (e) of IDEA and supported by IES during FFY 2019 (October 1, 2018, through September 30, 2019).
Section VI. Extent and Progress of the Assessment of National Activities
Under Section 664(b) of IDEA (as amended in 2004), the Secretary is responsible for carrying out a “national assessment” of activities supported by Federal funds under IDEA. As delegated by the Secretary, IES is carrying out this national assessment to (1) determine the effectiveness of IDEA in achieving its purpose; (2) provide timely information to the President, Congress, the States, local education agencies (LEAs), and the public on how to implement IDEA more effectively; and (3) provide the President and Congress with information that will be useful in developing legislation to achieve the purposes of IDEA more effectively. The national assessment is designed to address specific research questions that focus on (1) the implementation and impact of programs assisted under IDEA in addressing developmental and academic outcomes for children with disabilities, (2) identification for early intervention and special education, (3) early intervention and special education services, and (4) early intervention and special education personnel. Studies supported in FFY 2019 (October 1, 2018, through September 30, 2019) that contribute to the national assessment are described in Section VI.
Appendix A. Infants, Toddlers, Children, and Students Served Under IDEA, by Age Group and State
Appendix A presents the numbers and percentages of the resident population represented by the infants and toddlers birth through age 2 served under IDEA, Part C, in 2018 in each State, the District of Columbia, Puerto Rico, and the four outlying areas (American Samoa, the Northern Mariana Islands, Guam, and the Virgin Islands) and the children ages 3 through 5 and students ages 6 through 21 served under IDEA, Part B, in 2018 in each State, the District of Columbia, Bureau of Indian Education schools, Puerto Rico, the four outlying areas, and the three freely associated states (the Federated States of Micronesia, the Republic of Palau, and the Republic of the Marshall Islands). It also presents the number of children and students served in each State, the District of Columbia, Bureau of Indian Education schools, Puerto Rico, the four outlying areas, and the three freely associated states, by race/ethnicity.
xx
Appendix B. Developmental Delay Data for Children Ages 3 Through 5 and Students Ages 6 Through 9 Served Under IDEA, Part B
Appendix B presents information about the children ages 3 through 5 and students ages 6 through 9 served under IDEA, Part B, under the category of developmental delay.4 Exhibits B-1 and B-2 provide data on the percentages of resident populations in the 50 States, the District of Columbia, and Puerto Rico represented by the children ages 3 through 5 and students ages 6 through 9 served under IDEA, Part B, who were reported under the category of developmental delay, respectively, in each year, 2009 through 2018. Exhibit B-3 identifies whether each State, the District of Columbia, Bureau of Indian Education schools, Puerto Rico, the four outlying areas, and the three freely associated states reported any children ages 3 through 5 or any students ages 6 through 9 under the developmental delay category in 2018.
Appendix C. IDEA, Part B Maintenance of Effort (MOE) Reduction and Coordinated Early Intervening Services
Appendix C presents State-level information on the number of students who received coordinated early intervening services (CEIS) and the number and percentage of LEAs and educational service agencies (ESAs) that were required to reserve 15 percent of IDEA Sections 611 and 619 funds for comprehensive CEIS due to significant disproportionality or that voluntarily reserved up to 15 percent of IDEA Sections 611 and 619 funds for CEIS. In addition, State-level data are presented on the number and percentage of LEAs and ESAs that met the IDEA, Part B, requirements under 34 Code of Federal Regulations (C.F.R.) § 300.600(a)(2) and had an increase in IDEA, Part B, Section 611 allocations and took the maintenance of effort (MOE) reduction pursuant to IDEA Section 613(a)(2)(C) in school year 2016–17.
4 This descriptor and other Section 618 data descriptors in this report are italicized within exhibits, text, and notes to clarify that
the reference is to a grouping of data.
xxi
Key Findings at the National Level
The 42nd Annual Report to Congress, 2020 presents data collected from States. The report also includes information from studies, evaluations, and databases of the Institute of Education Sciences and U.S. Census Bureau. Some key findings from Section I of the report, “Summary and Analysis of IDEA Section 618 Data at the National Level,” follow. To more completely understand the meaning and context for each of the findings featured below, the reader is advised to review the exhibit cited and the additional associated text.
Infants and Toddlers Served Under IDEA, Part C
• In 2018, there were 409,315 infants and toddlers birth through age 2 served under IDEA, Part C. Of those infants and toddlers, 406,582 were served in the 50 States and the District of Columbia. This number represented 3.5 percent of the birth-through-age-2 resident population in the 50 States and the District of Columbia (Exhibit 1).
• From 2009 through 2013, the percentage of the resident population of infants and toddlers birth through age 2 served under IDEA, Part C, was 2.8 percent. In 2014, the percentage increased to 2.9 percent and continued to increase to 3.2 percent in 2017. The percentage increased to 3.5 percent in 2018. From 2009 through 2013, the percentage of 2-year-olds in the resident population of infants and toddlers served under IDEA, Part C, fluctuated between 4.6 percent and 4.7 percent. In 2014, the percentage of 2-year-olds served increased to 4.9 percent and remained there in 2015. In 2016, the percentage of 2-year-olds served increased to 5.2 percent and increased again to 5.4 percent in 2017. In 2018, the percentage of 2-year-olds served increased further to 5.9 percent. The percentage of 1-year-olds in the resident population of infants and toddlers served under IDEA, Part C, fluctuated between 2.6 percent and 2.7 percent from 2009 through 2014. In 2015, the percentage increased to 2.8 percent and continued to increase to 3.1 percent in 2018. From 2009 through 2014, the percentage of infants and toddlers under 1 year in the resident population served under IDEA, Part C, fluctuated between 1 and 1.1 percent. In 2015, the percentage increased to 1.2 percent and remained there through 2018 (Exhibit 2).
• Native Hawaiian or Other Pacific Islander and White infants and toddlers had risk ratios of 1.3 and 1.1, respectively, indicating that infants and toddlers in each of these racial/ethnic groups were more likely than those in all other racial/ethnic groups combined to be served under IDEA, Part C. American Indian or Alaska Native, Asian, and Black or African American infants and toddlers and infants and toddlers associated with two or more racial/ethnic groups all had risk ratios of 0.9, indicating that infants and toddlers in each of these groups were less likely than those in all other racial/ethnic groups combined to be served under IDEA, Part C. Hispanic/Latino infants and toddlers, with a risk ratio of 1, were as likely to be served under Part C as the infants and toddlers of all other racial/ethnic groups combined (Exhibit 3).
• Cumulative child count data reveal Native Hawaiian or Other Pacific Islander and White infants and toddlers had risk ratios of 1.4 and 1.1, respectively, indicating that infants and toddlers in each of these racial/ethnic groups were more likely than those in all other racial/ethnic groups combined to be served under IDEA, Part C. Cumulative child count data reveal American Indian or Alaska Native, Asian, and Black or African American infants and toddlers and infants and
xxii
toddlers associated with two or more racial/ethnic groups had risk ratios of 0.9, 0.9, 0.9, and 0.8, respectively, indicating that infants and toddlers in each of these groups were less likely than those in all other racial/ethnic groups combined to be served under IDEA, Part C. Cumulative child count data reveal Hispanic/Latino infants and toddlers had a risk ratio of 1, indicating they were as likely to be served under Part C as the infants and toddlers of all other racial/ethnic groups combined (Exhibit 4).
• In 2018, of the 409,315 infants and toddlers served under Part C, 89.7 percent received their early intervention services primarily in the home. The category of community-based setting was reported as the primary early intervention setting for 7.4 percent of those served under Part C. Consequently, 97.1 percent of infants and toddlers served under IDEA, Part C, in 2018 received their early intervention services primarily in natural environments, which are defined as the home or a community-based setting (Exhibit 5).
• In 2018, home was the primary early intervention service setting for at least 83 percent of the infants and toddlers birth through age 2 served under IDEA, Part C, in each racial/ethnic group. The largest percentage of infants and toddlers served under IDEA, Part C, who received early intervention services in a community-based setting was associated with American Indian or Alaska Native infants and toddlers (13.9 percent), while the smallest percentage served in this setting was associated with Native Hawaiian or Other Pacific Islander infants and toddlers (5.1 percent) (Exhibit 6).
• Of the Part C exiting categories in 2017–18, Part B eligible, exiting Part C accounted for the largest percentage of infants and toddlers. Specifically, this category accounted for 137,953 of 373,002, or 37 percent, of infants and toddlers. An additional 3.3 percent of the infants and toddlers were found to be eligible for Part B but continued to receive services under Part C. Withdrawal by parent (or guardian) was the second most prevalent exiting category, as it accounted for 13.7 percent of the infants and toddlers. Part B eligibility not determined and no longer eligible for Part C prior to reaching age 3 accounted for 13.6 percent and 12.3 percent, respectively (Exhibit 7).
• In 2017–18, 137,953, or 58.9 percent, of the 234,090 infants and toddlers served under IDEA, Part C, who reached age 3 were determined to be Part B eligible, exiting Part C. An additional 5.2 percent of these infants and toddlers were found to be eligible for Part B but continued to receive services under Part C. Eligibility for Part B was not determined for 21.7 percent of the infants and toddlers served under IDEA, Part C, who had reached age 3. The remaining 14.2 percent of the infants and toddlers served under Part C who had reached age 3 exited Part C and were determined to be not eligible for Part B. The infants and toddlers who were not eligible for Part B included those who exited with referrals to other programs (8.2 percent) and those who exited with no referrals (6.0 percent) (Exhibit 8).
• During 2017–18, a total of 89 written, signed complaints were received through the dispute resolution process for infants and toddlers birth through age 2 served under IDEA, Part C. A report was issued for 73 (82.0 percent) of the complaints, while 15 (16.9 percent) of the complaints were withdrawn or dismissed. One (1.1 percent) of the complaints received during the reporting period was pending or unresolved by the end of the period (Exhibit 9).
• A total of 60 due process complaints were received during 2017–18 through the dispute resolution process for infants and toddlers birth through age 2 served under IDEA, Part C. For 50 (83.3 percent) of the due process complaints received during the reporting period, the complaint was withdrawn or dismissed. For nine (15.0 percent) of the due process complaints received, a
xxiii
hearing was conducted, and a written decision was issued. A hearing was still pending as of the end of the reporting period for one complaint (1.7 percent) (Exhibit 10).
• During 2017–18, a total of 115 mediation requests were received through the dispute resolution process for infants and toddlers birth through age 2 served under IDEA, Part C. A mediation was conducted before the end of the reporting period for 58 (50.4 percent) of the mediation requests received. The mediation that was held in two (1.7 percent) of these cases was related to a due process complaint, while the mediation held in 56 (48.7 percent) of these cases was not related to a due process complaint. The remaining 57 (49.6 percent) of the mediation requests received during the reporting period were withdrawn, dismissed, or otherwise ended without a mediation being held. No mediation requests were still pending at the end of the reporting period (Exhibit 11).
Children Ages 3 Through 5 Served Under IDEA, Part B
• In 2018, there were 815,010 children ages 3 through 5 served under Part B in the 49 States for which data were available, the District of Columbia, Bureau of Indian Education schools, Puerto Rico, the four outlying areas, and the three freely associated states. Of these children, 802,726 were served in 49 States, the District of Columbia, and Bureau of Indian Education schools. This number represented 6.8 percent of the resident population ages 3 through 5 (Exhibit 12).
• In 2018, the most prevalent disability category of children ages 3 through 5 served under IDEA, Part B, was speech or language impairment (specifically, 337,707 of 815,010 children, or 41.4 percent). The next most common disability category was developmental delay (37.7 percent), followed by autism (11.4 percent). The children ages 3 through 5 represented by the category “Other disabilities combined” accounted for the remaining 9.4 percent of children served under IDEA, Part B (Exhibit 13).
• In 2018, American Indian or Alaska Native, Native Hawaiian or Other Pacific Islander, and White children ages 3 through 5 had risk ratios above 1 (i.e., 1.4, 1.2, and 1.1, respectively). This indicates that the children in each of these groups were more likely to be served under Part B than were children ages 3 through 5 in all other racial/ethnic groups combined. Asian and Black or African American children ages 3 through 5, were associated with risk ratios less than 1 (i.e., 0.8 and 0.9, respectively), indicating that the children in each of these groups were less likely to be served under Part B than children ages 3 through 5 in all other racial/ethnic groups combined. Hispanic/Latino children and children associated with two or more racial/ethnic groups ages 3 through 5 were associated with risk ratios of 1, indicating that they were as likely to be served under Part B as the children of all other racial/ethnic groups combined (Exhibit 14).
• In 2018, a total of 547,211, or 67.1 percent, of the 815,010 children ages 3 through 5 served under IDEA, Part B, were in a regular early childhood program for some amount of their time in school. Children attending a regular early childhood program at least 10 hours per week and receiving the majority of hours of special education and related services in the regular early childhood program accounted for 40.2 percent of all children ages 3 through 5 served under IDEA, Part B. This represented more children than any other educational environment category. Separate class accounted for 22.4 percent of children ages 3 through 5 served under IDEA, Part B, making it the second most prevalent educational category. Collectively, separate school, residential facility, and home (which are represented by the term “Other environments”) accounted for 4.1 percent of the children ages 3 through 5 served under IDEA, Part B. The educational environment category for the remaining students, representing 6.3 percent of the
xxiv
children ages 3 through 5 served under IDEA, Part B, was a service provider location or some other location not in any other category (Exhibit 15).
• In 2018, the majority of children ages 3 through 5 served under IDEA, Part B, in each racial/ethnic group spent a portion of time in a regular early childhood program. Children attending a regular early childhood program at least 10 hours per week and receiving the majority of hours of special education and related services in the regular early childhood program accounted for the largest percentage of children who attended a regular early childhood program for every racial/ethnic group. Moreover, for every racial/ethnic group, this educational environment category accounted for a larger percentage of the children than did any other category of educational environment. The percentages of students in racial/ethnic groups served under the educational environment category of children attending a regular early childhood program at least 10 hours per week and receiving the majority of hours of special education and related services in the regular early childhood program ranged from 34.1 percent to 47.8 percent. Separate class was the second most prevalent educational environment category for each racial/ethnic group, except for American Indian or Alaska Native children and White children. This category accounted for 33.8 percent of Asian children, 25.8 percent of Black or African American children, 25.3 percent of Hispanic/Latino children, 26.1 percent of Native Hawaiian or Other Pacific Islander children, and 23.7 percent of children associated with two or more racial/ethnic groups. Children attending a regular early childhood program at least 10 hours per week and receiving the majority of hours of special education and related services in some other location was the second most prevalent educational environment category for American Indian or Alaska Native children (23.1 percent) and White children (19.2 percent) (Exhibit 16).
• In 2017, a total of 35,966, or 94.3 percent, of the 38,126 full-time equivalent (FTE) special education teachers who were employed to provide special education and related services for children ages 3 through 5 under IDEA, Part B, were fully certified (Exhibit 17).
• In 2017, a total of 53,166, or 94.6 percent, of the 56,188 FTE special education paraprofessionals who were employed to provide special education and related services for children ages 3 through 5 under IDEA, Part B, were qualified (Exhibit 18).
Students Ages 6 Through 21 Served Under IDEA, Part B
• In 2018, a total of 6,315,228 students ages 6 through 21 were served under IDEA, Part B, in the 49 States for which data were available, the District of Columbia, Bureau of Indian Education schools, Puerto Rico, the four outlying areas, and the three freely associated states. Of these students, 6,217,412 were served in 49 States, the District of Columbia, and Bureau of Indian Education schools. This number represented 9.5 percent of the resident population ages 6 through 21 (Exhibit 19).
• The percentage of the resident population ages 6 through 21 served under IDEA, Part B, in 2009 was 8.5 percent. The percentage decreased to 8.4 percent in 2010. The percentage remained at 8.4 percent until 2013, when it increased to 8.5 percent. The percentage continued to increase gradually to 9.5 percent in 2018. From 2009 to 2010, the percentage of the population ages 6 through 11 served under IDEA, Part B, decreased from 10.9 percent to 10.6 percent, where it remained in 2011. The percentage increased to 10.7 percent in 2012 and continued to increase each year thereafter, reaching a high of 12.3 percent in 2018. The percentage of the population ages 12 through 17 served under Part B was 10.9 percent in 2009. The percentage decreased to 10.8 percent in 2010 and remained there until it increased to 11 percent in 2014. The percentage
xxv
continued to increase, reaching a high of 11.8 percent in 2018. The percentage of the population ages 18 through 21 served under Part B was 2 percent in each year from 2009 through 2018 (Exhibit 20).
• In 2018, the most prevalent disability category of students ages 6 through 21 served under IDEA, Part B, was specific learning disability (specifically, 2,377,739, or 37.7 percent, of the 6,315,228 students ages 6 through 21 served under IDEA, Part B). The next most common disability category was speech or language impairment (16.4 percent), followed by other health impairment (16.2 percent), autism (10.5 percent), intellectual disability (6.7 percent), and emotional disturbance (5.5 percent). Students ages 6 through 21 in “Other disabilities combined” accounted for the remaining 7 percent of students ages 6 through 21 served under IDEA, Part B (Exhibit 21).
• The percentage of the resident population ages 6 through 21 served under IDEA, Part B, that was reported under disability categories changed by two-tenths of a percentage point or less between 2009 and 2018 for all but two categories. The percentage of the population reported under autism increased by 0.5 of a percentage point. The percentage of the population reported under other health impairment also increased by 0.5 of a percentage point (Exhibit 22).
• Between 2009 and 2018, the percentage of the resident population ages 6 through 21 served under IDEA, Part B, that was reported under the category of autism increased gradually from 0.5 percent to 1 percent. Between 2009 and 2018, the percentages of the populations ages 6 through 11, 12 through 17, and 18 through 21 served under IDEA, Part B, that were reported under the category of autism all increased. Specifically, the percentages of these three age groups that were reported under the category of autism were 80.2 percent, 130.5 percent, and 140.7 percent larger in 2018 than in 2009, respectively (Exhibit 23).
• From 2009 through 2018, the percentage of the resident population ages 6 through 21 served under IDEA, Part B, that was reported under the category of other health impairment increased gradually from 1 percent to 1.5 percent. The percentages of the populations ages 6 through 11, 12 through 17, and 18 through 21 served under IDEA, Part B, that were reported under the category of other health impairment were 57.3 percent, 51.6 percent, and 45.3 percent larger in 2018 than in 2009, respectively (Exhibit 24).
• From 2009 through 2011, the percentage of the resident population ages 6 through 21 served under IDEA, Part B, that was reported under the category of specific learning disability decreased from 3.6 percent to 3.4 percent, where it remained until 2016, when the percentage increased to 3.5 percent. The percentage remained at 3.5 percent in 2017, then increased to 3.6 percent in 2018. The percentage of the population ages 6 through 11 served under IDEA, Part B, that was reported under the category of specific learning disability was 8.1 percent larger in 2018 than in 2009. However, the percentages of the populations ages 12 through 17 and 18 through 21 served under IDEA, Part B, that were reported under this category were 3.9 percent and 17.7 percent smaller in 2018 than in 2009, respectively (Exhibit 25).
• In 2018, for all disabilities, American Indian or Alaska Native students, Black or African American students, Hispanic/Latino students, and Native Hawaiian or Other Pacific Islander students ages 6 through 21, with risk ratios of 1.6, 1.4, 1.1, and 1.5, respectively, were more likely to be served under IDEA, Part B, than were students ages 6 through 21 in all other racial/ethnic groups combined. Asian students and White students ages 6 through 21, with risk ratios of 0.5 and 0.9, respectively, were less likely to be served under IDEA, Part B, than were students ages 6 through 21 in all other racial/ethnic groups combined. With a risk ratio of 1,
xxvi
students associated with two or more races were as likely to be served under IDEA, Part B, as were students ages 6 through 21 in all other racial/ethnic groups combined (Exhibit 26).
• With a risk ratio of 4, American Indian or Alaska Native students ages 6 through 21 were four times as likely to be served under IDEA, Part B, for developmental delay than were students ages 6 through 21 in all other racial/ethnic groups combined. The risk ratio for American Indian or Alaska Native students ages 6 through 21 was equal to 1 for autism and orthopedic impairment and higher than 1 for each of the other disability categories. Asian students ages 6 through 21 were 1.1 times as likely to be served under IDEA, Part B, for the disability category of autism and 1.2 times as likely to be served under IDEA, Part B, for the disability category of hearing impairment than were students ages 6 through 21 in all other racial/ethnic groups combined. The risk ratio for Asian students ages 6 through 21 was equal to 1 for deaf-blindness and orthopedic impairment and less than 1 for each of the other disability categories. With a risk ratio higher than 1, Black or African American students ages 6 through 21 were more likely to be served under IDEA, Part B, than were students ages 6 through 21 in all other racial/ethnic groups combined for the following disability categories: autism (1.1), developmental delay (1.6), emotional disturbance (1.9), intellectual disability (2.2), multiple disabilities (1.3), other health impairment (1.4), specific learning disability (1.5), traumatic brain injury (1.1), and visual impairment (1.1). The risk ratio for Black or African American students ages 6 through 21 was less than 1 for deaf-blindness (0.8) and orthopedic impairment (0.9) and equal to 1 for hearing impairment and speech or language impairment. With a risk ratio higher than 1, Hispanic/Latino students ages 6 through 21 were more likely to be served under IDEA, Part B, than were students ages 6 through 21 in all other racial/ethnic groups combined for the following disability categories: hearing impairment (1.4), orthopedic impairment (1.2), specific learning disability (1.4), and speech or language impairment (1.1). The risk ratio for Hispanic/Latino students ages 6 through 21 was equal to 1 for intellectual disability and less than 1 for all other disability categories. Native Hawaiian or Other Pacific Islander students ages 6 through 21 were at least two times as likely to be served under IDEA, Part B, for developmental delay (2.1), hearing impairment (2.5), and multiple disabilities (2.1) than were students ages 6 through 21 in all other racial/ethnic groups combined. The risk ratio for Native Hawaiian or Other Pacific Islander students ages 6 through 21 was higher than 1 for every other disability category as well, compared to all other racial/ethnic groups combined. With a risk ratio higher than 1, White students ages 6 through 21 were more likely to be served under IDEA, Part B, than were students ages 6 through 21 in all other racial/ethnic groups combined for the following disability categories: deaf-blindness (1.1), multiple disabilities (1.1), other health impairment (1.2), and traumatic brain injury (1.2). The risk ratio for White students ages 6 through 21 was equal to 1 for autism, emotional disturbance, speech or language impairment, and visual impairment and less than 1 for all other disability categories. With a risk ratio higher than 1, students ages 6 through 21 associated with two or more races were more likely to be served under IDEA, Part B, than were students ages 6 through 21 in all other racial/ethnic groups combined for the following disability categories: autism (1.1), developmental delay (1.4), emotional disturbance (1.4), other health impairment (1.2), and speech or language impairment (1.1). The risk ratio for students ages 6 through 21 associated with two or more races was equal to 1 for traumatic brain injury and less than 1 for all other disability categories (Exhibit 27).
• For the students ages 6 through 21 served under IDEA, Part B, in 2018, specific learning disability was more prevalent than any other disability category for almost every racial/ethnic group. In particular, this disability category accounted for 43.8 percent of American Indian or Alaska Native students, 23 percent of Asian students, 39.3 percent of Black or African American students, 45.1 percent of Hispanic/Latino students, 49.1 percent of Native Hawaiian or Other Pacific Islander students, 33.5 percent of White students, and 33.5 percent of students associated
xxvii
with two or more racial/ethnic groups. Autism was the most prevalent disability category for Asian students (24.8 percent). Other health impairment was the second most prevalent disability category for the following racial/ethnic groups: Black or African American students (16.2 percent), Native Hawaiian or Other Pacific Islander students (11.3 percent), White students (18.7 percent), and students associated with two or more racial/ethnic groups (18.1 percent). Speech or language impairment was the second most prevalent disability category for American Indian or Alaska Native students (14.1 percent), Asian students (23.4 percent), and Hispanic/Latino students (16.9 percent) (Exhibit 28).
• In 2018, a total of 6,001,138, or 95 percent, of the 6,315,228 students ages 6 through 21 served under IDEA, Part B, were educated in regular classrooms for at least some portion of the school day. The majority (64.0 percent) of students ages 6 through 21 served under IDEA, Part B, were educated inside the regular class 80% or more of the day. Also, 17.9 percent of students ages 6 through 21 served under IDEA, Part B, were educated inside the regular class 40% through 79% of the day, and 13.1 percent were educated inside the regular class less than 40% of the day. Additionally, 5 percent of students ages 6 through 21 served under IDEA, Part B, were educated outside of the regular classroom in “Other environments” (Exhibit 29).
• From 2009 through 2018, the percentage of students ages 6 through 21 served under IDEA, Part B, who were educated inside the regular class 80% or more of the day increased from 59.4 percent to 64 percent. The percentage of students ages 6 through 21 served under IDEA, Part B, who were educated inside the regular class 40% through 79% of the day decreased from 20.7 percent in 2009 to 18.6 percent in 2014. The percentage increased to 18.7 percent in 2015 and then decreased to 17.9 percent in 2018. The percentage of students ages 6 through 21 served under IDEA, Part B, who were educated inside the regular class less than 40% of the day decreased from 14.6 percent in 2009 to 13.1 percent in 2018. The percentage of students ages 6 through 21 served under IDEA, Part B, who were educated in “Other environments” fluctuated between 5.1 and 5.3 percent from 2009 through 2012. The percentage dipped to 5 percent in 2013 and then climbed to 5.3 percent in 2014. The percentage dropped to 5.2 percent in 2015, 5.1 percent in 2016 and 2017, and 5 percent in 2018 (Exhibit 30).
• In 2018, the percentage of students ages 6 through 21 served under IDEA, Part B, in each educational environment varied by disability category. More than 8 in 10 students reported under the category of speech or language impairment (87.5 percent) were educated inside the regular class 80% or more of the day. Less than 2 in 10 students, or 17.4 percent, reported under the category of intellectual disability and 14.3 percent of students reported under the category of multiple disabilities were educated inside the regular class 80% or more of the day. Almost one-half (48.6 percent) of students reported under the category of intellectual disability and 44.8 percent of students reported under the category of multiple disabilities were educated inside the regular class less than 40% of the day. In 2018, larger percentages of students reported under the categories of deaf-blindness (25.9 percent) and multiple disabilities (23.3 percent), compared to students reported under other disability categories, were educated in “Other environments” (Exhibit 31).
• In 2018, for each racial/ethnic group, the largest percentage of students ages 6 through 21 served under IDEA, Part B, was educated inside the regular class 80% or more of the day. The students who were educated inside the regular class 80% or more of the day accounted for at least 50 percent of the students in each of the racial/ethnic groups, ranging from 57.4 percent to 67 percent. The students who were educated inside the regular class 40% through 79% of the day accounted for between 16.1 and 24.9 percent of the students within each racial/ethnic group. Less than 20 percent of the students within each racial/ethnic group, except for Asian students
xxviii
(21.0 percent), were educated inside the regular class less than 40% of the day. “Other environments” accounted for less than 6 percent of the students within each racial/ethnic group (Exhibit 32).
• In school year 2017–18, between 93.4 and 95.7 percent of students served under IDEA, Part B, in each of grades 3 through 8 and high school, who did not have a medical exemption, participated in a math assessment. Between 4.3 and 6.6 percent did not participate (Exhibit 33).
• In school year 2017–18, between 92.9 and 95.6 percent of students served under IDEA, Part B, in each of grades 3 through 8 and high school, who did not have a medical exemption, participated in a reading assessment. Between 4.4 and 7.1 percent did not participate (Exhibit 34).
• In school year 2017–18, between 43.5 and 54 percent of students served under IDEA, Part B, in each of grades 3 through 8 and high school participated in a regular assessment based on grade-level academic achievement standards with accommodations in math. Between 32.1 and 43.6 percent of students served under IDEA, Part B, in each of grades 3 through 8 and high school participated in a regular assessment based on grade-level academic achievement standards without accommodations in math. All students in each of grades 3 through 8 and high school who participated in an alternate assessment in math in school year 2017–18 took an alternate assessment based on alternate achievement standards. Between 8.5 and 9.6 percent of students served under IDEA, Part B, in each of grades 3 through 8 and high school participated in an alternate assessment based on alternate achievement standards in math (Exhibit 35).
• In school year 2017–18, between 41.4 and 51.3 percent of students served under IDEA, Part B, in each of grades 3 through 8 and high school participated in a regular assessment based on grade-level academic achievement standards with accommodations in reading. Between 34.5 and 45.6 percent of students served under IDEA, Part B, in each of grades 3 through 8 and high school participated in a regular assessment based on grade-level academic achievement standards without accommodations in reading. All students in each of grades 3 through 8 and high school who participated in an alternate assessment in reading in school year 2017–18 took an alternate assessment based on alternate achievement standards. Between 8.6 and 9.6 percent of students served under IDEA, Part B, in each of grades 3 through 8 and high school participated in an alternate assessment based on alternate achievement standards in reading (Exhibit 36).
• For school year 2017–18, of the 60 jurisdictions (i.e., the 50 States, the District of Columbia, Puerto Rico, Bureau of Indian Education schools, the four outlying areas, and the three freely associated states), non-suppressed data were available for between 40 and 48 jurisdictions that administered a regular assessment based on grade-level academic achievement standards in math to some students served under IDEA, Part B, in each of grades 3 through 8 and high school. The median percentages of these students who were found to be proficient with these math tests ranged from 7 percent to 23.5 percent. Non-suppressed data were available for between 48 and 50 jurisdictions that administered an alternate assessment based on alternate achievement standards for math to some students served under IDEA, Part B, in each of grades 3 through 8 and high school. The median percentages of these students who were found to be proficient with these math tests ranged from 36.4 percent to 42.8 percent (Exhibit 37).
xxix
• For school year 2017–18, of the 60 jurisdictions (i.e., the 50 States, the District of Columbia, Puerto Rico, Bureau of Indian Education schools, the four outlying areas, and the three freely associated states), non-suppressed data were available for between 43 and 48 jurisdictions that administered a regular assessment based on grade-level academic achievement standards in reading to some students served under IDEA, Part B, in each of grades 3 through 8 and high school. The median percentages of these students who were found to be proficient with these reading tests ranged from 10.9 percent to 18.9 percent. Non-suppressed data were available for between 46 and 49 jurisdictions that administered an alternate assessment based on alternate achievement standards for reading to some students served under IDEA, Part B, in each of grades 3 through 8 and high school. The median percentages of these students who were found to be proficient with these reading tests ranged from 42.5 percent to 47.2 percent (Exhibit 38).
• Of the eight exiting categories, graduated with a regular high school diploma accounted for the largest percentage of students ages 14 through 21 who exited special education in 2017–18 (specifically, 300,447, or 47.5 percent, of the 632,746 such students). This was followed by moved, known to be continuing in education (25.2 percent) and dropped out (10.4 percent) (Exhibit 39).
• In 2017–18, a total of 72.7 percent of the students ages 14 through 21 who exited IDEA, Part B, and school graduated with a regular high school diploma, while 16 percent dropped out. The percentage of students who exited special education and school by having graduated with a regular high school diploma increased from 60.6 percent in 2008–09 to 72.7 percent in 2017–18. From 2008–09 through 2017–18, the percentage of students who exited special education and school by having dropped out generally decreased from 22.4 percent to 16 percent (Exhibit 40).
• In comparison to school year 2008–09, the graduation percentage in 2017–18 increased for students who exited IDEA, Part B, and school in all disability categories except multiple disabilities. The graduation percentage increased by 4.3 percentage points for students in the deaf-blindness category and by at least 5 percentage points for students in the remaining disability categories. From 2008–09 through 2014–15, the disability category with the largest graduation percentage was visual impairment. From 2015–16 through 2017–18, the disability category of speech or language impairment was associated with the largest graduation percentage. The students reported under the category of intellectual disability had the smallest graduation percentages from 2008–09 through 2016–17. The students reported under the category of multiple disabilities had the smallest graduation percentage in 2017‒18 (46.6 percent) (Exhibit 41).
• The dropout percentage was lower in school year 2017–18 than in 2008–09 for students who exited IDEA, Part B, and school in all disability categories except autism. The dropout percentage decreases were less than 10 percentage points in each disability category. In each year from 2008–09 through 2017–18, a larger percentage of the students reported under the category of emotional disturbance exited special education and school by dropping out than for any other reason. In each year, the dropout percentage was no less than 30 percent, which was larger than the dropout percentage for any other disability category (Exhibit 42).
• In 2017, a total of 362,027, or 93 percent, of the 389,456 full-time equivalent (FTE) special education teachers who provided special education and related services for students ages 6 through 21 under IDEA, Part B, were fully certified (Exhibit 43).
xxx
• In 2017, a total of 430,375, or 93.8 percent, of the 458,676 FTE special education paraprofessionals who provided special education and related services for students ages 6 through 21 under IDEA, Part B, were qualified (Exhibit 44).
Children and Students Ages 3 Through 21 Served Under IDEA, Part B
• In 2017, a total of 97.5 percent of all full-time equivalent (FTE) personnel who were employed to provide related services for children and students ages 3 through 21 served under IDEA, Part B, were fully certified. In 10 of the 11 related services personnel categories, 95 percent or more of FTE related services personnel were fully certified. Interpreters was the exception at 90.2 percent (Exhibit 45).
• During the 2017–18 school year, 7,689 children and students ages 3 through 21 served under IDEA, Part B, in the jurisdictions for which data were available experienced a unilateral removal to an interim alternative educational setting by school personnel (not the IEP [individualized education program] team) for drugs, weapons, or serious bodily injury. Given that 6,444,338 children and students ages 3 through 21 were served under Part B in 2017, in the States for which data were available, this type of action occurred with 12 children and students for every 10,000 children and students who were served under Part B in 2017. A total of 359 children and students ages 3 through 21 served under IDEA, Part B, or less than 1 for every 10,000 children and students served in the jurisdictions for which data were available, experienced a removal to an interim alternative educational setting based on a hearing officer determination regarding likely injury in school year 2017–18. There were 51,236 children and students ages 3 through 21 served under IDEA, Part B, or 76 for every 10,000 children and students served in the jurisdictions for which data were available, who received out-of-school suspensions or expulsions for more than 10 cumulative days in school year 2017–18. There were 22,214 children and students ages 3 through 21 served under IDEA, Part B, or 33 for every 10,000 children and students served in the jurisdictions for which data were available, who received in-school suspensions for more than 10 cumulative days in school year 2017–18 (Exhibit 46).
• For every 10,000 children and students ages 3 through 21 served under IDEA, Part B, who were reported under the category of emotional disturbance in 2017, there were 45 children and students removed unilaterally to an interim alternative educational setting by school personnel for offenses involving drugs, weapons, or serious bodily injury during school year 2017–18. The ratio for the children and students reported under each of the other disability categories was 19 or less per 10,000 children and students served. Without regard for disability category, for every 10,000 children and students ages 3 through 21 served under IDEA, Part B, in 2017, no more than three children and students were removed by a hearing officer for likely injury during school year 2017–18. For every 10,000 children and students ages 3 through 21 served under IDEA, Part B, who were reported under the category of emotional disturbance in 2017, there were 375 children and students who received out-of-school suspensions or expulsions for more than 10 cumulative days during school year 2017–18. The ratio for the children and students reported under each of the other disability categories was 145 or less per 10,000 children and students served. For every 10,000 children and students ages 3 through 21 served under IDEA, Part B, who were reported under the category of emotional disturbance in 2017, there were 112 children and students who received in-school suspensions for more than 10 cumulative days during school year 2017–18. The ratio for the children and students reported under each of the other disability categories was 66 or less per 10,000 children and students served (Exhibit 47).
xxxi
• During 2017–18, a total of 5,228 written, signed complaints were received through the dispute resolution process for children and students ages 3 through 21 served under IDEA, Part B. A report was issued for 3,401 (65.1 percent) of the complaints, while 1,677 (32.1 percent) of the complaints were withdrawn or dismissed. A total of 150 (2.9 percent) of the complaints that were received during the 2017–18 reporting period were pending or unresolved by the end of the period (Exhibit 48).
• A total of 19,337 due process complaints were received during 2017–18 through the dispute resolution process for children and students ages 3 through 21 served under IDEA, Part B. For 11,512 (59.5 percent) of the due process complaints received during the 2017–18 reporting period, a resolution was achieved without a hearing. For 1,922 (9.9 percent) of the due process complaints received, a hearing was conducted and a written decision was issued. For 5,903 (30.5 percent) of the due process complaints received, a resolution was still pending at the end of the reporting period (Exhibit 49).
• During 2017–18, a total of 11,613 mediation requests were received through the dispute resolution process for children and students ages 3 through 21 served under IDEA, Part B. For 3,861 (33.2 percent) of the mediation requests received, a mediation related to a due process complaint was conducted. For 2,844 (24.5 percent) of the mediation requests received, a mediation that was not related to a due process complaint was conducted. For 965 requests (8.3 percent), a mediation session was still pending as of the end of the 2017–18 reporting period. The remaining 3,943 mediation requests (34.0 percent) were withdrawn or otherwise not held by the end of the reporting period (Exhibit 50).
• A total of 84,312, or 1.2 percent, of the 7,130,238 children and students ages 3 through 21 served under Part B in 2018 by 49 States, the District of Columbia, Bureau of Indian Education schools, Puerto Rico, the four outlying areas, and the three freely associated states received coordinated early intervening services (CEIS) in school year(s) 2015–16, 2016–17, or 2017–18 prior to being served under Part B (Exhibit 51).

1
Data Sources Used in This Report
This 42nd Annual Report to Congress, 2020 contains data from the U.S. Department of Education’s (Department) EDFacts Data Warehouse (EDW), as well as publicly available documents from the Office of Special Education Programs (OSEP). Other data sources used in this report include the Department’s Institute of Education Sciences (IES) and the U.S. Census Bureau. Brief descriptions of these data sources1 follow. Further information about each data source can be found at the website referenced at the end of each description. Unless otherwise specified, each URL provided in this report was accessed in fall 2019.
EDFacts Data Warehouse
Data Collections
The text and exhibits contained in the 42nd Annual Report to Congress, 2020 were developed primarily from data in the Department’s EDW. EDW is a repository for performance data collected across offices in the Department. It contains all of the data States are required to collect under Section 618 of the Individuals with Disabilities Education Act (IDEA). The State data that are in EDW are obtained each year through data collections approved by the Office of Management and Budget (OMB). Each data collection concerns a distinct domain of information. The data collections for the data that are primarily featured in this report concern—
• The number of infants and toddlers served under Part C of IDEA and the number of children and students served under Part B of IDEA on the State-designated data collection date;
• The settings in which Part C program services and environments in which Part B education services are received on the State-designated data collection date;
• The cumulative number of infants and toddlers served under Part C of IDEA during the State-designated 12-month reporting period;
• The Part C exiting categories of infants and toddlers and Part B exiting categories of students;
• Part B and Part C legal disputes and their resolution status;
• Participation in and performance on State assessments in math and reading by students served under Part B;
1 When a data source referenced in the report is a website, the accompanying access date refers to the time when the data were
originally gathered from the source for preparing the exhibits or summaries that appear herein.
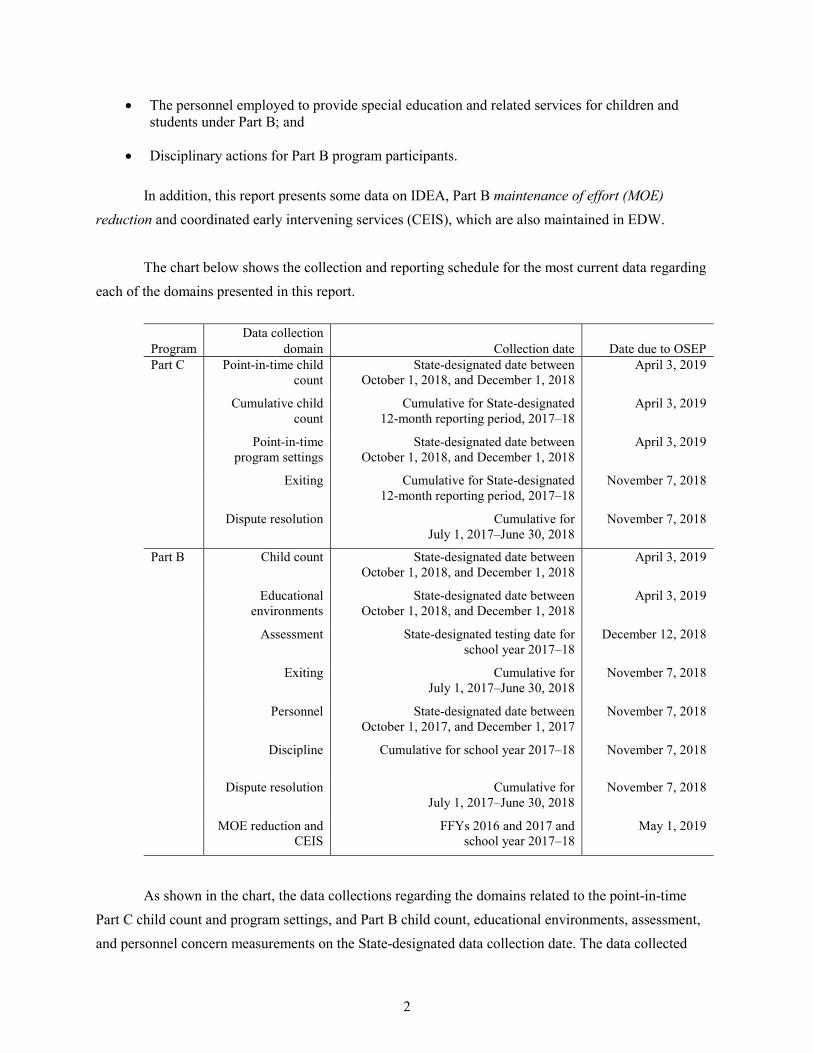
2
• The personnel employed to provide special education and related services for children and students under Part B; and
• Disciplinary actions for Part B program participants.
In addition, this report presents some data on IDEA, Part B maintenance of effort (MOE) reduction and coordinated early intervening services (CEIS), which are also maintained in EDW.
The chart below shows the collection and reporting schedule for the most current data regarding each of the domains presented in this report.
Program Data collection
domain Collection date Date due to OSEP Part C Point-in-time child
count State-designated date between
October 1, 2018, and December 1, 2018 April 3, 2019
Cumulative child count
Cumulative for State-designated 12-month reporting period, 2017–18
April 3, 2019
Point-in-time program settings
State-designated date between October 1, 2018, and December 1, 2018
April 3, 2019
Exiting Cumulative for State-designated 12-month reporting period, 2017–18
November 7, 2018
Dispute resolution Cumulative for July 1, 2017–June 30, 2018
November 7, 2018
Part B Child count State-designated date between October 1, 2018, and December 1, 2018
April 3, 2019
Educational environments
State-designated date between October 1, 2018, and December 1, 2018
April 3, 2019
Assessment State-designated testing date for school year 2017–18
December 12, 2018
Exiting Cumulative for July 1, 2017–June 30, 2018
November 7, 2018
Personnel State-designated date between October 1, 2017, and December 1, 2017
November 7, 2018
Discipline Cumulative for school year 2017–18 November 7, 2018
Dispute resolution Cumulative for July 1, 2017–June 30, 2018
November 7, 2018
MOE reduction and CEIS
FFYs 2016 and 2017 and school year 2017–18
May 1, 2019
As shown in the chart, the data collections regarding the domains related to the point-in-time Part C child count and program settings, and Part B child count, educational environments, assessment, and personnel concern measurements on the State-designated data collection date. The data collected
3
under each of these domains concern a specific group of the Part C or Part B program participants. Except in the case of the Part B assessment data, the group is defined in terms of the program participants’ ages on the data collection date. The group of participants regarding the Part B assessment data collection is defined as all students with individualized education programs who are enrolled in grades 3 through 8 and the high school grade in which the assessment is administered by the State on the testing date.
The data collection regarding the cumulative Part C child count concerns the group of the infants or toddlers who participated in Part C some time during the 12-month reporting period and were less than 3 years old when they were initially enrolled.
The data collections for Part B and Part C exits and Part B disciplinary actions are also associated with a specific group defined by the participants’ ages, and they are also cumulative as they concern what happens to the group during a period of time, either a school year or a 12-month period defined by a starting date and ending date. The data collections for Part B and Part C dispute resolution are also cumulative as they concern any complaint that was made during a 12-month period, defined by a starting date and ending date. The complaints concern all program participants during that time period, as opposed to a specific group of participants defined by the participants’ ages or grades.
Most of Part B and Part C data presented in this report are discussed in terms of the participants’ ages used to identify the group being represented. For example, an exhibit may present data for infants and toddlers birth through age 2, children ages 3 through 5, or students ages 6 through 21. The titles of exhibits identify the group(s) represented by the data. In addition, the titles of exhibits are worded to indicate the point in time or time period represented by the corresponding data collections. Specifically, the exhibits that contain data collected by States at a particular point in time (e.g., the point-in-time Part C child count and program settings) have titles that refer to fall of the particular year or span of years considered. Similarly, the exhibits that contain data collected over the course of a school year (e.g., Part B discipline) or during a particular 12-month period (e.g., Part B exiting and the cumulative Part C child count) have titles that indicate the school year(s) or the 12-month period(s) represented (e.g., 2017–18).
In preparing this report, OSEP determined that certain numbers required for calculating the percentages in some exhibits would be suppressed in order to avoid the identification of children and students through data publication. In general, counts of one to three children or students were suppressed. In addition, other counts were suppressed when needed to prevent the calculation of another suppressed number. When counts were suppressed for a State, percentages and ratios that required those counts could not be calculated. In most cases, however, national counts that were used to calculate the national percentages and ratios presented for “All States” in the exhibits that follow were not suppressed.
4
Unlike the other data derived from EDW that are presented in this report, most of the IDEA, Part B MOE reduction and CEIS data do not specifically concern and cannot be related to individual participants in the Part B or Part C programs. In general, these data provide information on the percentage of the available reduction taken by local education agencies (LEAs) and educational service agencies (ESAs) pursuant to IDEA Section 613(a)(2)(C). The data also provide information on the use of IDEA, Part B funds to provide CEIS to children who are not currently identified as needing special education and related services but who need additional academic and behavioral support to succeed in a general education environment. Since the focus of this report has always been, and continues to be, to provide a description of the participants in the IDEA program, some of the IDEA, Part B MOE reduction and CEIS data, with one exception, are presented in Appendix C. The exception is that prior receipt of CEIS is examined as a characteristic of the Part B participants. It should be noted that, like the Part B assessment data, these data are collected in terms of grades (i.e., children in kindergarten through grade 12), not age.
The most recent data examined in the 42nd Annual Report to Congress, 2020 were submitted directly by all States to EDW through the Education Data Exchange Network (EDEN), which was developed as part of the Department’s EDFacts initiative to consolidate the collection of kindergarten through grade 12 education program information about States, districts, and schools.
All Part B, Part C, and MOE reduction and CEIS data in this report were tabulated from data files maintained in EDW, which is not accessible to the public, rather than from published reports. Consequently, EDW is cited as the source for these data in the notes that accompany the exhibits. Given that these data are based on data collection forms that were approved by the OMB, the citations also provide the OMB approval number for each of the collections.
Many of the exhibits in this report present only Part B or Part C data for the most current reporting period considered (e.g., fall 2018; school year or reporting year 2017–18). However, some exhibits present data for multiple years. The following chart shows when the data files for each reporting period were prepared. Data presented for the most current reporting period were accessed from files prepared as of fall 2019. Data presented for the other reporting periods were accessed from files prepared as of the specific time periods listed. Data for previous time periods, not shown in the chart, were derived from files that were prepared at different points in time but in no instance less than one year after the date of the original submission by the State to ensure that the State had a chance to update the data, if necessary.
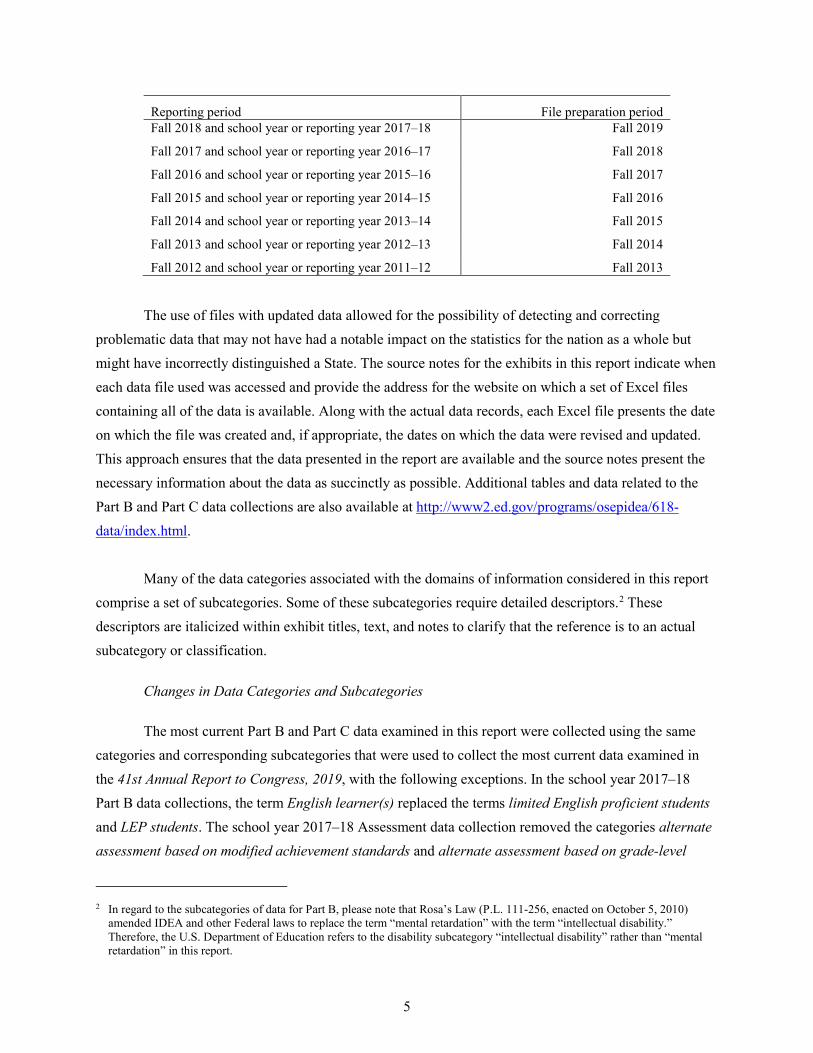
5
Reporting period File preparation period Fall 2018 and school year or reporting year 2017–18 Fall 2019
Fall 2017 and school year or reporting year 2016–17 Fall 2018
Fall 2016 and school year or reporting year 2015–16 Fall 2017
Fall 2015 and school year or reporting year 2014–15 Fall 2016
Fall 2014 and school year or reporting year 2013–14 Fall 2015
Fall 2013 and school year or reporting year 2012–13 Fall 2014
Fall 2012 and school year or reporting year 2011–12 Fall 2013
The use of files with updated data allowed for the possibility of detecting and correcting problematic data that may not have had a notable impact on the statistics for the nation as a whole but might have incorrectly distinguished a State. The source notes for the exhibits in this report indicate when each data file used was accessed and provide the address for the website on which a set of Excel files containing all of the data is available. Along with the actual data records, each Excel file presents the date on which the file was created and, if appropriate, the dates on which the data were revised and updated. This approach ensures that the data presented in the report are available and the source notes present the necessary information about the data as succinctly as possible. Additional tables and data related to the Part B and Part C data collections are also available at http://www2.ed.gov/programs/osepidea/618-data/index.html.
Many of the data categories associated with the domains of information considered in this report comprise a set of subcategories. Some of these subcategories require detailed descriptors.2 These descriptors are italicized within exhibit titles, text, and notes to clarify that the reference is to an actual subcategory or classification.
Changes in Data Categories and Subcategories
The most current Part B and Part C data examined in this report were collected using the same categories and corresponding subcategories that were used to collect the most current data examined in the 41st Annual Report to Congress, 2019, with the following exceptions. In the school year 2017–18 Part B data collections, the term English learner(s) replaced the terms limited English proficient students and LEP students. The school year 2017–18 Assessment data collection removed the categories alternate assessment based on modified achievement standards and alternate assessment based on grade-level
2 In regard to the subcategories of data for Part B, please note that Rosa’s Law (P.L. 111-256, enacted on October 5, 2010)
amended IDEA and other Federal laws to replace the term “mental retardation” with the term “intellectual disability.” Therefore, the U.S. Department of Education refers to the disability subcategory “intellectual disability” rather than “mental retardation” in this report.
6
achievement standards for both participation and performance. The school year 2017–18 Exiting data collection added the category graduated with an alternate diploma. The school year 2017–18 Personnel data collection replaced the terms “highly qualified” and “not highly qualified” with “fully certified” and “not fully certified” for special education teachers.
Institute of Education Sciences
The Institute of Education Sciences (IES), established under the Education Sciences Reform Act of 2002, is the primary research arm of the Department. The work of IES is carried out through its four centers: the National Center for Education Research, the National Center for Education Statistics, the National Center for Education Evaluation and Regional Assistance, and the National Center for Special Education Research. IES sponsors research nationwide to expand knowledge of what works for children and youth from birth through preschool, postsecondary education, and adult education, including interventions for students receiving special education and for young children and their families receiving early intervention services. It collects and analyzes statistics on the condition of education, conducts long-term longitudinal studies and surveys, supports international assessments, and carries out the National Assessment of Educational Progress.
IES data in this report were obtained from IES published reports and an IES database on funded research grants. More information about IES is available at http://ies.ed.gov.
U.S. Census Bureau
Each year, the Population Estimates Program of the U.S. Census Bureau publishes estimates of the resident population for each State and county. These estimates exclude (1) residents of the outlying areas of American Samoa, Guam, the Northern Mariana Islands, and the Virgin Islands, as well as the freely associated states of the Federated States of Micronesia, the Republic of Palau, and the Republic of the Marshall Islands; (2) members of the Armed Forces on active duty stationed outside the United States; (3) military dependents living abroad; and (4) other U.S. citizens living abroad. The population estimates are produced by age, sex, race, and Hispanic origin. The State population estimates are solely the sum of the county population estimates. The reference date for county estimates is July 1.
Estimates are used as follows: (1) in determining Federal funding allocations, (2) in calculating percentages for vital rates and per capita time series, (3) as survey controls, and (4) in monitoring recent demographic changes. More information about how population estimates are used and produced is available at https://www.census.gov/programs-surveys/popest/about.html.
7
In this report, annual resident population estimates for the 50 States and the District of Columbia were used to determine the ratios of the resident population served under IDEA, Part B and Part C, and to develop comparisons and conduct data analyses. For ease of presentation, these ratios are shown as percentages throughout the report. When available, annual resident population estimates for Puerto Rico were also used.
As the race/ethnicity categories used by the U.S. Census Bureau are not the same as those that were used by the Department, the following set of rules was used to allocate the resident population data from the Census into the seven categories of race/ethnicity used by the Department. The populations for all of the Census categories referencing “Hispanic,” regardless of race, were combined and assigned to the category “Hispanic/Latino.” The populations for the Census categories of “White alone not Hispanic,” “Black alone not Hispanic,” “American Indian or Alaska Native alone not Hispanic,” “Asian alone not Hispanic,” “Native Hawaiian and Other Pacific Islander alone not Hispanic,” and “Two or more races, not Hispanic” were assigned to the categories “White,” “Black or African American,” “American Indian or Alaska Native,” “Asian,” “Native Hawaiian or Other Pacific Islander,” and “Two or more races,” respectively.
Specific population data estimates used in this report are available upon request (contact: [email protected]). More information about the U.S. Census Bureau is available at http://www.census.gov.

Section I
Summary and Analysis of IDEA Section 618 Data at the National Level

11
Infants and Toddlers Served Under IDEA, Part C
The Education of the Handicapped Act Amendments of 1986 established the Early Intervention Program for Infants and Toddlers with Disabilities under Part H (now Part C) of the Individuals with Disabilities Education Act (IDEA). Providing early intervention services to children with disabilities as early as birth through age 2 and their families helps to improve child developmental outcomes that are critical to educational success. Early intervention services are designed to identify and meet the needs of infants and toddlers in five developmental areas: physical development, cognitive development, communication development, social or emotional development, and adaptive development. The early intervention program assists States in developing and implementing a statewide, comprehensive, coordinated, and multidisciplinary interagency system to make early intervention services available for all infants and toddlers with disabilities and their families.
An infant or toddler with a disability is defined as an individual under 3 years of age who needs early intervention services because the individual is experiencing a developmental delay in one or more of the five developmental areas listed above or has a diagnosed physical or mental condition that has a high probability of resulting in developmental delay [see IDEA, Section 632(5)(A)]. States have the authority to define the level of developmental delay needed for Part C eligibility [see IDEA, Section 635(a)(1)]. States also have the authority to define other Part C eligibility criteria. For example, at a State’s discretion, infants or toddlers with a disability may also include (1) individuals younger than 3 years of age who would be at risk of having substantial developmental delay if they did not receive early intervention services and (2) individuals 3 years of age and older with disabilities who are eligible to receive preschool services under IDEA, Part B, Section 619, until such individuals are eligible to enter kindergarten or an earlier timeframe, consistent with 34 Code of Federal Regulations (C.F.R.) § 303.211 [see IDEA, Section 632(5)(B)]. The decisions that States make regarding these options may explain some of the differences found between States with respect to their Part C data.
The Part C exhibits that follow present data for the infants and toddlers with disabilities who were served in the 50 States and the District of Columbia (DC). Where indicated in the notes, the exhibits include data from Puerto Rico (PR) and the four outlying areas of American Samoa, Guam, the Northern Mariana Islands, and the Virgin Islands, which receive Part C funds. Data about infants and toddlers with disabilities who are contacted or identified through tribal entities that receive Part C funds through the
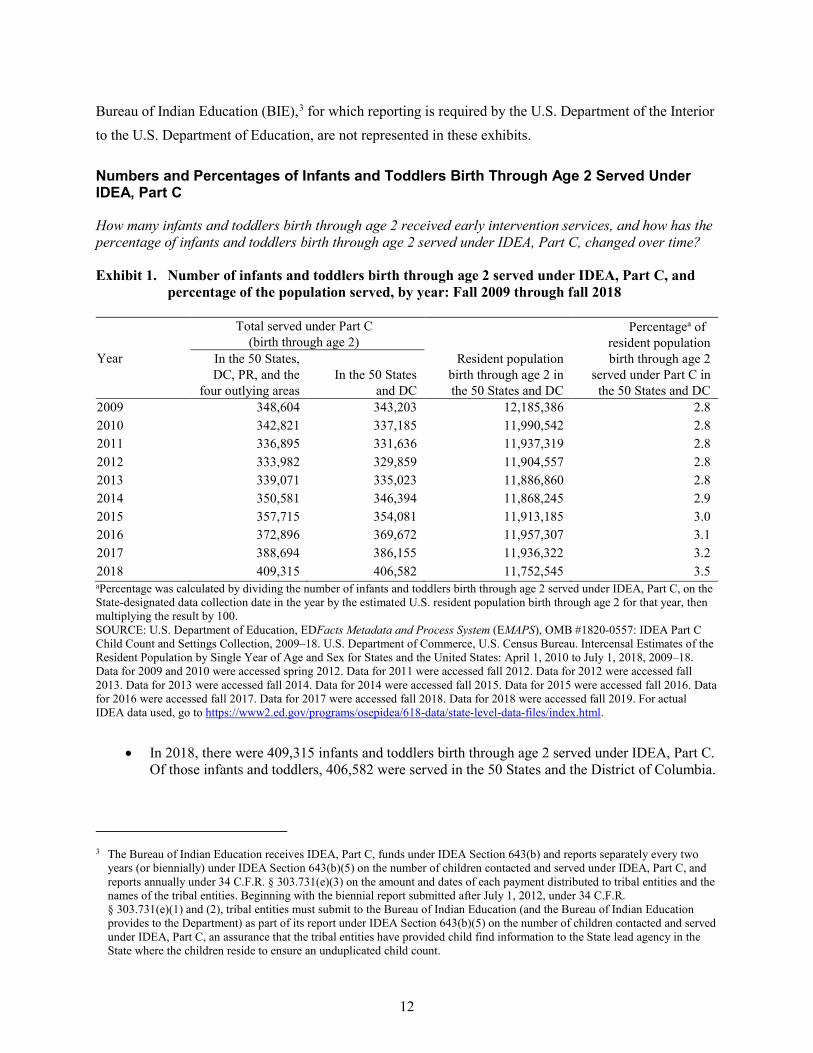
12
Bureau of Indian Education (BIE),3 for which reporting is required by the U.S. Department of the Interior to the U.S. Department of Education, are not represented in these exhibits.
Numbers and Percentages of Infants and Toddlers Birth Through Age 2 Served Under IDEA, Part C
How many infants and toddlers birth through age 2 received early intervention services, and how has the percentage of infants and toddlers birth through age 2 served under IDEA, Part C, changed over time?
Exhibit 1. Number of infants and toddlers birth through age 2 served under IDEA, Part C, and percentage of the population served, by year: Fall 2009 through fall 2018
Year
Total served under Part C (birth through age 2)
Resident population birth through age 2 in the 50 States and DC
Percentagea of resident population birth through age 2
served under Part C in the 50 States and DC
In the 50 States, DC, PR, and the
four outlying areas In the 50 States
and DC 2009 348,604 343,203 12,185,386 2.8 2010 342,821 337,185 11,990,542 2.8 2011 336,895 331,636 11,937,319 2.8 2012 333,982 329,859 11,904,557 2.8 2013 339,071 335,023 11,886,860 2.8 2014 350,581 346,394 11,868,245 2.9 2015 357,715 354,081 11,913,185 3.0 2016 372,896 369,672 11,957,307 3.1 2017 388,694 386,155 11,936,322 3.2 2018 409,315 406,582 11,752,545 3.5 aPercentage was calculated by dividing the number of infants and toddlers birth through age 2 served under IDEA, Part C, on the State-designated data collection date in the year by the estimated U.S. resident population birth through age 2 for that year, then multiplying the result by 100. SOURCE: U.S. Department of Education, EDFacts Metadata and Process System (EMAPS), OMB #1820-0557: IDEA Part C Child Count and Settings Collection, 2009–18. U.S. Department of Commerce, U.S. Census Bureau. Intercensal Estimates of the Resident Population by Single Year of Age and Sex for States and the United States: April 1, 2010 to July 1, 2018, 2009–18. Data for 2009 and 2010 were accessed spring 2012. Data for 2011 were accessed fall 2012. Data for 2012 were accessed fall 2013. Data for 2013 were accessed fall 2014. Data for 2014 were accessed fall 2015. Data for 2015 were accessed fall 2016. Data for 2016 were accessed fall 2017. Data for 2017 were accessed fall 2018. Data for 2018 were accessed fall 2019. For actual IDEA data used, go to https://www2.ed.gov/programs/osepidea/618-data/state-level-data-files/index.html.
• In 2018, there were 409,315 infants and toddlers birth through age 2 served under IDEA, Part C. Of those infants and toddlers, 406,582 were served in the 50 States and the District of Columbia.
3 The Bureau of Indian Education receives IDEA, Part C, funds under IDEA Section 643(b) and reports separately every two
years (or biennially) under IDEA Section 643(b)(5) on the number of children contacted and served under IDEA, Part C, and reports annually under 34 C.F.R. § 303.731(e)(3) on the amount and dates of each payment distributed to tribal entities and the names of the tribal entities. Beginning with the biennial report submitted after July 1, 2012, under 34 C.F.R. § 303.731(e)(1) and (2), tribal entities must submit to the Bureau of Indian Education (and the Bureau of Indian Education provides to the Department) as part of its report under IDEA Section 643(b)(5) on the number of children contacted and served under IDEA, Part C, an assurance that the tribal entities have provided child find information to the State lead agency in the State where the children reside to ensure an unduplicated child count.
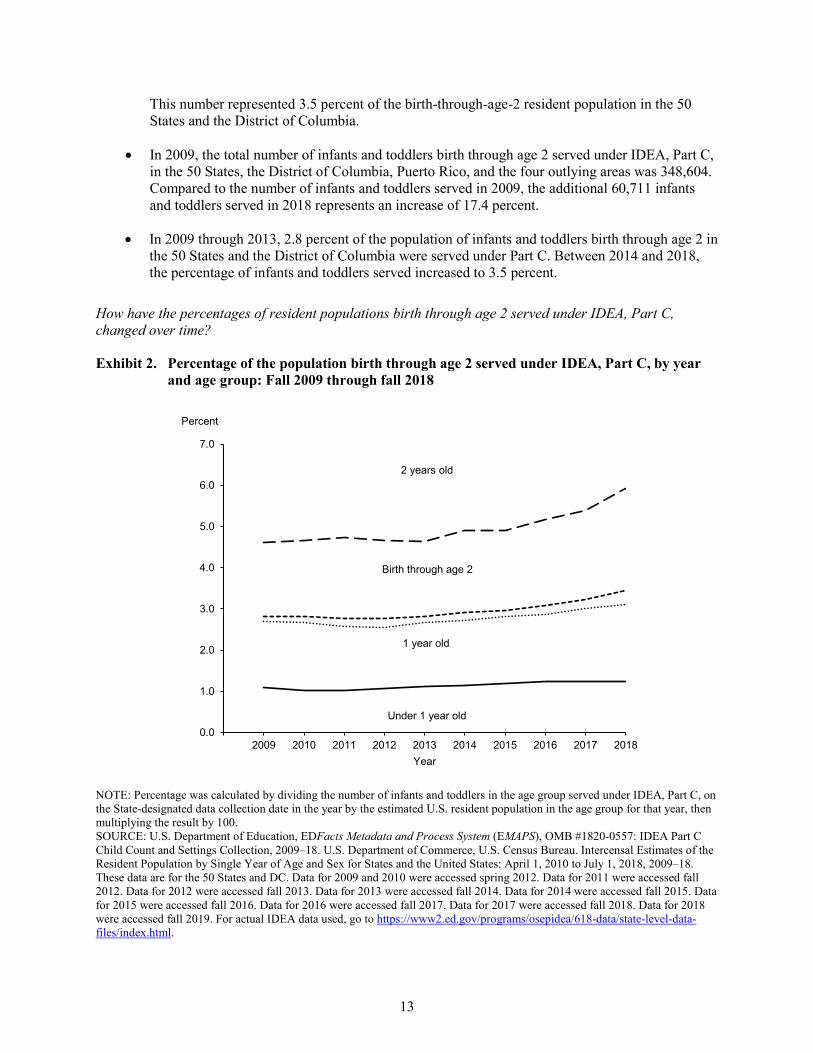
13
This number represented 3.5 percent of the birth-through-age-2 resident population in the 50 States and the District of Columbia.
• In 2009, the total number of infants and toddlers birth through age 2 served under IDEA, Part C, in the 50 States, the District of Columbia, Puerto Rico, and the four outlying areas was 348,604. Compared to the number of infants and toddlers served in 2009, the additional 60,711 infants and toddlers served in 2018 represents an increase of 17.4 percent.
• In 2009 through 2013, 2.8 percent of the population of infants and toddlers birth through age 2 in the 50 States and the District of Columbia were served under Part C. Between 2014 and 2018, the percentage of infants and toddlers served increased to 3.5 percent.
How have the percentages of resident populations birth through age 2 served under IDEA, Part C, changed over time?
Exhibit 2. Percentage of the population birth through age 2 served under IDEA, Part C, by year and age group: Fall 2009 through fall 2018
0.0
1.0
2.0
3.0
4.0
5.0
6.0
7.0
2009 2010 2011 2012 2013 2014 2015 2016 2017 2018
Percent
Year
2 years old
Birth through age 2
1 year old
Under 1 year old
NOTE: Percentage was calculated by dividing the number of infants and toddlers in the age group served under IDEA, Part C, on the State-designated data collection date in the year by the estimated U.S. resident population in the age group for that year, then multiplying the result by 100. SOURCE: U.S. Department of Education, EDFacts Metadata and Process System (EMAPS), OMB #1820-0557: IDEA Part C Child Count and Settings Collection, 2009–18. U.S. Department of Commerce, U.S. Census Bureau. Intercensal Estimates of the Resident Population by Single Year of Age and Sex for States and the United States: April 1, 2010 to July 1, 2018, 2009–18. These data are for the 50 States and DC. Data for 2009 and 2010 were accessed spring 2012. Data for 2011 were accessed fall 2012. Data for 2012 were accessed fall 2013. Data for 2013 were accessed fall 2014. Data for 2014 were accessed fall 2015. Data for 2015 were accessed fall 2016. Data for 2016 were accessed fall 2017. Data for 2017 were accessed fall 2018. Data for 2018 were accessed fall 2019. For actual IDEA data used, go to https://www2.ed.gov/programs/osepidea/618-data/state-level-data-files/index.html.
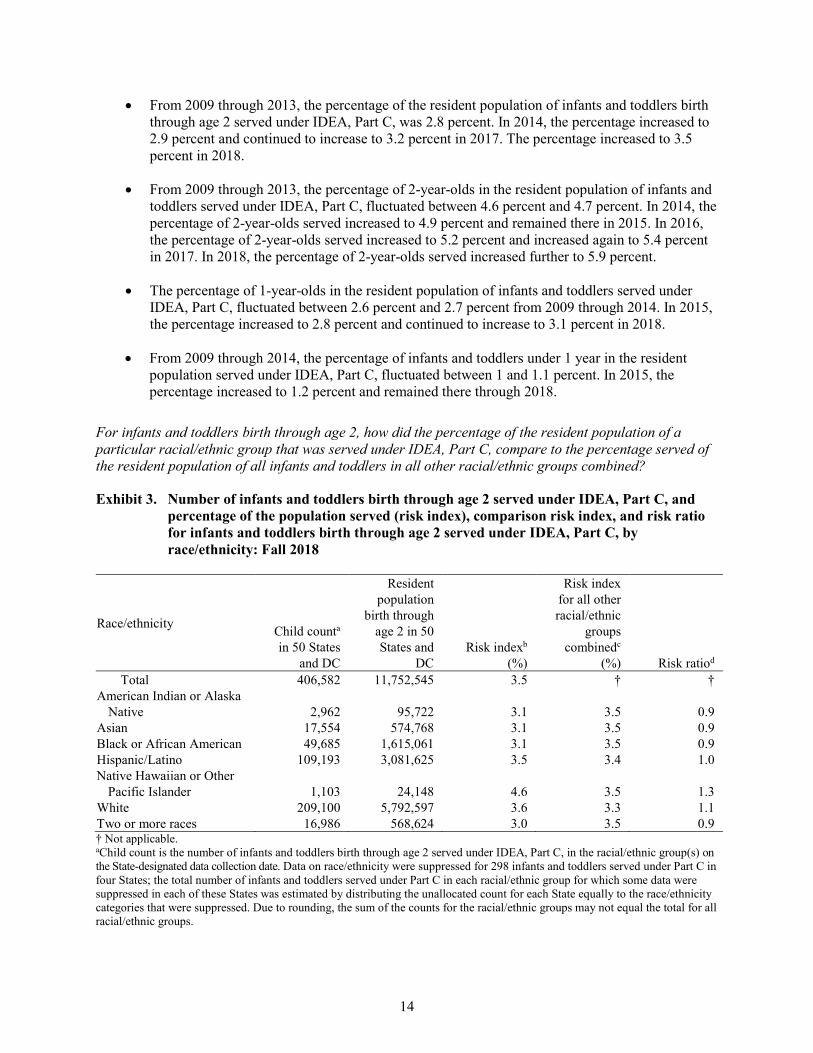
14
• From 2009 through 2013, the percentage of the resident population of infants and toddlers birth through age 2 served under IDEA, Part C, was 2.8 percent. In 2014, the percentage increased to 2.9 percent and continued to increase to 3.2 percent in 2017. The percentage increased to 3.5 percent in 2018.
• From 2009 through 2013, the percentage of 2-year-olds in the resident population of infants and toddlers served under IDEA, Part C, fluctuated between 4.6 percent and 4.7 percent. In 2014, the percentage of 2-year-olds served increased to 4.9 percent and remained there in 2015. In 2016, the percentage of 2-year-olds served increased to 5.2 percent and increased again to 5.4 percent in 2017. In 2018, the percentage of 2-year-olds served increased further to 5.9 percent.
• The percentage of 1-year-olds in the resident population of infants and toddlers served under IDEA, Part C, fluctuated between 2.6 percent and 2.7 percent from 2009 through 2014. In 2015, the percentage increased to 2.8 percent and continued to increase to 3.1 percent in 2018.
• From 2009 through 2014, the percentage of infants and toddlers under 1 year in the resident population served under IDEA, Part C, fluctuated between 1 and 1.1 percent. In 2015, the percentage increased to 1.2 percent and remained there through 2018.
For infants and toddlers birth through age 2, how did the percentage of the resident population of a particular racial/ethnic group that was served under IDEA, Part C, compare to the percentage served of the resident population of all infants and toddlers in all other racial/ethnic groups combined?
Exhibit 3. Number of infants and toddlers birth through age 2 served under IDEA, Part C, and percentage of the population served (risk index), comparison risk index, and risk ratio for infants and toddlers birth through age 2 served under IDEA, Part C, by race/ethnicity: Fall 2018
Race/ethnicity Child counta
in 50 States and DC
Resident population
birth through age 2 in 50 States and
DC Risk indexb
(%)
Risk index for all other racial/ethnic
groups combinedc
(%) Risk ratiod Total 406,582 11,752,545 3.5 † †
American Indian or Alaska Native 2,962 95,722 3.1 3.5 0.9
Asian 17,554 574,768 3.1 3.5 0.9 Black or African American 49,685 1,615,061 3.1 3.5 0.9 Hispanic/Latino 109,193 3,081,625 3.5 3.4 1.0 Native Hawaiian or Other
Pacific Islander 1,103 24,148 4.6 3.5 1.3 White 209,100 5,792,597 3.6 3.3 1.1 Two or more races 16,986 568,624 3.0 3.5 0.9 † Not applicable. aChild count is the number of infants and toddlers birth through age 2 served under IDEA, Part C, in the racial/ethnic group(s) on the State-designated data collection date. Data on race/ethnicity were suppressed for 298 infants and toddlers served under Part C in four States; the total number of infants and toddlers served under Part C in each racial/ethnic group for which some data were suppressed in each of these States was estimated by distributing the unallocated count for each State equally to the race/ethnicity categories that were suppressed. Due to rounding, the sum of the counts for the racial/ethnic groups may not equal the total for all racial/ethnic groups.
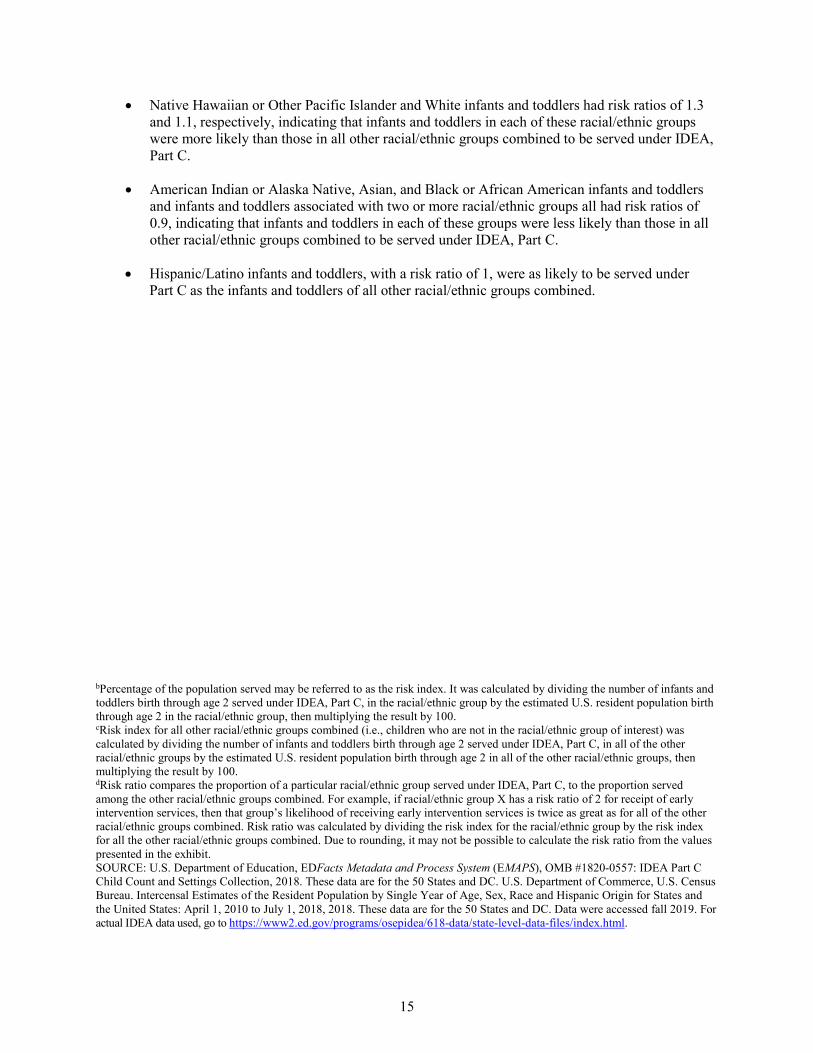
15
• Native Hawaiian or Other Pacific Islander and White infants and toddlers had risk ratios of 1.3 and 1.1, respectively, indicating that infants and toddlers in each of these racial/ethnic groups were more likely than those in all other racial/ethnic groups combined to be served under IDEA, Part C.
• American Indian or Alaska Native, Asian, and Black or African American infants and toddlers and infants and toddlers associated with two or more racial/ethnic groups all had risk ratios of 0.9, indicating that infants and toddlers in each of these groups were less likely than those in all other racial/ethnic groups combined to be served under IDEA, Part C.
• Hispanic/Latino infants and toddlers, with a risk ratio of 1, were as likely to be served under Part C as the infants and toddlers of all other racial/ethnic groups combined.
bPercentage of the population served may be referred to as the risk index. It was calculated by dividing the number of infants and toddlers birth through age 2 served under IDEA, Part C, in the racial/ethnic group by the estimated U.S. resident population birth through age 2 in the racial/ethnic group, then multiplying the result by 100. cRisk index for all other racial/ethnic groups combined (i.e., children who are not in the racial/ethnic group of interest) was calculated by dividing the number of infants and toddlers birth through age 2 served under IDEA, Part C, in all of the other racial/ethnic groups by the estimated U.S. resident population birth through age 2 in all of the other racial/ethnic groups, then multiplying the result by 100. dRisk ratio compares the proportion of a particular racial/ethnic group served under IDEA, Part C, to the proportion served among the other racial/ethnic groups combined. For example, if racial/ethnic group X has a risk ratio of 2 for receipt of early intervention services, then that group’s likelihood of receiving early intervention services is twice as great as for all of the other racial/ethnic groups combined. Risk ratio was calculated by dividing the risk index for the racial/ethnic group by the risk index for all the other racial/ethnic groups combined. Due to rounding, it may not be possible to calculate the risk ratio from the values presented in the exhibit. SOURCE: U.S. Department of Education, EDFacts Metadata and Process System (EMAPS), OMB #1820-0557: IDEA Part C Child Count and Settings Collection, 2018. These data are for the 50 States and DC. U.S. Department of Commerce, U.S. Census Bureau. Intercensal Estimates of the Resident Population by Single Year of Age, Sex, Race and Hispanic Origin for States and the United States: April 1, 2010 to July 1, 2018, 2018. These data are for the 50 States and DC. Data were accessed fall 2019. For actual IDEA data used, go to https://www2.ed.gov/programs/osepidea/618-data/state-level-data-files/index.html.
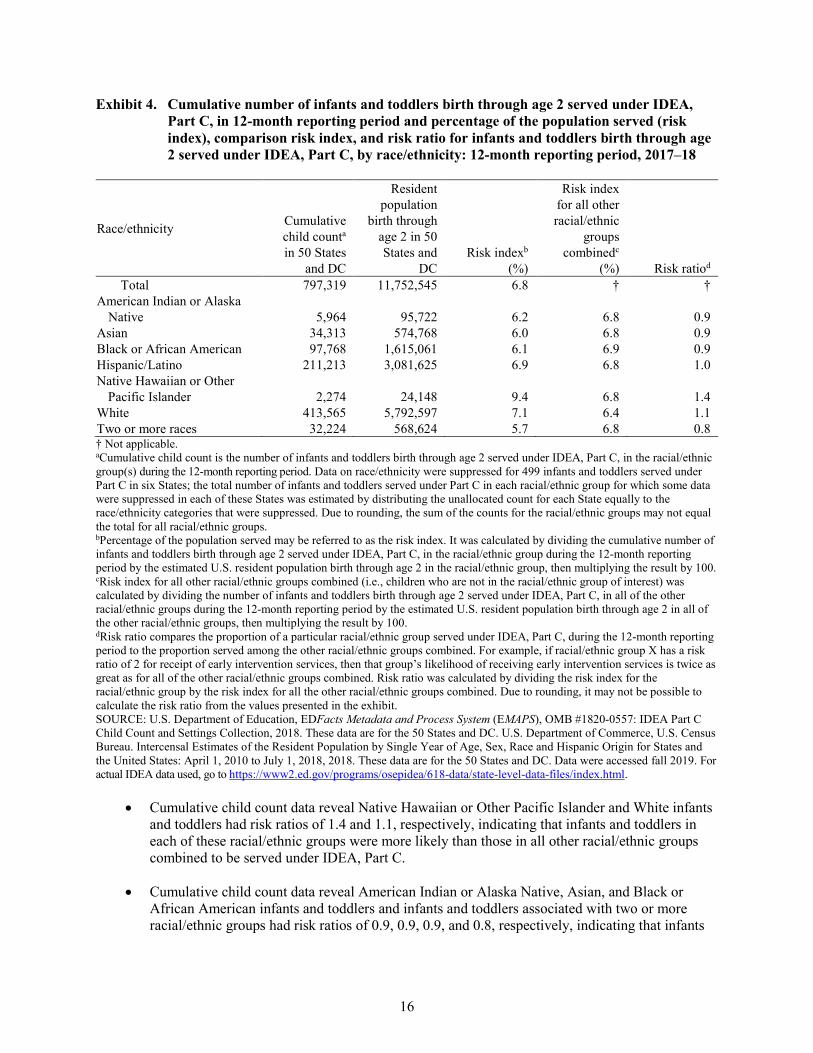
16
Exhibit 4. Cumulative number of infants and toddlers birth through age 2 served under IDEA, Part C, in 12-month reporting period and percentage of the population served (risk index), comparison risk index, and risk ratio for infants and toddlers birth through age 2 served under IDEA, Part C, by race/ethnicity: 12-month reporting period, 2017–18
Race/ethnicity Cumulative child counta
in 50 States and DC
Resident population
birth through age 2 in 50 States and
DC Risk indexb
(%)
Risk index for all other racial/ethnic
groups combinedc
(%) Risk ratiod
Total 797,319 11,752,545 6.8 † † American Indian or Alaska
Native 5,964 95,722 6.2 6.8 0.9 Asian 34,313 574,768 6.0 6.8 0.9 Black or African American 97,768 1,615,061 6.1 6.9 0.9 Hispanic/Latino 211,213 3,081,625 6.9 6.8 1.0 Native Hawaiian or Other
Pacific Islander 2,274 24,148 9.4 6.8 1.4 White 413,565 5,792,597 7.1 6.4 1.1 Two or more races 32,224 568,624 5.7 6.8 0.8 † Not applicable. aCumulative child count is the number of infants and toddlers birth through age 2 served under IDEA, Part C, in the racial/ethnic group(s) during the 12-month reporting period. Data on race/ethnicity were suppressed for 499 infants and toddlers served under Part C in six States; the total number of infants and toddlers served under Part C in each racial/ethnic group for which some data were suppressed in each of these States was estimated by distributing the unallocated count for each State equally to the race/ethnicity categories that were suppressed. Due to rounding, the sum of the counts for the racial/ethnic groups may not equal the total for all racial/ethnic groups. bPercentage of the population served may be referred to as the risk index. It was calculated by dividing the cumulative number of infants and toddlers birth through age 2 served under IDEA, Part C, in the racial/ethnic group during the 12-month reporting period by the estimated U.S. resident population birth through age 2 in the racial/ethnic group, then multiplying the result by 100. cRisk index for all other racial/ethnic groups combined (i.e., children who are not in the racial/ethnic group of interest) was calculated by dividing the number of infants and toddlers birth through age 2 served under IDEA, Part C, in all of the other racial/ethnic groups during the 12-month reporting period by the estimated U.S. resident population birth through age 2 in all of the other racial/ethnic groups, then multiplying the result by 100. dRisk ratio compares the proportion of a particular racial/ethnic group served under IDEA, Part C, during the 12-month reporting period to the proportion served among the other racial/ethnic groups combined. For example, if racial/ethnic group X has a risk ratio of 2 for receipt of early intervention services, then that group’s likelihood of receiving early intervention services is twice as great as for all of the other racial/ethnic groups combined. Risk ratio was calculated by dividing the risk index for the racial/ethnic group by the risk index for all the other racial/ethnic groups combined. Due to rounding, it may not be possible to calculate the risk ratio from the values presented in the exhibit. SOURCE: U.S. Department of Education, EDFacts Metadata and Process System (EMAPS), OMB #1820-0557: IDEA Part C Child Count and Settings Collection, 2018. These data are for the 50 States and DC. U.S. Department of Commerce, U.S. Census Bureau. Intercensal Estimates of the Resident Population by Single Year of Age, Sex, Race and Hispanic Origin for States and the United States: April 1, 2010 to July 1, 2018, 2018. These data are for the 50 States and DC. Data were accessed fall 2019. For actual IDEA data used, go to https://www2.ed.gov/programs/osepidea/618-data/state-level-data-files/index.html.
• Cumulative child count data reveal Native Hawaiian or Other Pacific Islander and White infants and toddlers had risk ratios of 1.4 and 1.1, respectively, indicating that infants and toddlers in each of these racial/ethnic groups were more likely than those in all other racial/ethnic groups combined to be served under IDEA, Part C.
• Cumulative child count data reveal American Indian or Alaska Native, Asian, and Black or African American infants and toddlers and infants and toddlers associated with two or more racial/ethnic groups had risk ratios of 0.9, 0.9, 0.9, and 0.8, respectively, indicating that infants
17
and toddlers in each of these groups were less likely than those in all other racial/ethnic groups combined to be served under IDEA, Part C.
• Cumulative child count data reveal Hispanic/Latino infants and toddlers had a risk ratio of 1, indicating they were as likely to be served under Part C as the infants and toddlers of all other racial/ethnic groups combined.
Primary Early Intervention Service Settings for Infants and Toddlers Birth Through Age 2 Served Under IDEA, Part C
Part C of IDEA mandates that early intervention services be provided, to the maximum extent appropriate, in settings that are considered natural environments, which could be an infant’s or toddler’s home or community settings where typically developing children are present. A multidisciplinary team, including the child’s parent(s), determines the primary service setting that is included on the infant’s or toddler’s individualized family service plan (IFSP).
What were the primary early intervention service settings for infants and toddlers birth through age 2 served under IDEA, Part C?
Exhibit 5. Percentage of infants and toddlers birth through age 2 served under IDEA, Part C, by primary early intervention service setting: Fall 2018
Home(a)(89.7%)
Community-based
setting(b)(7.4%)
Other setting(c)
(2.9%)
(a)Home refers to the principal residence of the eligible infant’s or toddler’s family or caregivers. (b)Community-based setting refers to settings in which infants or toddlers without disabilities are usually found. Community-based setting includes, but is not limited to, child care centers (including family day care), preschools, regular nursery schools, early childhood centers, libraries, grocery stores, parks, restaurants, and community centers (e.g., YMCA, Boys and Girls Clubs). (c)Other setting refers to settings other than home or community-based setting in which early intervention services are provided.
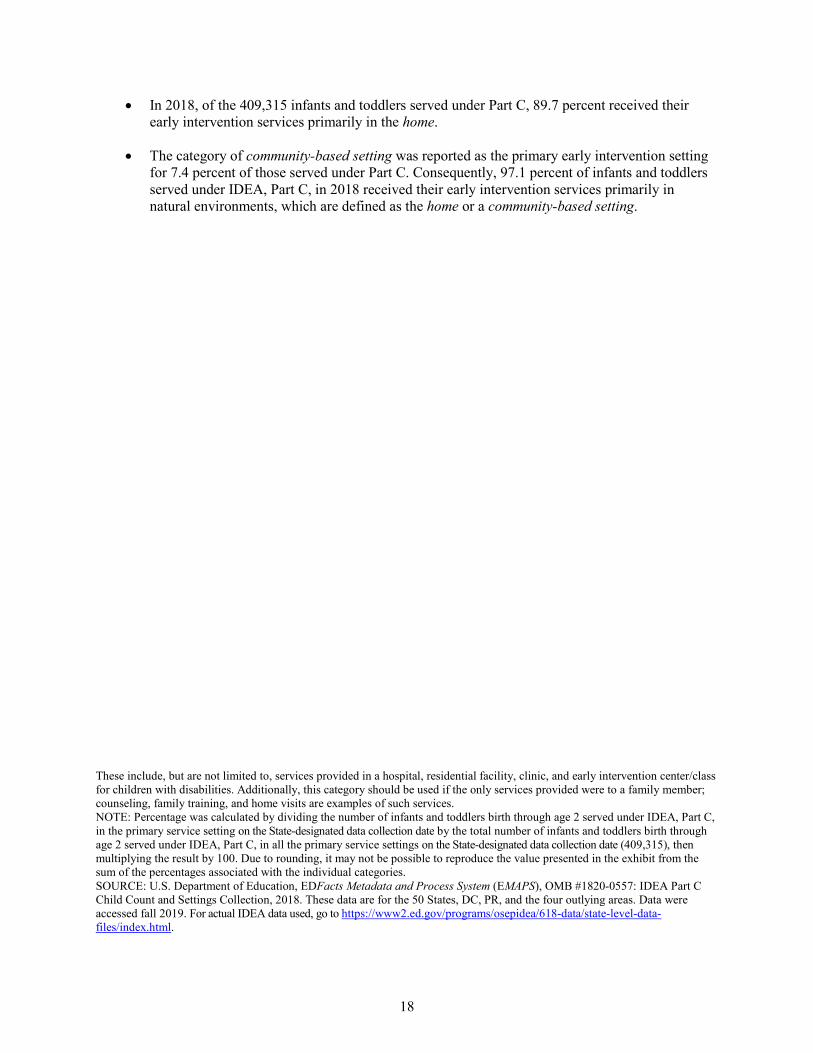
18
• In 2018, of the 409,315 infants and toddlers served under Part C, 89.7 percent received their early intervention services primarily in the home.
• The category of community-based setting was reported as the primary early intervention setting for 7.4 percent of those served under Part C. Consequently, 97.1 percent of infants and toddlers served under IDEA, Part C, in 2018 received their early intervention services primarily in natural environments, which are defined as the home or a community-based setting.
These include, but are not limited to, services provided in a hospital, residential facility, clinic, and early intervention center/class for children with disabilities. Additionally, this category should be used if the only services provided were to a family member; counseling, family training, and home visits are examples of such services. NOTE: Percentage was calculated by dividing the number of infants and toddlers birth through age 2 served under IDEA, Part C, in the primary service setting on the State-designated data collection date by the total number of infants and toddlers birth through age 2 served under IDEA, Part C, in all the primary service settings on the State-designated data collection date (409,315), then multiplying the result by 100. Due to rounding, it may not be possible to reproduce the value presented in the exhibit from the sum of the percentages associated with the individual categories. SOURCE: U.S. Department of Education, EDFacts Metadata and Process System (EMAPS), OMB #1820-0557: IDEA Part C Child Count and Settings Collection, 2018. These data are for the 50 States, DC, PR, and the four outlying areas. Data were accessed fall 2019. For actual IDEA data used, go to https://www2.ed.gov/programs/osepidea/618-data/state-level-data-files/index.html.
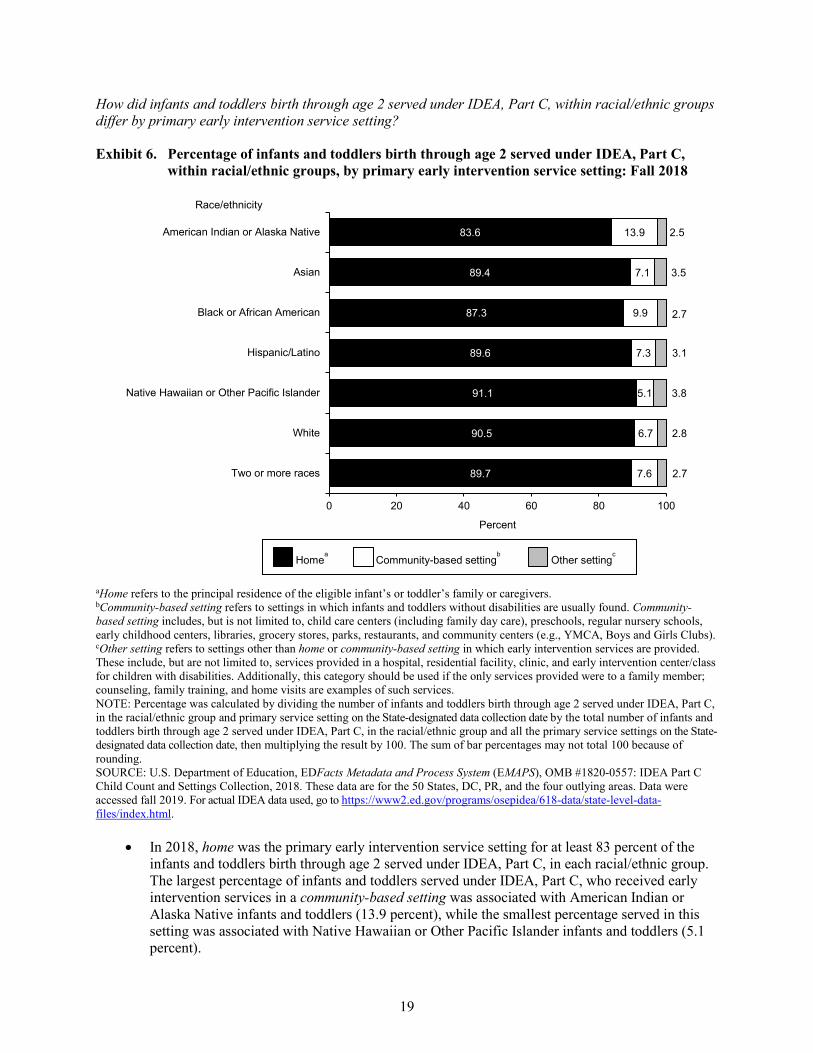
19
How did infants and toddlers birth through age 2 served under IDEA, Part C, within racial/ethnic groups differ by primary early intervention service setting?
Exhibit 6. Percentage of infants and toddlers birth through age 2 served under IDEA, Part C, within racial/ethnic groups, by primary early intervention service setting: Fall 2018
89.7
90.5
91.1
89.6
87.3
89.4
83.6
7.6
6.7
5.1
7.3
9.9
7.1
13.9
2.7
2.8
3.8
3.1
2.7
3.5
2.5
0 20 40 60 80 100
Two or more races
White
Native Hawaiian or Other Pacific Islander
Hispanic/Latino
Black or African American
Asian
American Indian or Alaska Native
Percent
Race/ethnicity
Homea Community-based setting
b Other settingc
aHome refers to the principal residence of the eligible infant’s or toddler’s family or caregivers. bCommunity-based setting refers to settings in which infants and toddlers without disabilities are usually found. Community-based setting includes, but is not limited to, child care centers (including family day care), preschools, regular nursery schools, early childhood centers, libraries, grocery stores, parks, restaurants, and community centers (e.g., YMCA, Boys and Girls Clubs). cOther setting refers to settings other than home or community-based setting in which early intervention services are provided. These include, but are not limited to, services provided in a hospital, residential facility, clinic, and early intervention center/class for children with disabilities. Additionally, this category should be used if the only services provided were to a family member; counseling, family training, and home visits are examples of such services. NOTE: Percentage was calculated by dividing the number of infants and toddlers birth through age 2 served under IDEA, Part C, in the racial/ethnic group and primary service setting on the State-designated data collection date by the total number of infants and toddlers birth through age 2 served under IDEA, Part C, in the racial/ethnic group and all the primary service settings on the State-designated data collection date, then multiplying the result by 100. The sum of bar percentages may not total 100 because of rounding. SOURCE: U.S. Department of Education, EDFacts Metadata and Process System (EMAPS), OMB #1820-0557: IDEA Part C Child Count and Settings Collection, 2018. These data are for the 50 States, DC, PR, and the four outlying areas. Data were accessed fall 2019. For actual IDEA data used, go to https://www2.ed.gov/programs/osepidea/618-data/state-level-data-files/index.html.
• In 2018, home was the primary early intervention service setting for at least 83 percent of the infants and toddlers birth through age 2 served under IDEA, Part C, in each racial/ethnic group. The largest percentage of infants and toddlers served under IDEA, Part C, who received early intervention services in a community-based setting was associated with American Indian or Alaska Native infants and toddlers (13.9 percent), while the smallest percentage served in this setting was associated with Native Hawaiian or Other Pacific Islander infants and toddlers (5.1 percent).
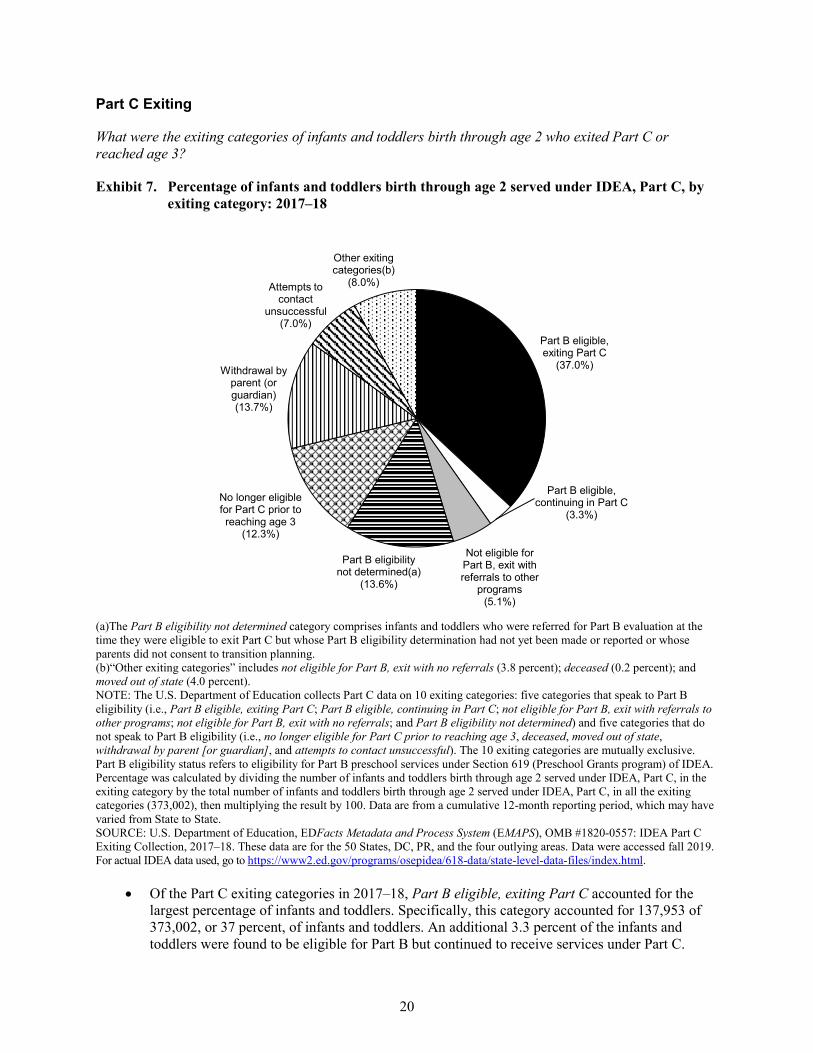
20
Part C Exiting
What were the exiting categories of infants and toddlers birth through age 2 who exited Part C or reached age 3?
Exhibit 7. Percentage of infants and toddlers birth through age 2 served under IDEA, Part C, by exiting category: 2017–18
Part B eligible, exiting Part C
(37.0%)
Part B eligible, continuing in Part C
(3.3%)
Not eligible for Part B, exit with referrals to other
programs(5.1%)
Part B eligibility not determined(a)
(13.6%)
No longer eligible for Part C prior to reaching age 3
(12.3%)
Withdrawal by parent (or guardian)(13.7%)
Attempts to contact
unsuccessful(7.0%)
Other exiting categories(b)
(8.0%)
(a)The Part B eligibility not determined category comprises infants and toddlers who were referred for Part B evaluation at the time they were eligible to exit Part C but whose Part B eligibility determination had not yet been made or reported or whose parents did not consent to transition planning. (b)“Other exiting categories” includes not eligible for Part B, exit with no referrals (3.8 percent); deceased (0.2 percent); and moved out of state (4.0 percent). NOTE: The U.S. Department of Education collects Part C data on 10 exiting categories: five categories that speak to Part B eligibility (i.e., Part B eligible, exiting Part C; Part B eligible, continuing in Part C; not eligible for Part B, exit with referrals to other programs; not eligible for Part B, exit with no referrals; and Part B eligibility not determined) and five categories that do not speak to Part B eligibility (i.e., no longer eligible for Part C prior to reaching age 3, deceased, moved out of state, withdrawal by parent [or guardian], and attempts to contact unsuccessful). The 10 exiting categories are mutually exclusive. Part B eligibility status refers to eligibility for Part B preschool services under Section 619 (Preschool Grants program) of IDEA. Percentage was calculated by dividing the number of infants and toddlers birth through age 2 served under IDEA, Part C, in the exiting category by the total number of infants and toddlers birth through age 2 served under IDEA, Part C, in all the exiting categories (373,002), then multiplying the result by 100. Data are from a cumulative 12-month reporting period, which may have varied from State to State. SOURCE: U.S. Department of Education, EDFacts Metadata and Process System (EMAPS), OMB #1820-0557: IDEA Part C Exiting Collection, 2017–18. These data are for the 50 States, DC, PR, and the four outlying areas. Data were accessed fall 2019. For actual IDEA data used, go to https://www2.ed.gov/programs/osepidea/618-data/state-level-data-files/index.html.
• Of the Part C exiting categories in 2017–18, Part B eligible, exiting Part C accounted for the largest percentage of infants and toddlers. Specifically, this category accounted for 137,953 of 373,002, or 37 percent, of infants and toddlers. An additional 3.3 percent of the infants and toddlers were found to be eligible for Part B but continued to receive services under Part C.
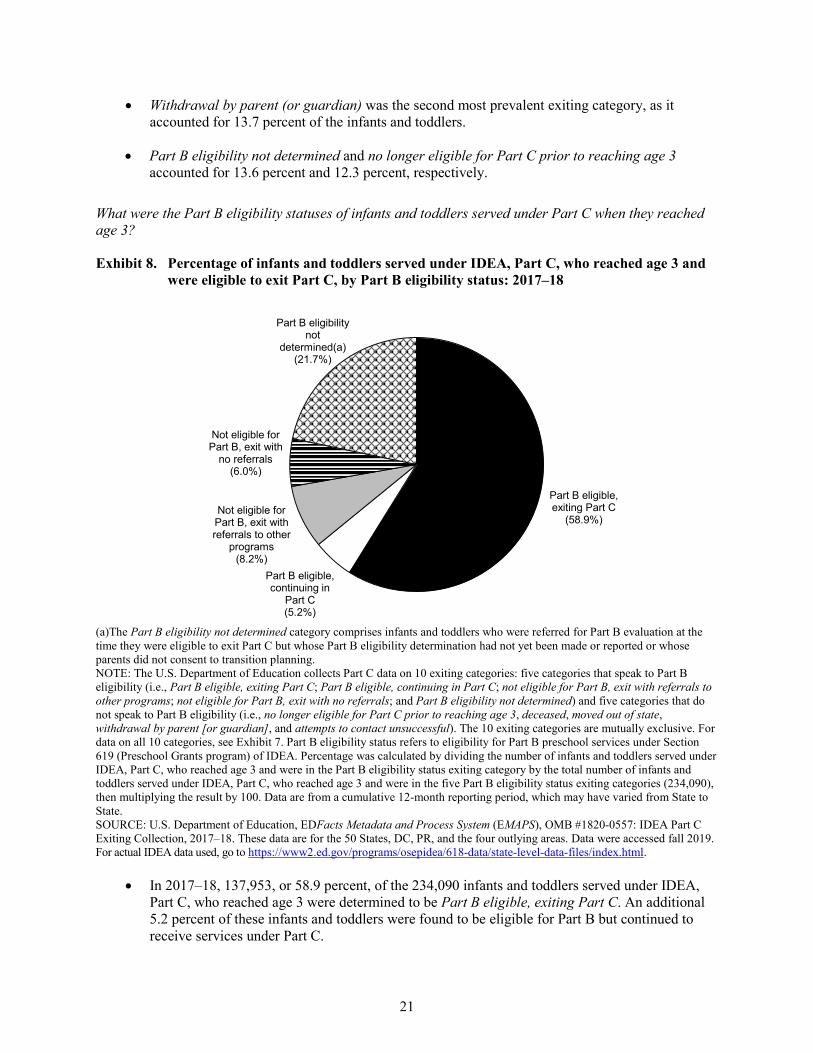
21
• Withdrawal by parent (or guardian) was the second most prevalent exiting category, as it accounted for 13.7 percent of the infants and toddlers.
• Part B eligibility not determined and no longer eligible for Part C prior to reaching age 3 accounted for 13.6 percent and 12.3 percent, respectively.
What were the Part B eligibility statuses of infants and toddlers served under Part C when they reached age 3?
Exhibit 8. Percentage of infants and toddlers served under IDEA, Part C, who reached age 3 and were eligible to exit Part C, by Part B eligibility status: 2017–18
Part B eligible, exiting Part C
(58.9%)
Part B eligible, continuing in
Part C(5.2%)
Not eligible for Part B, exit with referrals to other
programs(8.2%)
Not eligible for Part B, exit with
no referrals(6.0%)
Part B eligibility not
determined(a)(21.7%)
(a)The Part B eligibility not determined category comprises infants and toddlers who were referred for Part B evaluation at the time they were eligible to exit Part C but whose Part B eligibility determination had not yet been made or reported or whose parents did not consent to transition planning. NOTE: The U.S. Department of Education collects Part C data on 10 exiting categories: five categories that speak to Part B eligibility (i.e., Part B eligible, exiting Part C; Part B eligible, continuing in Part C; not eligible for Part B, exit with referrals to other programs; not eligible for Part B, exit with no referrals; and Part B eligibility not determined) and five categories that do not speak to Part B eligibility (i.e., no longer eligible for Part C prior to reaching age 3, deceased, moved out of state, withdrawal by parent [or guardian], and attempts to contact unsuccessful). The 10 exiting categories are mutually exclusive. For data on all 10 categories, see Exhibit 7. Part B eligibility status refers to eligibility for Part B preschool services under Section 619 (Preschool Grants program) of IDEA. Percentage was calculated by dividing the number of infants and toddlers served under IDEA, Part C, who reached age 3 and were in the Part B eligibility status exiting category by the total number of infants and toddlers served under IDEA, Part C, who reached age 3 and were in the five Part B eligibility status exiting categories (234,090), then multiplying the result by 100. Data are from a cumulative 12-month reporting period, which may have varied from State to State. SOURCE: U.S. Department of Education, EDFacts Metadata and Process System (EMAPS), OMB #1820-0557: IDEA Part C Exiting Collection, 2017–18. These data are for the 50 States, DC, PR, and the four outlying areas. Data were accessed fall 2019. For actual IDEA data used, go to https://www2.ed.gov/programs/osepidea/618-data/state-level-data-files/index.html.
• In 2017–18, 137,953, or 58.9 percent, of the 234,090 infants and toddlers served under IDEA, Part C, who reached age 3 were determined to be Part B eligible, exiting Part C. An additional 5.2 percent of these infants and toddlers were found to be eligible for Part B but continued to receive services under Part C.
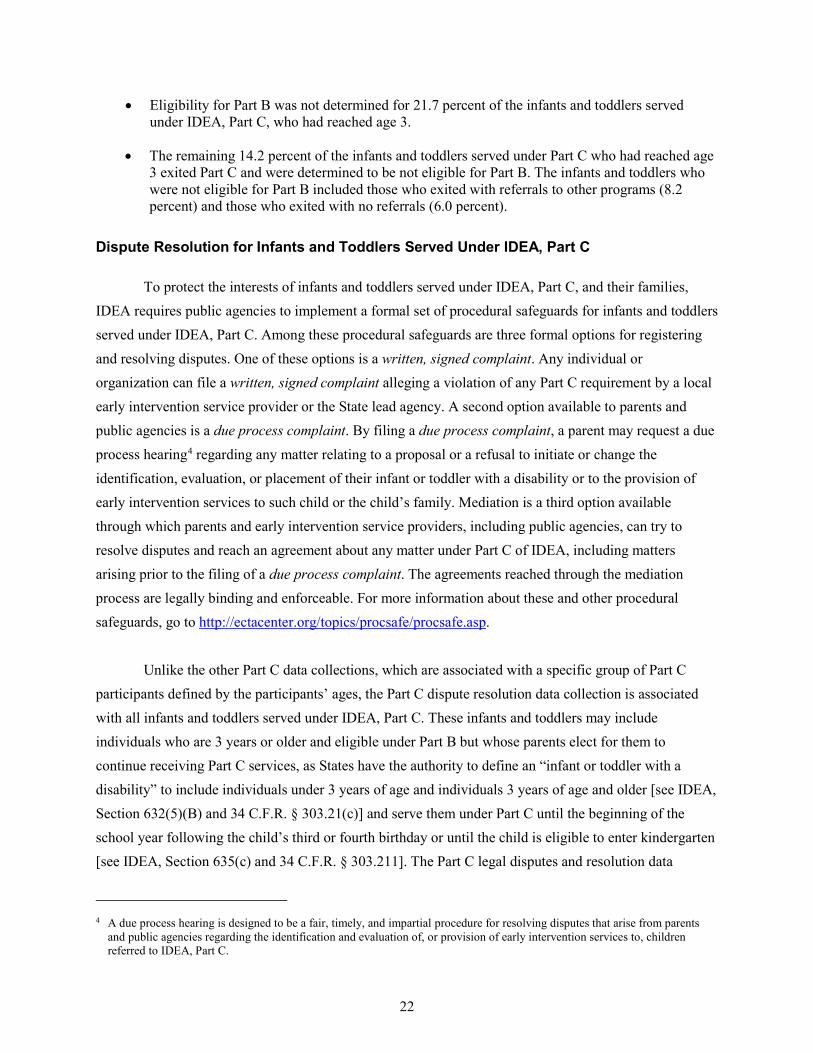
22
• Eligibility for Part B was not determined for 21.7 percent of the infants and toddlers served under IDEA, Part C, who had reached age 3.
• The remaining 14.2 percent of the infants and toddlers served under Part C who had reached age 3 exited Part C and were determined to be not eligible for Part B. The infants and toddlers who were not eligible for Part B included those who exited with referrals to other programs (8.2 percent) and those who exited with no referrals (6.0 percent).
Dispute Resolution for Infants and Toddlers Served Under IDEA, Part C
To protect the interests of infants and toddlers served under IDEA, Part C, and their families, IDEA requires public agencies to implement a formal set of procedural safeguards for infants and toddlers served under IDEA, Part C. Among these procedural safeguards are three formal options for registering and resolving disputes. One of these options is a written, signed complaint. Any individual or organization can file a written, signed complaint alleging a violation of any Part C requirement by a local early intervention service provider or the State lead agency. A second option available to parents and public agencies is a due process complaint. By filing a due process complaint, a parent may request a due process hearing4 regarding any matter relating to a proposal or a refusal to initiate or change the identification, evaluation, or placement of their infant or toddler with a disability or to the provision of early intervention services to such child or the child’s family. Mediation is a third option available through which parents and early intervention service providers, including public agencies, can try to resolve disputes and reach an agreement about any matter under Part C of IDEA, including matters arising prior to the filing of a due process complaint. The agreements reached through the mediation process are legally binding and enforceable. For more information about these and other procedural safeguards, go to http://ectacenter.org/topics/procsafe/procsafe.asp.
Unlike the other Part C data collections, which are associated with a specific group of Part C participants defined by the participants’ ages, the Part C dispute resolution data collection is associated with all infants and toddlers served under IDEA, Part C. These infants and toddlers may include individuals who are 3 years or older and eligible under Part B but whose parents elect for them to continue receiving Part C services, as States have the authority to define an “infant or toddler with a disability” to include individuals under 3 years of age and individuals 3 years of age and older [see IDEA, Section 632(5)(B) and 34 C.F.R. § 303.21(c)] and serve them under Part C until the beginning of the school year following the child’s third or fourth birthday or until the child is eligible to enter kindergarten [see IDEA, Section 635(c) and 34 C.F.R. § 303.211]. The Part C legal disputes and resolution data
4 A due process hearing is designed to be a fair, timely, and impartial procedure for resolving disputes that arise from parents
and public agencies regarding the identification and evaluation of, or provision of early intervention services to, children referred to IDEA, Part C.
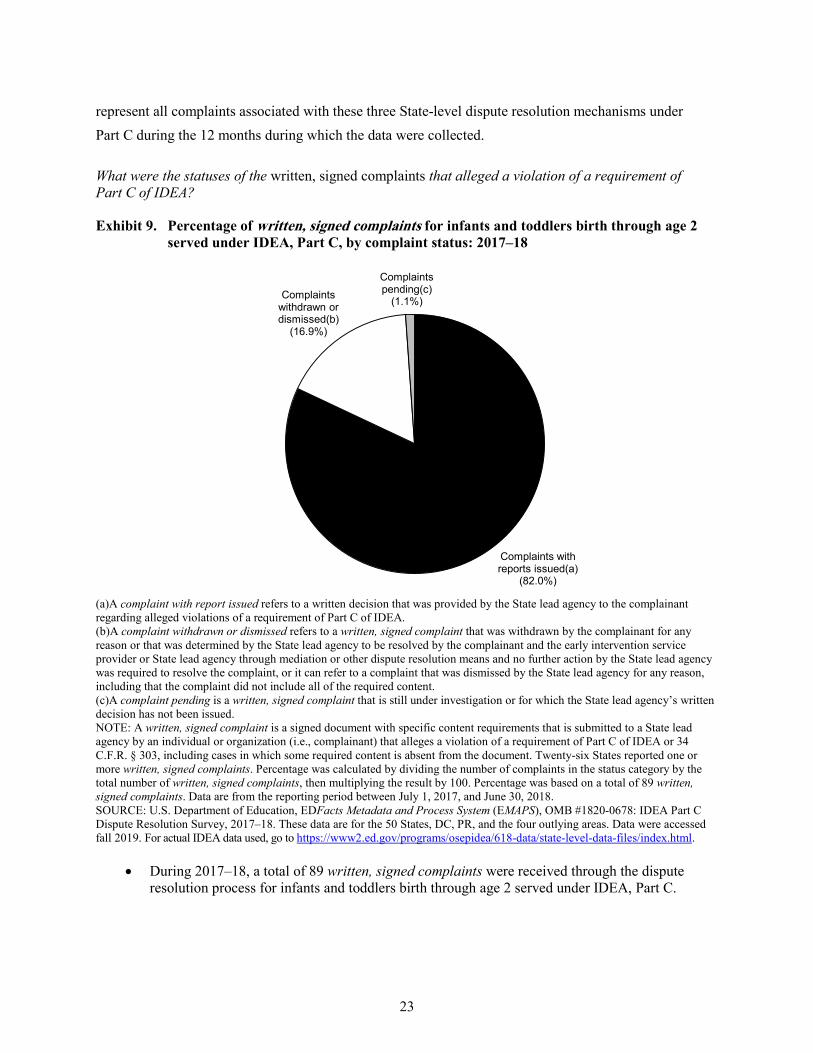
23
represent all complaints associated with these three State-level dispute resolution mechanisms under Part C during the 12 months during which the data were collected.
What were the statuses of the written, signed complaints that alleged a violation of a requirement of Part C of IDEA?
Exhibit 9. Percentage of written, signed complaints for infants and toddlers birth through age 2 served under IDEA, Part C, by complaint status: 2017–18
Complaints with reports issued(a)
(82.0%)
Complaints withdrawn or dismissed(b)
(16.9%)
Complaints pending(c)
(1.1%)
(a)A complaint with report issued refers to a written decision that was provided by the State lead agency to the complainant regarding alleged violations of a requirement of Part C of IDEA. (b)A complaint withdrawn or dismissed refers to a written, signed complaint that was withdrawn by the complainant for any reason or that was determined by the State lead agency to be resolved by the complainant and the early intervention service provider or State lead agency through mediation or other dispute resolution means and no further action by the State lead agency was required to resolve the complaint, or it can refer to a complaint that was dismissed by the State lead agency for any reason, including that the complaint did not include all of the required content. (c)A complaint pending is a written, signed complaint that is still under investigation or for which the State lead agency’s written decision has not been issued. NOTE: A written, signed complaint is a signed document with specific content requirements that is submitted to a State lead agency by an individual or organization (i.e., complainant) that alleges a violation of a requirement of Part C of IDEA or 34 C.F.R. § 303, including cases in which some required content is absent from the document. Twenty-six States reported one or more written, signed complaints. Percentage was calculated by dividing the number of complaints in the status category by the total number of written, signed complaints, then multiplying the result by 100. Percentage was based on a total of 89 written, signed complaints. Data are from the reporting period between July 1, 2017, and June 30, 2018. SOURCE: U.S. Department of Education, EDFacts Metadata and Process System (EMAPS), OMB #1820-0678: IDEA Part C Dispute Resolution Survey, 2017–18. These data are for the 50 States, DC, PR, and the four outlying areas. Data were accessed fall 2019. For actual IDEA data used, go to https://www2.ed.gov/programs/osepidea/618-data/state-level-data-files/index.html.
• During 2017–18, a total of 89 written, signed complaints were received through the dispute resolution process for infants and toddlers birth through age 2 served under IDEA, Part C.
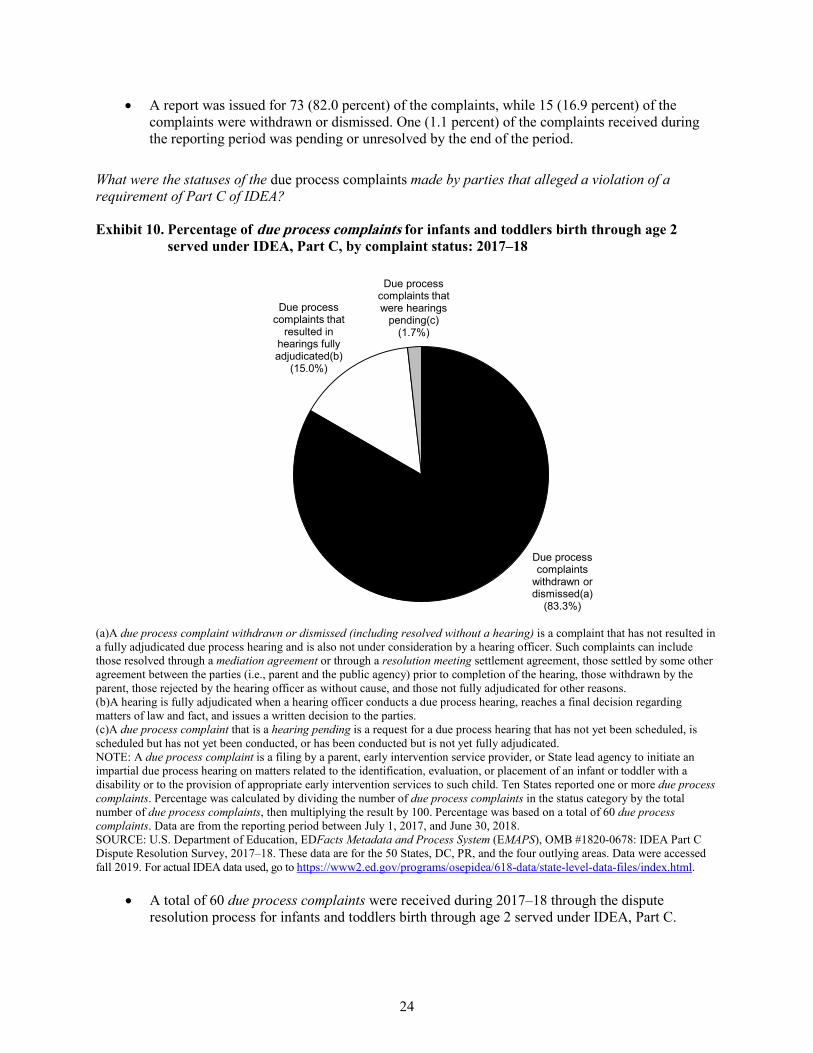
24
• A report was issued for 73 (82.0 percent) of the complaints, while 15 (16.9 percent) of the complaints were withdrawn or dismissed. One (1.1 percent) of the complaints received during the reporting period was pending or unresolved by the end of the period.
What were the statuses of the due process complaints made by parties that alleged a violation of a requirement of Part C of IDEA?
Exhibit 10. Percentage of due process complaints for infants and toddlers birth through age 2 served under IDEA, Part C, by complaint status: 2017–18
Due process complaints
withdrawn or dismissed(a)
(83.3%)
Due process complaints that
resulted in hearings fully adjudicated(b)
(15.0%)
Due process complaints that were hearings
pending(c) (1.7%)
(a)A due process complaint withdrawn or dismissed (including resolved without a hearing) is a complaint that has not resulted in a fully adjudicated due process hearing and is also not under consideration by a hearing officer. Such complaints can include those resolved through a mediation agreement or through a resolution meeting settlement agreement, those settled by some other agreement between the parties (i.e., parent and the public agency) prior to completion of the hearing, those withdrawn by the parent, those rejected by the hearing officer as without cause, and those not fully adjudicated for other reasons. (b)A hearing is fully adjudicated when a hearing officer conducts a due process hearing, reaches a final decision regarding matters of law and fact, and issues a written decision to the parties. (c)A due process complaint that is a hearing pending is a request for a due process hearing that has not yet been scheduled, is scheduled but has not yet been conducted, or has been conducted but is not yet fully adjudicated. NOTE: A due process complaint is a filing by a parent, early intervention service provider, or State lead agency to initiate an impartial due process hearing on matters related to the identification, evaluation, or placement of an infant or toddler with a disability or to the provision of appropriate early intervention services to such child. Ten States reported one or more due process complaints. Percentage was calculated by dividing the number of due process complaints in the status category by the total number of due process complaints, then multiplying the result by 100. Percentage was based on a total of 60 due process complaints. Data are from the reporting period between July 1, 2017, and June 30, 2018. SOURCE: U.S. Department of Education, EDFacts Metadata and Process System (EMAPS), OMB #1820-0678: IDEA Part C Dispute Resolution Survey, 2017–18. These data are for the 50 States, DC, PR, and the four outlying areas. Data were accessed fall 2019. For actual IDEA data used, go to https://www2.ed.gov/programs/osepidea/618-data/state-level-data-files/index.html.
• A total of 60 due process complaints were received during 2017–18 through the dispute resolution process for infants and toddlers birth through age 2 served under IDEA, Part C.
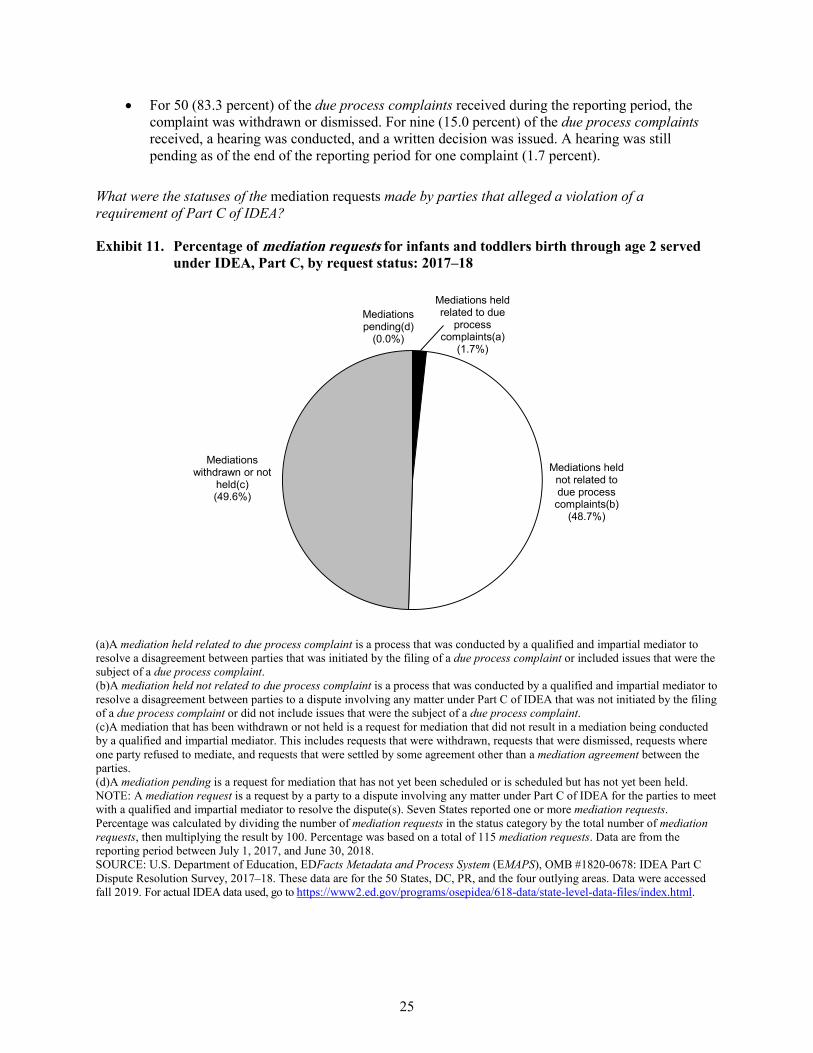
25
• For 50 (83.3 percent) of the due process complaints received during the reporting period, the complaint was withdrawn or dismissed. For nine (15.0 percent) of the due process complaints received, a hearing was conducted, and a written decision was issued. A hearing was still pending as of the end of the reporting period for one complaint (1.7 percent).
What were the statuses of the mediation requests made by parties that alleged a violation of a requirement of Part C of IDEA?
Exhibit 11. Percentage of mediation requests for infants and toddlers birth through age 2 served under IDEA, Part C, by request status: 2017–18
Mediations held related to due
process complaints(a)
(1.7%)
Mediations held not related to due process complaints(b)
(48.7%)
Mediations withdrawn or not
held(c) (49.6%)
Mediations pending(d)
(0.0%)
(a)A mediation held related to due process complaint is a process that was conducted by a qualified and impartial mediator to resolve a disagreement between parties that was initiated by the filing of a due process complaint or included issues that were the subject of a due process complaint. (b)A mediation held not related to due process complaint is a process that was conducted by a qualified and impartial mediator to resolve a disagreement between parties to a dispute involving any matter under Part C of IDEA that was not initiated by the filing of a due process complaint or did not include issues that were the subject of a due process complaint. (c)A mediation that has been withdrawn or not held is a request for mediation that did not result in a mediation being conducted by a qualified and impartial mediator. This includes requests that were withdrawn, requests that were dismissed, requests where one party refused to mediate, and requests that were settled by some agreement other than a mediation agreement between the parties. (d)A mediation pending is a request for mediation that has not yet been scheduled or is scheduled but has not yet been held. NOTE: A mediation request is a request by a party to a dispute involving any matter under Part C of IDEA for the parties to meet with a qualified and impartial mediator to resolve the dispute(s). Seven States reported one or more mediation requests. Percentage was calculated by dividing the number of mediation requests in the status category by the total number of mediation requests, then multiplying the result by 100. Percentage was based on a total of 115 mediation requests. Data are from the reporting period between July 1, 2017, and June 30, 2018. SOURCE: U.S. Department of Education, EDFacts Metadata and Process System (EMAPS), OMB #1820-0678: IDEA Part C Dispute Resolution Survey, 2017–18. These data are for the 50 States, DC, PR, and the four outlying areas. Data were accessed fall 2019. For actual IDEA data used, go to https://www2.ed.gov/programs/osepidea/618-data/state-level-data-files/index.html.
26
• During 2017–18, a total of 115 mediation requests were received through the dispute resolution process for infants and toddlers birth through age 2 served under IDEA, Part C.
• A mediation was conducted before the end of the reporting period for 58 (50.4 percent) of the mediation requests received. The mediation that was held in two (1.7 percent) of these cases was related to a due process complaint, while the mediation held in 56 (48.7 percent) of these cases was not related to a due process complaint. The remaining 57 (49.6 percent) of the mediation requests received during the reporting period were withdrawn, dismissed, or otherwise ended without a mediation being held. No mediation requests were still pending at the end of the reporting period.
27
Children Ages 3 Through 5 Served Under IDEA, Part B
Under Part B of the Individuals with Disabilities Education Act (IDEA), the Secretary provides funds to States to assist them in providing a free appropriate public education (FAPE) to children ages 3 through 5 and students ages 6 through 21 with disabilities who are in need of special education and related services. The Preschool Grants for Children with Disabilities program (IDEA, Section 619) supplements funding available for children ages 3 through 5 with disabilities under the Grants to States program (IDEA, Section 611). To be eligible for funding under the Preschool Grants for Children with Disabilities program and the Grants to States program for children ages 3 through 5, a State must make FAPE available to all children ages 3 through 5 with disabilities residing in the State.
IDEA, Part B, has four primary purposes:
• To ensure that all children with disabilities have FAPE available to them and receive special education and related services designed to meet their individual needs;
• To ensure that the rights of children with disabilities and their parents are protected;
• To assist States and localities to provide for the education of all children with disabilities; and
• To assess and ensure the effectiveness of efforts to educate children with disabilities.
In general, the exhibits presenting Part B data in this section represent the 50 States; the District of Columbia (DC); schools operated or funded by the Bureau of Indian Education (Bureau of Indian Education schools or BIE schools, herein); Puerto Rico (PR); the four outlying areas of American Samoa, Guam, the Northern Mariana Islands, and the Virgin Islands; and the three freely associated states of the Federated States of Micronesia, the Republic of Palau, and the Republic of the Marshall Islands.5,6 As there are some exceptions, such as the exhibits that present Part B data with data about the residential population, each exhibit is accompanied by a note that identifies the particular jurisdictions that are represented. In this section, there are occasional references to “special education services.” The term is synonymous with services provided under IDEA, Part B.
5 Although the Bureau of Indian Education does not receive funds under IDEA, Part B, Section 619, Bureau of Indian Education
schools may report 5-year-old children who are enrolled in elementary schools for American Indian children operated or funded by the Bureau of Indian Education and who receive services funded under IDEA, Part B, Section 611(h)(1)(A).
6 The four outlying areas and the three freely associated states do not receive funds under IDEA, Part B, Section 619. However, they may report children ages 3 through 5 who receive services funded under IDEA, Part B, Section 611(b)(1)(A).
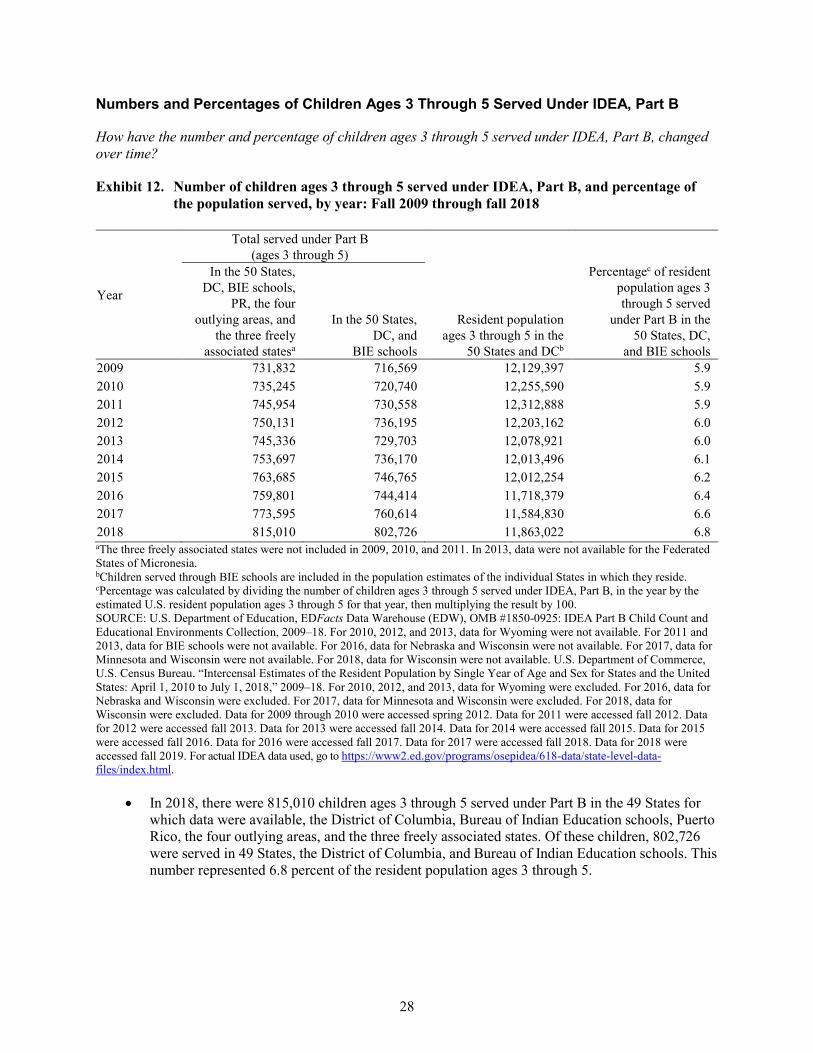
28
Numbers and Percentages of Children Ages 3 Through 5 Served Under IDEA, Part B
How have the number and percentage of children ages 3 through 5 served under IDEA, Part B, changed over time?
Exhibit 12. Number of children ages 3 through 5 served under IDEA, Part B, and percentage of the population served, by year: Fall 2009 through fall 2018
Year
Total served under Part B (ages 3 through 5)
Resident population ages 3 through 5 in the
50 States and DCb
Percentagec of resident population ages 3 through 5 served
under Part B in the 50 States, DC,
and BIE schools
In the 50 States, DC, BIE schools,
PR, the four outlying areas, and
the three freely associated statesa
In the 50 States, DC, and
BIE schools 2009 731,832 716,569 12,129,397 5.9 2010 735,245 720,740 12,255,590 5.9 2011 745,954 730,558 12,312,888 5.9 2012 750,131 736,195 12,203,162 6.0 2013 745,336 729,703 12,078,921 6.0 2014 753,697 736,170 12,013,496 6.1 2015 763,685 746,765 12,012,254 6.2 2016 759,801 744,414 11,718,379 6.4 2017 773,595 760,614 11,584,830 6.6 2018 815,010 802,726 11,863,022 6.8 aThe three freely associated states were not included in 2009, 2010, and 2011. In 2013, data were not available for the Federated States of Micronesia. bChildren served through BIE schools are included in the population estimates of the individual States in which they reside. cPercentage was calculated by dividing the number of children ages 3 through 5 served under IDEA, Part B, in the year by the estimated U.S. resident population ages 3 through 5 for that year, then multiplying the result by 100. SOURCE: U.S. Department of Education, EDFacts Data Warehouse (EDW), OMB #1850-0925: IDEA Part B Child Count and Educational Environments Collection, 2009–18. For 2010, 2012, and 2013, data for Wyoming were not available. For 2011 and 2013, data for BIE schools were not available. For 2016, data for Nebraska and Wisconsin were not available. For 2017, data for Minnesota and Wisconsin were not available. For 2018, data for Wisconsin were not available. U.S. Department of Commerce, U.S. Census Bureau. “Intercensal Estimates of the Resident Population by Single Year of Age and Sex for States and the United States: April 1, 2010 to July 1, 2018,” 2009–18. For 2010, 2012, and 2013, data for Wyoming were excluded. For 2016, data for Nebraska and Wisconsin were excluded. For 2017, data for Minnesota and Wisconsin were excluded. For 2018, data for Wisconsin were excluded. Data for 2009 through 2010 were accessed spring 2012. Data for 2011 were accessed fall 2012. Data for 2012 were accessed fall 2013. Data for 2013 were accessed fall 2014. Data for 2014 were accessed fall 2015. Data for 2015 were accessed fall 2016. Data for 2016 were accessed fall 2017. Data for 2017 were accessed fall 2018. Data for 2018 were accessed fall 2019. For actual IDEA data used, go to https://www2.ed.gov/programs/osepidea/618-data/state-level-data-files/index.html.
• In 2018, there were 815,010 children ages 3 through 5 served under Part B in the 49 States for which data were available, the District of Columbia, Bureau of Indian Education schools, Puerto Rico, the four outlying areas, and the three freely associated states. Of these children, 802,726 were served in 49 States, the District of Columbia, and Bureau of Indian Education schools. This number represented 6.8 percent of the resident population ages 3 through 5.
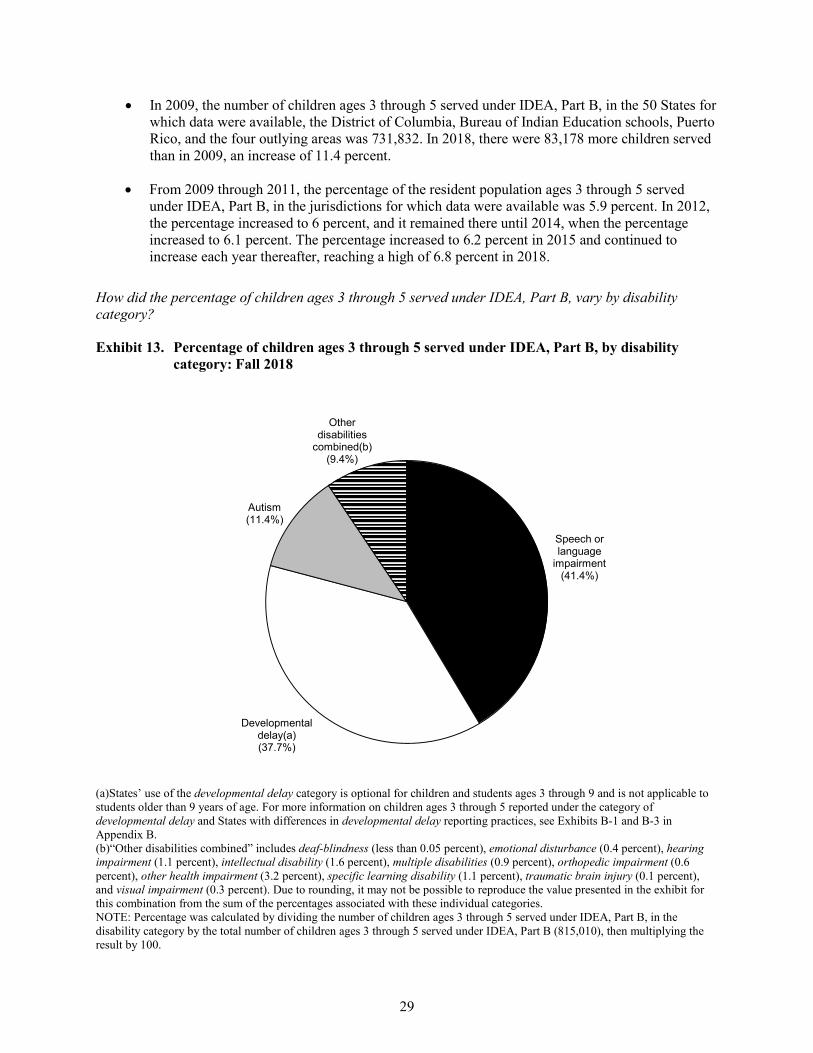
29
• In 2009, the number of children ages 3 through 5 served under IDEA, Part B, in the 50 States for which data were available, the District of Columbia, Bureau of Indian Education schools, Puerto Rico, and the four outlying areas was 731,832. In 2018, there were 83,178 more children served than in 2009, an increase of 11.4 percent.
• From 2009 through 2011, the percentage of the resident population ages 3 through 5 served under IDEA, Part B, in the jurisdictions for which data were available was 5.9 percent. In 2012, the percentage increased to 6 percent, and it remained there until 2014, when the percentage increased to 6.1 percent. The percentage increased to 6.2 percent in 2015 and continued to increase each year thereafter, reaching a high of 6.8 percent in 2018.
How did the percentage of children ages 3 through 5 served under IDEA, Part B, vary by disability category?
Exhibit 13. Percentage of children ages 3 through 5 served under IDEA, Part B, by disability category: Fall 2018
Speech or language
impairment(41.4%)
Developmental delay(a)(37.7%)
Autism(11.4%)
Other disabilities
combined(b)(9.4%)
(a)States’ use of the developmental delay category is optional for children and students ages 3 through 9 and is not applicable to students older than 9 years of age. For more information on children ages 3 through 5 reported under the category of developmental delay and States with differences in developmental delay reporting practices, see Exhibits B-1 and B-3 in Appendix B. (b)“Other disabilities combined” includes deaf-blindness (less than 0.05 percent), emotional disturbance (0.4 percent), hearing impairment (1.1 percent), intellectual disability (1.6 percent), multiple disabilities (0.9 percent), orthopedic impairment (0.6 percent), other health impairment (3.2 percent), specific learning disability (1.1 percent), traumatic brain injury (0.1 percent), and visual impairment (0.3 percent). Due to rounding, it may not be possible to reproduce the value presented in the exhibit for this combination from the sum of the percentages associated with these individual categories. NOTE: Percentage was calculated by dividing the number of children ages 3 through 5 served under IDEA, Part B, in the disability category by the total number of children ages 3 through 5 served under IDEA, Part B (815,010), then multiplying the result by 100.
30
• In 2018, the most prevalent disability category of children ages 3 through 5 served under IDEA, Part B, was speech or language impairment (specifically, 337,707 of 815,010 children, or 41.4 percent). The next most common disability category was developmental delay (37.7 percent), followed by autism (11.4 percent).
• The children ages 3 through 5 represented by the category “Other disabilities combined” accounted for the remaining 9.4 percent of children served under IDEA, Part B.
SOURCE: U.S. Department of Education, EDFacts Data Warehouse (EDW), OMB #1850-0925: IDEA Part B Child Count and Educational Environments Collection, 2018. These data are for 49 States, BIE schools, DC, PR, the four outlying areas, and the three freely associated states. Data for Wisconsin were not available. Data were accessed fall 2019. For actual IDEA data used, go to https://www2.ed.gov/programs/osepidea/618-data/state-level-data-files/index.html.
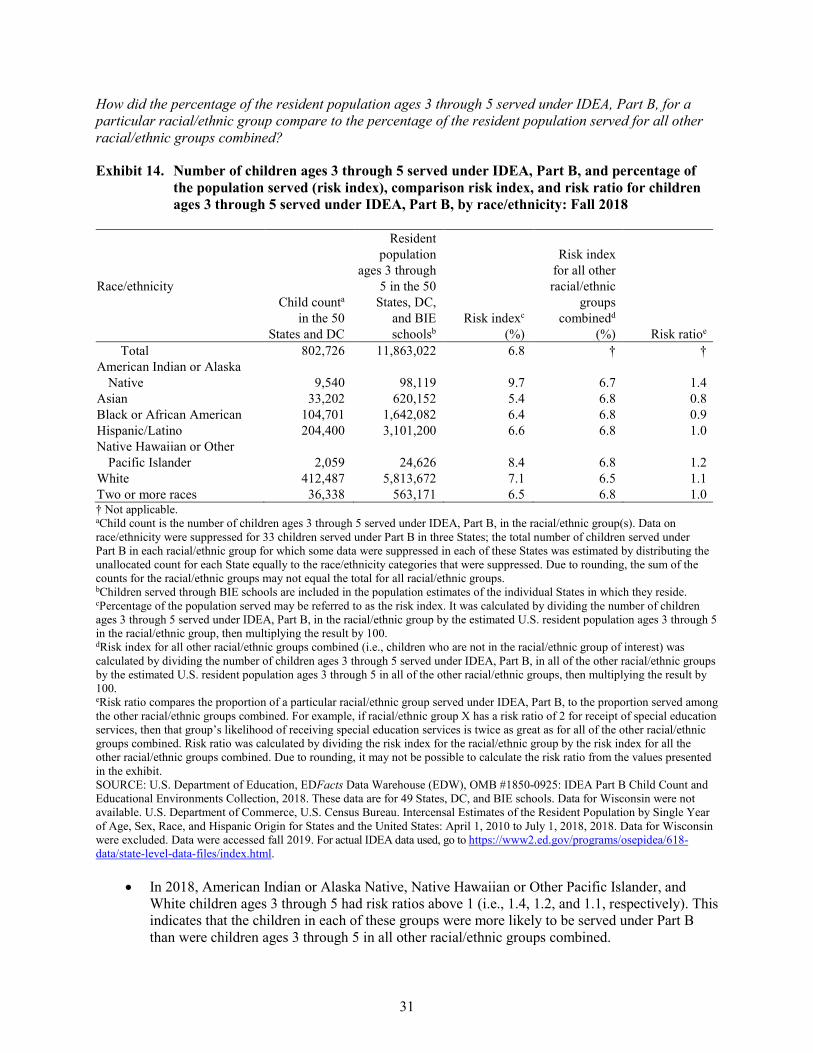
31
How did the percentage of the resident population ages 3 through 5 served under IDEA, Part B, for a particular racial/ethnic group compare to the percentage of the resident population served for all other racial/ethnic groups combined?
Exhibit 14. Number of children ages 3 through 5 served under IDEA, Part B, and percentage of the population served (risk index), comparison risk index, and risk ratio for children ages 3 through 5 served under IDEA, Part B, by race/ethnicity: Fall 2018
Race/ethnicity Child counta
in the 50 States and DC
Resident population
ages 3 through 5 in the 50
States, DC, and BIE schoolsb
Risk indexc
(%)
Risk index for all other racial/ethnic
groups combinedd
(%) Risk ratioe Total 802,726 11,863,022 6.8 † †
American Indian or Alaska Native 9,540 98,119 9.7 6.7 1.4
Asian 33,202 620,152 5.4 6.8 0.8 Black or African American 104,701 1,642,082 6.4 6.8 0.9 Hispanic/Latino 204,400 3,101,200 6.6 6.8 1.0 Native Hawaiian or Other
Pacific Islander 2,059 24,626 8.4 6.8 1.2 White 412,487 5,813,672 7.1 6.5 1.1 Two or more races 36,338 563,171 6.5 6.8 1.0 † Not applicable. aChild count is the number of children ages 3 through 5 served under IDEA, Part B, in the racial/ethnic group(s). Data on race/ethnicity were suppressed for 33 children served under Part B in three States; the total number of children served under Part B in each racial/ethnic group for which some data were suppressed in each of these States was estimated by distributing the unallocated count for each State equally to the race/ethnicity categories that were suppressed. Due to rounding, the sum of the counts for the racial/ethnic groups may not equal the total for all racial/ethnic groups. bChildren served through BIE schools are included in the population estimates of the individual States in which they reside. cPercentage of the population served may be referred to as the risk index. It was calculated by dividing the number of children ages 3 through 5 served under IDEA, Part B, in the racial/ethnic group by the estimated U.S. resident population ages 3 through 5 in the racial/ethnic group, then multiplying the result by 100. dRisk index for all other racial/ethnic groups combined (i.e., children who are not in the racial/ethnic group of interest) was calculated by dividing the number of children ages 3 through 5 served under IDEA, Part B, in all of the other racial/ethnic groups by the estimated U.S. resident population ages 3 through 5 in all of the other racial/ethnic groups, then multiplying the result by 100. eRisk ratio compares the proportion of a particular racial/ethnic group served under IDEA, Part B, to the proportion served among the other racial/ethnic groups combined. For example, if racial/ethnic group X has a risk ratio of 2 for receipt of special education services, then that group’s likelihood of receiving special education services is twice as great as for all of the other racial/ethnic groups combined. Risk ratio was calculated by dividing the risk index for the racial/ethnic group by the risk index for all the other racial/ethnic groups combined. Due to rounding, it may not be possible to calculate the risk ratio from the values presented in the exhibit. SOURCE: U.S. Department of Education, EDFacts Data Warehouse (EDW), OMB #1850-0925: IDEA Part B Child Count and Educational Environments Collection, 2018. These data are for 49 States, DC, and BIE schools. Data for Wisconsin were not available. U.S. Department of Commerce, U.S. Census Bureau. Intercensal Estimates of the Resident Population by Single Year of Age, Sex, Race, and Hispanic Origin for States and the United States: April 1, 2010 to July 1, 2018, 2018. Data for Wisconsin were excluded. Data were accessed fall 2019. For actual IDEA data used, go to https://www2.ed.gov/programs/osepidea/618-data/state-level-data-files/index.html.
• In 2018, American Indian or Alaska Native, Native Hawaiian or Other Pacific Islander, and White children ages 3 through 5 had risk ratios above 1 (i.e., 1.4, 1.2, and 1.1, respectively). This indicates that the children in each of these groups were more likely to be served under Part B than were children ages 3 through 5 in all other racial/ethnic groups combined.
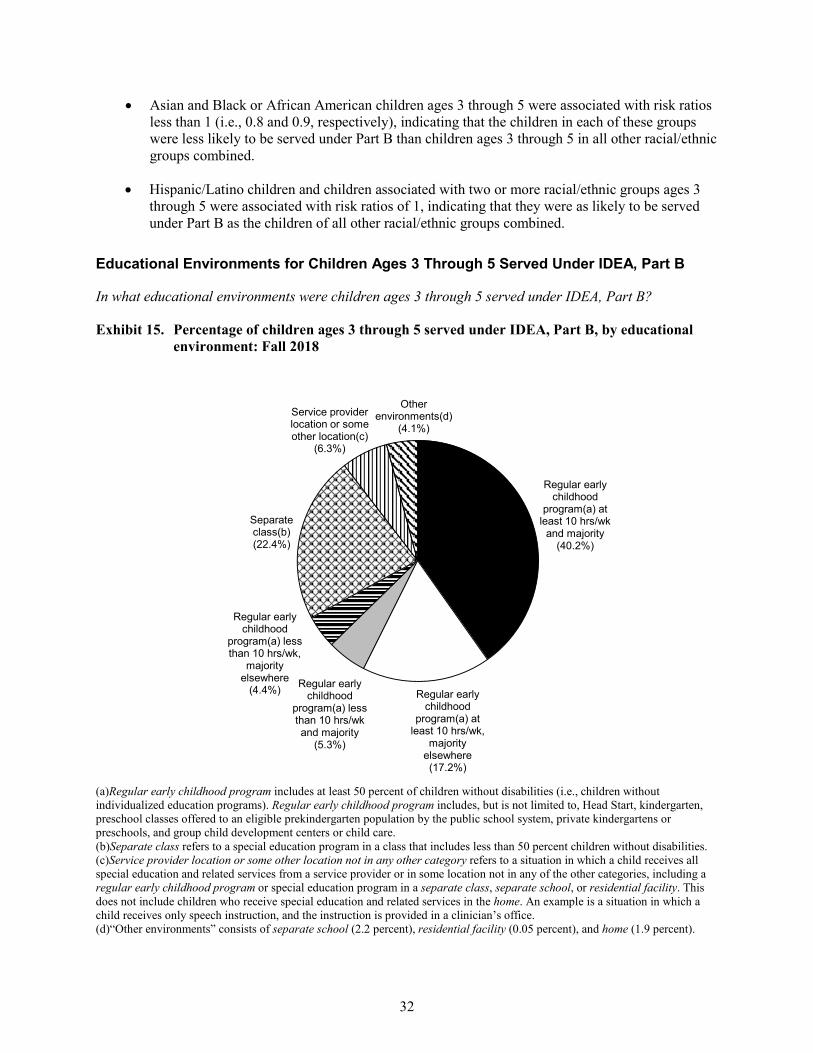
32
• Asian and Black or African American children ages 3 through 5 were associated with risk ratios less than 1 (i.e., 0.8 and 0.9, respectively), indicating that the children in each of these groups were less likely to be served under Part B than children ages 3 through 5 in all other racial/ethnic groups combined.
• Hispanic/Latino children and children associated with two or more racial/ethnic groups ages 3 through 5 were associated with risk ratios of 1, indicating that they were as likely to be served under Part B as the children of all other racial/ethnic groups combined.
Educational Environments for Children Ages 3 Through 5 Served Under IDEA, Part B
In what educational environments were children ages 3 through 5 served under IDEA, Part B?
Exhibit 15. Percentage of children ages 3 through 5 served under IDEA, Part B, by educational environment: Fall 2018
Regular early childhood
program(a) at least 10 hrs/wk
and majority(40.2%)
Regular early childhood
program(a) at least 10 hrs/wk,
majority elsewhere(17.2%)
Regular early childhood
program(a) less than 10 hrs/wk and majority
(5.3%)
Regular early childhood
program(a) less than 10 hrs/wk,
majority elsewhere
(4.4%)
Separate class(b)(22.4%)
Service provider location or some other location(c)
(6.3%)
Other environments(d)
(4.1%)
(a)Regular early childhood program includes at least 50 percent of children without disabilities (i.e., children without individualized education programs). Regular early childhood program includes, but is not limited to, Head Start, kindergarten, preschool classes offered to an eligible prekindergarten population by the public school system, private kindergartens or preschools, and group child development centers or child care. (b)Separate class refers to a special education program in a class that includes less than 50 percent children without disabilities. (c)Service provider location or some other location not in any other category refers to a situation in which a child receives all special education and related services from a service provider or in some location not in any of the other categories, including a regular early childhood program or special education program in a separate class, separate school, or residential facility. This does not include children who receive special education and related services in the home. An example is a situation in which a child receives only speech instruction, and the instruction is provided in a clinician’s office. (d)“Other environments” consists of separate school (2.2 percent), residential facility (0.05 percent), and home (1.9 percent).

33
• In 2018, a total of 547,211, or 67.1 percent, of the 815,010 children ages 3 through 5 served under IDEA, Part B, were in a regular early childhood program for some amount of their time in school.
• Children attending a regular early childhood program at least 10 hours per week and receiving the majority of hours of special education and related services in the regular early childhood program accounted for 40.2 percent of all children ages 3 through 5 served under IDEA, Part B. This represented more children than any other educational environment category.
• Separate class accounted for 22.4 percent of children ages 3 through 5 served under IDEA, Part B, making it the second most prevalent educational environment category.
• Collectively, separate school, residential facility, and home (which are represented by the term “Other environments”) accounted for 4.1 percent of the children ages 3 through 5 served under IDEA, Part B.
• The educational environment category for the remaining students, representing 6.3 percent of the children ages 3 through 5 served under IDEA, Part B, was a service provider location or some other location not in any other category.
NOTE: Percentage was calculated by dividing the number of children ages 3 through 5 served under IDEA, Part B (815,010), in the educational environment category by the total number of children ages 3 through 5 served under IDEA, Part B, in all the educational environments, then multiplying the result by 100. The sum may not total 100 percent because of rounding. SOURCE: U.S. Department of Education, EDFacts Data Warehouse (EDW), OMB #1850-0925: IDEA Part B Child Count and Educational Environments Collection, 2018. These data are for 49 States, DC, PR, BIE schools, the four outlying areas, and the three freely associated states. Data for Wisconsin were not available. Data were accessed fall 2019. For actual IDEA data used, go to https://www2.ed.gov/programs/osepidea/618-data/state-level-data-files/index.html.
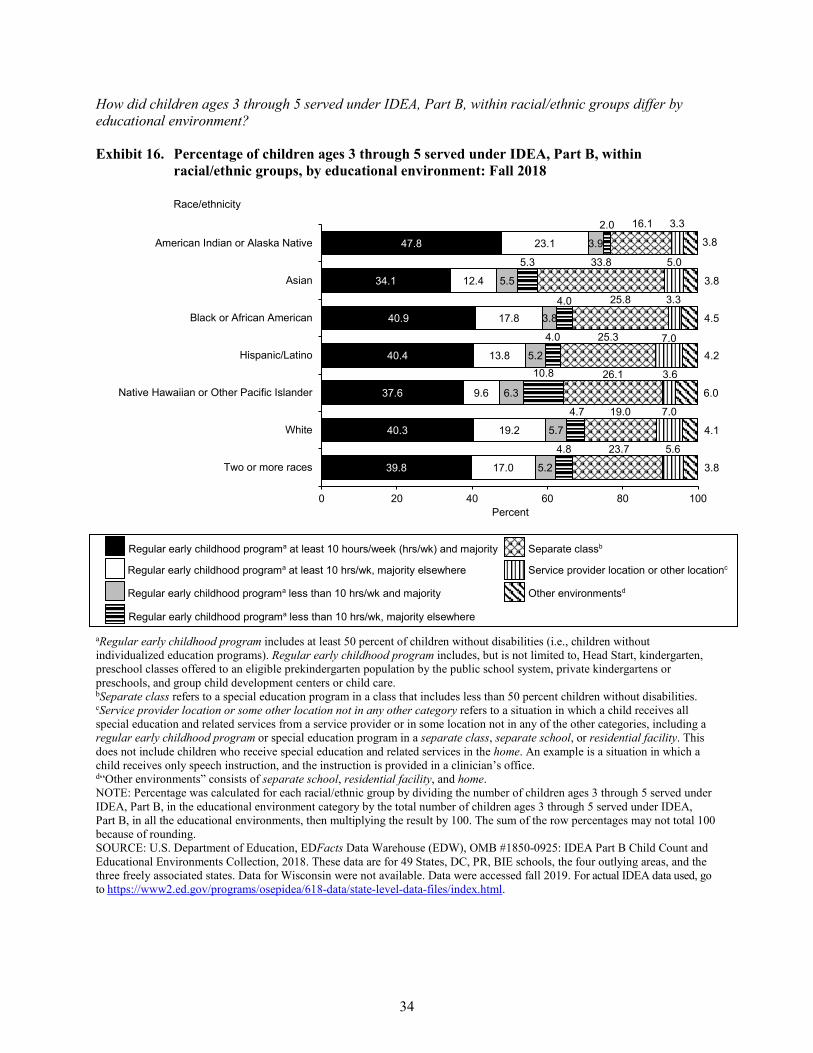
34
How did children ages 3 through 5 served under IDEA, Part B, within racial/ethnic groups differ by educational environment?
Exhibit 16. Percentage of children ages 3 through 5 served under IDEA, Part B, within racial/ethnic groups, by educational environment: Fall 2018
39.8
40.3
37.6
40.4
40.9
34.1
47.8
17.0
19.2
9.6
13.8
17.8
12.4
23.1
5.2
5.7
6.3
5.2
3.8
5.5
3.9
4.8
4.7
10.8
4.0
4.0
5.3
2.0
23.7
19.0
26.1
25.3
25.8
33.8
16.1
5.6
7.0
3.6
7.0
3.3
5.0
3.3
3.8
4.1
6.0
4.2
4.5
3.8
3.8
0 20 40 60 80 100
Two or more races
White
Native Hawaiian or Other Pacific Islander
Hispanic/Latino
Black or African American
Asian
American Indian or Alaska Native
Percent
Race/ethnicity
Regular early childhood programa at least 10 hours/week (hrs/wk) and majority
Regular early childhood programa at least 10 hrs/wk, majority elsewhere
Regular early childhood programa less than 10 hrs/wk and majority
Regular early childhood programa less than 10 hrs/wk, majority elsewhere
Separate classb
Service provider location or other locationc
Other environmentsd
aRegular early childhood program includes at least 50 percent of children without disabilities (i.e., children without individualized education programs). Regular early childhood program includes, but is not limited to, Head Start, kindergarten, preschool classes offered to an eligible prekindergarten population by the public school system, private kindergartens or preschools, and group child development centers or child care. bSeparate class refers to a special education program in a class that includes less than 50 percent children without disabilities. cService provider location or some other location not in any other category refers to a situation in which a child receives all special education and related services from a service provider or in some location not in any of the other categories, including a regular early childhood program or special education program in a separate class, separate school, or residential facility. This does not include children who receive special education and related services in the home. An example is a situation in which a child receives only speech instruction, and the instruction is provided in a clinician’s office. d“Other environments” consists of separate school, residential facility, and home. NOTE: Percentage was calculated for each racial/ethnic group by dividing the number of children ages 3 through 5 served under IDEA, Part B, in the educational environment category by the total number of children ages 3 through 5 served under IDEA, Part B, in all the educational environments, then multiplying the result by 100. The sum of the row percentages may not total 100 because of rounding. SOURCE: U.S. Department of Education, EDFacts Data Warehouse (EDW), OMB #1850-0925: IDEA Part B Child Count and Educational Environments Collection, 2018. These data are for 49 States, DC, PR, BIE schools, the four outlying areas, and the three freely associated states. Data for Wisconsin were not available. Data were accessed fall 2019. For actual IDEA data used, go to https://www2.ed.gov/programs/osepidea/618-data/state-level-data-files/index.html.
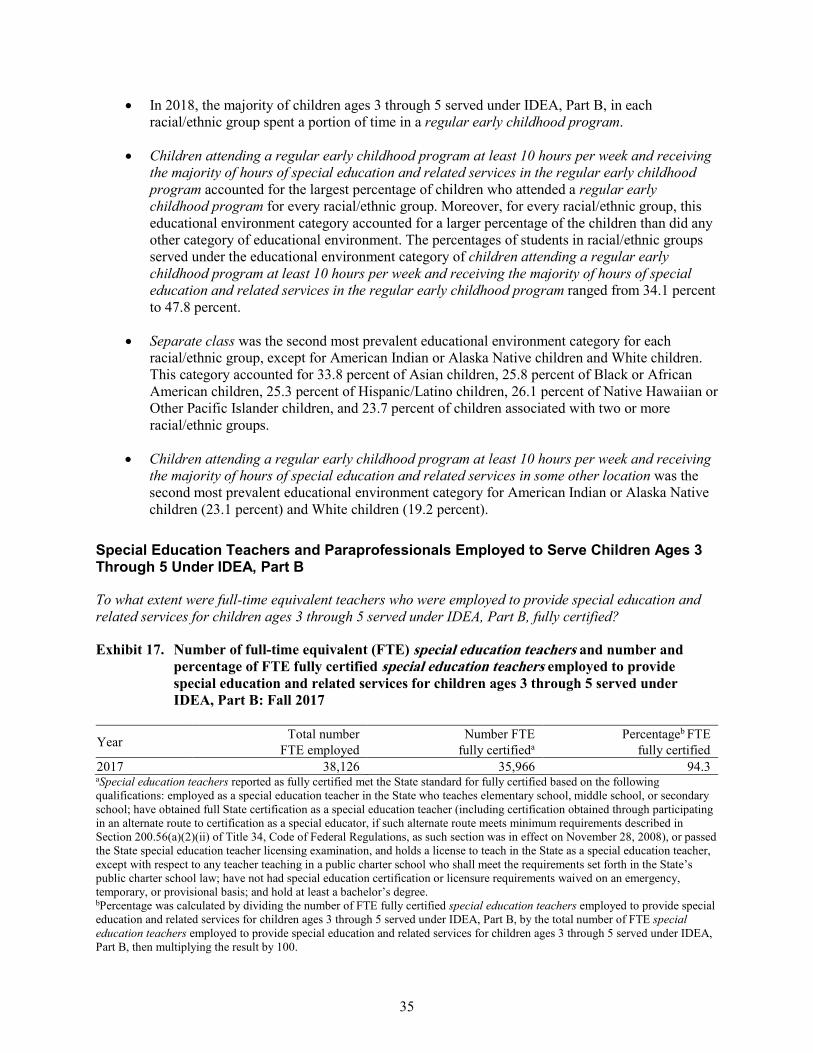
35
• In 2018, the majority of children ages 3 through 5 served under IDEA, Part B, in each racial/ethnic group spent a portion of time in a regular early childhood program.
• Children attending a regular early childhood program at least 10 hours per week and receiving the majority of hours of special education and related services in the regular early childhood program accounted for the largest percentage of children who attended a regular early childhood program for every racial/ethnic group. Moreover, for every racial/ethnic group, this educational environment category accounted for a larger percentage of the children than did any other category of educational environment. The percentages of students in racial/ethnic groups served under the educational environment category of children attending a regular early childhood program at least 10 hours per week and receiving the majority of hours of special education and related services in the regular early childhood program ranged from 34.1 percent to 47.8 percent.
• Separate class was the second most prevalent educational environment category for each racial/ethnic group, except for American Indian or Alaska Native children and White children. This category accounted for 33.8 percent of Asian children, 25.8 percent of Black or African American children, 25.3 percent of Hispanic/Latino children, 26.1 percent of Native Hawaiian or Other Pacific Islander children, and 23.7 percent of children associated with two or more racial/ethnic groups.
• Children attending a regular early childhood program at least 10 hours per week and receiving the majority of hours of special education and related services in some other location was the second most prevalent educational environment category for American Indian or Alaska Native children (23.1 percent) and White children (19.2 percent).
Special Education Teachers and Paraprofessionals Employed to Serve Children Ages 3 Through 5 Under IDEA, Part B
To what extent were full-time equivalent teachers who were employed to provide special education and related services for children ages 3 through 5 served under IDEA, Part B, fully certified?
Exhibit 17. Number of full-time equivalent (FTE) special education teachers and number and percentage of FTE fully certified special education teachers employed to provide special education and related services for children ages 3 through 5 served under IDEA, Part B: Fall 2017
Year Total number FTE employed
Number FTE fully certifieda
Percentageb FTE fully certified
2017 38,126 35,966 94.3 aSpecial education teachers reported as fully certified met the State standard for fully certified based on the following qualifications: employed as a special education teacher in the State who teaches elementary school, middle school, or secondary school; have obtained full State certification as a special education teacher (including certification obtained through participating in an alternate route to certification as a special educator, if such alternate route meets minimum requirements described in Section 200.56(a)(2)(ii) of Title 34, Code of Federal Regulations, as such section was in effect on November 28, 2008), or passed the State special education teacher licensing examination, and holds a license to teach in the State as a special education teacher, except with respect to any teacher teaching in a public charter school who shall meet the requirements set forth in the State’s public charter school law; have not had special education certification or licensure requirements waived on an emergency, temporary, or provisional basis; and hold at least a bachelor’s degree. bPercentage was calculated by dividing the number of FTE fully certified special education teachers employed to provide special education and related services for children ages 3 through 5 served under IDEA, Part B, by the total number of FTE special education teachers employed to provide special education and related services for children ages 3 through 5 served under IDEA, Part B, then multiplying the result by 100.
36
• In 2017, a total of 35,966, or 94.3 percent, of the 38,126 full-time equivalent (FTE) special education teachers who were employed to provide special education and related services for children ages 3 through 5 under IDEA, Part B, were fully certified.
SOURCE: U.S. Department of Education, EDFacts Data Warehouse (EDW), OMB #1850-0925: IDEA Part B Personnel Collection, 2017. These data are for 49 States, DC, BIE schools, PR, the four outlying areas, and the three freely associated states. Data for Vermont were not available. Data were accessed fall 2019. For actual IDEA data used, go to https://www2.ed.gov/programs/osepidea/618-data/state-level-data-files/index.html.
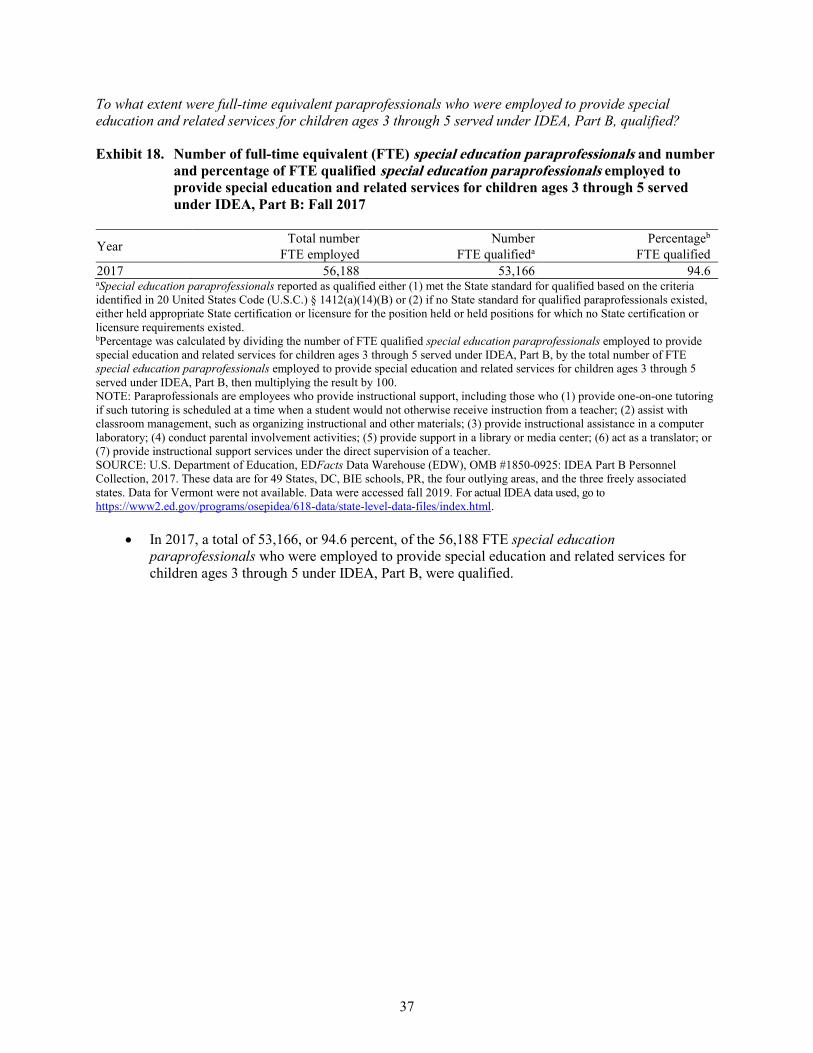
37
To what extent were full-time equivalent paraprofessionals who were employed to provide special education and related services for children ages 3 through 5 served under IDEA, Part B, qualified?
Exhibit 18. Number of full-time equivalent (FTE) special education paraprofessionals and number and percentage of FTE qualified special education paraprofessionals employed to provide special education and related services for children ages 3 through 5 served under IDEA, Part B: Fall 2017
Year Total number FTE employed
Number FTE qualifieda
Percentageb
FTE qualified 2017 56,188 53,166 94.6 aSpecial education paraprofessionals reported as qualified either (1) met the State standard for qualified based on the criteria identified in 20 United States Code (U.S.C.) § 1412(a)(14)(B) or (2) if no State standard for qualified paraprofessionals existed, either held appropriate State certification or licensure for the position held or held positions for which no State certification or licensure requirements existed. bPercentage was calculated by dividing the number of FTE qualified special education paraprofessionals employed to provide special education and related services for children ages 3 through 5 served under IDEA, Part B, by the total number of FTE special education paraprofessionals employed to provide special education and related services for children ages 3 through 5 served under IDEA, Part B, then multiplying the result by 100. NOTE: Paraprofessionals are employees who provide instructional support, including those who (1) provide one-on-one tutoring if such tutoring is scheduled at a time when a student would not otherwise receive instruction from a teacher; (2) assist with classroom management, such as organizing instructional and other materials; (3) provide instructional assistance in a computer laboratory; (4) conduct parental involvement activities; (5) provide support in a library or media center; (6) act as a translator; or (7) provide instructional support services under the direct supervision of a teacher. SOURCE: U.S. Department of Education, EDFacts Data Warehouse (EDW), OMB #1850-0925: IDEA Part B Personnel Collection, 2017. These data are for 49 States, DC, BIE schools, PR, the four outlying areas, and the three freely associated states. Data for Vermont were not available. Data were accessed fall 2019. For actual IDEA data used, go to https://www2.ed.gov/programs/osepidea/618-data/state-level-data-files/index.html.
• In 2017, a total of 53,166, or 94.6 percent, of the 56,188 FTE special education paraprofessionals who were employed to provide special education and related services for children ages 3 through 5 under IDEA, Part B, were qualified.
38
Students Ages 6 Through 21 Served Under IDEA, Part B
Since the 1975 passage of the Education for All Handicapped Children Act (P.L. 94-142), the U.S. Department of Education has collected data on the number of children served under the Act. Early collections of data on the number of children served under Part B of the Individuals with Disabilities Education Act (IDEA) focused on nine disability categories. Through the subsequent years and multiple reauthorizations of the Act, the disability categories have been expanded to 13 and revised, and new data collections have been required.
In 1997, the Act was reauthorized with several major revisions (IDEA Amendments of 1997; P.L. 105-17). The reauthorization allowed States the option of using the developmental delay category7 for children and students ages 3 through 9. Another revision was the requirement that race/ethnicity data be collected on the number of children served.
In general, the exhibits presenting Part B data in this section represent the 50 States; the District of Columbia (DC); schools operated or funded by the Bureau of Indian Education (Bureau of Indian Education or BIE schools, herein); Puerto Rico (PR); the four outlying areas of American Samoa, Guam, the Northern Mariana Islands, and the Virgin Islands; and the three freely associated states of the Federated States of Micronesia, the Republic of Palau, and the Republic of the Marshall Islands.8,9 As there are some exceptions, such as the exhibits that present Part B data with data about residential population, each exhibit is accompanied by a note that identifies the particular jurisdictions that are represented. There are occasional references to “special education services” in this section, and this term is synonymous with services provided under IDEA, Part B.
7 States’ use of the developmental delay category is optional for children and students ages 3 through 9 and is not applicable to
students older than 9 years of age. For more information on students ages 6 through 9 reported under the category of developmental delay, see Appendix B.
8 Although the Bureau of Indian Education does not receive funds under IDEA, Part B, Section 619, Bureau of Indian Education schools may report 5-year-old children who are enrolled in elementary schools for American Indian children operated or funded by the Bureau of Indian Education and who receive services funded under IDEA, Part B, Section 611(h)(1)(A).
9 The four outlying areas and the three freely associated states do not receive funds under IDEA, Part B, Section 619. However, the outlying areas may report children ages 3 through 5 who receive services funded under IDEA, Part B, Section 611(b)(1)(A).
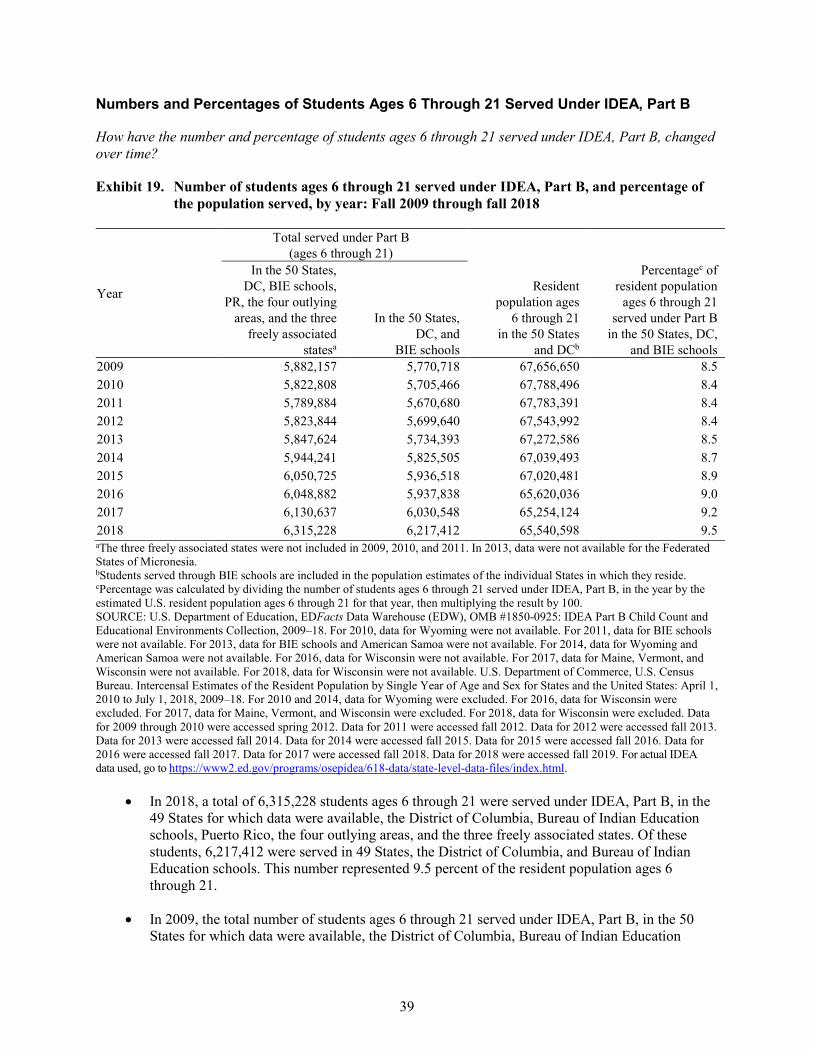
39
Numbers and Percentages of Students Ages 6 Through 21 Served Under IDEA, Part B
How have the number and percentage of students ages 6 through 21 served under IDEA, Part B, changed over time?
Exhibit 19. Number of students ages 6 through 21 served under IDEA, Part B, and percentage of the population served, by year: Fall 2009 through fall 2018
Year
Total served under Part B (ages 6 through 21)
Resident population ages
6 through 21 in the 50 States
and DCb
Percentagec of resident population
ages 6 through 21 served under Part B
in the 50 States, DC, and BIE schools
In the 50 States, DC, BIE schools,
PR, the four outlying areas, and the three
freely associated statesa
In the 50 States, DC, and
BIE schools 2009 5,882,157 5,770,718 67,656,650 8.5 2010 5,822,808 5,705,466 67,788,496 8.4 2011 5,789,884 5,670,680 67,783,391 8.4 2012 5,823,844 5,699,640 67,543,992 8.4 2013 5,847,624 5,734,393 67,272,586 8.5 2014 5,944,241 5,825,505 67,039,493 8.7 2015 6,050,725 5,936,518 67,020,481 8.9 2016 6,048,882 5,937,838 65,620,036 9.0 2017 6,130,637 6,030,548 65,254,124 9.2 2018 6,315,228 6,217,412 65,540,598 9.5 aThe three freely associated states were not included in 2009, 2010, and 2011. In 2013, data were not available for the Federated States of Micronesia. bStudents served through BIE schools are included in the population estimates of the individual States in which they reside. cPercentage was calculated by dividing the number of students ages 6 through 21 served under IDEA, Part B, in the year by the estimated U.S. resident population ages 6 through 21 for that year, then multiplying the result by 100. SOURCE: U.S. Department of Education, EDFacts Data Warehouse (EDW), OMB #1850-0925: IDEA Part B Child Count and Educational Environments Collection, 2009–18. For 2010, data for Wyoming were not available. For 2011, data for BIE schools were not available. For 2013, data for BIE schools and American Samoa were not available. For 2014, data for Wyoming and American Samoa were not available. For 2016, data for Wisconsin were not available. For 2017, data for Maine, Vermont, and Wisconsin were not available. For 2018, data for Wisconsin were not available. U.S. Department of Commerce, U.S. Census Bureau. Intercensal Estimates of the Resident Population by Single Year of Age and Sex for States and the United States: April 1, 2010 to July 1, 2018, 2009–18. For 2010 and 2014, data for Wyoming were excluded. For 2016, data for Wisconsin were excluded. For 2017, data for Maine, Vermont, and Wisconsin were excluded. For 2018, data for Wisconsin were excluded. Data for 2009 through 2010 were accessed spring 2012. Data for 2011 were accessed fall 2012. Data for 2012 were accessed fall 2013. Data for 2013 were accessed fall 2014. Data for 2014 were accessed fall 2015. Data for 2015 were accessed fall 2016. Data for 2016 were accessed fall 2017. Data for 2017 were accessed fall 2018. Data for 2018 were accessed fall 2019. For actual IDEA data used, go to https://www2.ed.gov/programs/osepidea/618-data/state-level-data-files/index.html.
• In 2018, a total of 6,315,228 students ages 6 through 21 were served under IDEA, Part B, in the 49 States for which data were available, the District of Columbia, Bureau of Indian Education schools, Puerto Rico, the four outlying areas, and the three freely associated states. Of these students, 6,217,412 were served in 49 States, the District of Columbia, and Bureau of Indian Education schools. This number represented 9.5 percent of the resident population ages 6 through 21.
• In 2009, the total number of students ages 6 through 21 served under IDEA, Part B, in the 50 States for which data were available, the District of Columbia, Bureau of Indian Education
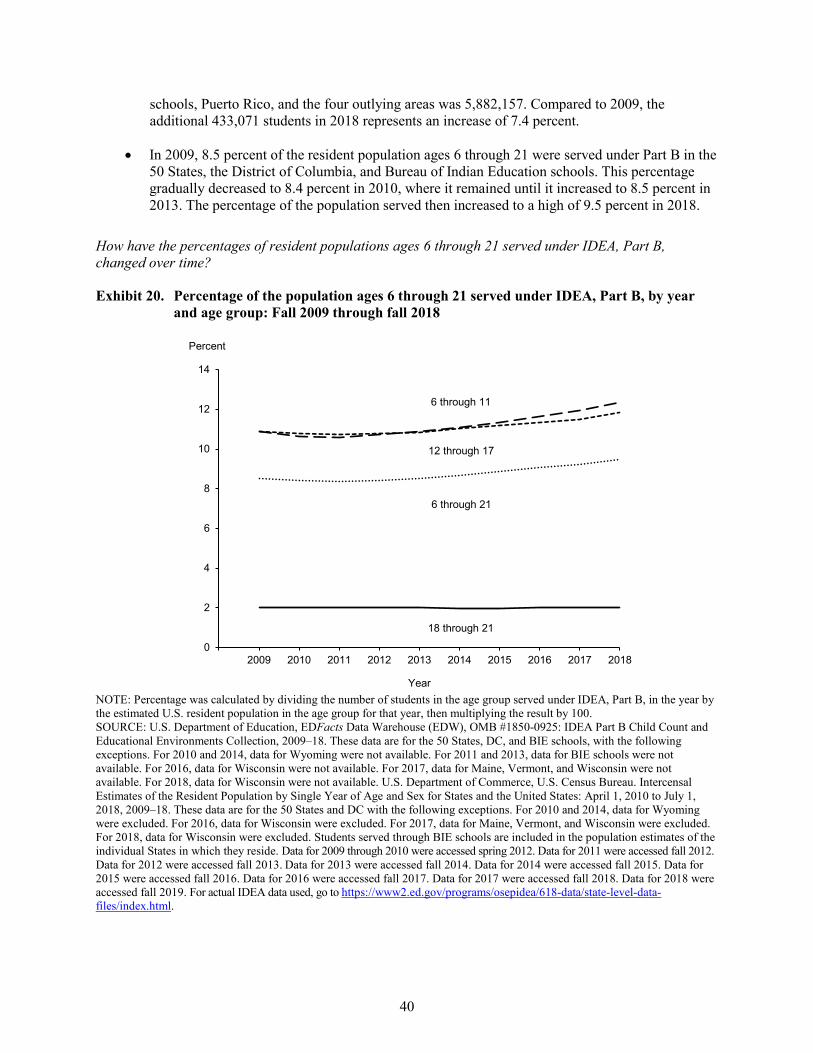
40
schools, Puerto Rico, and the four outlying areas was 5,882,157. Compared to 2009, the additional 433,071 students in 2018 represents an increase of 7.4 percent.
• In 2009, 8.5 percent of the resident population ages 6 through 21 were served under Part B in the 50 States, the District of Columbia, and Bureau of Indian Education schools. This percentage gradually decreased to 8.4 percent in 2010, where it remained until it increased to 8.5 percent in 2013. The percentage of the population served then increased to a high of 9.5 percent in 2018.
How have the percentages of resident populations ages 6 through 21 served under IDEA, Part B, changed over time?
Exhibit 20. Percentage of the population ages 6 through 21 served under IDEA, Part B, by year and age group: Fall 2009 through fall 2018
0
2
4
6
8
10
12
14
2009 2010 2011 2012 2013 2014 2015 2016 2017 2018
Percent
Year
18 through 21
6 through 21
6 through 11
12 through 17
NOTE: Percentage was calculated by dividing the number of students in the age group served under IDEA, Part B, in the year by the estimated U.S. resident population in the age group for that year, then multiplying the result by 100. SOURCE: U.S. Department of Education, EDFacts Data Warehouse (EDW), OMB #1850-0925: IDEA Part B Child Count and Educational Environments Collection, 2009–18. These data are for the 50 States, DC, and BIE schools, with the following exceptions. For 2010 and 2014, data for Wyoming were not available. For 2011 and 2013, data for BIE schools were not available. For 2016, data for Wisconsin were not available. For 2017, data for Maine, Vermont, and Wisconsin were not available. For 2018, data for Wisconsin were not available. U.S. Department of Commerce, U.S. Census Bureau. Intercensal Estimates of the Resident Population by Single Year of Age and Sex for States and the United States: April 1, 2010 to July 1, 2018, 2009–18. These data are for the 50 States and DC with the following exceptions. For 2010 and 2014, data for Wyoming were excluded. For 2016, data for Wisconsin were excluded. For 2017, data for Maine, Vermont, and Wisconsin were excluded. For 2018, data for Wisconsin were excluded. Students served through BIE schools are included in the population estimates of the individual States in which they reside. Data for 2009 through 2010 were accessed spring 2012. Data for 2011 were accessed fall 2012. Data for 2012 were accessed fall 2013. Data for 2013 were accessed fall 2014. Data for 2014 were accessed fall 2015. Data for 2015 were accessed fall 2016. Data for 2016 were accessed fall 2017. Data for 2017 were accessed fall 2018. Data for 2018 were accessed fall 2019. For actual IDEA data used, go to https://www2.ed.gov/programs/osepidea/618-data/state-level-data-files/index.html.
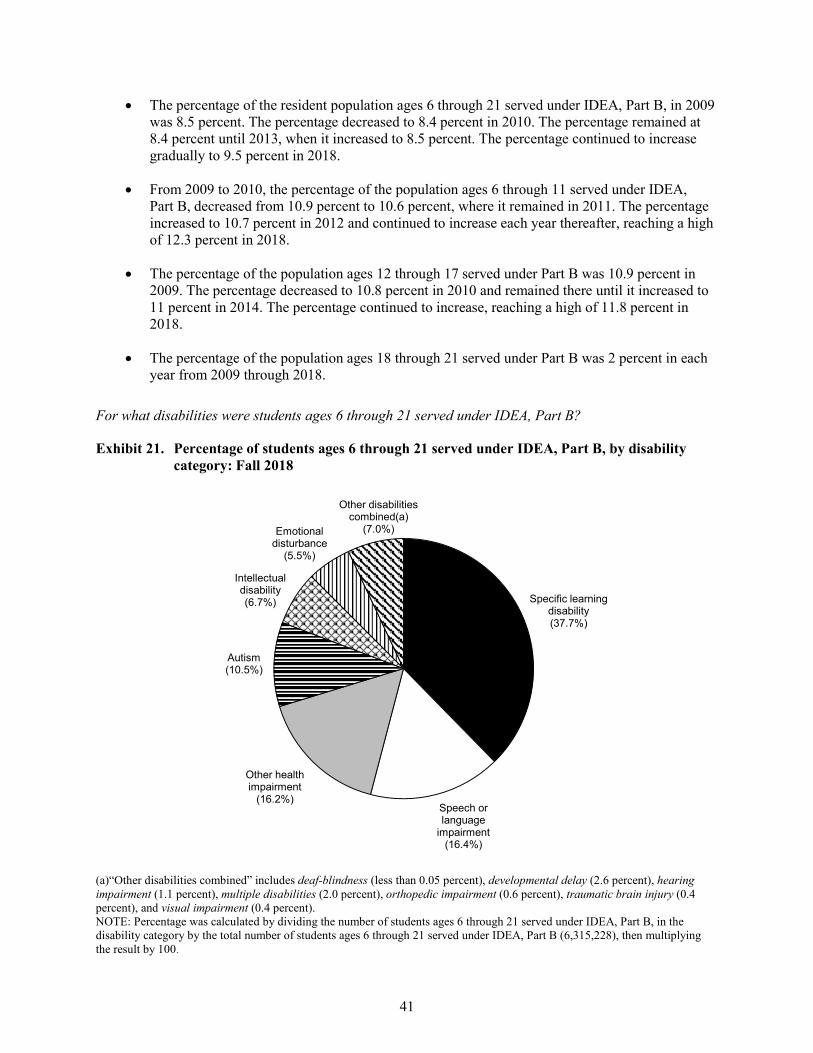
41
• The percentage of the resident population ages 6 through 21 served under IDEA, Part B, in 2009 was 8.5 percent. The percentage decreased to 8.4 percent in 2010. The percentage remained at 8.4 percent until 2013, when it increased to 8.5 percent. The percentage continued to increase gradually to 9.5 percent in 2018.
• From 2009 to 2010, the percentage of the population ages 6 through 11 served under IDEA, Part B, decreased from 10.9 percent to 10.6 percent, where it remained in 2011. The percentage increased to 10.7 percent in 2012 and continued to increase each year thereafter, reaching a high of 12.3 percent in 2018.
• The percentage of the population ages 12 through 17 served under Part B was 10.9 percent in 2009. The percentage decreased to 10.8 percent in 2010 and remained there until it increased to 11 percent in 2014. The percentage continued to increase, reaching a high of 11.8 percent in 2018.
• The percentage of the population ages 18 through 21 served under Part B was 2 percent in each year from 2009 through 2018.
For what disabilities were students ages 6 through 21 served under IDEA, Part B?
Exhibit 21. Percentage of students ages 6 through 21 served under IDEA, Part B, by disability category: Fall 2018
Specific learning disability(37.7%)
Speech or language
impairment(16.4%)
Other health impairment
(16.2%)
Autism(10.5%)
Intellectual disability(6.7%)
Emotional disturbance
(5.5%)
Other disabilities combined(a)
(7.0%)
(a)“Other disabilities combined” includes deaf-blindness (less than 0.05 percent), developmental delay (2.6 percent), hearing impairment (1.1 percent), multiple disabilities (2.0 percent), orthopedic impairment (0.6 percent), traumatic brain injury (0.4 percent), and visual impairment (0.4 percent). NOTE: Percentage was calculated by dividing the number of students ages 6 through 21 served under IDEA, Part B, in the disability category by the total number of students ages 6 through 21 served under IDEA, Part B (6,315,228), then multiplying the result by 100.
42
• In 2018, the most prevalent disability category of students ages 6 through 21 served under IDEA, Part B, was specific learning disability (specifically, 2,377,739, or 37.7 percent, of the 6,315,228 students ages 6 through 21 served under IDEA, Part B). The next most common disability category was speech or language impairment (16.4 percent), followed by other health impairment (16.2 percent), autism (10.5 percent), intellectual disability (6.7 percent), and emotional disturbance (5.5 percent).
• Students ages 6 through 21 in “Other disabilities combined” accounted for the remaining 7 percent of students ages 6 through 21 served under IDEA, Part B.
SOURCE: U.S. Department of Education, EDFacts Data Warehouse (EDW), OMB #1850-0925: IDEA Part B Child Count and Educational Environments Collection, 2018. These data are for 49 States, DC, BIE schools, PR, the four outlying areas, and the three freely associated states. Data for Wisconsin were not available. Data were accessed fall 2019. For actual IDEA data used, go to https://www2.ed.gov/programs/osepidea/618-data/state-level-data-files/index.html.
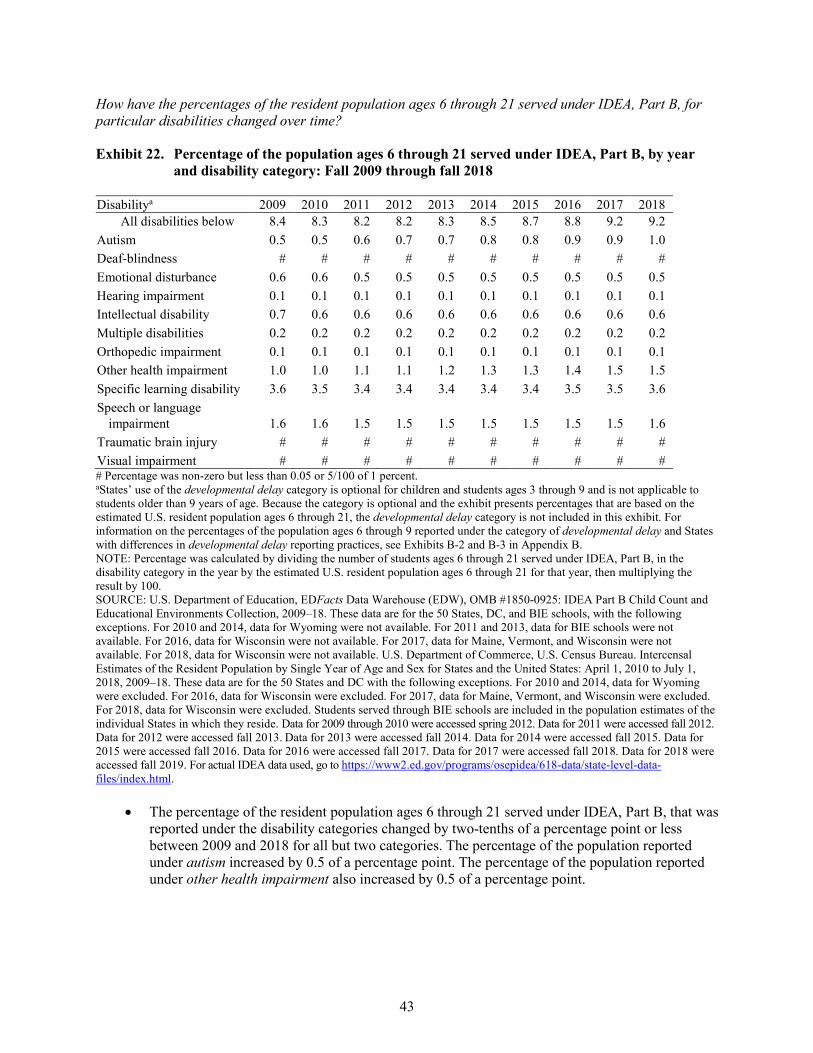
43
How have the percentages of the resident population ages 6 through 21 served under IDEA, Part B, for particular disabilities changed over time?
Exhibit 22. Percentage of the population ages 6 through 21 served under IDEA, Part B, by year and disability category: Fall 2009 through fall 2018
Disabilitya 2009 2010 2011 2012 2013 2014 2015 2016 2017 2018 All disabilities below 8.4 8.3 8.2 8.2 8.3 8.5 8.7 8.8 9.2 9.2
Autism 0.5 0.5 0.6 0.7 0.7 0.8 0.8 0.9 0.9 1.0 Deaf-blindness # # # # # # # # # # Emotional disturbance 0.6 0.6 0.5 0.5 0.5 0.5 0.5 0.5 0.5 0.5 Hearing impairment 0.1 0.1 0.1 0.1 0.1 0.1 0.1 0.1 0.1 0.1 Intellectual disability 0.7 0.6 0.6 0.6 0.6 0.6 0.6 0.6 0.6 0.6 Multiple disabilities 0.2 0.2 0.2 0.2 0.2 0.2 0.2 0.2 0.2 0.2 Orthopedic impairment 0.1 0.1 0.1 0.1 0.1 0.1 0.1 0.1 0.1 0.1 Other health impairment 1.0 1.0 1.1 1.1 1.2 1.3 1.3 1.4 1.5 1.5 Specific learning disability 3.6 3.5 3.4 3.4 3.4 3.4 3.4 3.5 3.5 3.6 Speech or language
impairment 1.6 1.6 1.5 1.5 1.5 1.5 1.5 1.5 1.5 1.6 Traumatic brain injury # # # # # # # # # # Visual impairment # # # # # # # # # # # Percentage was non-zero but less than 0.05 or 5/100 of 1 percent. aStates’ use of the developmental delay category is optional for children and students ages 3 through 9 and is not applicable to students older than 9 years of age. Because the category is optional and the exhibit presents percentages that are based on the estimated U.S. resident population ages 6 through 21, the developmental delay category is not included in this exhibit. For information on the percentages of the population ages 6 through 9 reported under the category of developmental delay and States with differences in developmental delay reporting practices, see Exhibits B-2 and B-3 in Appendix B. NOTE: Percentage was calculated by dividing the number of students ages 6 through 21 served under IDEA, Part B, in the disability category in the year by the estimated U.S. resident population ages 6 through 21 for that year, then multiplying the result by 100. SOURCE: U.S. Department of Education, EDFacts Data Warehouse (EDW), OMB #1850-0925: IDEA Part B Child Count and Educational Environments Collection, 2009–18. These data are for the 50 States, DC, and BIE schools, with the following exceptions. For 2010 and 2014, data for Wyoming were not available. For 2011 and 2013, data for BIE schools were not available. For 2016, data for Wisconsin were not available. For 2017, data for Maine, Vermont, and Wisconsin were not available. For 2018, data for Wisconsin were not available. U.S. Department of Commerce, U.S. Census Bureau. Intercensal Estimates of the Resident Population by Single Year of Age and Sex for States and the United States: April 1, 2010 to July 1, 2018, 2009–18. These data are for the 50 States and DC with the following exceptions. For 2010 and 2014, data for Wyoming were excluded. For 2016, data for Wisconsin were excluded. For 2017, data for Maine, Vermont, and Wisconsin were excluded. For 2018, data for Wisconsin were excluded. Students served through BIE schools are included in the population estimates of the individual States in which they reside. Data for 2009 through 2010 were accessed spring 2012. Data for 2011 were accessed fall 2012. Data for 2012 were accessed fall 2013. Data for 2013 were accessed fall 2014. Data for 2014 were accessed fall 2015. Data for 2015 were accessed fall 2016. Data for 2016 were accessed fall 2017. Data for 2017 were accessed fall 2018. Data for 2018 were accessed fall 2019. For actual IDEA data used, go to https://www2.ed.gov/programs/osepidea/618-data/state-level-data-files/index.html.
• The percentage of the resident population ages 6 through 21 served under IDEA, Part B, that was reported under the disability categories changed by two-tenths of a percentage point or less between 2009 and 2018 for all but two categories. The percentage of the population reported under autism increased by 0.5 of a percentage point. The percentage of the population reported under other health impairment also increased by 0.5 of a percentage point.
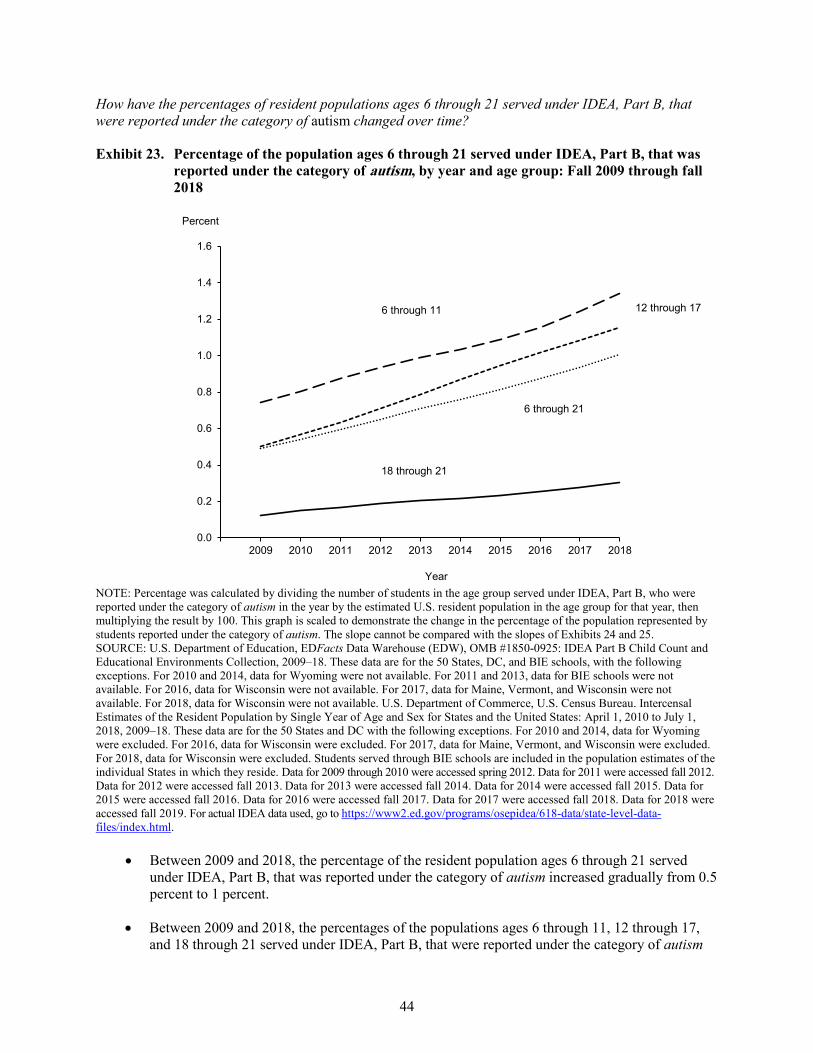
44
How have the percentages of resident populations ages 6 through 21 served under IDEA, Part B, that were reported under the category of autism changed over time?
Exhibit 23. Percentage of the population ages 6 through 21 served under IDEA, Part B, that was reported under the category of autism, by year and age group: Fall 2009 through fall 2018
0.0
0.2
0.4
0.6
0.8
1.0
1.2
1.4
1.6
2009 2010 2011 2012 2013 2014 2015 2016 2017 2018
Percent
Year
18 through 21
12 through 17
6 through 21
6 through 11
NOTE: Percentage was calculated by dividing the number of students in the age group served under IDEA, Part B, who were reported under the category of autism in the year by the estimated U.S. resident population in the age group for that year, then multiplying the result by 100. This graph is scaled to demonstrate the change in the percentage of the population represented by students reported under the category of autism. The slope cannot be compared with the slopes of Exhibits 24 and 25. SOURCE: U.S. Department of Education, EDFacts Data Warehouse (EDW), OMB #1850-0925: IDEA Part B Child Count and Educational Environments Collection, 2009–18. These data are for the 50 States, DC, and BIE schools, with the following exceptions. For 2010 and 2014, data for Wyoming were not available. For 2011 and 2013, data for BIE schools were not available. For 2016, data for Wisconsin were not available. For 2017, data for Maine, Vermont, and Wisconsin were not available. For 2018, data for Wisconsin were not available. U.S. Department of Commerce, U.S. Census Bureau. Intercensal Estimates of the Resident Population by Single Year of Age and Sex for States and the United States: April 1, 2010 to July 1, 2018, 2009–18. These data are for the 50 States and DC with the following exceptions. For 2010 and 2014, data for Wyoming were excluded. For 2016, data for Wisconsin were excluded. For 2017, data for Maine, Vermont, and Wisconsin were excluded. For 2018, data for Wisconsin were excluded. Students served through BIE schools are included in the population estimates of the individual States in which they reside. Data for 2009 through 2010 were accessed spring 2012. Data for 2011 were accessed fall 2012. Data for 2012 were accessed fall 2013. Data for 2013 were accessed fall 2014. Data for 2014 were accessed fall 2015. Data for 2015 were accessed fall 2016. Data for 2016 were accessed fall 2017. Data for 2017 were accessed fall 2018. Data for 2018 were accessed fall 2019. For actual IDEA data used, go to https://www2.ed.gov/programs/osepidea/618-data/state-level-data-files/index.html.
• Between 2009 and 2018, the percentage of the resident population ages 6 through 21 served under IDEA, Part B, that was reported under the category of autism increased gradually from 0.5 percent to 1 percent.
• Between 2009 and 2018, the percentages of the populations ages 6 through 11, 12 through 17, and 18 through 21 served under IDEA, Part B, that were reported under the category of autism
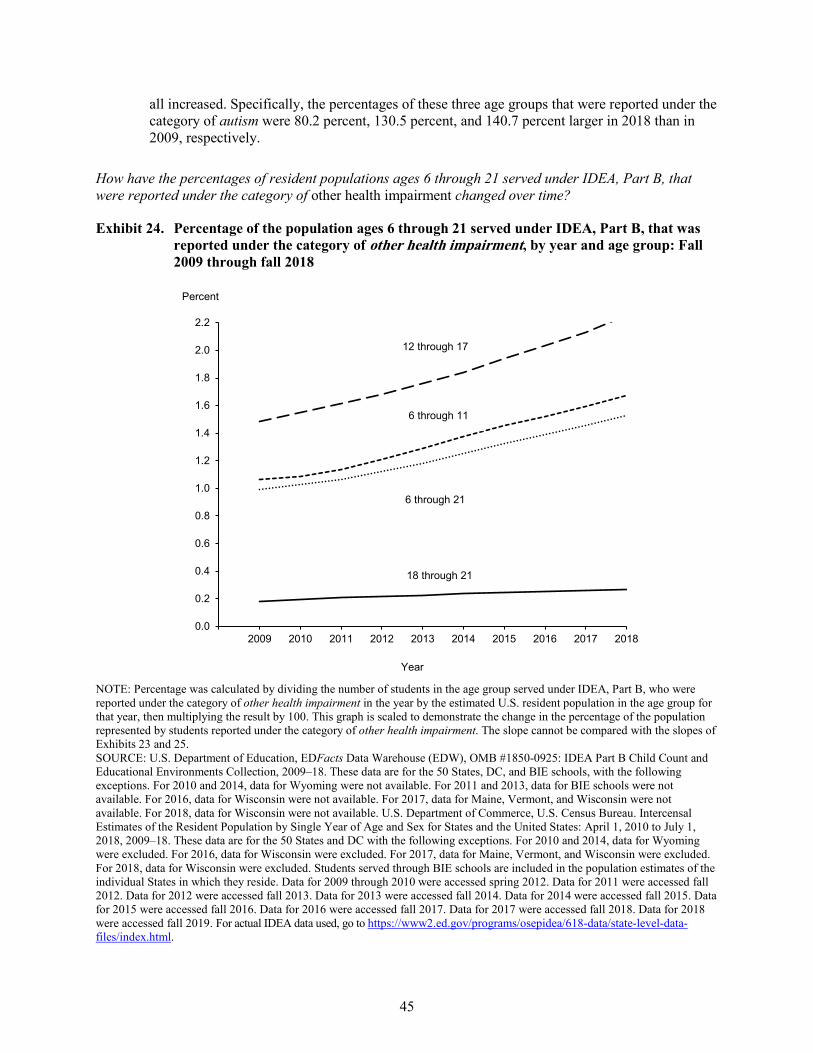
45
all increased. Specifically, the percentages of these three age groups that were reported under the category of autism were 80.2 percent, 130.5 percent, and 140.7 percent larger in 2018 than in 2009, respectively.
How have the percentages of resident populations ages 6 through 21 served under IDEA, Part B, that were reported under the category of other health impairment changed over time?
Exhibit 24. Percentage of the population ages 6 through 21 served under IDEA, Part B, that was reported under the category of other health impairment, by year and age group: Fall 2009 through fall 2018
0.0
0.2
0.4
0.6
0.8
1.0
1.2
1.4
1.6
1.8
2.0
2.2
2009 2010 2011 2012 2013 2014 2015 2016 2017 2018
Percent
Year
18 through 21
6 through 21
6 through 11
12 through 17
NOTE: Percentage was calculated by dividing the number of students in the age group served under IDEA, Part B, who were reported under the category of other health impairment in the year by the estimated U.S. resident population in the age group for that year, then multiplying the result by 100. This graph is scaled to demonstrate the change in the percentage of the population represented by students reported under the category of other health impairment. The slope cannot be compared with the slopes of Exhibits 23 and 25. SOURCE: U.S. Department of Education, EDFacts Data Warehouse (EDW), OMB #1850-0925: IDEA Part B Child Count and Educational Environments Collection, 2009–18. These data are for the 50 States, DC, and BIE schools, with the following exceptions. For 2010 and 2014, data for Wyoming were not available. For 2011 and 2013, data for BIE schools were not available. For 2016, data for Wisconsin were not available. For 2017, data for Maine, Vermont, and Wisconsin were not available. For 2018, data for Wisconsin were not available. U.S. Department of Commerce, U.S. Census Bureau. Intercensal Estimates of the Resident Population by Single Year of Age and Sex for States and the United States: April 1, 2010 to July 1, 2018, 2009–18. These data are for the 50 States and DC with the following exceptions. For 2010 and 2014, data for Wyoming were excluded. For 2016, data for Wisconsin were excluded. For 2017, data for Maine, Vermont, and Wisconsin were excluded. For 2018, data for Wisconsin were excluded. Students served through BIE schools are included in the population estimates of the individual States in which they reside. Data for 2009 through 2010 were accessed spring 2012. Data for 2011 were accessed fall 2012. Data for 2012 were accessed fall 2013. Data for 2013 were accessed fall 2014. Data for 2014 were accessed fall 2015. Data for 2015 were accessed fall 2016. Data for 2016 were accessed fall 2017. Data for 2017 were accessed fall 2018. Data for 2018 were accessed fall 2019. For actual IDEA data used, go to https://www2.ed.gov/programs/osepidea/618-data/state-level-data-files/index.html.
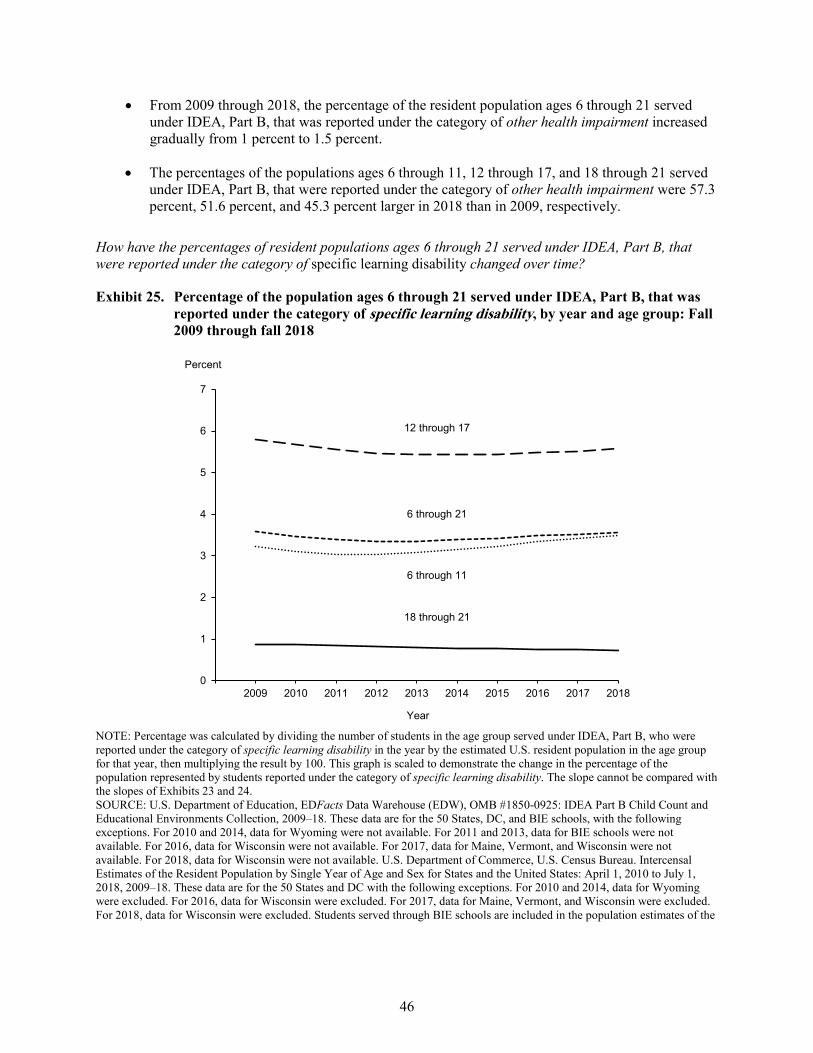
46
• From 2009 through 2018, the percentage of the resident population ages 6 through 21 served under IDEA, Part B, that was reported under the category of other health impairment increased gradually from 1 percent to 1.5 percent.
• The percentages of the populations ages 6 through 11, 12 through 17, and 18 through 21 served under IDEA, Part B, that were reported under the category of other health impairment were 57.3 percent, 51.6 percent, and 45.3 percent larger in 2018 than in 2009, respectively.
How have the percentages of resident populations ages 6 through 21 served under IDEA, Part B, that were reported under the category of specific learning disability changed over time?
Exhibit 25. Percentage of the population ages 6 through 21 served under IDEA, Part B, that was reported under the category of specific learning disability, by year and age group: Fall 2009 through fall 2018
0
1
2
3
4
5
6
7
2009 2010 2011 2012 2013 2014 2015 2016 2017 2018
Percent
Year
18 through 21
6 through 11
6 through 21
12 through 17
NOTE: Percentage was calculated by dividing the number of students in the age group served under IDEA, Part B, who were reported under the category of specific learning disability in the year by the estimated U.S. resident population in the age group for that year, then multiplying the result by 100. This graph is scaled to demonstrate the change in the percentage of the population represented by students reported under the category of specific learning disability. The slope cannot be compared with the slopes of Exhibits 23 and 24. SOURCE: U.S. Department of Education, EDFacts Data Warehouse (EDW), OMB #1850-0925: IDEA Part B Child Count and Educational Environments Collection, 2009–18. These data are for the 50 States, DC, and BIE schools, with the following exceptions. For 2010 and 2014, data for Wyoming were not available. For 2011 and 2013, data for BIE schools were not available. For 2016, data for Wisconsin were not available. For 2017, data for Maine, Vermont, and Wisconsin were not available. For 2018, data for Wisconsin were not available. U.S. Department of Commerce, U.S. Census Bureau. Intercensal Estimates of the Resident Population by Single Year of Age and Sex for States and the United States: April 1, 2010 to July 1, 2018, 2009–18. These data are for the 50 States and DC with the following exceptions. For 2010 and 2014, data for Wyoming were excluded. For 2016, data for Wisconsin were excluded. For 2017, data for Maine, Vermont, and Wisconsin were excluded. For 2018, data for Wisconsin were excluded. Students served through BIE schools are included in the population estimates of the
47
• From 2009 through 2011, the percentage of the resident population ages 6 through 21 served under IDEA, Part B, that was reported under the category of specific learning disability decreased from 3.6 percent to 3.4 percent, where it remained until 2016, when the percentage increased to 3.5 percent. The percentage remained at 3.5 percent in 2017, then increased to 3.6 percent in 2018.
• The percentage of the population ages 6 through 11 served under IDEA, Part B, that was reported under the category of specific learning disability was 8.1 percent larger in 2018 than in 2009. However, the percentages of the populations ages 12 through 17 and 18 through 21 served under IDEA, Part B, that were reported under this category were 3.9 percent and 17.7 percent smaller in 2018 than in 2009, respectively.
individual States in which they reside. Data for 2009 through 2010 were accessed spring 2012. Data for 2011 were accessed fall 2012. Data for 2012 were accessed fall 2013. Data for 2013 were accessed fall 2014. Data for 2014 were accessed fall 2015. Data for 2015 were accessed fall 2016. Data for 2016 were accessed fall 2017. Data for 2017 were accessed fall 2018. Data for 2018 were accessed fall 2019. For actual IDEA data used, go to https://www2.ed.gov/programs/osepidea/618-data/state-level-data-files/index.html.
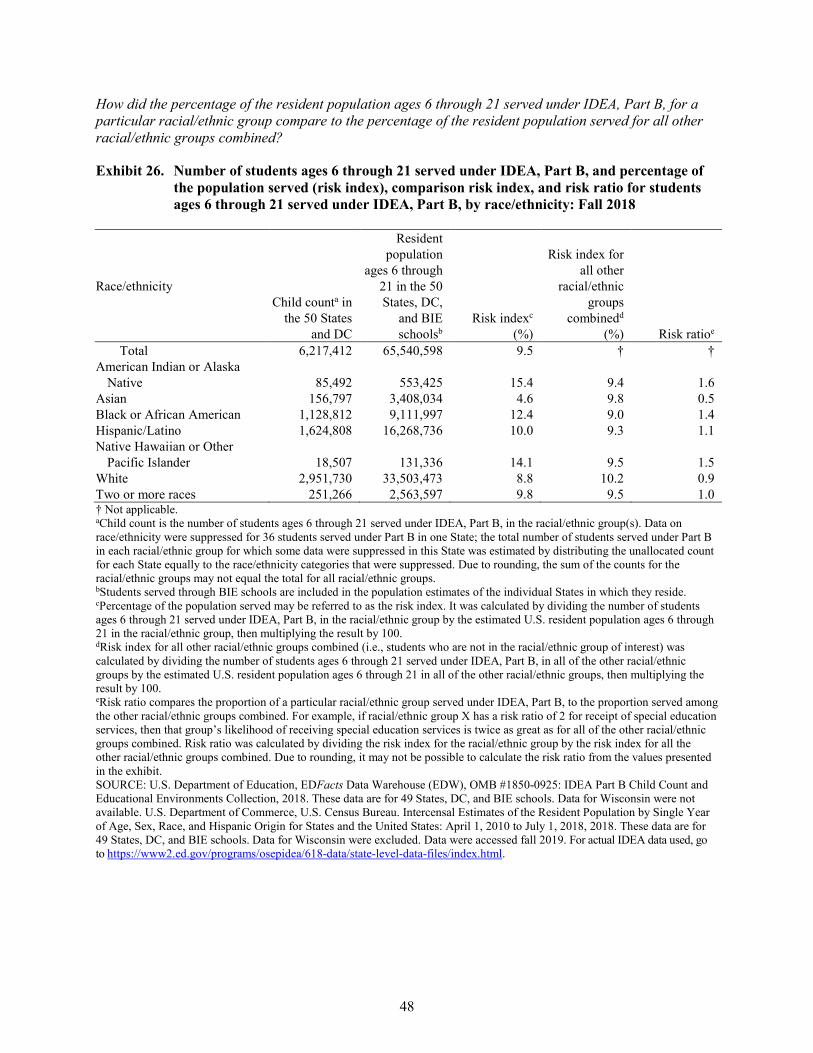
48
How did the percentage of the resident population ages 6 through 21 served under IDEA, Part B, for a particular racial/ethnic group compare to the percentage of the resident population served for all other racial/ethnic groups combined?
Exhibit 26. Number of students ages 6 through 21 served under IDEA, Part B, and percentage of the population served (risk index), comparison risk index, and risk ratio for students ages 6 through 21 served under IDEA, Part B, by race/ethnicity: Fall 2018
Race/ethnicity Child counta in
the 50 States and DC
Resident population
ages 6 through 21 in the 50 States, DC,
and BIE schoolsb
Risk indexc
(%)
Risk index for all other
racial/ethnic groups
combinedd
(%) Risk ratioe Total 6,217,412 65,540,598 9.5 † †
American Indian or Alaska Native 85,492 553,425 15.4 9.4 1.6
Asian 156,797 3,408,034 4.6 9.8 0.5 Black or African American 1,128,812 9,111,997 12.4 9.0 1.4 Hispanic/Latino 1,624,808 16,268,736 10.0 9.3 1.1 Native Hawaiian or Other
Pacific Islander 18,507 131,336 14.1 9.5 1.5 White 2,951,730 33,503,473 8.8 10.2 0.9 Two or more races 251,266 2,563,597 9.8 9.5 1.0 † Not applicable. aChild count is the number of students ages 6 through 21 served under IDEA, Part B, in the racial/ethnic group(s). Data on race/ethnicity were suppressed for 36 students served under Part B in one State; the total number of students served under Part B in each racial/ethnic group for which some data were suppressed in this State was estimated by distributing the unallocated count for each State equally to the race/ethnicity categories that were suppressed. Due to rounding, the sum of the counts for the racial/ethnic groups may not equal the total for all racial/ethnic groups. bStudents served through BIE schools are included in the population estimates of the individual States in which they reside. cPercentage of the population served may be referred to as the risk index. It was calculated by dividing the number of students ages 6 through 21 served under IDEA, Part B, in the racial/ethnic group by the estimated U.S. resident population ages 6 through 21 in the racial/ethnic group, then multiplying the result by 100. dRisk index for all other racial/ethnic groups combined (i.e., students who are not in the racial/ethnic group of interest) was calculated by dividing the number of students ages 6 through 21 served under IDEA, Part B, in all of the other racial/ethnic groups by the estimated U.S. resident population ages 6 through 21 in all of the other racial/ethnic groups, then multiplying the result by 100. eRisk ratio compares the proportion of a particular racial/ethnic group served under IDEA, Part B, to the proportion served among the other racial/ethnic groups combined. For example, if racial/ethnic group X has a risk ratio of 2 for receipt of special education services, then that group’s likelihood of receiving special education services is twice as great as for all of the other racial/ethnic groups combined. Risk ratio was calculated by dividing the risk index for the racial/ethnic group by the risk index for all the other racial/ethnic groups combined. Due to rounding, it may not be possible to calculate the risk ratio from the values presented in the exhibit. SOURCE: U.S. Department of Education, EDFacts Data Warehouse (EDW), OMB #1850-0925: IDEA Part B Child Count and Educational Environments Collection, 2018. These data are for 49 States, DC, and BIE schools. Data for Wisconsin were not available. U.S. Department of Commerce, U.S. Census Bureau. Intercensal Estimates of the Resident Population by Single Year of Age, Sex, Race, and Hispanic Origin for States and the United States: April 1, 2010 to July 1, 2018, 2018. These data are for 49 States, DC, and BIE schools. Data for Wisconsin were excluded. Data were accessed fall 2019. For actual IDEA data used, go to https://www2.ed.gov/programs/osepidea/618-data/state-level-data-files/index.html.
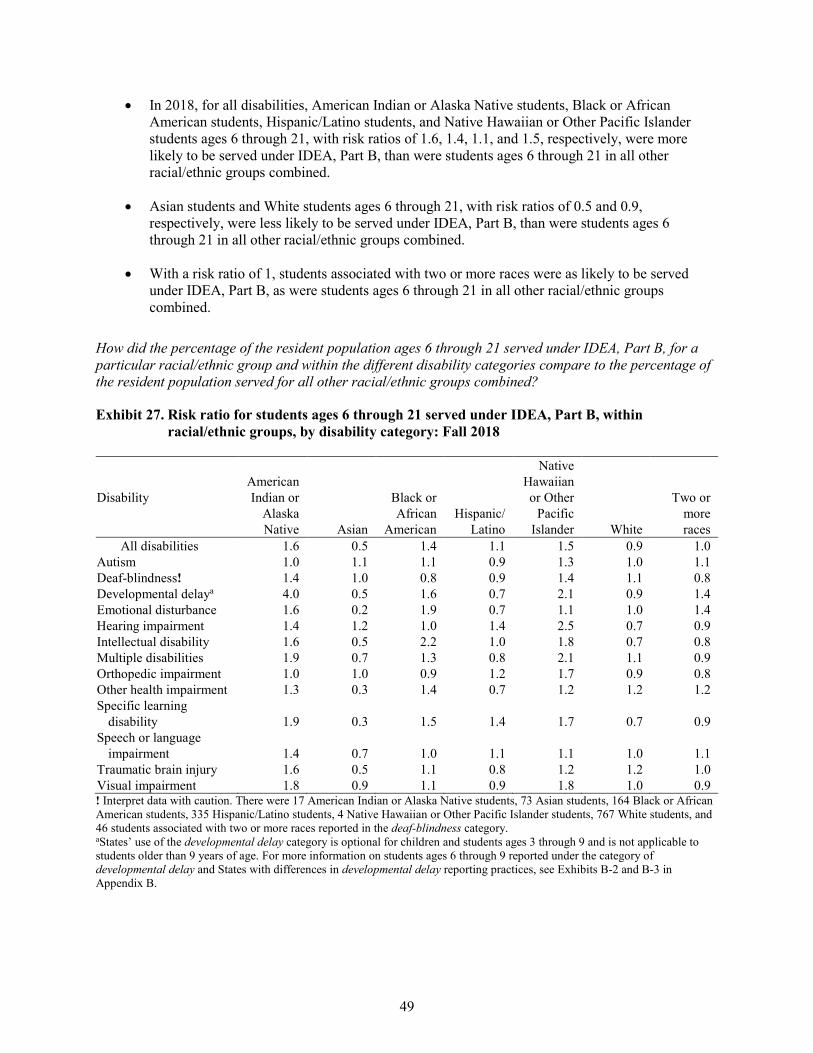
49
• In 2018, for all disabilities, American Indian or Alaska Native students, Black or African American students, Hispanic/Latino students, and Native Hawaiian or Other Pacific Islander students ages 6 through 21, with risk ratios of 1.6, 1.4, 1.1, and 1.5, respectively, were more likely to be served under IDEA, Part B, than were students ages 6 through 21 in all other racial/ethnic groups combined.
• Asian students and White students ages 6 through 21, with risk ratios of 0.5 and 0.9, respectively, were less likely to be served under IDEA, Part B, than were students ages 6 through 21 in all other racial/ethnic groups combined.
• With a risk ratio of 1, students associated with two or more races were as likely to be served under IDEA, Part B, as were students ages 6 through 21 in all other racial/ethnic groups combined.
How did the percentage of the resident population ages 6 through 21 served under IDEA, Part B, for a particular racial/ethnic group and within the different disability categories compare to the percentage of the resident population served for all other racial/ethnic groups combined?
Exhibit 27. Risk ratio for students ages 6 through 21 served under IDEA, Part B, within racial/ethnic groups, by disability category: Fall 2018
Disability American Indian or
Alaska Native Asian
Black or African
American Hispanic/
Latino
Native Hawaiian or Other
Pacific Islander White
Two or more races
All disabilities 1.6 0.5 1.4 1.1 1.5 0.9 1.0 Autism 1.0 1.1 1.1 0.9 1.3 1.0 1.1 Deaf-blindness! 1.4 1.0 0.8 0.9 1.4 1.1 0.8 Developmental delaya 4.0 0.5 1.6 0.7 2.1 0.9 1.4 Emotional disturbance 1.6 0.2 1.9 0.7 1.1 1.0 1.4 Hearing impairment 1.4 1.2 1.0 1.4 2.5 0.7 0.9 Intellectual disability 1.6 0.5 2.2 1.0 1.8 0.7 0.8 Multiple disabilities 1.9 0.7 1.3 0.8 2.1 1.1 0.9 Orthopedic impairment 1.0 1.0 0.9 1.2 1.7 0.9 0.8 Other health impairment 1.3 0.3 1.4 0.7 1.2 1.2 1.2 Specific learning
disability 1.9 0.3 1.5 1.4 1.7 0.7 0.9 Speech or language
impairment 1.4 0.7 1.0 1.1 1.1 1.0 1.1 Traumatic brain injury 1.6 0.5 1.1 0.8 1.2 1.2 1.0 Visual impairment 1.8 0.9 1.1 0.9 1.8 1.0 0.9 ! Interpret data with caution. There were 17 American Indian or Alaska Native students, 73 Asian students, 164 Black or African American students, 335 Hispanic/Latino students, 4 Native Hawaiian or Other Pacific Islander students, 767 White students, and 46 students associated with two or more races reported in the deaf-blindness category. aStates’ use of the developmental delay category is optional for children and students ages 3 through 9 and is not applicable to students older than 9 years of age. For more information on students ages 6 through 9 reported under the category of developmental delay and States with differences in developmental delay reporting practices, see Exhibits B-2 and B-3 in Appendix B.
50
• With a risk ratio of 4, American Indian or Alaska Native students ages 6 through 21 were four times as likely to be served under IDEA, Part B, for developmental delay than were students ages 6 through 21 in all other racial/ethnic groups combined. The risk ratio for American Indian or Alaska Native students ages 6 through 21 was equal to 1 for autism and orthopedic impairment and higher than 1 for each of the other disability categories.
• Asian students ages 6 through 21 were 1.1 times as likely to be served under IDEA, Part B, for the disability category of autism and 1.2 times as likely to be served under IDEA, Part B, for the disability category of hearing impairment than were students ages 6 through 21 in all other racial/ethnic groups combined. The risk ratio for Asian students ages 6 through 21 was equal to 1 for deaf-blindness and orthopedic impairment and less than 1 for each of the other disability categories.
• With a risk ratio higher than 1, Black or African American students ages 6 through 21 were more likely to be served under IDEA, Part B, than were students ages 6 through 21 in all other racial/ethnic groups combined for the following disability categories: autism (1.1), developmental delay (1.6), emotional disturbance (1.9), intellectual disability (2.2), multiple disabilities (1.3), other health impairment (1.4), specific learning disability (1.5), traumatic brain injury (1.1), and visual impairment (1.1). The risk ratio for Black or African American students ages 6 through 21 was less than 1 for deaf-blindness (0.8) and orthopedic impairment (0.9) and equal to 1 for hearing impairment and speech or language impairment.
• With a risk ratio higher than 1, Hispanic/Latino students ages 6 through 21 were more likely to be served under IDEA, Part B, than were students ages 6 through 21 in all other racial/ethnic groups combined for the following disability categories: hearing impairment (1.4), orthopedic impairment (1.2), specific learning disability (1.4), and speech or language impairment (1.1). The risk ratio for Hispanic/Latino students ages 6 through 21 was equal to 1 for intellectual disability and less than 1 for all other disability categories.
• Native Hawaiian or Other Pacific Islander students ages 6 through 21 were at least two times as likely to be served under IDEA, Part B, for developmental delay (2.1), hearing impairment (2.5), and multiple disabilities (2.1) than were students ages 6 through 21 in all other racial/ethnic groups combined. The risk ratio for Native Hawaiian or Other Pacific Islander students ages 6 through 21 was higher than 1 for every other disability category as well, compared to all other racial/ethnic groups combined.
NOTE: Risk ratio compares the proportion of a particular racial/ethnic group served under IDEA, Part B, to the proportion served among the other racial/ethnic groups combined. For example, if racial/ethnic group X has a risk ratio of 2 for receipt of special education services, then that group’s likelihood of receiving special education services is twice as great as for all of the other racial/ethnic groups combined. Risk ratio was calculated by dividing the risk index for the racial/ethnic group by the risk index for all the other racial/ethnic groups combined. SOURCE: U.S. Department of Education, EDFacts Data Warehouse (EDW), OMB #1850-0925: IDEA Part B Child Count and Educational Environments Collection, 2018. These data are for 49 States, DC, and BIE schools. Data for Wisconsin were not available. U.S. Department of Commerce, U.S. Census Bureau. Intercensal Estimates of the Resident Population by Single Year of Age, Sex, Race, and Hispanic Origin for States and the United States: April 1, 2010 to July 1, 2018, 2018. These data are for 49 States, DC, and BIE schools. Data for Wisconsin were excluded. Data were accessed fall 2019. For actual IDEA data used, go to https://www2.ed.gov/programs/osepidea/618-data/state-level-data-files/index.html.
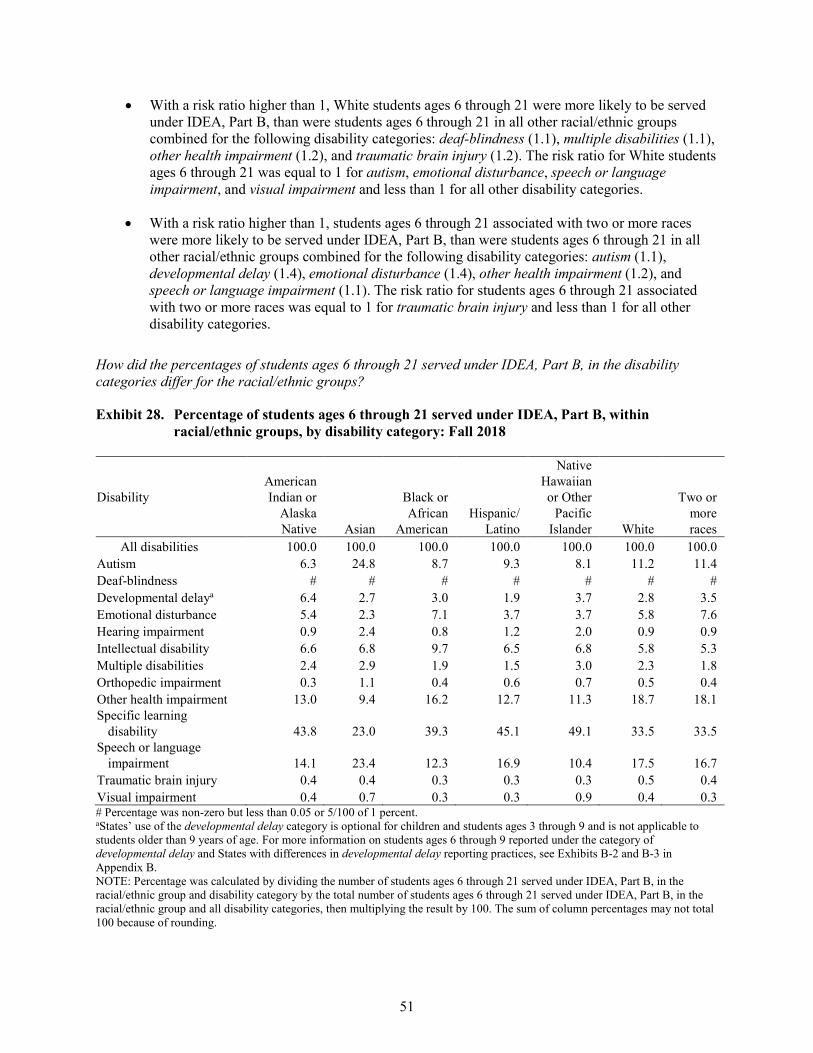
51
• With a risk ratio higher than 1, White students ages 6 through 21 were more likely to be served under IDEA, Part B, than were students ages 6 through 21 in all other racial/ethnic groups combined for the following disability categories: deaf-blindness (1.1), multiple disabilities (1.1), other health impairment (1.2), and traumatic brain injury (1.2). The risk ratio for White students ages 6 through 21 was equal to 1 for autism, emotional disturbance, speech or language impairment, and visual impairment and less than 1 for all other disability categories.
• With a risk ratio higher than 1, students ages 6 through 21 associated with two or more races were more likely to be served under IDEA, Part B, than were students ages 6 through 21 in all other racial/ethnic groups combined for the following disability categories: autism (1.1), developmental delay (1.4), emotional disturbance (1.4), other health impairment (1.2), and speech or language impairment (1.1). The risk ratio for students ages 6 through 21 associated with two or more races was equal to 1 for traumatic brain injury and less than 1 for all other disability categories.
How did the percentages of students ages 6 through 21 served under IDEA, Part B, in the disability categories differ for the racial/ethnic groups?
Exhibit 28. Percentage of students ages 6 through 21 served under IDEA, Part B, within racial/ethnic groups, by disability category: Fall 2018
Disability American Indian or
Alaska Native Asian
Black or African
American Hispanic/
Latino
Native Hawaiian or Other
Pacific Islander White
Two or more races
All disabilities 100.0 100.0 100.0 100.0 100.0 100.0 100.0 Autism 6.3 24.8 8.7 9.3 8.1 11.2 11.4 Deaf-blindness # # # # # # # Developmental delaya 6.4 2.7 3.0 1.9 3.7 2.8 3.5 Emotional disturbance 5.4 2.3 7.1 3.7 3.7 5.8 7.6 Hearing impairment 0.9 2.4 0.8 1.2 2.0 0.9 0.9 Intellectual disability 6.6 6.8 9.7 6.5 6.8 5.8 5.3 Multiple disabilities 2.4 2.9 1.9 1.5 3.0 2.3 1.8 Orthopedic impairment 0.3 1.1 0.4 0.6 0.7 0.5 0.4 Other health impairment 13.0 9.4 16.2 12.7 11.3 18.7 18.1 Specific learning
disability 43.8 23.0 39.3 45.1 49.1 33.5 33.5 Speech or language
impairment 14.1 23.4 12.3 16.9 10.4 17.5 16.7 Traumatic brain injury 0.4 0.4 0.3 0.3 0.3 0.5 0.4 Visual impairment 0.4 0.7 0.3 0.3 0.9 0.4 0.3 # Percentage was non-zero but less than 0.05 or 5/100 of 1 percent. aStates’ use of the developmental delay category is optional for children and students ages 3 through 9 and is not applicable to students older than 9 years of age. For more information on students ages 6 through 9 reported under the category of developmental delay and States with differences in developmental delay reporting practices, see Exhibits B-2 and B-3 in Appendix B. NOTE: Percentage was calculated by dividing the number of students ages 6 through 21 served under IDEA, Part B, in the racial/ethnic group and disability category by the total number of students ages 6 through 21 served under IDEA, Part B, in the racial/ethnic group and all disability categories, then multiplying the result by 100. The sum of column percentages may not total 100 because of rounding.
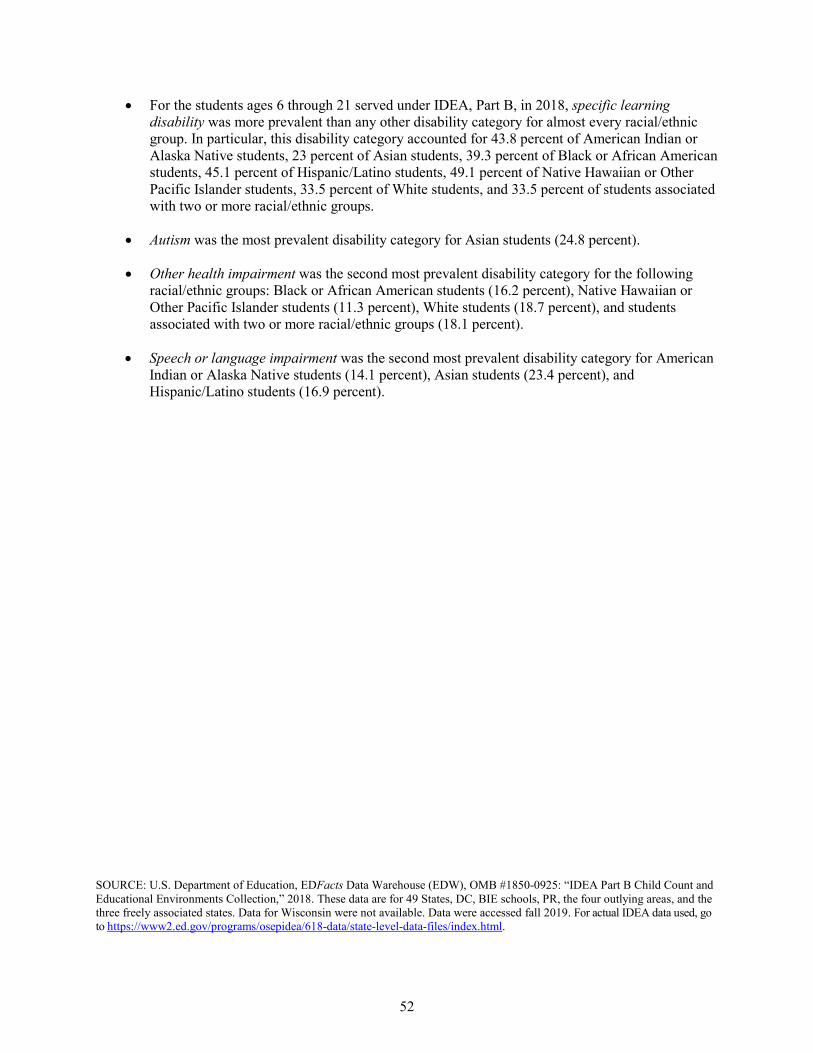
52
• For the students ages 6 through 21 served under IDEA, Part B, in 2018, specific learning disability was more prevalent than any other disability category for almost every racial/ethnic group. In particular, this disability category accounted for 43.8 percent of American Indian or Alaska Native students, 23 percent of Asian students, 39.3 percent of Black or African American students, 45.1 percent of Hispanic/Latino students, 49.1 percent of Native Hawaiian or Other Pacific Islander students, 33.5 percent of White students, and 33.5 percent of students associated with two or more racial/ethnic groups.
• Autism was the most prevalent disability category for Asian students (24.8 percent).
• Other health impairment was the second most prevalent disability category for the following racial/ethnic groups: Black or African American students (16.2 percent), Native Hawaiian or Other Pacific Islander students (11.3 percent), White students (18.7 percent), and students associated with two or more racial/ethnic groups (18.1 percent).
• Speech or language impairment was the second most prevalent disability category for American Indian or Alaska Native students (14.1 percent), Asian students (23.4 percent), and Hispanic/Latino students (16.9 percent).
SOURCE: U.S. Department of Education, EDFacts Data Warehouse (EDW), OMB #1850-0925: “IDEA Part B Child Count and Educational Environments Collection,” 2018. These data are for 49 States, DC, BIE schools, PR, the four outlying areas, and the three freely associated states. Data for Wisconsin were not available. Data were accessed fall 2019. For actual IDEA data used, go to https://www2.ed.gov/programs/osepidea/618-data/state-level-data-files/index.html.

53
Educational Environments for Students Ages 6 Through 21 Served Under IDEA, Part B
To what extent were students served under IDEA, Part B, educated with their peers without disabilities?
Exhibit 29. Percentage of students ages 6 through 21 served under IDEA, Part B, by educational environment: Fall 2018
Inside the regular class(a) 80% or
more of the day(b)(64.0%)
Inside the regular class(a) 40%
through 79% of the day(17.9%)
Inside the regular class(a) less than 40% of the day
(13.1%)
Other environments(c)
(5.0%)
(a)Percentage of day spent inside the regular class is defined as the number of hours the student spends each day inside the regular classroom, divided by the total number of hours in the school day (including lunch, recess, and study periods), multiplied by 100. (b)Students who received special education and related services outside the regular classroom for less than 21 percent of the school day were classified in the inside the regular class 80% or more of the day category. (c)“Other environments” consists of separate school (2.7 percent), residential facility (0.2 percent), homebound/hospital (0.4 percent), correctional facilities (0.2 percent), and parentally placed in private schools (1.5 percent). NOTE: Percentage was calculated by dividing the number of students ages 6 through 21 served under IDEA, Part B, in the educational environment by the total number of students ages 6 through 21 served under IDEA, Part B, in all educational environments (6,315,228), then multiplying the result by 100. Due to rounding, it may not be possible to reproduce the value presented in the exhibit from the sum of the percentages associated with the individual categories. SOURCE: U.S. Department of Education, EDFacts Data Warehouse (EDW), OMB #1850-0925: IDEA Part B Child Count and Educational Environments Collection, 2018. These data are for 49 States, DC, BIE schools, PR, the four outlying areas, and the three freely associated states. Data for Wisconsin were not available. Data were accessed fall 2019. For actual IDEA data used, go to https://www2.ed.gov/programs/osepidea/618-data/state-level-data-files/index.html.
• In 2018, a total of 6,001,138, or 95 percent, of the 6,315,228 students ages 6 through 21 served under IDEA, Part B, were educated in regular classrooms for at least some portion of the school day.
• The majority (64.0 percent) of students ages 6 through 21 served under IDEA, Part B, were educated inside the regular class 80% or more of the day.
54
• Also, 17.9 percent of students ages 6 through 21 served under IDEA, Part B, were educated inside the regular class 40% through 79% of the day, and 13.1 percent were educated inside the regular class less than 40% of the day.
• Additionally, 5 percent of students ages 6 through 21 served under IDEA, Part B, were educated outside of the regular classroom in “Other environments.”
How have the educational environments of students served under IDEA, Part B, changed over time?
Exhibit 30. Percentage of students ages 6 through 21 served under IDEA, Part B, by year and educational environment: Fall 2009 through fall 2018
0
10
20
30
40
50
60
70
2009 2010 2011 2012 2013 2014 2015 2016 2017 2018
Percent
Year
Inside the regular classa less than 40% of the day
Inside the regular classa 40% through 79% of the day
Inside the regular classa 80% or more of the dayb
Other environmentsc
aPercentage of day spent inside the regular class is defined as the number of hours the student spends each day inside the regular classroom, divided by the total number of hours in the school day (including lunch, recess, and study periods), multiplied by 100. bStudents who received special education and related services outside the regular classroom for less than 21 percent of the school day were classified in the inside the regular class 80% or more of the day category. c“Other environments” is calculated by subtracting the sum of students in the three categories concerning regular class from the total number of students reported in all categories. The categories that are not related to regular class consist of separate school, residential facility, homebound/hospital, correctional facilities, and parentally placed in private schools. NOTE: Percentage was calculated by dividing the number of students ages 6 through 21 served under IDEA, Part B, in the educational environment in the year by the total number of students ages 6 through 21 served under IDEA, Part B, in all educational environments for that year, then multiplying the result by 100. SOURCE: U.S. Department of Education, EDFacts Data Warehouse (EDW), OMB #1850-0925: IDEA Part B Child Count and Educational Environments Collection, 2009–18. These data are for the 50 States, DC, BIE schools, PR, the four outlying areas, and the three freely associated states, with the following exceptions. For 2010, data for Wyoming and the three freely associated states were not available. For 2011, data for BIE schools and the three freely associated states were not available. For 2013, data for BIE schools, American Samoa, and the Federated States of Micronesia were not available. For 2014, data for Wyoming and American Samoa were not available. For 2016, data for Wisconsin were not available. For 2017, data for Maine, Vermont, and
55
• From 2009 through 2018, the percentage of students ages 6 through 21 served under IDEA, Part B, who were educated inside the regular class 80% or more of the day increased from 59.4 percent to 64 percent.
• The percentage of students ages 6 through 21 served under IDEA, Part B, who were educated inside the regular class 40% through 79% of the day decreased from 20.7 percent in 2009 to 18.6 percent in 2014. The percentage increased to 18.7 percent in 2015 and then decreased to 17.9 percent in 2018.
• The percentage of students ages 6 through 21 served under IDEA, Part B, who were educated inside the regular class less than 40% of the day decreased from 14.6 percent in 2009 to 13.1 percent in 2018.
• The percentage of students ages 6 through 21 served under IDEA, Part B, who were educated in “Other environments” fluctuated between 5.1 and 5.3 percent from 2009 through 2012. The percentage dipped to 5 percent in 2013 and then climbed to 5.3 percent in 2014. The percentage dropped to 5.2 percent in 2015, 5.1 percent in 2016 and 2017, and 5 percent in 2018.
Wisconsin were not available. For 2018, data for Wisconsin were not available. Data for 2009 through 2010 were accessed spring 2012. Data for 2011 were accessed fall 2012. Data for 2012 were accessed fall 2013. Data for 2013 were accessed fall 2014. Data for 2014 were accessed fall 2015. Data for 2015 were accessed fall 2016. Data for 2016 were accessed fall 2017. Data for 2017 were accessed fall 2018. Data for 2018 were accessed fall 2019. For actual IDEA data used, go to https://www2.ed.gov/programs/osepidea/618-data/state-level-data-files/index.html.
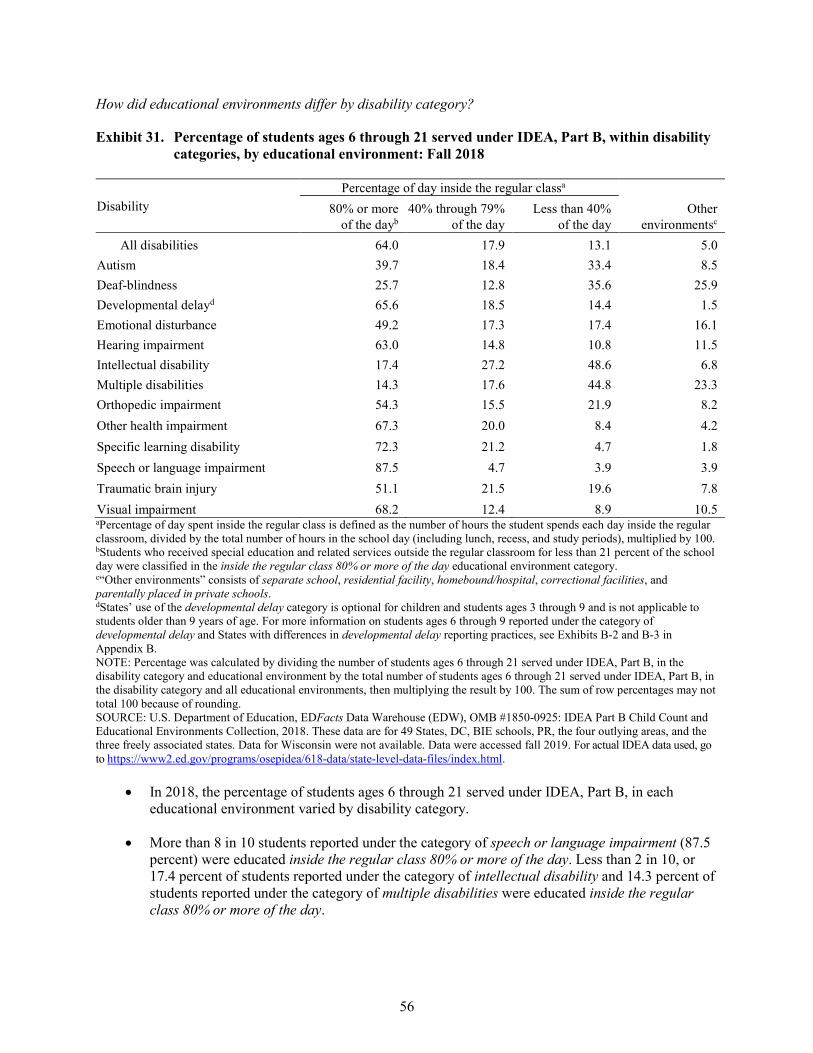
56
How did educational environments differ by disability category?
Exhibit 31. Percentage of students ages 6 through 21 served under IDEA, Part B, within disability categories, by educational environment: Fall 2018
Disability Percentage of day inside the regular classa
80% or more of the dayb
40% through 79% of the day
Less than 40% of the day
Other environmentsc
All disabilities 64.0 17.9 13.1 5.0 Autism 39.7 18.4 33.4 8.5 Deaf-blindness 25.7 12.8 35.6 25.9 Developmental delayd 65.6 18.5 14.4 1.5 Emotional disturbance 49.2 17.3 17.4 16.1 Hearing impairment 63.0 14.8 10.8 11.5 Intellectual disability 17.4 27.2 48.6 6.8 Multiple disabilities 14.3 17.6 44.8 23.3 Orthopedic impairment 54.3 15.5 21.9 8.2 Other health impairment 67.3 20.0 8.4 4.2 Specific learning disability 72.3 21.2 4.7 1.8 Speech or language impairment 87.5 4.7 3.9 3.9 Traumatic brain injury 51.1 21.5 19.6 7.8 Visual impairment 68.2 12.4 8.9 10.5 aPercentage of day spent inside the regular class is defined as the number of hours the student spends each day inside the regular classroom, divided by the total number of hours in the school day (including lunch, recess, and study periods), multiplied by 100. bStudents who received special education and related services outside the regular classroom for less than 21 percent of the school day were classified in the inside the regular class 80% or more of the day educational environment category. c“Other environments” consists of separate school, residential facility, homebound/hospital, correctional facilities, and parentally placed in private schools. dStates’ use of the developmental delay category is optional for children and students ages 3 through 9 and is not applicable to students older than 9 years of age. For more information on students ages 6 through 9 reported under the category of developmental delay and States with differences in developmental delay reporting practices, see Exhibits B-2 and B-3 in Appendix B. NOTE: Percentage was calculated by dividing the number of students ages 6 through 21 served under IDEA, Part B, in the disability category and educational environment by the total number of students ages 6 through 21 served under IDEA, Part B, in the disability category and all educational environments, then multiplying the result by 100. The sum of row percentages may not total 100 because of rounding. SOURCE: U.S. Department of Education, EDFacts Data Warehouse (EDW), OMB #1850-0925: IDEA Part B Child Count and Educational Environments Collection, 2018. These data are for 49 States, DC, BIE schools, PR, the four outlying areas, and the three freely associated states. Data for Wisconsin were not available. Data were accessed fall 2019. For actual IDEA data used, go to https://www2.ed.gov/programs/osepidea/618-data/state-level-data-files/index.html.
• In 2018, the percentage of students ages 6 through 21 served under IDEA, Part B, in each educational environment varied by disability category.
• More than 8 in 10 students reported under the category of speech or language impairment (87.5 percent) were educated inside the regular class 80% or more of the day. Less than 2 in 10, or 17.4 percent of students reported under the category of intellectual disability and 14.3 percent of students reported under the category of multiple disabilities were educated inside the regular class 80% or more of the day.
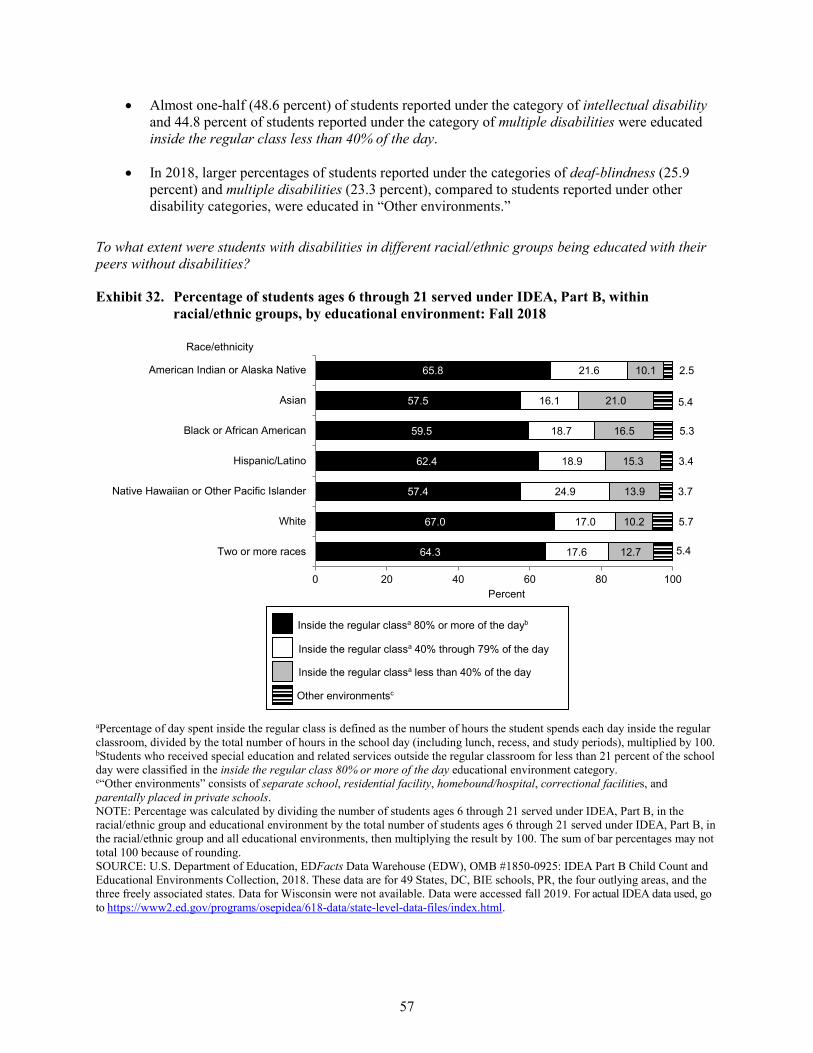
57
• Almost one-half (48.6 percent) of students reported under the category of intellectual disability and 44.8 percent of students reported under the category of multiple disabilities were educated inside the regular class less than 40% of the day.
• In 2018, larger percentages of students reported under the categories of deaf-blindness (25.9 percent) and multiple disabilities (23.3 percent), compared to students reported under other disability categories, were educated in “Other environments.”
To what extent were students with disabilities in different racial/ethnic groups being educated with their peers without disabilities?
Exhibit 32. Percentage of students ages 6 through 21 served under IDEA, Part B, within racial/ethnic groups, by educational environment: Fall 2018
64.3
67.0
57.4
62.4
59.5
57.5
65.8
17.6
17.0
24.9
18.9
18.7
16.1
21.6
12.7
10.2
13.9
15.3
16.5
21.0
10.1
5.4
5.7
3.7
3.4
5.3
5.4
2.5
0 20 40 60 80 100
Two or more races
White
Native Hawaiian or Other Pacific Islander
Hispanic/Latino
Black or African American
Asian
American Indian or Alaska Native
Percent
Race/ethnicity
Inside the regular classa 80% or more of the dayb Inside the regular classa 40% through 79% of the day Inside the regular classa less than 40% of the day Other environmentsc
aPercentage of day spent inside the regular class is defined as the number of hours the student spends each day inside the regular classroom, divided by the total number of hours in the school day (including lunch, recess, and study periods), multiplied by 100. bStudents who received special education and related services outside the regular classroom for less than 21 percent of the school day were classified in the inside the regular class 80% or more of the day educational environment category. c“Other environments” consists of separate school, residential facility, homebound/hospital, correctional facilities, and parentally placed in private schools. NOTE: Percentage was calculated by dividing the number of students ages 6 through 21 served under IDEA, Part B, in the racial/ethnic group and educational environment by the total number of students ages 6 through 21 served under IDEA, Part B, in the racial/ethnic group and all educational environments, then multiplying the result by 100. The sum of bar percentages may not total 100 because of rounding. SOURCE: U.S. Department of Education, EDFacts Data Warehouse (EDW), OMB #1850-0925: IDEA Part B Child Count and Educational Environments Collection, 2018. These data are for 49 States, DC, BIE schools, PR, the four outlying areas, and the three freely associated states. Data for Wisconsin were not available. Data were accessed fall 2019. For actual IDEA data used, go to https://www2.ed.gov/programs/osepidea/618-data/state-level-data-files/index.html.
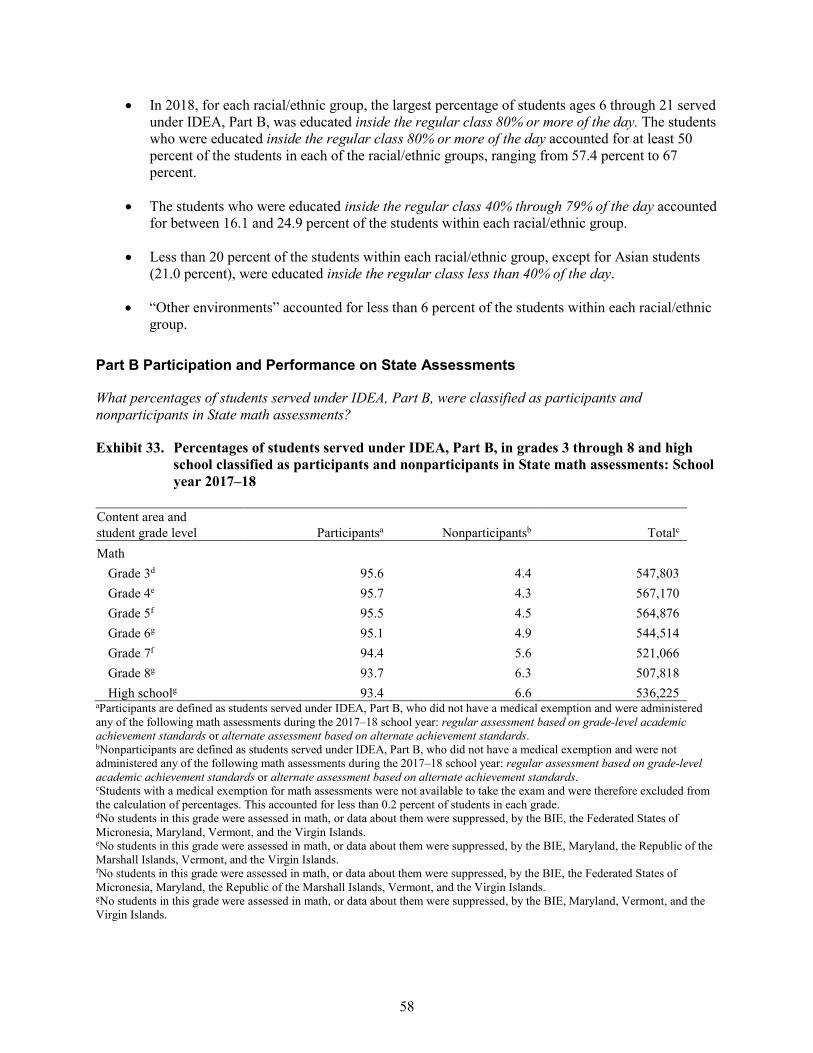
58
• In 2018, for each racial/ethnic group, the largest percentage of students ages 6 through 21 served under IDEA, Part B, was educated inside the regular class 80% or more of the day. The students who were educated inside the regular class 80% or more of the day accounted for at least 50 percent of the students in each of the racial/ethnic groups, ranging from 57.4 percent to 67 percent.
• The students who were educated inside the regular class 40% through 79% of the day accounted for between 16.1 and 24.9 percent of the students within each racial/ethnic group.
• Less than 20 percent of the students within each racial/ethnic group, except for Asian students (21.0 percent), were educated inside the regular class less than 40% of the day.
• “Other environments” accounted for less than 6 percent of the students within each racial/ethnic group.
Part B Participation and Performance on State Assessments
What percentages of students served under IDEA, Part B, were classified as participants and nonparticipants in State math assessments?
Exhibit 33. Percentages of students served under IDEA, Part B, in grades 3 through 8 and high school classified as participants and nonparticipants in State math assessments: School year 2017–18
Content area and student grade level Participantsa Nonparticipantsb Totalc Math
Grade 3d 95.6 4.4 547,803 Grade 4e 95.7 4.3 567,170 Grade 5f 95.5 4.5 564,876 Grade 6g 95.1 4.9 544,514 Grade 7f 94.4 5.6 521,066 Grade 8g 93.7 6.3 507,818 High schoolg 93.4 6.6 536,225
aParticipants are defined as students served under IDEA, Part B, who did not have a medical exemption and were administered any of the following math assessments during the 2017–18 school year: regular assessment based on grade-level academic achievement standards or alternate assessment based on alternate achievement standards. bNonparticipants are defined as students served under IDEA, Part B, who did not have a medical exemption and were not administered any of the following math assessments during the 2017–18 school year: regular assessment based on grade-level academic achievement standards or alternate assessment based on alternate achievement standards. cStudents with a medical exemption for math assessments were not available to take the exam and were therefore excluded from the calculation of percentages. This accounted for less than 0.2 percent of students in each grade. dNo students in this grade were assessed in math, or data about them were suppressed, by the BIE, the Federated States of Micronesia, Maryland, Vermont, and the Virgin Islands. eNo students in this grade were assessed in math, or data about them were suppressed, by the BIE, Maryland, the Republic of the Marshall Islands, Vermont, and the Virgin Islands. fNo students in this grade were assessed in math, or data about them were suppressed, by the BIE, the Federated States of Micronesia, Maryland, the Republic of the Marshall Islands, Vermont, and the Virgin Islands. gNo students in this grade were assessed in math, or data about them were suppressed, by the BIE, Maryland, Vermont, and the Virgin Islands.
59
• In school year 2017–18, between 93.4 and 95.7 percent of students served under IDEA, Part B, in each of grades 3 through 8 and high school, who did not have a medical exemption, participated in a math assessment. Between 4.3 and 6.6 percent did not participate.
NOTE: Percentage for participants (p) was calculated by dividing (a) the number of students served under IDEA, Part B, in the grade level who participated in a specific content area assessment and received a valid score and achievement level by the sum of (a) the number of students served under IDEA, Part B, in the grade level who participated in a specific content area assessment and received a valid score and achievement level and (b) the number of students who did not participate in an assessment, then multiplying the result by 100 [p=a/(a+b)*100]. Percentage for nonparticipants (np) was calculated by dividing (a) the number of students served under IDEA, Part B, who did not participate in an assessment by the sum of (a) the number of students served under IDEA, Part B, who did not participate in an assessment and (b) the number of students served under IDEA, Part B, in the grade level who participated in a specific content area assessment and received a valid score and achievement level, then multiplying the result by 100 [np=a/(a+b)*100]. Students with a medical exemption were excluded from the calculation of percentages. Suppressed data were excluded. SOURCE: U.S. Department of Education, EDFacts Data Warehouse (EDW), OMB #1850-0925: IDEA Part B Assessment Collection, 2017–18. These data are for the 50 States, DC, PR, BIE, the four outlying areas, and the three freely associated states, with the exceptions noted above. Data were accessed fall 2019. For actual IDEA data used, go to https://www2.ed.gov/programs/osepidea/618-data/state-level-data-files/index.html.
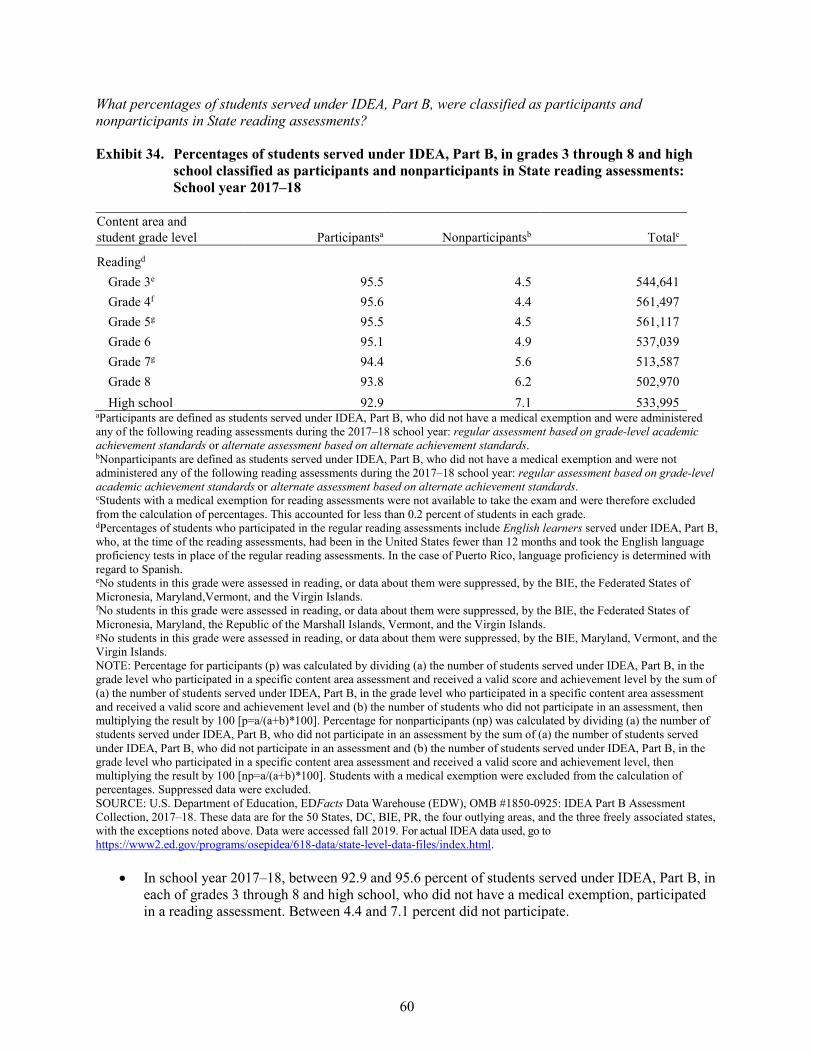
60
What percentages of students served under IDEA, Part B, were classified as participants and nonparticipants in State reading assessments?
Exhibit 34. Percentages of students served under IDEA, Part B, in grades 3 through 8 and high school classified as participants and nonparticipants in State reading assessments: School year 2017–18
Content area and student grade level Participantsa Nonparticipantsb Totalc
Readingd Grade 3e 95.5 4.5 544,641 Grade 4f 95.6 4.4 561,497 Grade 5g 95.5 4.5 561,117 Grade 6 95.1 4.9 537,039 Grade 7g 94.4 5.6 513,587 Grade 8 93.8 6.2 502,970 High school 92.9 7.1 533,995
aParticipants are defined as students served under IDEA, Part B, who did not have a medical exemption and were administered any of the following reading assessments during the 2017–18 school year: regular assessment based on grade-level academic achievement standards or alternate assessment based on alternate achievement standards. bNonparticipants are defined as students served under IDEA, Part B, who did not have a medical exemption and were not administered any of the following reading assessments during the 2017–18 school year: regular assessment based on grade-level academic achievement standards or alternate assessment based on alternate achievement standards. cStudents with a medical exemption for reading assessments were not available to take the exam and were therefore excluded from the calculation of percentages. This accounted for less than 0.2 percent of students in each grade. dPercentages of students who participated in the regular reading assessments include English learners served under IDEA, Part B, who, at the time of the reading assessments, had been in the United States fewer than 12 months and took the English language proficiency tests in place of the regular reading assessments. In the case of Puerto Rico, language proficiency is determined with regard to Spanish. eNo students in this grade were assessed in reading, or data about them were suppressed, by the BIE, the Federated States of Micronesia, Maryland,Vermont, and the Virgin Islands. fNo students in this grade were assessed in reading, or data about them were suppressed, by the BIE, the Federated States of Micronesia, Maryland, the Republic of the Marshall Islands, Vermont, and the Virgin Islands. gNo students in this grade were assessed in reading, or data about them were suppressed, by the BIE, Maryland, Vermont, and the Virgin Islands. NOTE: Percentage for participants (p) was calculated by dividing (a) the number of students served under IDEA, Part B, in the grade level who participated in a specific content area assessment and received a valid score and achievement level by the sum of (a) the number of students served under IDEA, Part B, in the grade level who participated in a specific content area assessment and received a valid score and achievement level and (b) the number of students who did not participate in an assessment, then multiplying the result by 100 [p=a/(a+b)*100]. Percentage for nonparticipants (np) was calculated by dividing (a) the number of students served under IDEA, Part B, who did not participate in an assessment by the sum of (a) the number of students served under IDEA, Part B, who did not participate in an assessment and (b) the number of students served under IDEA, Part B, in the grade level who participated in a specific content area assessment and received a valid score and achievement level, then multiplying the result by 100 [np=a/(a+b)*100]. Students with a medical exemption were excluded from the calculation of percentages. Suppressed data were excluded. SOURCE: U.S. Department of Education, EDFacts Data Warehouse (EDW), OMB #1850-0925: IDEA Part B Assessment Collection, 2017–18. These data are for the 50 States, DC, BIE, PR, the four outlying areas, and the three freely associated states, with the exceptions noted above. Data were accessed fall 2019. For actual IDEA data used, go to https://www2.ed.gov/programs/osepidea/618-data/state-level-data-files/index.html.
• In school year 2017–18, between 92.9 and 95.6 percent of students served under IDEA, Part B, in each of grades 3 through 8 and high school, who did not have a medical exemption, participated in a reading assessment. Between 4.4 and 7.1 percent did not participate.
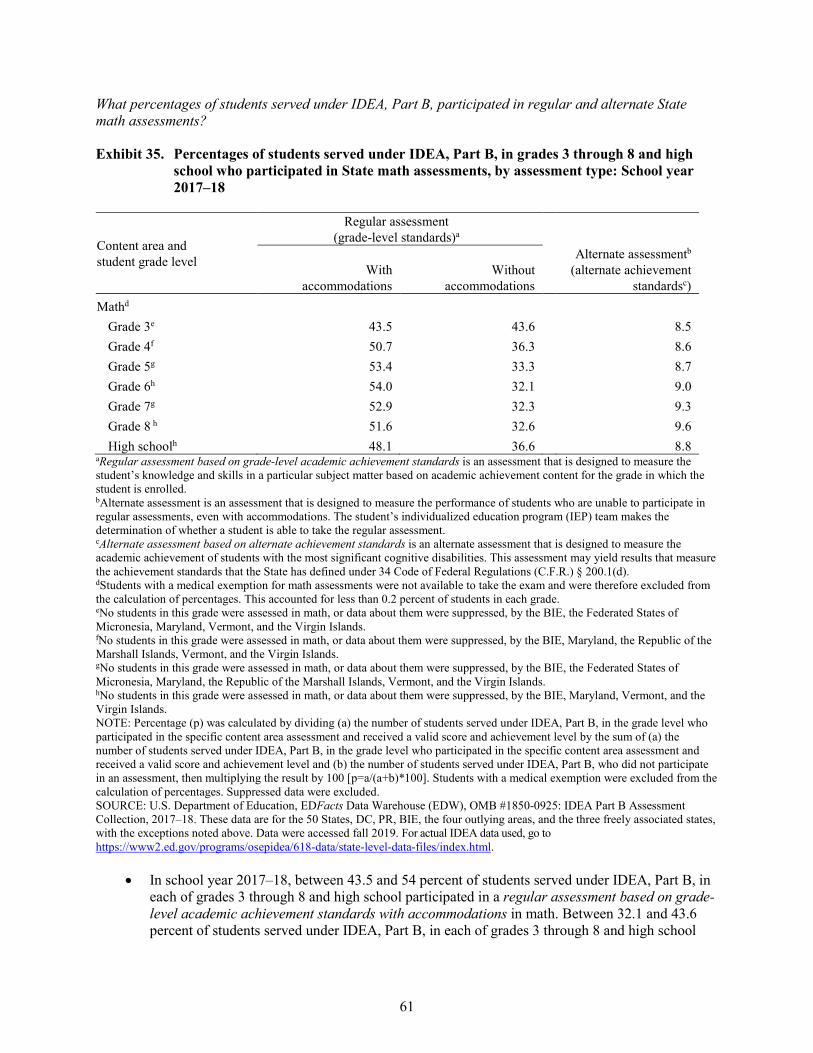
61
What percentages of students served under IDEA, Part B, participated in regular and alternate State math assessments?
Exhibit 35. Percentages of students served under IDEA, Part B, in grades 3 through 8 and high school who participated in State math assessments, by assessment type: School year 2017–18
Content area and student grade level
Regular assessment (grade-level standards)a
With accommodations
Without accommodations
Alternate assessmentb (alternate achievement
standardsc)
Mathd
Grade 3e 43.5 43.6 8.5 Grade 4f 50.7 36.3 8.6 Grade 5g 53.4 33.3 8.7 Grade 6h 54.0 32.1 9.0 Grade 7g 52.9 32.3 9.3 Grade 8 h 51.6 32.6 9.6 High schoolh 48.1 36.6 8.8
aRegular assessment based on grade-level academic achievement standards is an assessment that is designed to measure the student’s knowledge and skills in a particular subject matter based on academic achievement content for the grade in which the student is enrolled. bAlternate assessment is an assessment that is designed to measure the performance of students who are unable to participate in regular assessments, even with accommodations. The student’s individualized education program (IEP) team makes the determination of whether a student is able to take the regular assessment. cAlternate assessment based on alternate achievement standards is an alternate assessment that is designed to measure the academic achievement of students with the most significant cognitive disabilities. This assessment may yield results that measure the achievement standards that the State has defined under 34 Code of Federal Regulations (C.F.R.) § 200.1(d). dStudents with a medical exemption for math assessments were not available to take the exam and were therefore excluded from the calculation of percentages. This accounted for less than 0.2 percent of students in each grade. eNo students in this grade were assessed in math, or data about them were suppressed, by the BIE, the Federated States of Micronesia, Maryland, Vermont, and the Virgin Islands. fNo students in this grade were assessed in math, or data about them were suppressed, by the BIE, Maryland, the Republic of the Marshall Islands, Vermont, and the Virgin Islands. gNo students in this grade were assessed in math, or data about them were suppressed, by the BIE, the Federated States of Micronesia, Maryland, the Republic of the Marshall Islands, Vermont, and the Virgin Islands. hNo students in this grade were assessed in math, or data about them were suppressed, by the BIE, Maryland, Vermont, and the Virgin Islands. NOTE: Percentage (p) was calculated by dividing (a) the number of students served under IDEA, Part B, in the grade level who participated in the specific content area assessment and received a valid score and achievement level by the sum of (a) the number of students served under IDEA, Part B, in the grade level who participated in the specific content area assessment and received a valid score and achievement level and (b) the number of students served under IDEA, Part B, who did not participate in an assessment, then multiplying the result by 100 [p=a/(a+b)*100]. Students with a medical exemption were excluded from the calculation of percentages. Suppressed data were excluded. SOURCE: U.S. Department of Education, EDFacts Data Warehouse (EDW), OMB #1850-0925: IDEA Part B Assessment Collection, 2017–18. These data are for the 50 States, DC, PR, BIE, the four outlying areas, and the three freely associated states, with the exceptions noted above. Data were accessed fall 2019. For actual IDEA data used, go to https://www2.ed.gov/programs/osepidea/618-data/state-level-data-files/index.html.
• In school year 2017–18, between 43.5 and 54 percent of students served under IDEA, Part B, in each of grades 3 through 8 and high school participated in a regular assessment based on grade-level academic achievement standards with accommodations in math. Between 32.1 and 43.6 percent of students served under IDEA, Part B, in each of grades 3 through 8 and high school
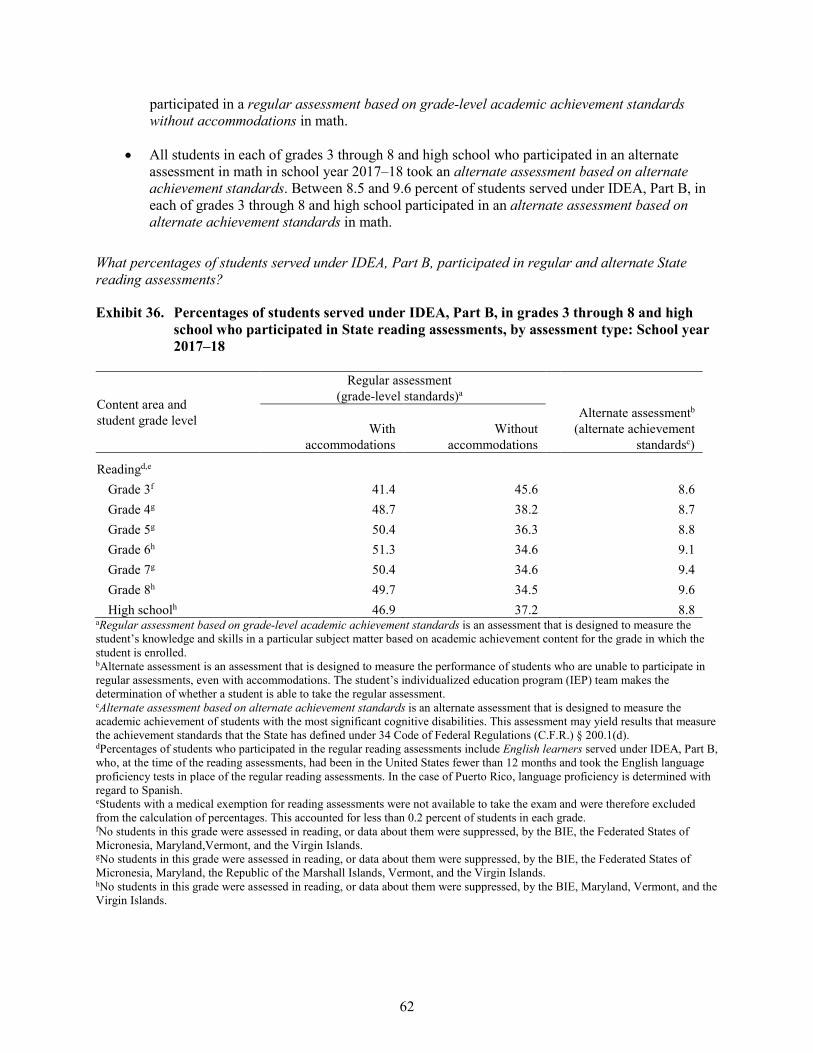
62
participated in a regular assessment based on grade-level academic achievement standards without accommodations in math.
• All students in each of grades 3 through 8 and high school who participated in an alternate assessment in math in school year 2017–18 took an alternate assessment based on alternate achievement standards. Between 8.5 and 9.6 percent of students served under IDEA, Part B, in each of grades 3 through 8 and high school participated in an alternate assessment based on alternate achievement standards in math.
What percentages of students served under IDEA, Part B, participated in regular and alternate State reading assessments?
Exhibit 36. Percentages of students served under IDEA, Part B, in grades 3 through 8 and high school who participated in State reading assessments, by assessment type: School year 2017–18
Content area and student grade level
Regular assessment (grade-level standards)a
With accommodations
Without accommodations
Alternate assessmentb (alternate achievement
standardsc)
Readingd,e
Grade 3f 41.4 45.6 8.6 Grade 4g 48.7 38.2 8.7 Grade 5g 50.4 36.3 8.8 Grade 6h 51.3 34.6 9.1 Grade 7g 50.4 34.6 9.4 Grade 8h 49.7 34.5 9.6 High schoolh 46.9 37.2 8.8
aRegular assessment based on grade-level academic achievement standards is an assessment that is designed to measure the student’s knowledge and skills in a particular subject matter based on academic achievement content for the grade in which the student is enrolled. bAlternate assessment is an assessment that is designed to measure the performance of students who are unable to participate in regular assessments, even with accommodations. The student’s individualized education program (IEP) team makes the determination of whether a student is able to take the regular assessment. cAlternate assessment based on alternate achievement standards is an alternate assessment that is designed to measure the academic achievement of students with the most significant cognitive disabilities. This assessment may yield results that measure the achievement standards that the State has defined under 34 Code of Federal Regulations (C.F.R.) § 200.1(d). dPercentages of students who participated in the regular reading assessments include English learners served under IDEA, Part B, who, at the time of the reading assessments, had been in the United States fewer than 12 months and took the English language proficiency tests in place of the regular reading assessments. In the case of Puerto Rico, language proficiency is determined with regard to Spanish. eStudents with a medical exemption for reading assessments were not available to take the exam and were therefore excluded from the calculation of percentages. This accounted for less than 0.2 percent of students in each grade. fNo students in this grade were assessed in reading, or data about them were suppressed, by the BIE, the Federated States of Micronesia, Maryland,Vermont, and the Virgin Islands. gNo students in this grade were assessed in reading, or data about them were suppressed, by the BIE, the Federated States of Micronesia, Maryland, the Republic of the Marshall Islands, Vermont, and the Virgin Islands. hNo students in this grade were assessed in reading, or data about them were suppressed, by the BIE, Maryland, Vermont, and the Virgin Islands.
63
• In school year 2017–18, between 41.4 and 51.3 percent of students served under IDEA, Part B, in each of grades 3 through 8 and high school participated in a regular assessment based on grade-level academic achievement standards with accommodations in reading. Between 34.5 and 45.6 percent of students served under IDEA, Part B, in each of grades 3 through 8 and high school participated in a regular assessment based on grade-level academic achievement standards without accommodations in reading.
• All students in each of grades 3 through 8 and high school who participated in an alternate assessment in reading in school year 2017–18 took an alternate assessment based on alternate achievement standards. Between 8.6 and 9.6 percent of students served under IDEA, Part B, in each of grades 3 through 8 and high school participated in an alternate assessment based on alternate achievement standards in reading.
NOTE: Percentage (p) was calculated by dividing (a) the number of students served under IDEA, Part B, in the grade level who participated in the specific content area assessment and received a valid score and achievement level by the sum of (a) the number of students served under IDEA, Part B, in the grade level who participated in the specific content area assessment and received a valid score and achievement level and (b) the number of students served under IDEA, Part B, who did not participate in an assessment, then multiplying the result by 100 [p=a/(a+b)*100]. Students with a medical exemption were excluded from the calculation of percentages. Suppressed data were excluded. SOURCE: U.S. Department of Education, EDFacts Data Warehouse (EDW), OMB #1850-0925: IDEA Part B Assessment Collection, 2017–18. These data are for the 50 States, DC, PR, BIE, the four outlying areas, and the three freely associated states, with the exceptions noted above. Data were accessed fall 2019. For actual IDEA data used, go to https://www2.ed.gov/programs/osepidea/618-data/state-level-data-files/index.html.
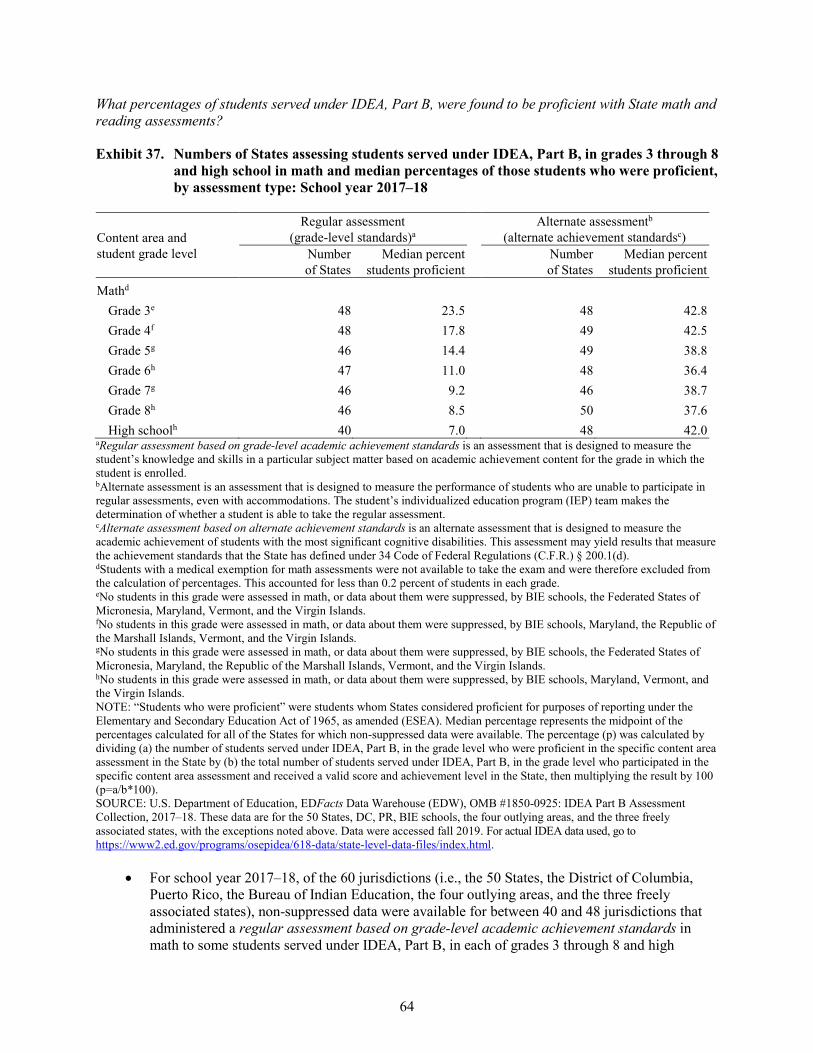
64
What percentages of students served under IDEA, Part B, were found to be proficient with State math and reading assessments?
Exhibit 37. Numbers of States assessing students served under IDEA, Part B, in grades 3 through 8 and high school in math and median percentages of those students who were proficient, by assessment type: School year 2017–18
Content area and student grade level
Regular assessment (grade-level standards)a
Alternate assessmentb
(alternate achievement standardsc) Number of States
Median percent students proficient
Number of States
Median percent students proficient
Mathd Grade 3e 48 23.5 48 42.8 Grade 4f 48 17.8 49 42.5 Grade 5g 46 14.4 49 38.8 Grade 6h 47 11.0 48 36.4 Grade 7g 46 9.2 46 38.7 Grade 8h 46 8.5 50 37.6 High schoolh 40 7.0 48 42.0
aRegular assessment based on grade-level academic achievement standards is an assessment that is designed to measure the student’s knowledge and skills in a particular subject matter based on academic achievement content for the grade in which the student is enrolled. bAlternate assessment is an assessment that is designed to measure the performance of students who are unable to participate in regular assessments, even with accommodations. The student’s individualized education program (IEP) team makes the determination of whether a student is able to take the regular assessment. cAlternate assessment based on alternate achievement standards is an alternate assessment that is designed to measure the academic achievement of students with the most significant cognitive disabilities. This assessment may yield results that measure the achievement standards that the State has defined under 34 Code of Federal Regulations (C.F.R.) § 200.1(d). dStudents with a medical exemption for math assessments were not available to take the exam and were therefore excluded from the calculation of percentages. This accounted for less than 0.2 percent of students in each grade. eNo students in this grade were assessed in math, or data about them were suppressed, by BIE schools, the Federated States of Micronesia, Maryland, Vermont, and the Virgin Islands. fNo students in this grade were assessed in math, or data about them were suppressed, by BIE schools, Maryland, the Republic of the Marshall Islands, Vermont, and the Virgin Islands. gNo students in this grade were assessed in math, or data about them were suppressed, by BIE schools, the Federated States of Micronesia, Maryland, the Republic of the Marshall Islands, Vermont, and the Virgin Islands. hNo students in this grade were assessed in math, or data about them were suppressed, by BIE schools, Maryland, Vermont, and the Virgin Islands. NOTE: “Students who were proficient” were students whom States considered proficient for purposes of reporting under the Elementary and Secondary Education Act of 1965, as amended (ESEA). Median percentage represents the midpoint of the percentages calculated for all of the States for which non-suppressed data were available. The percentage (p) was calculated by dividing (a) the number of students served under IDEA, Part B, in the grade level who were proficient in the specific content area assessment in the State by (b) the total number of students served under IDEA, Part B, in the grade level who participated in the specific content area assessment and received a valid score and achievement level in the State, then multiplying the result by 100 (p=a/b*100). SOURCE: U.S. Department of Education, EDFacts Data Warehouse (EDW), OMB #1850-0925: IDEA Part B Assessment Collection, 2017–18. These data are for the 50 States, DC, PR, BIE schools, the four outlying areas, and the three freely associated states, with the exceptions noted above. Data were accessed fall 2019. For actual IDEA data used, go to https://www2.ed.gov/programs/osepidea/618-data/state-level-data-files/index.html.
• For school year 2017–18, of the 60 jurisdictions (i.e., the 50 States, the District of Columbia, Puerto Rico, the Bureau of Indian Education, the four outlying areas, and the three freely associated states), non-suppressed data were available for between 40 and 48 jurisdictions that administered a regular assessment based on grade-level academic achievement standards in math to some students served under IDEA, Part B, in each of grades 3 through 8 and high
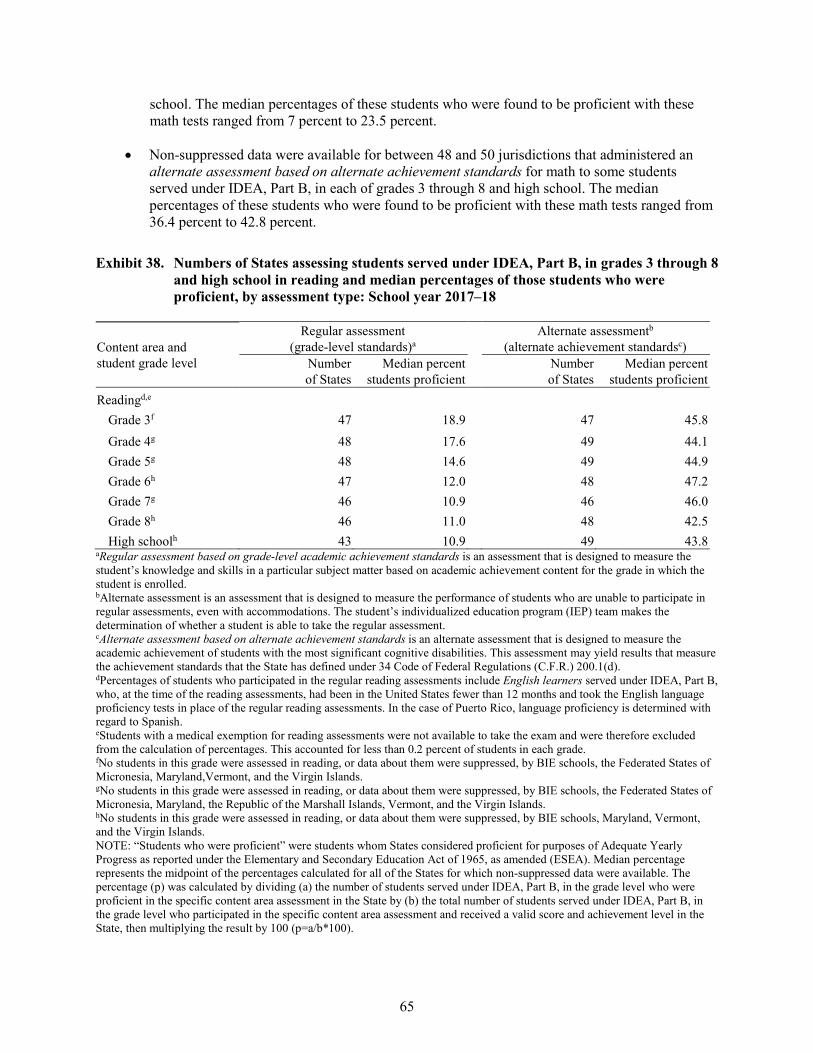
65
school. The median percentages of these students who were found to be proficient with these math tests ranged from 7 percent to 23.5 percent.
• Non-suppressed data were available for between 48 and 50 jurisdictions that administered an alternate assessment based on alternate achievement standards for math to some students served under IDEA, Part B, in each of grades 3 through 8 and high school. The median percentages of these students who were found to be proficient with these math tests ranged from 36.4 percent to 42.8 percent.
Exhibit 38. Numbers of States assessing students served under IDEA, Part B, in grades 3 through 8 and high school in reading and median percentages of those students who were proficient, by assessment type: School year 2017–18
Content area and student grade level
Regular assessment (grade-level standards)a
Alternate assessmentb (alternate achievement standardsc)
Number of States
Median percent students proficient
Number of States
Median percent students proficient
Readingd,e Grade 3f 47 18.9 47 45.8 Grade 4g 48 17.6 49 44.1 Grade 5g 48 14.6 49 44.9 Grade 6h 47 12.0 48 47.2 Grade 7g 46 10.9 46 46.0 Grade 8h 46 11.0 48 42.5 High schoolh 43 10.9 49 43.8
aRegular assessment based on grade-level academic achievement standards is an assessment that is designed to measure the student’s knowledge and skills in a particular subject matter based on academic achievement content for the grade in which the student is enrolled. bAlternate assessment is an assessment that is designed to measure the performance of students who are unable to participate in regular assessments, even with accommodations. The student’s individualized education program (IEP) team makes the determination of whether a student is able to take the regular assessment. cAlternate assessment based on alternate achievement standards is an alternate assessment that is designed to measure the academic achievement of students with the most significant cognitive disabilities. This assessment may yield results that measure the achievement standards that the State has defined under 34 Code of Federal Regulations (C.F.R.) 200.1(d). dPercentages of students who participated in the regular reading assessments include English learners served under IDEA, Part B, who, at the time of the reading assessments, had been in the United States fewer than 12 months and took the English language proficiency tests in place of the regular reading assessments. In the case of Puerto Rico, language proficiency is determined with regard to Spanish. eStudents with a medical exemption for reading assessments were not available to take the exam and were therefore excluded from the calculation of percentages. This accounted for less than 0.2 percent of students in each grade. fNo students in this grade were assessed in reading, or data about them were suppressed, by BIE schools, the Federated States of Micronesia, Maryland,Vermont, and the Virgin Islands. gNo students in this grade were assessed in reading, or data about them were suppressed, by BIE schools, the Federated States of Micronesia, Maryland, the Republic of the Marshall Islands, Vermont, and the Virgin Islands. hNo students in this grade were assessed in reading, or data about them were suppressed, by BIE schools, Maryland, Vermont, and the Virgin Islands. NOTE: “Students who were proficient” were students whom States considered proficient for purposes of Adequate Yearly Progress as reported under the Elementary and Secondary Education Act of 1965, as amended (ESEA). Median percentage represents the midpoint of the percentages calculated for all of the States for which non-suppressed data were available. The percentage (p) was calculated by dividing (a) the number of students served under IDEA, Part B, in the grade level who were proficient in the specific content area assessment in the State by (b) the total number of students served under IDEA, Part B, in the grade level who participated in the specific content area assessment and received a valid score and achievement level in the State, then multiplying the result by 100 (p=a/b*100).
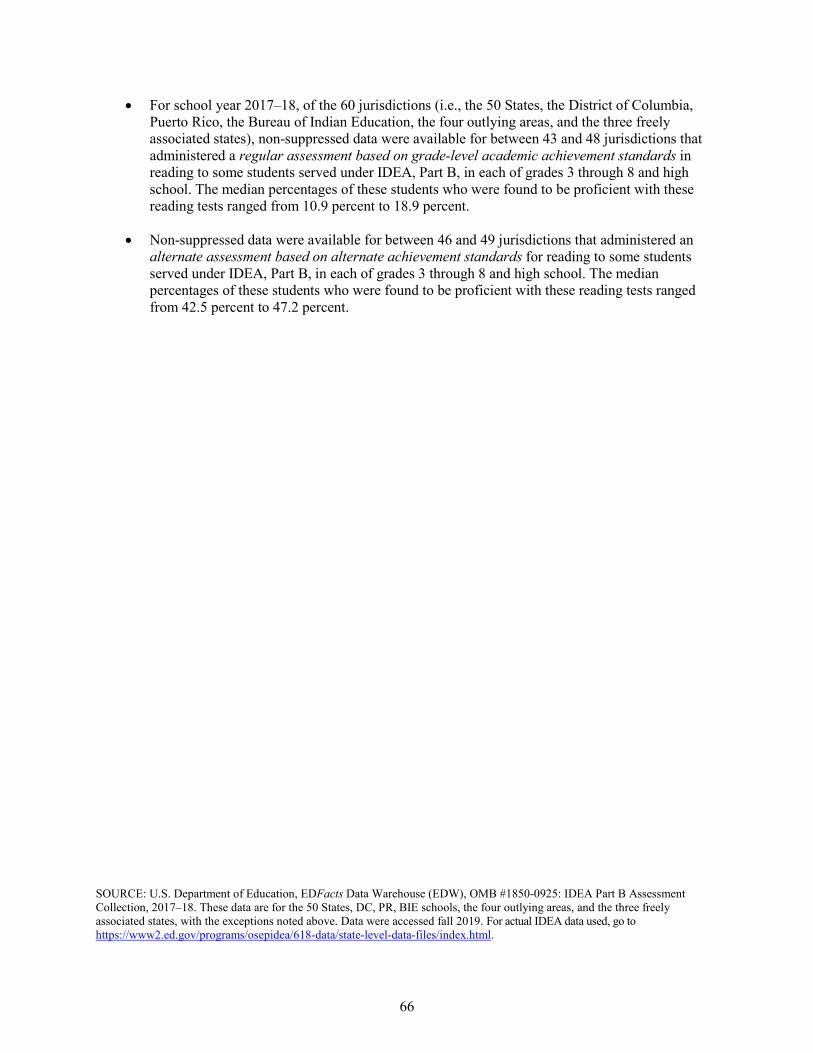
66
• For school year 2017–18, of the 60 jurisdictions (i.e., the 50 States, the District of Columbia, Puerto Rico, the Bureau of Indian Education, the four outlying areas, and the three freely associated states), non-suppressed data were available for between 43 and 48 jurisdictions that administered a regular assessment based on grade-level academic achievement standards in reading to some students served under IDEA, Part B, in each of grades 3 through 8 and high school. The median percentages of these students who were found to be proficient with these reading tests ranged from 10.9 percent to 18.9 percent.
• Non-suppressed data were available for between 46 and 49 jurisdictions that administered an alternate assessment based on alternate achievement standards for reading to some students served under IDEA, Part B, in each of grades 3 through 8 and high school. The median percentages of these students who were found to be proficient with these reading tests ranged from 42.5 percent to 47.2 percent.
SOURCE: U.S. Department of Education, EDFacts Data Warehouse (EDW), OMB #1850-0925: IDEA Part B Assessment Collection, 2017–18. These data are for the 50 States, DC, PR, BIE schools, the four outlying areas, and the three freely associated states, with the exceptions noted above. Data were accessed fall 2019. For actual IDEA data used, go to https://www2.ed.gov/programs/osepidea/618-data/state-level-data-files/index.html.
67
Part B Exiting
What were the percentages of students ages 14 through 21 exiting IDEA, Part B, by specific exiting categories?
Exhibit 39. Percentage of students ages 14 through 21 exiting IDEA, Part B, by exiting category: 2017–18
Graduated with regular high
school diploma(47.5%)
Received a certificate
(6.4%)
Dropped out(10.4%)
Transferred to regular education
(9.5%)
Moved, known to be continuing(a)
(25.2%)
Other exiting categories(b)
(1.0%)
(a)The moved, known to be continuing in education category includes exiters who moved out of the catchment area (e.g., State, school district) and are known to be continuing in an educational program. The catchment area is defined by the State education agency. (b)“Other exiting categories” includes reached maximum age for services (0.8 percent), died (0.2 percent), and graduated with an alternate diploma (0.0 percent). NOTE: The U.S. Department of Education collects data on eight categories of exiters from special education (i.e., the Part B program in which the student was enrolled at the start of the reporting period). The exiting categories include six categories of exiters from both special education and school (i.e., graduated with a regular high school diploma, graduated with an alternate diploma, received a certificate, dropped out, reached maximum age for services, and died) and two categories of exiters from special education but not school (i.e., transferred to regular education and moved, known to be continuing in education). The eight exiting categories are mutually exclusive. Percentage was calculated by dividing the number of students ages 14 through 21 served under IDEA, Part B, who were reported in the exiting category by the total number of students ages 14 through 21 served under IDEA, Part B, who were reported in all the exiting categories (632,746), then multiplying the result by 100. The sum may not total 100 percent because of rounding. Data are from the reporting period between July 1, 2017, and June 30, 2018. SOURCE: U.S. Department of Education, EDFacts Data Warehouse (EDW), OMB #1850-0925: IDEA Part B Exiting Collection, 2017–18. These data are for 49 States, DC, BIE schools, PR, the four outlying areas, and the three freely associated states. Data for Vermont were not available. Data were accessed fall 2019. For actual IDEA data used, go to https://www2.ed.gov/programs/osepidea/618-data/state-level-data-files/index.html.
• Of the eight exiting categories, graduated with a regular high school diploma accounted for the largest percentage of students ages 14 through 21 who exited special education in 2017–18 (specifically, 300,447, or 47.5 percent, of the 632,746 such students). This was followed by moved, known to be continuing in education (25.2 percent) and dropped out (10.4 percent).
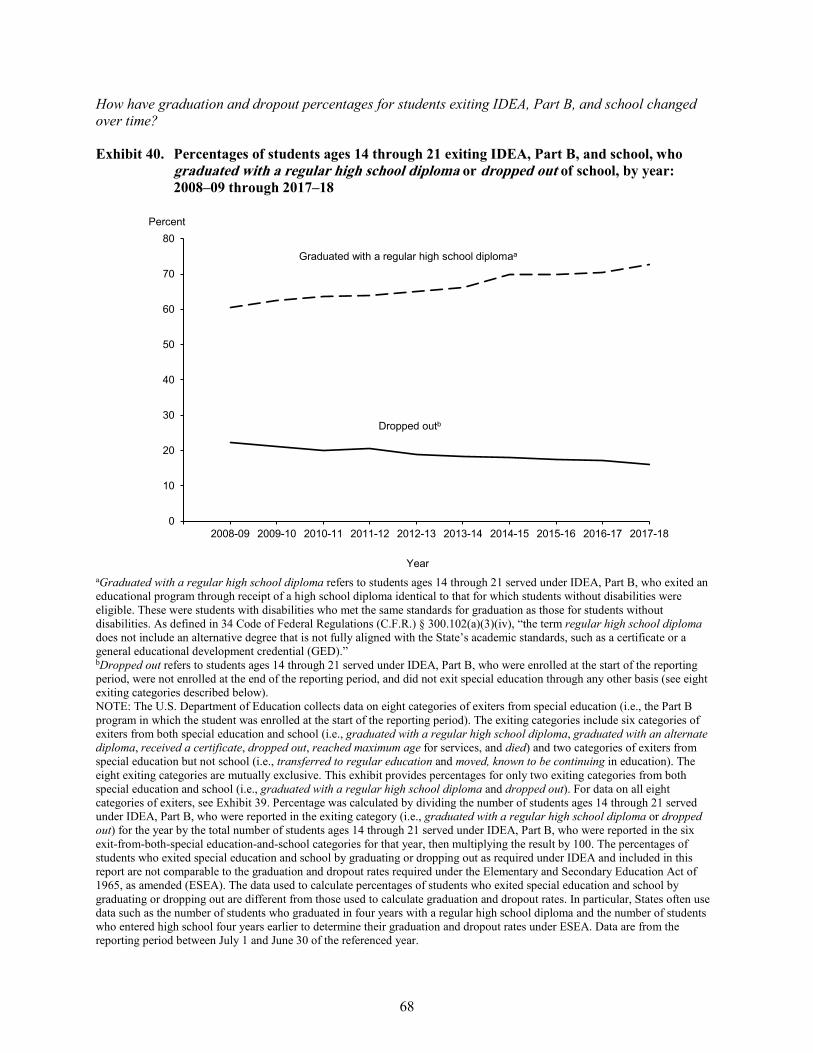
68
How have graduation and dropout percentages for students exiting IDEA, Part B, and school changed over time?
Exhibit 40. Percentages of students ages 14 through 21 exiting IDEA, Part B, and school, who graduated with a regular high school diploma or dropped out of school, by year: 2008–09 through 2017–18
0
10
20
30
40
50
60
70
80
2008-09 2009-10 2010-11 2011-12 2012-13 2013-14 2014-15 2015-16 2016-17 2017-18
Percent
Year
Graduated with a regular high school diplomaa
Dropped outb
aGraduated with a regular high school diploma refers to students ages 14 through 21 served under IDEA, Part B, who exited an educational program through receipt of a high school diploma identical to that for which students without disabilities were eligible. These were students with disabilities who met the same standards for graduation as those for students without disabilities. As defined in 34 Code of Federal Regulations (C.F.R.) § 300.102(a)(3)(iv), “the term regular high school diploma does not include an alternative degree that is not fully aligned with the State’s academic standards, such as a certificate or a general educational development credential (GED).” bDropped out refers to students ages 14 through 21 served under IDEA, Part B, who were enrolled at the start of the reporting period, were not enrolled at the end of the reporting period, and did not exit special education through any other basis (see eight exiting categories described below). NOTE: The U.S. Department of Education collects data on eight categories of exiters from special education (i.e., the Part B program in which the student was enrolled at the start of the reporting period). The exiting categories include six categories of exiters from both special education and school (i.e., graduated with a regular high school diploma, graduated with an alternate diploma, received a certificate, dropped out, reached maximum age for services, and died) and two categories of exiters from special education but not school (i.e., transferred to regular education and moved, known to be continuing in education). The eight exiting categories are mutually exclusive. This exhibit provides percentages for only two exiting categories from both special education and school (i.e., graduated with a regular high school diploma and dropped out). For data on all eight categories of exiters, see Exhibit 39. Percentage was calculated by dividing the number of students ages 14 through 21 served under IDEA, Part B, who were reported in the exiting category (i.e., graduated with a regular high school diploma or dropped out) for the year by the total number of students ages 14 through 21 served under IDEA, Part B, who were reported in the six exit-from-both-special education-and-school categories for that year, then multiplying the result by 100. The percentages of students who exited special education and school by graduating or dropping out as required under IDEA and included in this report are not comparable to the graduation and dropout rates required under the Elementary and Secondary Education Act of 1965, as amended (ESEA). The data used to calculate percentages of students who exited special education and school by graduating or dropping out are different from those used to calculate graduation and dropout rates. In particular, States often use data such as the number of students who graduated in four years with a regular high school diploma and the number of students who entered high school four years earlier to determine their graduation and dropout rates under ESEA. Data are from the reporting period between July 1 and June 30 of the referenced year.
69
• In 2017–18, a total of 72.7 percent of the students ages 14 through 21 who exited IDEA, Part B, and school graduated with a regular high school diploma, while 16 percent dropped out.
• The percentage of students who exited special education and school by having graduated with a regular high school diploma increased from 60.6 percent in 2008–09 to 72.7 percent in 2017–18.
• From 2008–09 through 2017–18, the percentage of students who exited special education and school by having dropped out generally decreased from 22.4 percent to 16 percent.
SOURCE: U.S. Department of Education, EDFacts Data Warehouse (EDW), OMB #1850-0925: IDEA Part B Exiting Collection, 2008–09 through 2017–18. These data are for the 50 States, DC, BIE schools, PR, the four outlying areas, and the three freely associated states, with the following exceptions. For 2008–09, data for the three freely associated states and Vermont were not available. For 2010–11, data for the three freely associated states and BIE schools were not available. For 2012–13, data for BIE schools were not available. For 2014–15, data for Illinois were suppressed, and data for Ohio were not available. For 2015–16 and 2016–17, data for Illinois were not available. For 2017–18, data for Vermont were not available. Data for 2008–09 through 2009–10 were accessed spring 2012. Data for 2010–11 were accessed fall 2012. Data for 2011–12 were accessed fall 2013. Data for 2012–13 were accessed fall 2014. Data for 2013–14 were accessed fall 2015. Data for 2014–15 were accessed fall 2016. Data for 2015–16 were accessed fall 2017. Data for 2016–17 were accessed fall 2018. Data for 2017–18 were accessed fall 2019. For actual IDEA data used, go to https://www2.ed.gov/programs/osepidea/618-data/state-level-data-files/index.html.
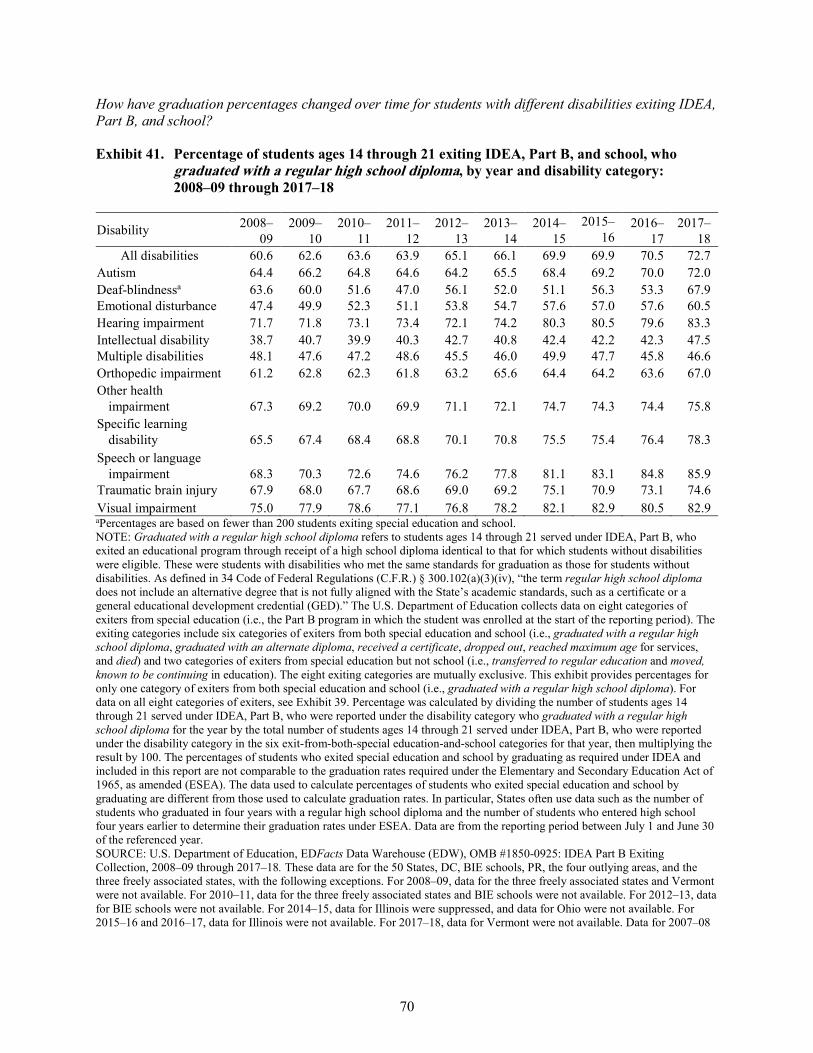
70
How have graduation percentages changed over time for students with different disabilities exiting IDEA, Part B, and school?
Exhibit 41. Percentage of students ages 14 through 21 exiting IDEA, Part B, and school, who graduated with a regular high school diploma, by year and disability category: 2008–09 through 2017–18
Disability 2008–09
2009–10
2010–11
2011–12
2012–13
2013–14
2014–15
2015–16
2016–17
2017–18
All disabilities 60.6 62.6 63.6 63.9 65.1 66.1 69.9 69.9 70.5 72.7 Autism 64.4 66.2 64.8 64.6 64.2 65.5 68.4 69.2 70.0 72.0 Deaf-blindnessa 63.6 60.0 51.6 47.0 56.1 52.0 51.1 56.3 53.3 67.9 Emotional disturbance 47.4 49.9 52.3 51.1 53.8 54.7 57.6 57.0 57.6 60.5 Hearing impairment 71.7 71.8 73.1 73.4 72.1 74.2 80.3 80.5 79.6 83.3 Intellectual disability 38.7 40.7 39.9 40.3 42.7 40.8 42.4 42.2 42.3 47.5 Multiple disabilities 48.1 47.6 47.2 48.6 45.5 46.0 49.9 47.7 45.8 46.6 Orthopedic impairment 61.2 62.8 62.3 61.8 63.2 65.6 64.4 64.2 63.6 67.0 Other health
impairment 67.3 69.2 70.0 69.9 71.1 72.1 74.7 74.3 74.4 75.8 Specific learning
disability 65.5 67.4 68.4 68.8 70.1 70.8 75.5 75.4 76.4 78.3 Speech or language
impairment 68.3 70.3 72.6 74.6 76.2 77.8 81.1 83.1 84.8 85.9 Traumatic brain injury 67.9 68.0 67.7 68.6 69.0 69.2 75.1 70.9 73.1 74.6 Visual impairment 75.0 77.9 78.6 77.1 76.8 78.2 82.1 82.9 80.5 82.9 aPercentages are based on fewer than 200 students exiting special education and school. NOTE: Graduated with a regular high school diploma refers to students ages 14 through 21 served under IDEA, Part B, who exited an educational program through receipt of a high school diploma identical to that for which students without disabilities were eligible. These were students with disabilities who met the same standards for graduation as those for students without disabilities. As defined in 34 Code of Federal Regulations (C.F.R.) § 300.102(a)(3)(iv), “the term regular high school diploma does not include an alternative degree that is not fully aligned with the State’s academic standards, such as a certificate or a general educational development credential (GED).” The U.S. Department of Education collects data on eight categories of exiters from special education (i.e., the Part B program in which the student was enrolled at the start of the reporting period). The exiting categories include six categories of exiters from both special education and school (i.e., graduated with a regular high school diploma, graduated with an alternate diploma, received a certificate, dropped out, reached maximum age for services, and died) and two categories of exiters from special education but not school (i.e., transferred to regular education and moved, known to be continuing in education). The eight exiting categories are mutually exclusive. This exhibit provides percentages for only one category of exiters from both special education and school (i.e., graduated with a regular high school diploma). For data on all eight categories of exiters, see Exhibit 39. Percentage was calculated by dividing the number of students ages 14 through 21 served under IDEA, Part B, who were reported under the disability category who graduated with a regular high school diploma for the year by the total number of students ages 14 through 21 served under IDEA, Part B, who were reported under the disability category in the six exit-from-both-special education-and-school categories for that year, then multiplying the result by 100. The percentages of students who exited special education and school by graduating as required under IDEA and included in this report are not comparable to the graduation rates required under the Elementary and Secondary Education Act of 1965, as amended (ESEA). The data used to calculate percentages of students who exited special education and school by graduating are different from those used to calculate graduation rates. In particular, States often use data such as the number of students who graduated in four years with a regular high school diploma and the number of students who entered high school four years earlier to determine their graduation rates under ESEA. Data are from the reporting period between July 1 and June 30 of the referenced year. SOURCE: U.S. Department of Education, EDFacts Data Warehouse (EDW), OMB #1850-0925: IDEA Part B Exiting Collection, 2008–09 through 2017–18. These data are for the 50 States, DC, BIE schools, PR, the four outlying areas, and the three freely associated states, with the following exceptions. For 2008–09, data for the three freely associated states and Vermont were not available. For 2010–11, data for the three freely associated states and BIE schools were not available. For 2012–13, data for BIE schools were not available. For 2014–15, data for Illinois were suppressed, and data for Ohio were not available. For 2015–16 and 2016–17, data for Illinois were not available. For 2017–18, data for Vermont were not available. Data for 2007–08
71
• In comparison to school year 2008–09, the graduation percentage in 2017–18 increased for students who exited IDEA, Part B, and school in all disability categories except multiple disabilities. The graduation percentage increased by 4.3 percentage points for students in the deaf-blindness category and by at least 5 percentage points for students in the remaining disability categories.
• From 2008–09 through 2014–15, the disability category with the largest graduation percentage was visual impairment. From 2015–16 through 2017–18, the disability category of speech or language impairment was associated with the largest graduation percentage. The students reported under the category of intellectual disability had the smallest graduation percentages from 2008–09 through 2016–17. The students reported under the category of multiple disabilities had the smallest graduation percentage in 2017–18 (46.6 percent).
through 2009–10 were accessed spring 2012. Data for 2010–11 were accessed fall 2012. Data for 2011–12 were accessed fall 2013. Data for 2012–13 were accessed fall 2014. Data for 2013–14 were accessed fall 2015. Data for 2014–15 were accessed fall 2016. Data for 2015–16 were accessed fall 2017. Data for 2016–17 were accessed fall 2018. Data for 2017–18 were accessed fall 2019. For actual IDEA data used, go to https://www2.ed.gov/programs/osepidea/618-data/state-level-data-files/index.html.
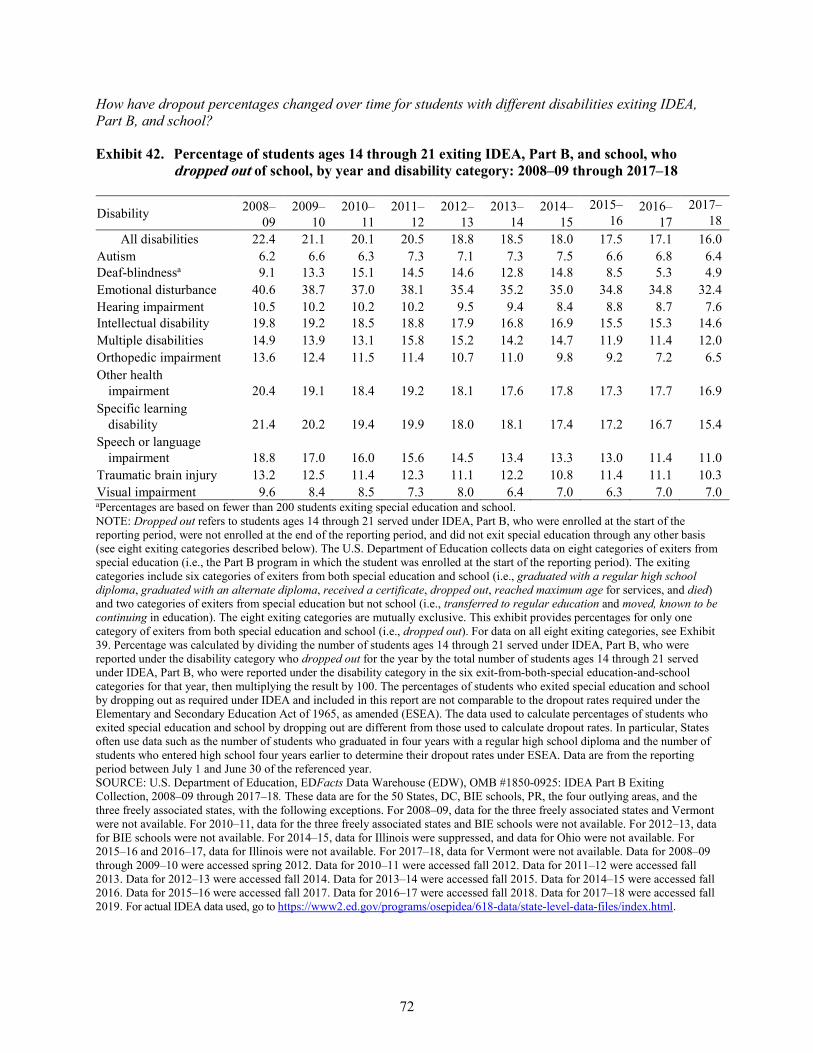
72
How have dropout percentages changed over time for students with different disabilities exiting IDEA, Part B, and school?
Exhibit 42. Percentage of students ages 14 through 21 exiting IDEA, Part B, and school, who dropped out of school, by year and disability category: 2008–09 through 2017–18
Disability 2008–09
2009–10
2010–11
2011–12
2012–13
2013–14
2014–15
2015–16
2016–17
2017–18
All disabilities 22.4 21.1 20.1 20.5 18.8 18.5 18.0 17.5 17.1 16.0 Autism 6.2 6.6 6.3 7.3 7.1 7.3 7.5 6.6 6.8 6.4 Deaf-blindnessa 9.1 13.3 15.1 14.5 14.6 12.8 14.8 8.5 5.3 4.9 Emotional disturbance 40.6 38.7 37.0 38.1 35.4 35.2 35.0 34.8 34.8 32.4 Hearing impairment 10.5 10.2 10.2 10.2 9.5 9.4 8.4 8.8 8.7 7.6 Intellectual disability 19.8 19.2 18.5 18.8 17.9 16.8 16.9 15.5 15.3 14.6 Multiple disabilities 14.9 13.9 13.1 15.8 15.2 14.2 14.7 11.9 11.4 12.0 Orthopedic impairment 13.6 12.4 11.5 11.4 10.7 11.0 9.8 9.2 7.2 6.5 Other health
impairment 20.4 19.1 18.4 19.2 18.1 17.6 17.8 17.3 17.7 16.9 Specific learning
disability 21.4 20.2 19.4 19.9 18.0 18.1 17.4 17.2 16.7 15.4 Speech or language
impairment 18.8 17.0 16.0 15.6 14.5 13.4 13.3 13.0 11.4 11.0 Traumatic brain injury 13.2 12.5 11.4 12.3 11.1 12.2 10.8 11.4 11.1 10.3 Visual impairment 9.6 8.4 8.5 7.3 8.0 6.4 7.0 6.3 7.0 7.0 aPercentages are based on fewer than 200 students exiting special education and school. NOTE: Dropped out refers to students ages 14 through 21 served under IDEA, Part B, who were enrolled at the start of the reporting period, were not enrolled at the end of the reporting period, and did not exit special education through any other basis (see eight exiting categories described below). The U.S. Department of Education collects data on eight categories of exiters from special education (i.e., the Part B program in which the student was enrolled at the start of the reporting period). The exiting categories include six categories of exiters from both special education and school (i.e., graduated with a regular high school diploma, graduated with an alternate diploma, received a certificate, dropped out, reached maximum age for services, and died) and two categories of exiters from special education but not school (i.e., transferred to regular education and moved, known to be continuing in education). The eight exiting categories are mutually exclusive. This exhibit provides percentages for only one category of exiters from both special education and school (i.e., dropped out). For data on all eight exiting categories, see Exhibit 39. Percentage was calculated by dividing the number of students ages 14 through 21 served under IDEA, Part B, who were reported under the disability category who dropped out for the year by the total number of students ages 14 through 21 served under IDEA, Part B, who were reported under the disability category in the six exit-from-both-special education-and-school categories for that year, then multiplying the result by 100. The percentages of students who exited special education and school by dropping out as required under IDEA and included in this report are not comparable to the dropout rates required under the Elementary and Secondary Education Act of 1965, as amended (ESEA). The data used to calculate percentages of students who exited special education and school by dropping out are different from those used to calculate dropout rates. In particular, States often use data such as the number of students who graduated in four years with a regular high school diploma and the number of students who entered high school four years earlier to determine their dropout rates under ESEA. Data are from the reporting period between July 1 and June 30 of the referenced year. SOURCE: U.S. Department of Education, EDFacts Data Warehouse (EDW), OMB #1850-0925: IDEA Part B Exiting Collection, 2008–09 through 2017–18. These data are for the 50 States, DC, BIE schools, PR, the four outlying areas, and the three freely associated states, with the following exceptions. For 2008–09, data for the three freely associated states and Vermont were not available. For 2010–11, data for the three freely associated states and BIE schools were not available. For 2012–13, data for BIE schools were not available. For 2014–15, data for Illinois were suppressed, and data for Ohio were not available. For 2015–16 and 2016–17, data for Illinois were not available. For 2017–18, data for Vermont were not available. Data for 2008–09 through 2009–10 were accessed spring 2012. Data for 2010–11 were accessed fall 2012. Data for 2011–12 were accessed fall 2013. Data for 2012–13 were accessed fall 2014. Data for 2013–14 were accessed fall 2015. Data for 2014–15 were accessed fall 2016. Data for 2015–16 were accessed fall 2017. Data for 2016–17 were accessed fall 2018. Data for 2017–18 were accessed fall 2019. For actual IDEA data used, go to https://www2.ed.gov/programs/osepidea/618-data/state-level-data-files/index.html.
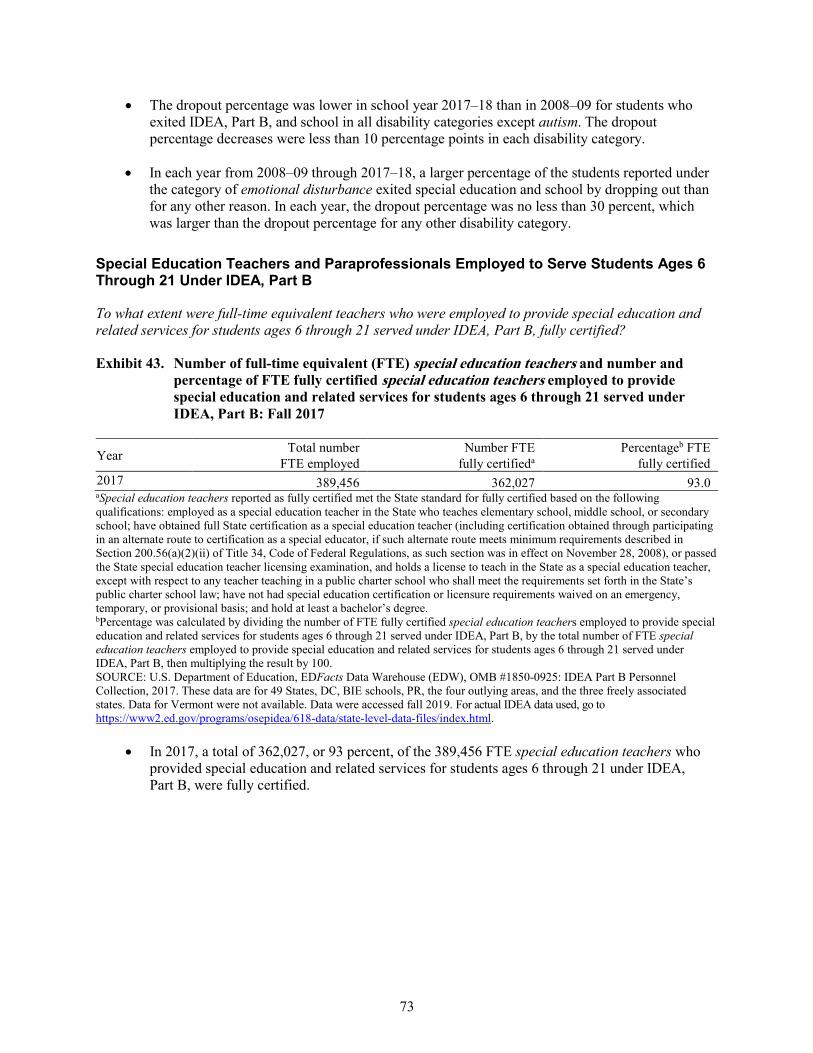
73
• The dropout percentage was lower in school year 2017–18 than in 2008–09 for students who exited IDEA, Part B, and school in all disability categories except autism. The dropout percentage decreases were less than 10 percentage points in each disability category.
• In each year from 2008–09 through 2017–18, a larger percentage of the students reported under the category of emotional disturbance exited special education and school by dropping out than for any other reason. In each year, the dropout percentage was no less than 30 percent, which was larger than the dropout percentage for any other disability category.
Special Education Teachers and Paraprofessionals Employed to Serve Students Ages 6 Through 21 Under IDEA, Part B
To what extent were full-time equivalent teachers who were employed to provide special education and related services for students ages 6 through 21 served under IDEA, Part B, fully certified?
Exhibit 43. Number of full-time equivalent (FTE) special education teachers and number and percentage of FTE fully certified special education teachers employed to provide special education and related services for students ages 6 through 21 served under IDEA, Part B: Fall 2017
Year Total number FTE employed
Number FTE fully certifieda
Percentageb FTE fully certified
2017 389,456 362,027 93.0 aSpecial education teachers reported as fully certified met the State standard for fully certified based on the following qualifications: employed as a special education teacher in the State who teaches elementary school, middle school, or secondary school; have obtained full State certification as a special education teacher (including certification obtained through participating in an alternate route to certification as a special educator, if such alternate route meets minimum requirements described in Section 200.56(a)(2)(ii) of Title 34, Code of Federal Regulations, as such section was in effect on November 28, 2008), or passed the State special education teacher licensing examination, and holds a license to teach in the State as a special education teacher, except with respect to any teacher teaching in a public charter school who shall meet the requirements set forth in the State’s public charter school law; have not had special education certification or licensure requirements waived on an emergency, temporary, or provisional basis; and hold at least a bachelor’s degree. bPercentage was calculated by dividing the number of FTE fully certified special education teachers employed to provide special education and related services for students ages 6 through 21 served under IDEA, Part B, by the total number of FTE special education teachers employed to provide special education and related services for students ages 6 through 21 served under IDEA, Part B, then multiplying the result by 100. SOURCE: U.S. Department of Education, EDFacts Data Warehouse (EDW), OMB #1850-0925: IDEA Part B Personnel Collection, 2017. These data are for 49 States, DC, BIE schools, PR, the four outlying areas, and the three freely associated states. Data for Vermont were not available. Data were accessed fall 2019. For actual IDEA data used, go to https://www2.ed.gov/programs/osepidea/618-data/state-level-data-files/index.html.
• In 2017, a total of 362,027, or 93 percent, of the 389,456 FTE special education teachers who provided special education and related services for students ages 6 through 21 under IDEA, Part B, were fully certified.

74
To what extent were full-time equivalent paraprofessionals who were employed to provide special education and related services for students ages 6 through 21 served under IDEA, Part B, qualified?
Exhibit 44. Number of full-time equivalent (FTE) special education paraprofessionals and number and percentage of FTE qualified special education paraprofessionals employed to provide special education and related services for students ages 6 through 21 served under IDEA, Part B: Fall 2017
Year Total number FTE employed
Number FTE qualifieda
Percentageb FTE qualified
2017 458,676 430,375 93.8 aSpecial education paraprofessionals reported as qualified either (1) met the State standard for qualified based on the criteria identified in 20 United States Code (U.S.C.) § 1412(a)(14)(B) or (2) if no State standard for qualified paraprofessionals existed, either held appropriate State certification or licensure for the position held or held positions for which no State certification or licensure requirements existed. bPercentage was calculated by dividing the number of FTE qualified special education paraprofessionals employed to provide special education and related services for students ages 6 through 21 served under IDEA, Part B, by the total number of FTE special education paraprofessionals employed to provide special education and related services for students ages 6 through 21 served under IDEA, Part B, then multiplying the result by 100. NOTE: Paraprofessionals are employees who provide instructional support, including those who (1) provide one-on-one tutoring if such tutoring is scheduled at a time when a student would not otherwise receive instruction from a teacher; (2) assist with classroom management, such as organizing instructional and other materials; (3) provide instructional assistance in a computer laboratory; (4) conduct parental involvement activities; (5) provide support in a library or media center; (6) act as a translator; or (7) provide instructional support services under the direct supervision of a teacher. SOURCE: U.S. Department of Education, EDFacts Data Warehouse (EDW), OMB #1850-0925: IDEA Part B Personnel Collection, 2017. These data are for 49 States, DC, BIE schools, PR, the four outlying areas, and the three freely associated states. Data for Vermont were not available. Data were accessed fall 2019. For actual IDEA data used, go to https://www2.ed.gov/programs/osepidea/618-data/state-level-data-files/index.html.
• In 2017, a total of 430,375, or 93.8 percent, of the 458,676 FTE special education paraprofessionals who provided special education and related services for students ages 6 through 21 under IDEA, Part B, were qualified.
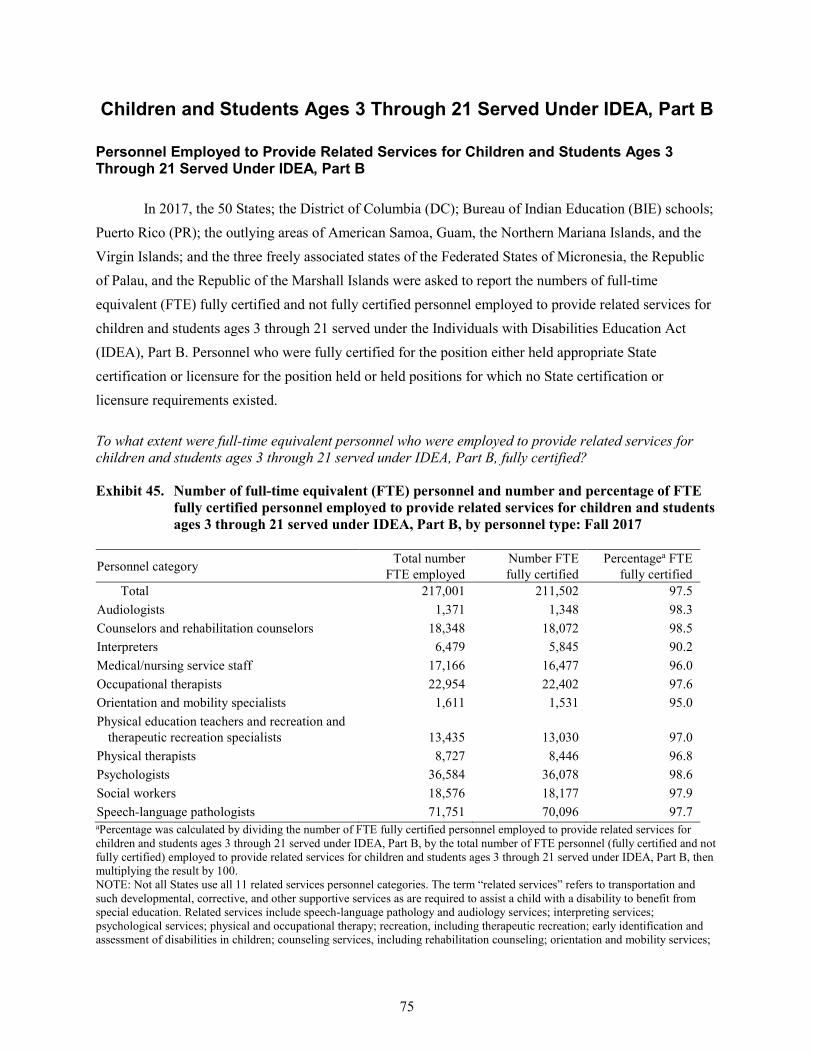
75
Children and Students Ages 3 Through 21 Served Under IDEA, Part B
Personnel Employed to Provide Related Services for Children and Students Ages 3 Through 21 Served Under IDEA, Part B
In 2017, the 50 States; the District of Columbia (DC); Bureau of Indian Education (BIE) schools; Puerto Rico (PR); the outlying areas of American Samoa, Guam, the Northern Mariana Islands, and the Virgin Islands; and the three freely associated states of the Federated States of Micronesia, the Republic of Palau, and the Republic of the Marshall Islands were asked to report the numbers of full-time equivalent (FTE) fully certified and not fully certified personnel employed to provide related services for children and students ages 3 through 21 served under the Individuals with Disabilities Education Act (IDEA), Part B. Personnel who were fully certified for the position either held appropriate State certification or licensure for the position held or held positions for which no State certification or licensure requirements existed.
To what extent were full-time equivalent personnel who were employed to provide related services for children and students ages 3 through 21 served under IDEA, Part B, fully certified?
Exhibit 45. Number of full-time equivalent (FTE) personnel and number and percentage of FTE fully certified personnel employed to provide related services for children and students ages 3 through 21 served under IDEA, Part B, by personnel type: Fall 2017
Personnel category Total number FTE employed
Number FTE fully certified
Percentagea FTE fully certified
Total 217,001 211,502 97.5 Audiologists 1,371 1,348 98.3 Counselors and rehabilitation counselors 18,348 18,072 98.5 Interpreters 6,479 5,845 90.2 Medical/nursing service staff 17,166 16,477 96.0 Occupational therapists 22,954 22,402 97.6 Orientation and mobility specialists 1,611 1,531 95.0 Physical education teachers and recreation and
therapeutic recreation specialists 13,435 13,030 97.0 Physical therapists 8,727 8,446 96.8 Psychologists 36,584 36,078 98.6 Social workers 18,576 18,177 97.9 Speech-language pathologists 71,751 70,096 97.7 aPercentage was calculated by dividing the number of FTE fully certified personnel employed to provide related services for children and students ages 3 through 21 served under IDEA, Part B, by the total number of FTE personnel (fully certified and not fully certified) employed to provide related services for children and students ages 3 through 21 served under IDEA, Part B, then multiplying the result by 100. NOTE: Not all States use all 11 related services personnel categories. The term “related services” refers to transportation and such developmental, corrective, and other supportive services as are required to assist a child with a disability to benefit from special education. Related services include speech-language pathology and audiology services; interpreting services; psychological services; physical and occupational therapy; recreation, including therapeutic recreation; early identification and assessment of disabilities in children; counseling services, including rehabilitation counseling; orientation and mobility services;
76
• In 2017, a total of 97.5 percent of all FTE personnel who were employed to provide related services for children and students ages 3 through 21 served under IDEA, Part B, were fully certified.
• In 10 of the 11 related services personnel categories, 95 percent or more of FTE related services personnel were fully certified. Interpreters was the exception at 90.2 percent.
medical services for diagnostic or evaluation purposes; school health services and school nurse services; social work services in schools; and parent counseling and training. Related services do not include a medical device that is surgically implanted, the optimization of that device’s functioning (e.g., mapping), maintenance of that device, or the replacement of that device [34 Code of Federal Regulations (C.F.R.) § 300.34(a) and (b)(1)]. SOURCE: U.S. Department of Education, EDFacts Data Warehouse (EDW), OMB #1850-0925: IDEA Part B Personnel Collection, 2017. These data are for 49 States, DC, BIE schools, PR, the four outlying areas, and two freely associated states. Data for Vermont were not available. Data were accessed fall 2019. For actual IDEA data used, go to https://www2.ed.gov/programs/osepidea/618-data/state-level-data-files/index.html.
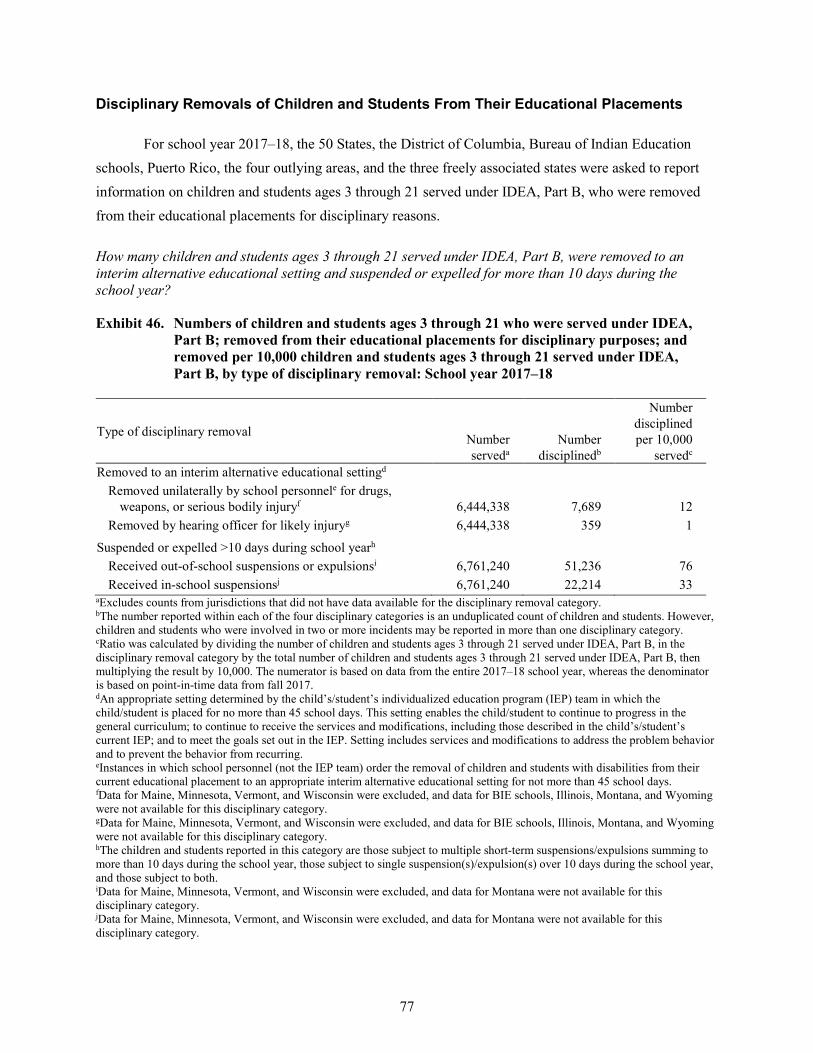
77
Disciplinary Removals of Children and Students From Their Educational Placements
For school year 2017–18, the 50 States, the District of Columbia, Bureau of Indian Education schools, Puerto Rico, the four outlying areas, and the three freely associated states were asked to report information on children and students ages 3 through 21 served under IDEA, Part B, who were removed from their educational placements for disciplinary reasons.
How many children and students ages 3 through 21 served under IDEA, Part B, were removed to an interim alternative educational setting and suspended or expelled for more than 10 days during the school year?
Exhibit 46. Numbers of children and students ages 3 through 21 who were served under IDEA, Part B; removed from their educational placements for disciplinary purposes; and removed per 10,000 children and students ages 3 through 21 served under IDEA, Part B, by type of disciplinary removal: School year 2017–18
Type of disciplinary removal Number serveda
Number disciplinedb
Number disciplined per 10,000
servedc
Removed to an interim alternative educational settingd Removed unilaterally by school personnele for drugs,
weapons, or serious bodily injuryf 6,444,338 7,689 12 Removed by hearing officer for likely injuryg 6,444,338 359 1
Suspended or expelled >10 days during school yearh Received out-of-school suspensions or expulsionsi 6,761,240 51,236 76 Received in-school suspensionsj 6,761,240 22,214 33
aExcludes counts from jurisdictions that did not have data available for the disciplinary removal category. bThe number reported within each of the four disciplinary categories is an unduplicated count of children and students. However, children and students who were involved in two or more incidents may be reported in more than one disciplinary category. cRatio was calculated by dividing the number of children and students ages 3 through 21 served under IDEA, Part B, in the disciplinary removal category by the total number of children and students ages 3 through 21 served under IDEA, Part B, then multiplying the result by 10,000. The numerator is based on data from the entire 2017–18 school year, whereas the denominator is based on point-in-time data from fall 2017. dAn appropriate setting determined by the child’s/student’s individualized education program (IEP) team in which the child/student is placed for no more than 45 school days. This setting enables the child/student to continue to progress in the general curriculum; to continue to receive the services and modifications, including those described in the child’s/student’s current IEP; and to meet the goals set out in the IEP. Setting includes services and modifications to address the problem behavior and to prevent the behavior from recurring. eInstances in which school personnel (not the IEP team) order the removal of children and students with disabilities from their current educational placement to an appropriate interim alternative educational setting for not more than 45 school days. fData for Maine, Minnesota, Vermont, and Wisconsin were excluded, and data for BIE schools, Illinois, Montana, and Wyoming were not available for this disciplinary category. gData for Maine, Minnesota, Vermont, and Wisconsin were excluded, and data for BIE schools, Illinois, Montana, and Wyoming were not available for this disciplinary category. hThe children and students reported in this category are those subject to multiple short-term suspensions/expulsions summing to more than 10 days during the school year, those subject to single suspension(s)/expulsion(s) over 10 days during the school year, and those subject to both. iData for Maine, Minnesota, Vermont, and Wisconsin were excluded, and data for Montana were not available for this disciplinary category. jData for Maine, Minnesota, Vermont, and Wisconsin were excluded, and data for Montana were not available for this disciplinary category.
78
• During the 2017–18 school year, 7,689 children and students ages 3 through 21 served under IDEA, Part B, in the jurisdictions for which data were available experienced a unilateral removal to an interim alternative educational setting by school personnel (not the IEP team) for drugs, weapons, or serious bodily injury. Given that 6,444,338 children and students ages 3 through 21 were served under Part B in 2017, in the States for which data were available, this type of action occurred with 12 children and students for every 10,000 children and students who were served under Part B in 2017.
• A total of 359 children and students ages 3 through 21 served under IDEA, Part B, or less than 1 for every 10,000 children and students served in the jurisdictions for which data were available, experienced a removal to an interim alternative educational setting based on a hearing officer determination regarding likely injury in school year 2017–18.
• There were 51,236 children and students ages 3 through 21 served under IDEA, Part B, or 76 for every 10,000 children and students served in the jurisdictions for which data were available, who received out-of-school suspensions or expulsions for more than 10 cumulative days in school year 2017–18.
• There were 22,214 children and students ages 3 through 21 served under IDEA, Part B, or 33 for every 10,000 children and students served in the jurisdictions for which data were available, who received in-school suspensions for more than 10 cumulative days in school year 2017–18.
SOURCE: U.S. Department of Education, EDFacts Data Warehouse (EDW), OMB #1850-0925: IDEA Part B Discipline Collection, 2017–18. These data are for 45 States, DC, BIE schools, PR, the four outlying areas, and the three freely associated states, with the exceptions noted above. Data for Montana were not available. Data for Maine, Minnesota, Vermont, and Wisconsin were excluded. Data were accessed fall 2019. U.S. Department of Education, EDFacts Data Warehouse (EDW), OMB #1850-0925: “IDEA Part B Child Count and Educational Environments Collection,” 2017. These data are for 45 States, DC, PR, the four outlying areas, and the three freely associated states. Data for Maine, Minnesota, Vermont, and Wisconsin were not available. Data for Montana were excluded. Data were accessed fall 2019. For actual IDEA data used, go to https://www2.ed.gov/programs/osepidea/618-data/state-level-data-files/index.html.
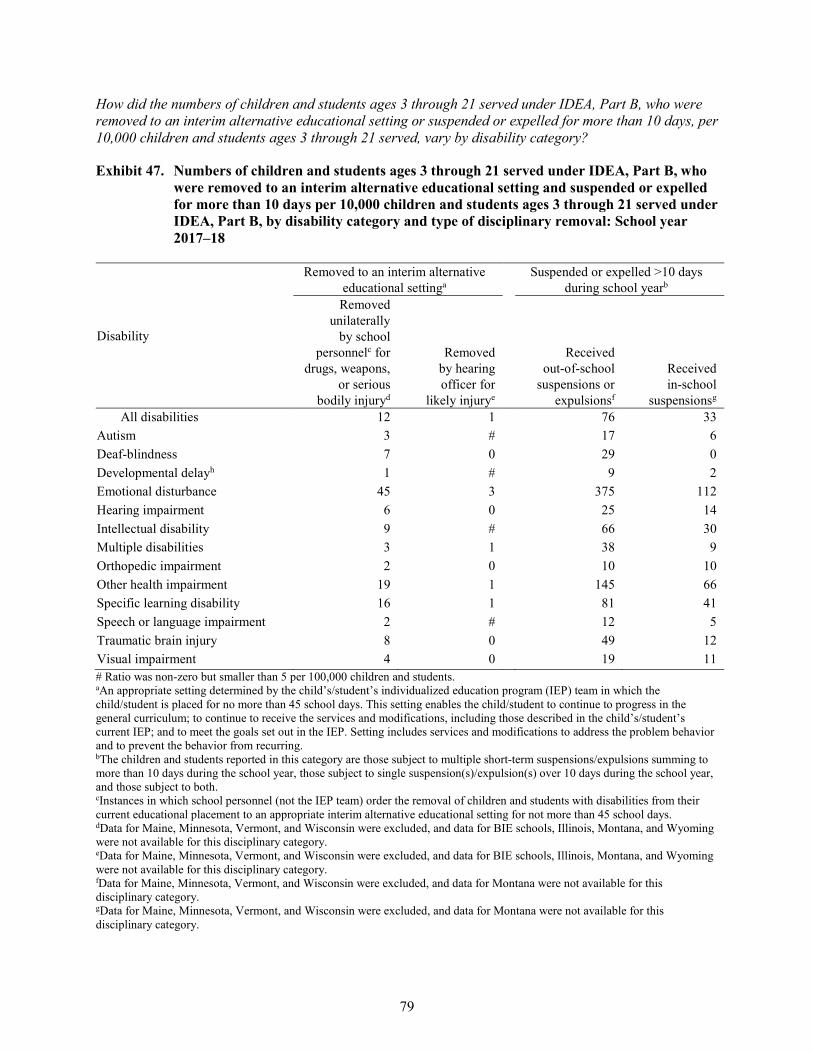
79
How did the numbers of children and students ages 3 through 21 served under IDEA, Part B, who were removed to an interim alternative educational setting or suspended or expelled for more than 10 days, per 10,000 children and students ages 3 through 21 served, vary by disability category?
Exhibit 47. Numbers of children and students ages 3 through 21 served under IDEA, Part B, who were removed to an interim alternative educational setting and suspended or expelled for more than 10 days per 10,000 children and students ages 3 through 21 served under IDEA, Part B, by disability category and type of disciplinary removal: School year 2017–18
Disability
Removed to an interim alternative educational settinga
Suspended or expelled >10 days during school yearb
Removed unilaterally
by school personnelc for
drugs, weapons, or serious
bodily injuryd
Removed by hearing officer for
likely injurye
Received out-of-school
suspensions or expulsionsf
Received in-school
suspensionsg All disabilities 12 1 76 33
Autism 3 # 17 6 Deaf-blindness 7 0 29 0 Developmental delayh 1 # 9 2 Emotional disturbance 45 3 375 112 Hearing impairment 6 0 25 14 Intellectual disability 9 # 66 30 Multiple disabilities 3 1 38 9 Orthopedic impairment 2 0 10 10 Other health impairment 19 1 145 66 Specific learning disability 16 1 81 41 Speech or language impairment 2 # 12 5 Traumatic brain injury 8 0 49 12 Visual impairment 4 0 19 11 # Ratio was non-zero but smaller than 5 per 100,000 children and students. aAn appropriate setting determined by the child’s/student’s individualized education program (IEP) team in which the child/student is placed for no more than 45 school days. This setting enables the child/student to continue to progress in the general curriculum; to continue to receive the services and modifications, including those described in the child’s/student’s current IEP; and to meet the goals set out in the IEP. Setting includes services and modifications to address the problem behavior and to prevent the behavior from recurring. bThe children and students reported in this category are those subject to multiple short-term suspensions/expulsions summing to more than 10 days during the school year, those subject to single suspension(s)/expulsion(s) over 10 days during the school year, and those subject to both. cInstances in which school personnel (not the IEP team) order the removal of children and students with disabilities from their current educational placement to an appropriate interim alternative educational setting for not more than 45 school days. dData for Maine, Minnesota, Vermont, and Wisconsin were excluded, and data for BIE schools, Illinois, Montana, and Wyoming were not available for this disciplinary category. eData for Maine, Minnesota, Vermont, and Wisconsin were excluded, and data for BIE schools, Illinois, Montana, and Wyoming were not available for this disciplinary category. fData for Maine, Minnesota, Vermont, and Wisconsin were excluded, and data for Montana were not available for this disciplinary category. gData for Maine, Minnesota, Vermont, and Wisconsin were excluded, and data for Montana were not available for this disciplinary category.
80
• For every 10,000 children and students ages 3 through 21 served under IDEA, Part B, who were reported under the category of emotional disturbance in 2017, there were 45 children and students removed unilaterally to an interim alternative educational setting by school personnel for offenses involving drugs, weapons, or serious bodily injury during school year 2017–18. The ratio for the children and students reported under each of the other disability categories was 19 or less per 10,000 children and students served.
• Without regard for disability category, for every 10,000 children and students ages 3 through 21 served under IDEA, Part B, in 2017, no more than three children and students were removed by a hearing officer for likely injury during school year 2017–18.
• For every 10,000 children and students ages 3 through 21 served under IDEA, Part B, who were reported under the category of emotional disturbance in 2017, there were 375 children and students who received out-of-school suspensions or expulsions for more than 10 cumulative days during school year 2017–18. The ratio for the children and students reported under each of the other disability categories was 145 or less per 10,000 children and students served.
• For every 10,000 children and students ages 3 through 21 served under IDEA, Part B, who were reported under the category of emotional disturbance in 2017, there were 112 children and students who received in-school suspensions for more than 10 cumulative days during school year 2017–18. The ratio for the children and students reported under each of the other disability categories was 66 or less per 10,000 children and students served.
hStates’ use of the developmental delay category is optional for children and students ages 3 through 9 and is not applicable to students older than 9 years of age. NOTE: The ratio reported within each of the four disciplinary categories is based on an unduplicated count of children and students. However, children and students who were involved in two or more incidents may be reported in more than one disciplinary category. Ratio was calculated by dividing the number of children and students ages 3 through 21 served under IDEA, Part B, who were reported under the disability category for the disciplinary removal category by the total number of children and students ages 3 through 21 served under IDEA, Part B, who were reported under the disability category, then multiplying the result by 10,000. The numerator is based on data from the entire 2017–18 school year, whereas the denominator is based on point-in-time data from fall 2017. The denominator for the disability category of deaf-blindness for each type of disciplinary action is fewer than 1,450 children and students ages 3 through 21 served under IDEA, Part B. The denominator for each of the other disability categories for each type of disciplinary action exceeded 25,000 children and students. SOURCE: U.S. Department of Education, EDFacts Data Warehouse (EDW), OMB #1850-0925: IDEA Part B Discipline Collection, 2017–18. These data are for 45 States, DC, BIE schools, PR, the four outlying areas, and the three freely associated states, with the exceptions noted above. Data for Montana were not available. Data for Maine, Minnesota, Vermont, and Wisconsin were excluded. Data were accessed fall 2019. U.S. Department of Education, EDFacts Data Warehouse (EDW), OMB #1850-0925: IDEA Part B Child Count and Educational Environments Collection, 2017. These data are for 45 States, DC, PR, the four outlying areas, and the three freely associated states. Data for Maine, Minnesota, Vermont, and Wisconsin were not available. Data for Montana were excluded. Data were accessed fall 2019. For actual IDEA data used, go to https://www2.ed.gov/programs/osepidea/618-data/state-level-data-files/index.html.
81
Dispute Resolution for Children and Students Served Under IDEA, Part B
To protect the interests of children and students served under IDEA, Part B, the Act requires States to implement a formal set of procedural safeguards for children and students served under IDEA, Part B. Among these procedural safeguards are three formal options for registering and resolving disputes. One of these options is a written, signed complaint. Any individual or organization can file a written, signed complaint alleging a violation of any Part B requirement by a school district, the State education agency (SEA), or any other public agency. A second option available to parents, school districts, or other public agencies is a due process complaint. By filing a due process complaint, a parent or public agency may request a due process hearing10 regarding any matter relating to a proposal or a refusal to initiate or change the identification, evaluation, or educational placement of a child or student with a disability or to the provision of a free appropriate public education (FAPE) to the child or student. Mediation is a third option available through which parents and school districts can try to resolve disputes and reach an agreement about any matter under Part B of IDEA, including matters arising prior to the filing of a due process complaint. The agreements reached through the mediation process are legally binding and enforceable. For more information about these and other procedural safeguards, go to http://ectacenter.org/topics/procsafe/procsafe.asp.
Unlike the other Part B data collections, which are associated with a specific group of Part B participants defined by the participants’ ages, the Part B dispute resolution data collection is associated with all children and students served under IDEA, Part B. These children and students include individuals ages 3 through 21, as well as older individuals, as States have the option of serving students 22 years of age and older. The Part B legal disputes and resolution data represent all complaints associated with any participant in Part B during the 12 months during which the data were collected.
10 A due process hearing is designed to be a fair, timely, and impartial procedure for resolving disputes that arise from parents
and public agencies regarding the education of children and students served under IDEA, Part B.

82
What were the statuses of the written, signed complaints that alleged a violation of a requirement of Part B of IDEA?
Exhibit 48. Percentage of written, signed complaints for children and students ages 3 through 21 served under IDEA, Part B, by complaint status: 2017–18
Complaints with reports issued(a)
(65.1%)
Complaints withdrawn or dismissed(b)
(32.1%)
Complaints pending(c)
(2.9%)
(a)A complaint with report issued refers to a written decision that was provided by the SEA to the complainant and public agency regarding alleged violations of a requirement of Part B of IDEA. (b)A complaint withdrawn or dismissed refers to a written, signed complaint that was withdrawn by the complainant for any reason or that was determined by the SEA to be resolved by the complainant and the public agency through mediation or other dispute resolution means, and no further action by the SEA was required to resolve the complaint, or it can refer to a complaint that was dismissed by the SEA for any reason, including that the complaint did not include all required content. (c)A complaint pending is a written, signed complaint that is still under investigation or for which the SEA’s written decision has not been issued. NOTE: A written, signed complaint is a signed document with specific content requirements that is submitted to the SEA by an individual or organization (i.e., complainant) that alleges a violation of a requirement of Part B of IDEA or 34 Code of Federal Regulations (C.F.R.) § 300, including cases in which some required content is absent from the document. Percentage was calculated by dividing the number of complaints in the status category by the total number of written, signed complaints, and then multiplying the result by 100. The 50 States, DC, BIE schools, PR, and one outlying area reported one or more complaints. Percentage was based on a total of 5,228 written, signed complaints. Data are from the reporting period between July 1, 2017, and June 30, 2018. SOURCE: U.S. Department of Education, EDFacts Metadata and Process System (EMAPS), OMB #1850-0925: IDEA Part B Dispute Resolution Survey, 2017–18. These data are for the 50 States, DC, BIE schools, PR, the four outlying areas, and the three freely associated states. Data were accessed fall 2019. For actual IDEA data used, go to https://www2.ed.gov/programs/osepidea/618-data/state-level-data-files/index.html.
• During 2017–18, a total of 5,228 written, signed complaints were received through the dispute resolution process for children and students ages 3 through 21 served under IDEA, Part B.
• A report was issued for 3,401 (65.1 percent) of the complaints, while 1,677 (32.1 percent) of the complaints were withdrawn or dismissed. A total of 150 (2.9 percent) of the complaints that were received during the 2017–18 reporting period were pending or unresolved by the end of the period.
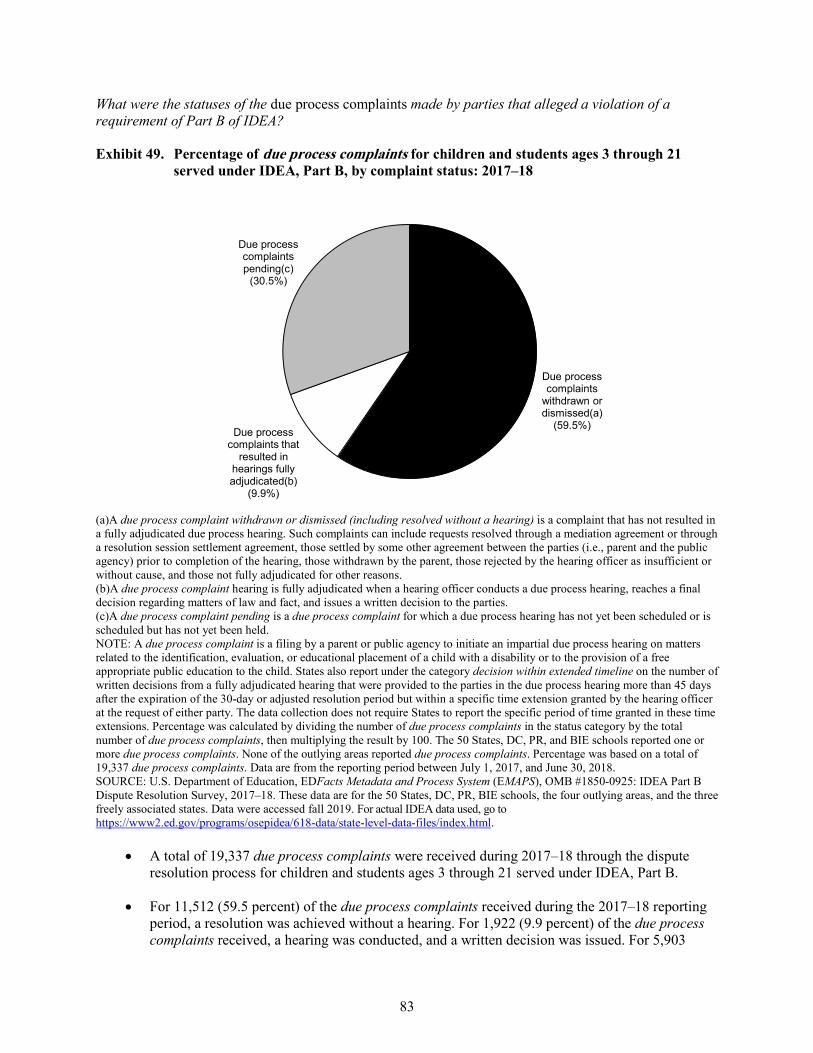
83
What were the statuses of the due process complaints made by parties that alleged a violation of a requirement of Part B of IDEA?
Exhibit 49. Percentage of due process complaints for children and students ages 3 through 21 served under IDEA, Part B, by complaint status: 2017–18
Due process complaints
withdrawn or dismissed(a)
(59.5%)Due process complaints that
resulted in hearings fully adjudicated(b)
(9.9%)
Due process complaints pending(c)
(30.5%)
(a)A due process complaint withdrawn or dismissed (including resolved without a hearing) is a complaint that has not resulted in a fully adjudicated due process hearing. Such complaints can include requests resolved through a mediation agreement or through a resolution session settlement agreement, those settled by some other agreement between the parties (i.e., parent and the public agency) prior to completion of the hearing, those withdrawn by the parent, those rejected by the hearing officer as insufficient or without cause, and those not fully adjudicated for other reasons. (b)A due process complaint hearing is fully adjudicated when a hearing officer conducts a due process hearing, reaches a final decision regarding matters of law and fact, and issues a written decision to the parties. (c)A due process complaint pending is a due process complaint for which a due process hearing has not yet been scheduled or is scheduled but has not yet been held. NOTE: A due process complaint is a filing by a parent or public agency to initiate an impartial due process hearing on matters related to the identification, evaluation, or educational placement of a child with a disability or to the provision of a free appropriate public education to the child. States also report under the category decision within extended timeline on the number of written decisions from a fully adjudicated hearing that were provided to the parties in the due process hearing more than 45 days after the expiration of the 30-day or adjusted resolution period but within a specific time extension granted by the hearing officer at the request of either party. The data collection does not require States to report the specific period of time granted in these time extensions. Percentage was calculated by dividing the number of due process complaints in the status category by the total number of due process complaints, then multiplying the result by 100. The 50 States, DC, PR, and BIE schools reported one or more due process complaints. None of the outlying areas reported due process complaints. Percentage was based on a total of 19,337 due process complaints. Data are from the reporting period between July 1, 2017, and June 30, 2018. SOURCE: U.S. Department of Education, EDFacts Metadata and Process System (EMAPS), OMB #1850-0925: IDEA Part B Dispute Resolution Survey, 2017–18. These data are for the 50 States, DC, PR, BIE schools, the four outlying areas, and the three freely associated states. Data were accessed fall 2019. For actual IDEA data used, go to https://www2.ed.gov/programs/osepidea/618-data/state-level-data-files/index.html.
• A total of 19,337 due process complaints were received during 2017–18 through the dispute resolution process for children and students ages 3 through 21 served under IDEA, Part B.
• For 11,512 (59.5 percent) of the due process complaints received during the 2017–18 reporting period, a resolution was achieved without a hearing. For 1,922 (9.9 percent) of the due process complaints received, a hearing was conducted, and a written decision was issued. For 5,903
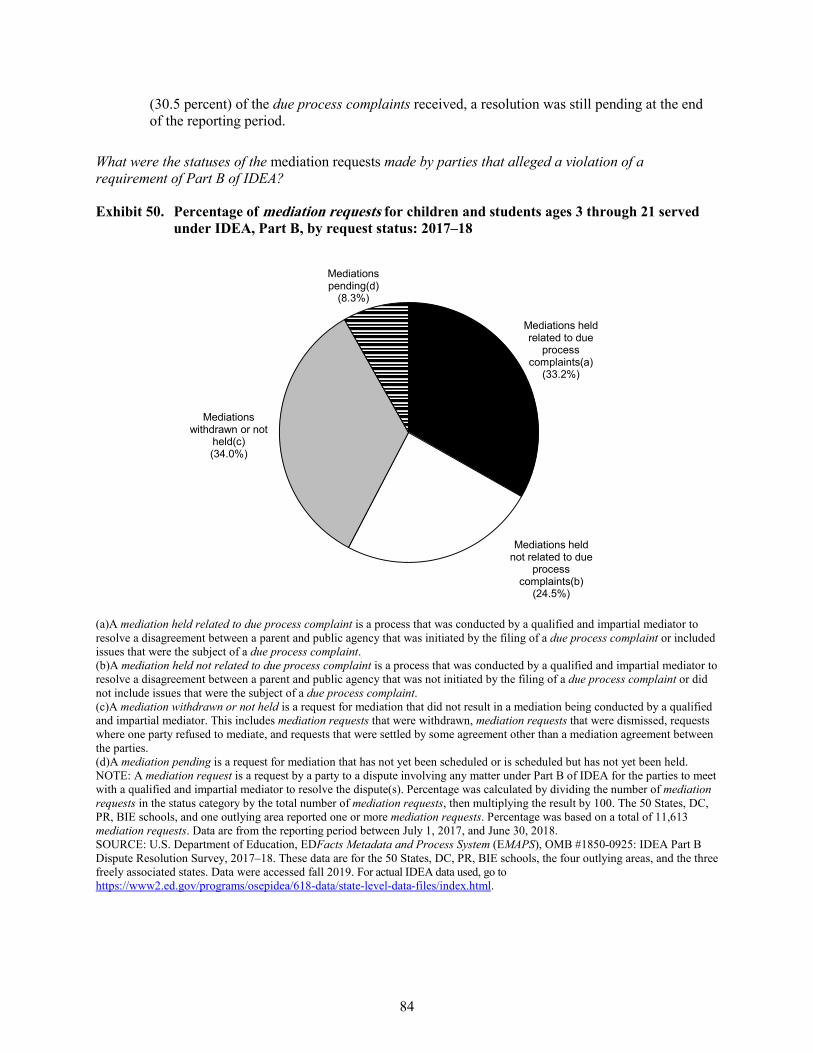
84
(30.5 percent) of the due process complaints received, a resolution was still pending at the end of the reporting period.
What were the statuses of the mediation requests made by parties that alleged a violation of a requirement of Part B of IDEA?
Exhibit 50. Percentage of mediation requests for children and students ages 3 through 21 served under IDEA, Part B, by request status: 2017–18
Mediations held related to due
process complaints(a)
(33.2%)
Mediations held not related to due
process complaints(b)
(24.5%)
Mediations withdrawn or not
held(c) (34.0%)
Mediations pending(d)
(8.3%)
(a)A mediation held related to due process complaint is a process that was conducted by a qualified and impartial mediator to resolve a disagreement between a parent and public agency that was initiated by the filing of a due process complaint or included issues that were the subject of a due process complaint. (b)A mediation held not related to due process complaint is a process that was conducted by a qualified and impartial mediator to resolve a disagreement between a parent and public agency that was not initiated by the filing of a due process complaint or did not include issues that were the subject of a due process complaint. (c)A mediation withdrawn or not held is a request for mediation that did not result in a mediation being conducted by a qualified and impartial mediator. This includes mediation requests that were withdrawn, mediation requests that were dismissed, requests where one party refused to mediate, and requests that were settled by some agreement other than a mediation agreement between the parties. (d)A mediation pending is a request for mediation that has not yet been scheduled or is scheduled but has not yet been held. NOTE: A mediation request is a request by a party to a dispute involving any matter under Part B of IDEA for the parties to meet with a qualified and impartial mediator to resolve the dispute(s). Percentage was calculated by dividing the number of mediation requests in the status category by the total number of mediation requests, then multiplying the result by 100. The 50 States, DC, PR, BIE schools, and one outlying area reported one or more mediation requests. Percentage was based on a total of 11,613 mediation requests. Data are from the reporting period between July 1, 2017, and June 30, 2018. SOURCE: U.S. Department of Education, EDFacts Metadata and Process System (EMAPS), OMB #1850-0925: IDEA Part B Dispute Resolution Survey, 2017–18. These data are for the 50 States, DC, PR, BIE schools, the four outlying areas, and the three freely associated states. Data were accessed fall 2019. For actual IDEA data used, go to https://www2.ed.gov/programs/osepidea/618-data/state-level-data-files/index.html.
85
• During 2017–18, a total of 11,613 mediation requests were received through the dispute resolution process for children and students ages 3 through 21 served under IDEA, Part B. For 3,861 (33.2 percent) of the mediation requests received, a mediation related to a due process complaint was conducted. For 2,844 (24.5 percent) of the mediation requests received, a mediation that was not related to a due process complaint was conducted. For 965 requests (8.3 percent), a mediation session was still pending as of the end of the 2017–18 reporting period. The remaining 3,943 mediation requests (34.0 percent) were withdrawn or otherwise not held by the end of the reporting period.
Coordinated Early Intervening Services
The Individuals with Disabilities Education Act (IDEA) was amended to allow, and sometimes require, local education agencies (LEAs) to reserve funds provided under Part B of IDEA for coordinated early intervening services (CEIS). This provision, which is found in Section 613(f) of IDEA [20 United States Code (U.S.C.) § 1413(f)] and the regulations in 34 Code of Federal Regulations (C.F.R.) § 300.226, permits LEAs to reserve Part B funds to develop and provide CEIS for students who are currently not identified as needing special education. The rationale for using IDEA funds for CEIS is based on research showing that the earlier a child’s learning problems or difficulties are identified, the more quickly and effectively the problems and difficulties can be addressed and the greater the chances that the child’s problems will be ameliorated or decreased in severity. Conversely, the longer a child goes without assistance, the longer the remediation time and the more intense and costly services might be.
An LEA can reserve up to 15 percent of the amount it receives under Part B of IDEA, less any amount reduced by the LEA pursuant to 34 C.F.R. § 300.205 (adjustment to local fiscal efforts), to develop and implement CEIS. However, an LEA is required to reserve 15 percent of the amount of funds available for comprehensive CEIS if there is significant disproportionality based on race or ethnicity with respect to the identification of children with disabilities; the identification of children in specific disability categories; the placement of children with disabilities in particular educational settings; or the incidence, duration, and type of disciplinary actions, including suspensions and expulsions (CEIS Guidance, http://www2.ed.gov/policy/speced/guid/idea/ceis.html, and Significant Disproportionality Essential Questions and Answers, https://sites.ed.gov/idea/files/significant-disproportionality-qa-03-08-17.pdf).
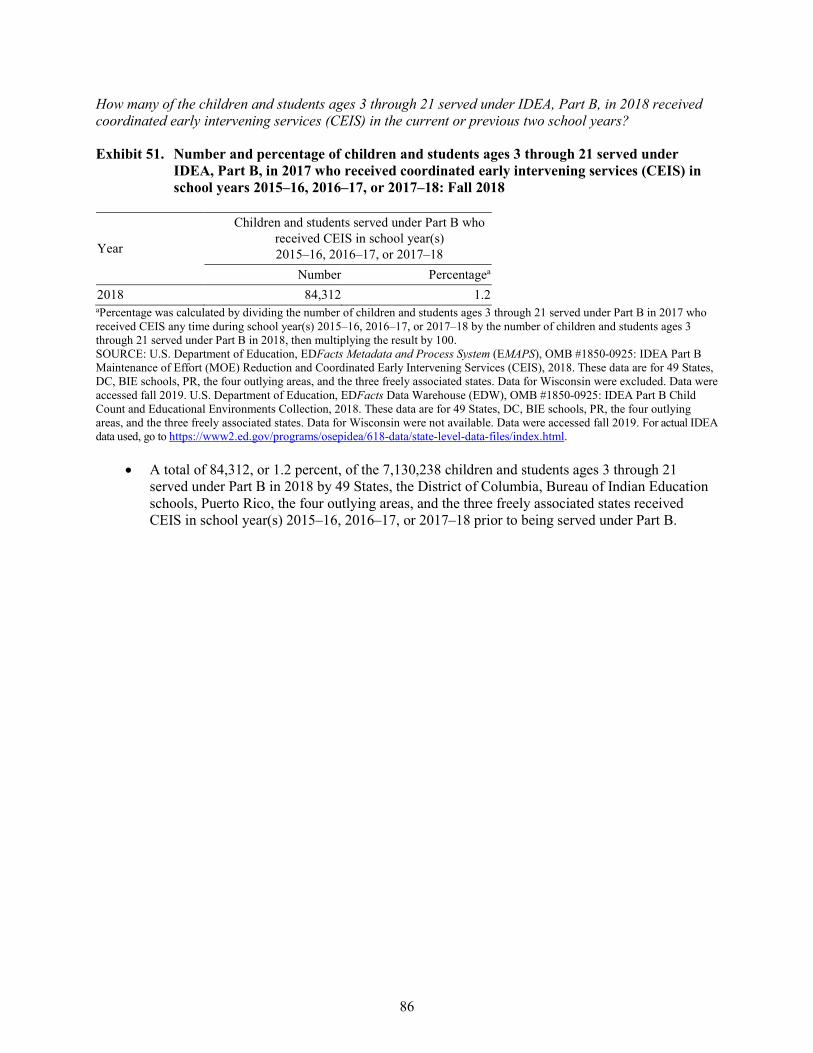
86
How many of the children and students ages 3 through 21 served under IDEA, Part B, in 2018 received coordinated early intervening services (CEIS) in the current or previous two school years?
Exhibit 51. Number and percentage of children and students ages 3 through 21 served under IDEA, Part B, in 2017 who received coordinated early intervening services (CEIS) in school years 2015–16, 2016–17, or 2017–18: Fall 2018
Year
Children and students served under Part B who received CEIS in school year(s) 2015–16, 2016–17, or 2017–18
Number Percentagea
2018 84,312 1.2 aPercentage was calculated by dividing the number of children and students ages 3 through 21 served under Part B in 2017 who received CEIS any time during school year(s) 2015–16, 2016–17, or 2017–18 by the number of children and students ages 3 through 21 served under Part B in 2018, then multiplying the result by 100. SOURCE: U.S. Department of Education, EDFacts Metadata and Process System (EMAPS), OMB #1850-0925: IDEA Part B Maintenance of Effort (MOE) Reduction and Coordinated Early Intervening Services (CEIS), 2018. These data are for 49 States, DC, BIE schools, PR, the four outlying areas, and the three freely associated states. Data for Wisconsin were excluded. Data were accessed fall 2019. U.S. Department of Education, EDFacts Data Warehouse (EDW), OMB #1850-0925: IDEA Part B Child Count and Educational Environments Collection, 2018. These data are for 49 States, DC, BIE schools, PR, the four outlying areas, and the three freely associated states. Data for Wisconsin were not available. Data were accessed fall 2019. For actual IDEA data used, go to https://www2.ed.gov/programs/osepidea/618-data/state-level-data-files/index.html.
• A total of 84,312, or 1.2 percent, of the 7,130,238 children and students ages 3 through 21 served under Part B in 2018 by 49 States, the District of Columbia, Bureau of Indian Education schools, Puerto Rico, the four outlying areas, and the three freely associated states received CEIS in school year(s) 2015–16, 2016–17, or 2017–18 prior to being served under Part B.
Section II
Summary and Analysis of IDEA Section 618 Data at the State Level

89
Introduction
This section of the 42nd Annual Report to Congress, 2020 addresses a set of questions developed by the U.S. Department of Education (Department) based on information requests made by the public. Consequently, this section shows the breadth and depth of information available and offers an examination of data elements addressing areas of particular interest.
The discussion in this section offers a different perspective from that presented in Section I, which features counts, percentages, and ratios that represent the nation as a whole. The measures in Section I for Part B and Part C represent the 50 States, the District of Columbia (DC), Puerto Rico (PR), and the four outlying areas of American Samoa, Guam, the Northern Mariana Islands, and the Virgin Islands; for Part B only, the measures usually also represent Bureau of Indian Education (BIE) schools and the three freely associated states: the Federated States of Micronesia, the Republic of Palau, and the Republic of the Marshall Islands. In contrast, the discussion in this section reflects a State-level perspective that features comparisons among the States for which data were available. The measures presented in this section do not include counts; they include only percentages and ratios and thereby provide a common basis for comparing the States. For Part B and Part C, these measures are based on data for the 50 States, the District of Columbia, and Puerto Rico; for Part B only, the measures usually also represent Bureau of Indian Education schools. They are referred to collectively as “All States” and individually by the term “State” in the exhibits and discussion. Consequently, the discussion may refer to as many as 53 individual “States” in total.
The objective of the analyses in this section is to examine similarities and differences among and within States for specific time periods. For some elements, data for two time periods for each State are presented and examined. In these cases, the analysis focuses on comparing data for the two time periods presented to determine what, if any, substantial change occurred. The more recent (comparison) time periods depicted in the State-level data exhibits are consistent with the more recent time periods depicted in the national-level data exhibits found in Section I. Earlier (baseline) time periods were selected for exhibits in this section to match with the first year of the 10-year trend window included in some exhibits in Section I (see “Data Sources Used in This Report”).
As was the case in Section I, any reference in this section to “early intervention services” is synonymous with services provided under the Individuals with Disabilities Education Act (IDEA), Part C.
90
Notes Concerning the Exhibits in Section II
The following will assist readers of this section:
1. Majority is defined as greater than 50 percent.
2. Exhibits presenting statistics based on resident population measures include data for Puerto Rico except when cross-tabulated by race/ethnicity, since the U.S. Census’ annual resident population estimates by race/ethnicity exclude residents of Puerto Rico. In addition, such exhibits concerning Part B information include data for Bureau of Indian Education schools. Specifically, these exhibits include data for Bureau of Indian Education schools in the measure presented for “All States.” They cannot, however, display data specifically for Bureau of Indian Education schools. The reason is that the resident population relevant for the Bureau of Indian Education schools, which have no distinct geographic boundaries, is dispersed throughout all of the States and counted as part of the resident populations of the individual States.
3. The four outlying areas and three freely associated states are not included in the exhibits in this section because data were frequently not available due to cell suppression or because data were not reported. For example, the U.S. Census’ annual population estimates exclude residents of these jurisdictions even though the most recent decennial census (collected in 2010) did include residents of the four outlying areas. The unavailability of annual population data results in an inability to calculate associated percentages.
4. The suppression of numerical data results in an inability to calculate associated percentages. Suppression of certain data occurs to limit disclosure of personally identifiable information consistent with Federal law. Under IDEA Section 618(b)(1), the data collected by the Department under IDEA Section 618(a) must be publicly reported by each State in a manner that does not result in the disclosure of data identifiable to individual children. Additionally, under 34 Code of Federal Regulations (C.F.R.) § 99.31(a)(3), subject to the requirements of Section 99.35 of the Family Educational Rights and Privacy Act (FERPA) regulations, authorized representatives of the Secretary may have access to personally identifiable information from students’ education records in connection with an audit or evaluation of Federal or State-supported education programs or for the enforcement of or compliance with Federal legal requirements that relate to those programs. However, under 34 C.F.R. § 99.35(b)(1) of the FERPA regulations, information collected by authorized representatives of the Secretary for these purposes must be protected in a manner that does not permit personal identification of individuals by anyone other than those officials. Such officials may make further disclosures of personally identifiable information from education records on behalf of the educational agency or institution in accordance with the requirements in 34 C.F.R. § 99.33(b). It is the policy of the Department to be consistent with the provisions of IDEA and FERPA privacy statutes and regulations. Each office in the Department has different purposes for its data collections. Therefore, each office develops its own approach to data presentation that ensures the protection of privacy while meeting the purposes of the data collection and the Department’s Information Quality Guidelines, which were developed as required by the Office of Management and Budget. The 2003–04 data presented in the 28th Annual Report to Congress, 2006 were the first data in these reports to which the Office of Special Education Programs (OSEP) applied its cell suppression policy.
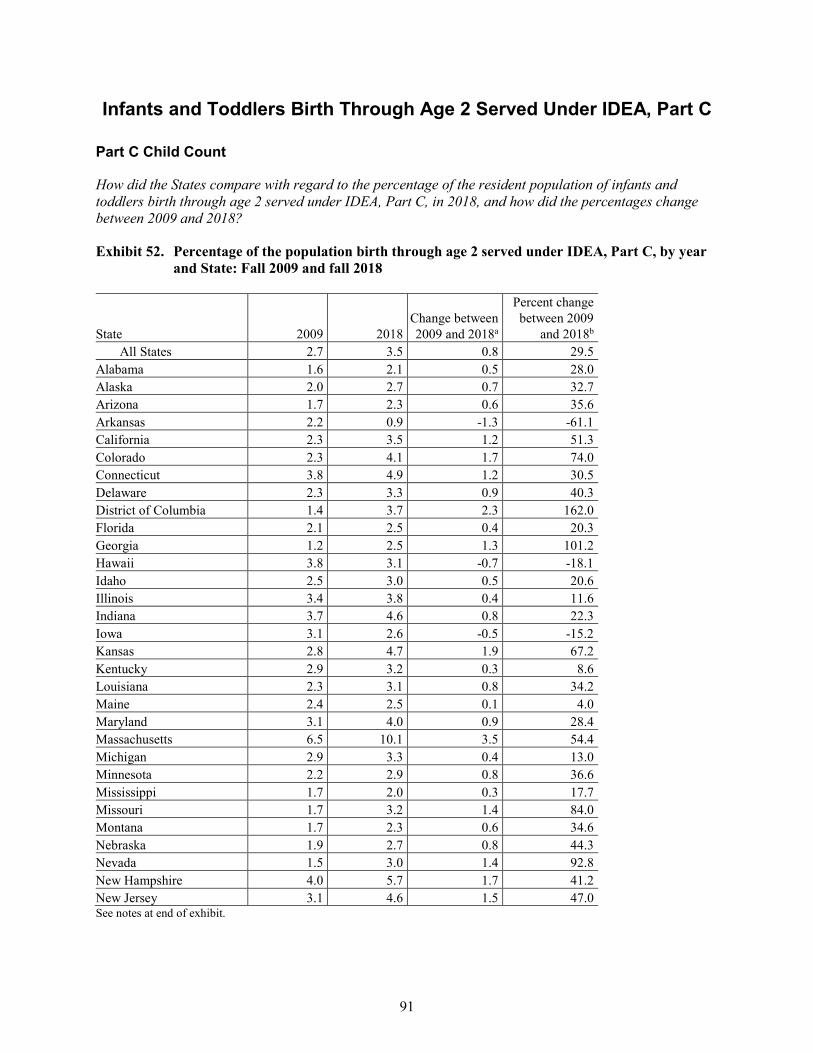
91
Infants and Toddlers Birth Through Age 2 Served Under IDEA, Part C
Part C Child Count
How did the States compare with regard to the percentage of the resident population of infants and toddlers birth through age 2 served under IDEA, Part C, in 2018, and how did the percentages change between 2009 and 2018?
Exhibit 52. Percentage of the population birth through age 2 served under IDEA, Part C, by year and State: Fall 2009 and fall 2018
State 2009 2018 Change between 2009 and 2018a
Percent change between 2009
and 2018b All States 2.7 3.5 0.8 29.5
Alabama 1.6 2.1 0.5 28.0 Alaska 2.0 2.7 0.7 32.7 Arizona 1.7 2.3 0.6 35.6 Arkansas 2.2 0.9 -1.3 -61.1 California 2.3 3.5 1.2 51.3 Colorado 2.3 4.1 1.7 74.0 Connecticut 3.8 4.9 1.2 30.5 Delaware 2.3 3.3 0.9 40.3 District of Columbia 1.4 3.7 2.3 162.0 Florida 2.1 2.5 0.4 20.3 Georgia 1.2 2.5 1.3 101.2 Hawaii 3.8 3.1 -0.7 -18.1 Idaho 2.5 3.0 0.5 20.6 Illinois 3.4 3.8 0.4 11.6 Indiana 3.7 4.6 0.8 22.3 Iowa 3.1 2.6 -0.5 -15.2 Kansas 2.8 4.7 1.9 67.2 Kentucky 2.9 3.2 0.3 8.6 Louisiana 2.3 3.1 0.8 34.2 Maine 2.4 2.5 0.1 4.0 Maryland 3.1 4.0 0.9 28.4 Massachusetts 6.5 10.1 3.5 54.4 Michigan 2.9 3.3 0.4 13.0 Minnesota 2.2 2.9 0.8 36.6 Mississippi 1.7 2.0 0.3 17.7 Missouri 1.7 3.2 1.4 84.0 Montana 1.7 2.3 0.6 34.6 Nebraska 1.9 2.7 0.8 44.3 Nevada 1.5 3.0 1.4 92.8 New Hampshire 4.0 5.7 1.7 41.2 New Jersey 3.1 4.6 1.5 47.0 See notes at end of exhibit.
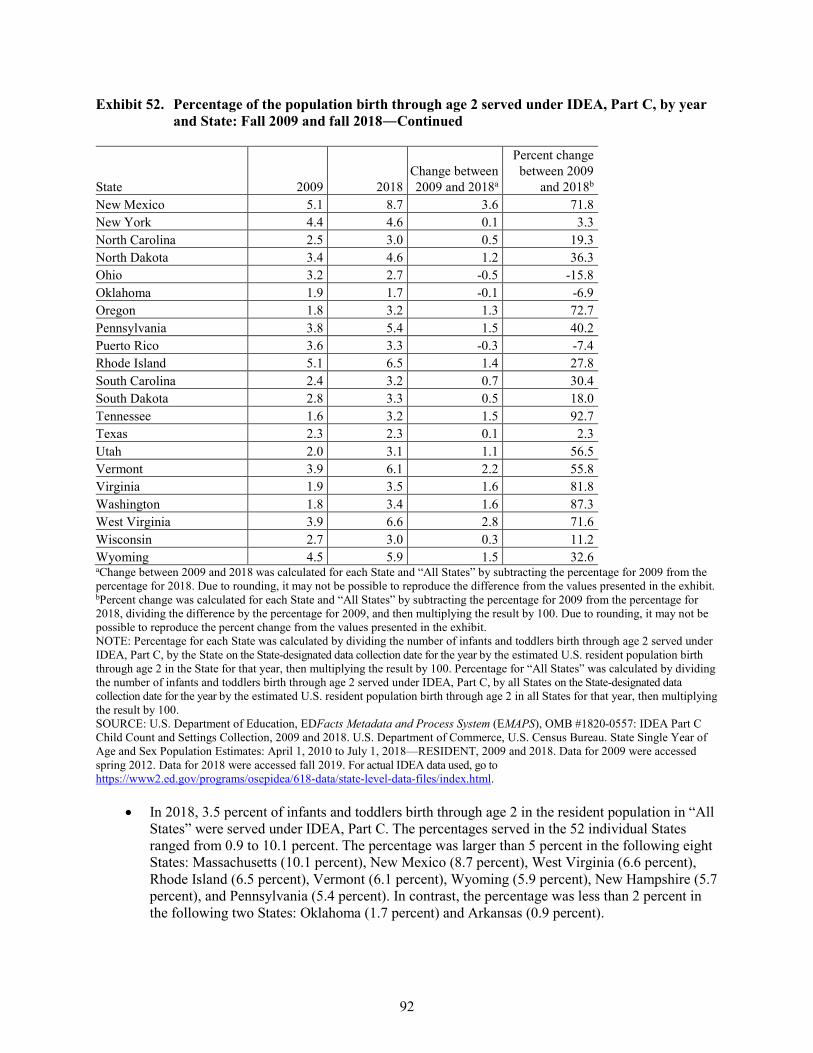
92
Exhibit 52. Percentage of the population birth through age 2 served under IDEA, Part C, by year and State: Fall 2009 and fall 2018―Continued
State 2009 2018 Change between 2009 and 2018a
Percent change between 2009
and 2018b New Mexico 5.1 8.7 3.6 71.8 New York 4.4 4.6 0.1 3.3 North Carolina 2.5 3.0 0.5 19.3 North Dakota 3.4 4.6 1.2 36.3 Ohio 3.2 2.7 -0.5 -15.8 Oklahoma 1.9 1.7 -0.1 -6.9 Oregon 1.8 3.2 1.3 72.7 Pennsylvania 3.8 5.4 1.5 40.2 Puerto Rico 3.6 3.3 -0.3 -7.4 Rhode Island 5.1 6.5 1.4 27.8 South Carolina 2.4 3.2 0.7 30.4 South Dakota 2.8 3.3 0.5 18.0 Tennessee 1.6 3.2 1.5 92.7 Texas 2.3 2.3 0.1 2.3 Utah 2.0 3.1 1.1 56.5 Vermont 3.9 6.1 2.2 55.8 Virginia 1.9 3.5 1.6 81.8 Washington 1.8 3.4 1.6 87.3 West Virginia 3.9 6.6 2.8 71.6 Wisconsin 2.7 3.0 0.3 11.2 Wyoming 4.5 5.9 1.5 32.6 aChange between 2009 and 2018 was calculated for each State and “All States” by subtracting the percentage for 2009 from the percentage for 2018. Due to rounding, it may not be possible to reproduce the difference from the values presented in the exhibit. bPercent change was calculated for each State and “All States” by subtracting the percentage for 2009 from the percentage for 2018, dividing the difference by the percentage for 2009, and then multiplying the result by 100. Due to rounding, it may not be possible to reproduce the percent change from the values presented in the exhibit. NOTE: Percentage for each State was calculated by dividing the number of infants and toddlers birth through age 2 served under IDEA, Part C, by the State on the State-designated data collection date for the year by the estimated U.S. resident population birth through age 2 in the State for that year, then multiplying the result by 100. Percentage for “All States” was calculated by dividing the number of infants and toddlers birth through age 2 served under IDEA, Part C, by all States on the State-designated data collection date for the year by the estimated U.S. resident population birth through age 2 in all States for that year, then multiplying the result by 100. SOURCE: U.S. Department of Education, EDFacts Metadata and Process System (EMAPS), OMB #1820-0557: IDEA Part C Child Count and Settings Collection, 2009 and 2018. U.S. Department of Commerce, U.S. Census Bureau. State Single Year of Age and Sex Population Estimates: April 1, 2010 to July 1, 2018—RESIDENT, 2009 and 2018. Data for 2009 were accessed spring 2012. Data for 2018 were accessed fall 2019. For actual IDEA data used, go to https://www2.ed.gov/programs/osepidea/618-data/state-level-data-files/index.html.
• In 2018, 3.5 percent of infants and toddlers birth through age 2 in the resident population in “All States” were served under IDEA, Part C. The percentages served in the 52 individual States ranged from 0.9 to 10.1 percent. The percentage was larger than 5 percent in the following eight States: Massachusetts (10.1 percent), New Mexico (8.7 percent), West Virginia (6.6 percent), Rhode Island (6.5 percent), Vermont (6.1 percent), Wyoming (5.9 percent), New Hampshire (5.7 percent), and Pennsylvania (5.4 percent). In contrast, the percentage was less than 2 percent in the following two States: Oklahoma (1.7 percent) and Arkansas (0.9 percent).
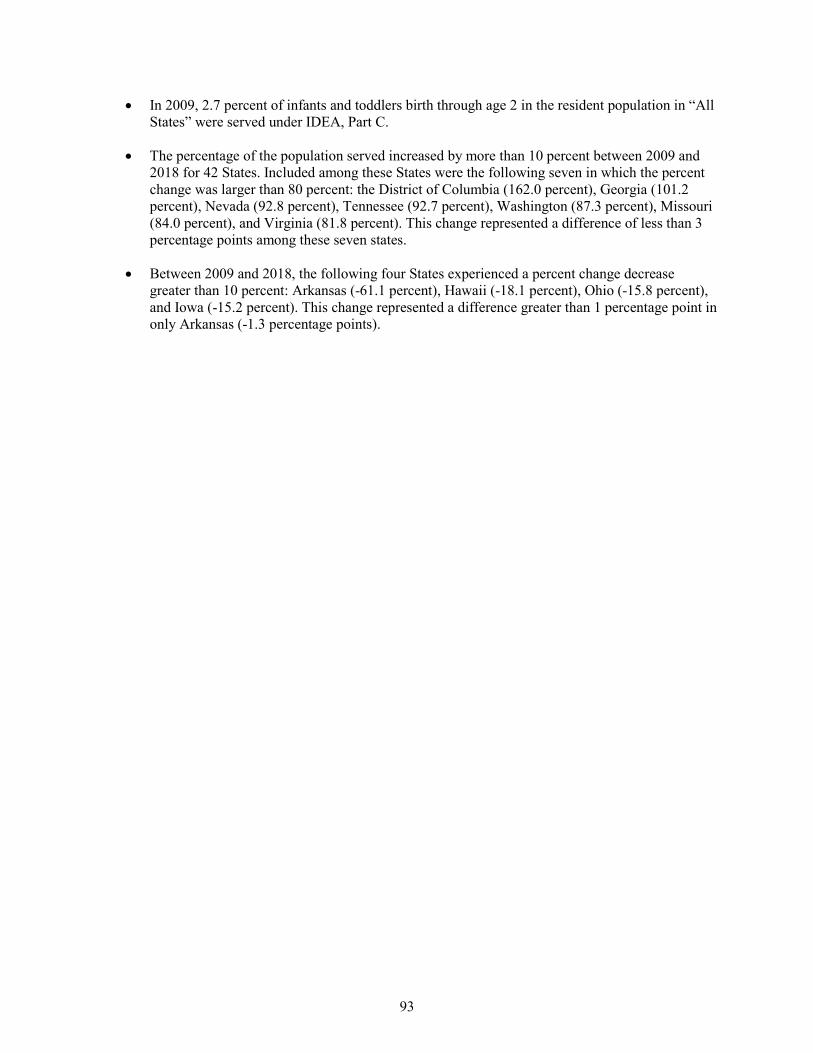
93
• In 2009, 2.7 percent of infants and toddlers birth through age 2 in the resident population in “All States” were served under IDEA, Part C.
• The percentage of the population served increased by more than 10 percent between 2009 and 2018 for 42 States. Included among these States were the following seven in which the percent change was larger than 80 percent: the District of Columbia (162.0 percent), Georgia (101.2 percent), Nevada (92.8 percent), Tennessee (92.7 percent), Washington (87.3 percent), Missouri (84.0 percent), and Virginia (81.8 percent). This change represented a difference of less than 3 percentage points among these seven states.
• Between 2009 and 2018, the following four States experienced a percent change decrease greater than 10 percent: Arkansas (-61.1 percent), Hawaii (-18.1 percent), Ohio (-15.8 percent), and Iowa (-15.2 percent). This change represented a difference greater than 1 percentage point in only Arkansas (-1.3 percentage points).
94
How did the States compare with regard to the percentage of the resident population birth through age 2 within each racial/ethnic group who were served under IDEA, Part C, in 2018?
Exhibit 53. Percentage of the population birth through age 2 served under IDEA, Part C, for each racial/ethnic group, by State: Fall 2018
State American Indian or
Alaska Native Asian
Black or African
American Hispanic/
Latino
Native Hawaiian or Other
Pacific Islander White
Two or more races
All States 3.1 3.1 3.1 3.5 4.6 3.6 3.0 Alabama 0.5 1.8 2.0 1.2 3.2 2.2 2.3 Alaska 3.9 1.1 2.1 1.8 2.4 2.8 2.0 Arizona 2.5 1.9 2.0 1.9 2.9 2.9 1.9 Arkansas 0.0 0.4 0.8 0.6 0.0 1.0 0.6 California 2.6 3.0 3.6 3.9 1.7 3.1 2.0 Colorado 2.0 3.9 3.8 3.8 7.7 4.4 2.6 Connecticut 2.5 3.3 4.4 6.1 25.0 4.8 2.9 Delaware x 3.2 3.4 3.5 x 3.3 1.4 District of Columbia x 1.8 4.7 3.3 18.8 x 4.6 Florida 2.3 2.0 2.5 3.0 2.2 2.1 2.0 Georgia 1.7 2.2 2.5 2.3 3.5 2.7 1.3 Hawaii x 4.2 x 1.9 2.8 3.1 3.3 Idaho 4.5 1.3 2.7 2.3 2.5 3.2 3.0 Illinois 0.5 2.4 3.4 4.1 3.7 4.0 3.0 Indiana 2.9 4.3 4.1 4.3 2.3 4.6 6.7 Iowa 3.2 2.8 2.8 2.8 3.0 2.5 3.8 Kansas 2.8 3.9 4.0 5.0 5.7 4.8 4.5 Kentucky 4.8 3.3 2.8 2.8 8.3 3.2 3.7 Louisiana 1.0 2.6 3.6 2.1 4.9 2.8 3.9 Maine 2.1 3.4 3.6 2.4 0.0 2.4 2.9 Maryland 1.6 3.6 4.0 3.7 3.6 4.1 4.5 Massachusetts 7.2 8.7 10.8 11.7 16.9 9.6 8.5 Michigan 3.8 2.6 3.0 2.5 5.6 3.6 1.6 Minnesota 4.6 2.6 2.8 3.0 3.1 3.0 2.4 Mississippi x 2.2 2.0 0.9 x 2.0 1.9 Missouri 1.7 3.1 3.5 3.0 2.9 3.1 2.7 Montana 4.0 1.9 5.4 1.6 17.9 2.1 1.9 Nebraska 3.3 2.3 2.1 2.4 5.0 2.9 1.8 Nevada 1.5 2.7 2.7 2.8 1.9 3.3 3.3 New Hampshire 4.5 3.8 3.5 3.6 21.1 5.9 7.3 New Jersey 6.2 4.4 3.9 4.7 14.9 4.7 6.0 New Mexico 5.8 7.0 8.5 10.0 8.0 7.2 5.0 New York 4.2 3.6 3.4 4.2 77.9 5.5 1.5 North Carolina 3.0 2.4 3.2 3.0 2.0 3.0 1.6 See notes at end of exhibit.
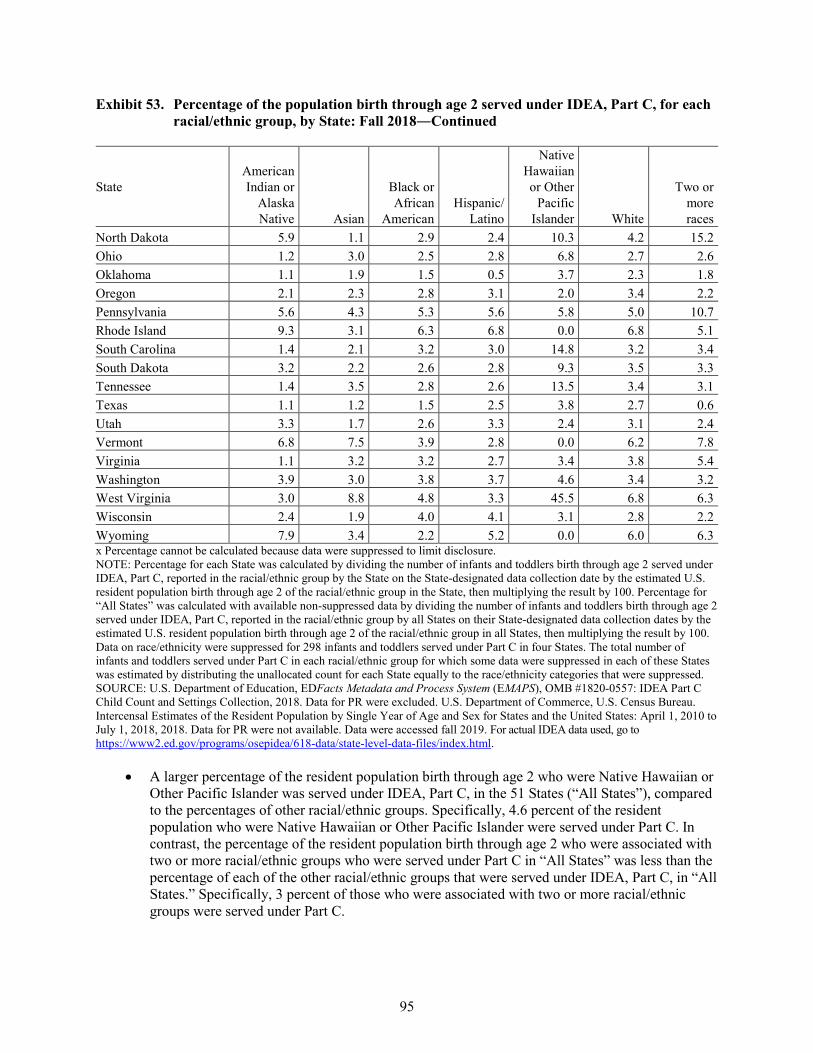
95
Exhibit 53. Percentage of the population birth through age 2 served under IDEA, Part C, for each racial/ethnic group, by State: Fall 2018―Continued
State American Indian or
Alaska Native Asian
Black or African
American Hispanic/
Latino
Native Hawaiian or Other
Pacific Islander White
Two or more races
North Dakota 5.9 1.1 2.9 2.4 10.3 4.2 15.2 Ohio 1.2 3.0 2.5 2.8 6.8 2.7 2.6 Oklahoma 1.1 1.9 1.5 0.5 3.7 2.3 1.8 Oregon 2.1 2.3 2.8 3.1 2.0 3.4 2.2 Pennsylvania 5.6 4.3 5.3 5.6 5.8 5.0 10.7 Rhode Island 9.3 3.1 6.3 6.8 0.0 6.8 5.1 South Carolina 1.4 2.1 3.2 3.0 14.8 3.2 3.4 South Dakota 3.2 2.2 2.6 2.8 9.3 3.5 3.3 Tennessee 1.4 3.5 2.8 2.6 13.5 3.4 3.1 Texas 1.1 1.2 1.5 2.5 3.8 2.7 0.6 Utah 3.3 1.7 2.6 3.3 2.4 3.1 2.4 Vermont 6.8 7.5 3.9 2.8 0.0 6.2 7.8 Virginia 1.1 3.2 3.2 2.7 3.4 3.8 5.4 Washington 3.9 3.0 3.8 3.7 4.6 3.4 3.2 West Virginia 3.0 8.8 4.8 3.3 45.5 6.8 6.3 Wisconsin 2.4 1.9 4.0 4.1 3.1 2.8 2.2 Wyoming 7.9 3.4 2.2 5.2 0.0 6.0 6.3 x Percentage cannot be calculated because data were suppressed to limit disclosure. NOTE: Percentage for each State was calculated by dividing the number of infants and toddlers birth through age 2 served under IDEA, Part C, reported in the racial/ethnic group by the State on the State-designated data collection date by the estimated U.S. resident population birth through age 2 of the racial/ethnic group in the State, then multiplying the result by 100. Percentage for “All States” was calculated with available non-suppressed data by dividing the number of infants and toddlers birth through age 2 served under IDEA, Part C, reported in the racial/ethnic group by all States on their State-designated data collection dates by the estimated U.S. resident population birth through age 2 of the racial/ethnic group in all States, then multiplying the result by 100. Data on race/ethnicity were suppressed for 298 infants and toddlers served under Part C in four States. The total number of infants and toddlers served under Part C in each racial/ethnic group for which some data were suppressed in each of these States was estimated by distributing the unallocated count for each State equally to the race/ethnicity categories that were suppressed. SOURCE: U.S. Department of Education, EDFacts Metadata and Process System (EMAPS), OMB #1820-0557: IDEA Part C Child Count and Settings Collection, 2018. Data for PR were excluded. U.S. Department of Commerce, U.S. Census Bureau. Intercensal Estimates of the Resident Population by Single Year of Age and Sex for States and the United States: April 1, 2010 to July 1, 2018, 2018. Data for PR were not available. Data were accessed fall 2019. For actual IDEA data used, go to https://www2.ed.gov/programs/osepidea/618-data/state-level-data-files/index.html.
• A larger percentage of the resident population birth through age 2 who were Native Hawaiian or Other Pacific Islander was served under IDEA, Part C, in the 51 States (“All States”), compared to the percentages of other racial/ethnic groups. Specifically, 4.6 percent of the resident population who were Native Hawaiian or Other Pacific Islander were served under Part C. In contrast, the percentage of the resident population birth through age 2 who were associated with two or more racial/ethnic groups who were served under Part C in “All States” was less than the percentage of each of the other racial/ethnic groups that were served under IDEA, Part C, in “All States.” Specifically, 3 percent of those who were associated with two or more racial/ethnic groups were served under Part C.
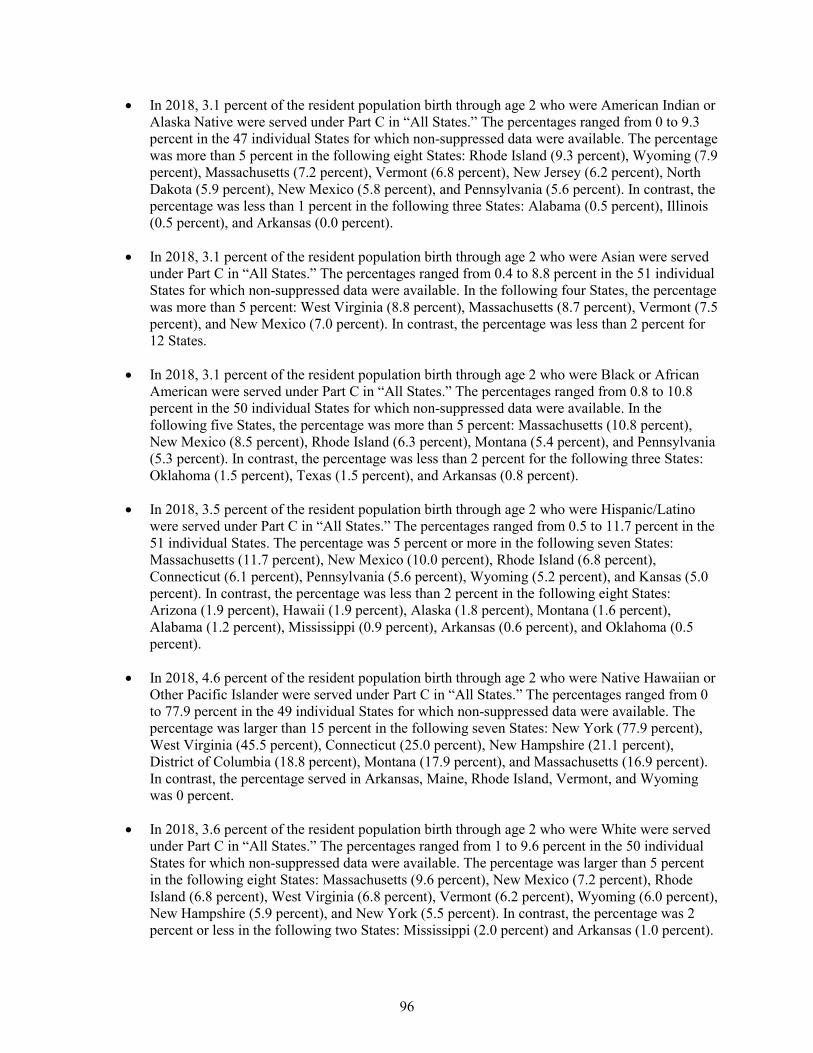
96
• In 2018, 3.1 percent of the resident population birth through age 2 who were American Indian or Alaska Native were served under Part C in “All States.” The percentages ranged from 0 to 9.3 percent in the 47 individual States for which non-suppressed data were available. The percentage was more than 5 percent in the following eight States: Rhode Island (9.3 percent), Wyoming (7.9 percent), Massachusetts (7.2 percent), Vermont (6.8 percent), New Jersey (6.2 percent), North Dakota (5.9 percent), New Mexico (5.8 percent), and Pennsylvania (5.6 percent). In contrast, the percentage was less than 1 percent in the following three States: Alabama (0.5 percent), Illinois (0.5 percent), and Arkansas (0.0 percent).
• In 2018, 3.1 percent of the resident population birth through age 2 who were Asian were served under Part C in “All States.” The percentages ranged from 0.4 to 8.8 percent in the 51 individual States for which non-suppressed data were available. In the following four States, the percentage was more than 5 percent: West Virginia (8.8 percent), Massachusetts (8.7 percent), Vermont (7.5 percent), and New Mexico (7.0 percent). In contrast, the percentage was less than 2 percent for 12 States.
• In 2018, 3.1 percent of the resident population birth through age 2 who were Black or African American were served under Part C in “All States.” The percentages ranged from 0.8 to 10.8 percent in the 50 individual States for which non-suppressed data were available. In the following five States, the percentage was more than 5 percent: Massachusetts (10.8 percent), New Mexico (8.5 percent), Rhode Island (6.3 percent), Montana (5.4 percent), and Pennsylvania (5.3 percent). In contrast, the percentage was less than 2 percent for the following three States: Oklahoma (1.5 percent), Texas (1.5 percent), and Arkansas (0.8 percent).
• In 2018, 3.5 percent of the resident population birth through age 2 who were Hispanic/Latino were served under Part C in “All States.” The percentages ranged from 0.5 to 11.7 percent in the 51 individual States. The percentage was 5 percent or more in the following seven States: Massachusetts (11.7 percent), New Mexico (10.0 percent), Rhode Island (6.8 percent), Connecticut (6.1 percent), Pennsylvania (5.6 percent), Wyoming (5.2 percent), and Kansas (5.0 percent). In contrast, the percentage was less than 2 percent in the following eight States: Arizona (1.9 percent), Hawaii (1.9 percent), Alaska (1.8 percent), Montana (1.6 percent), Alabama (1.2 percent), Mississippi (0.9 percent), Arkansas (0.6 percent), and Oklahoma (0.5 percent).
• In 2018, 4.6 percent of the resident population birth through age 2 who were Native Hawaiian or Other Pacific Islander were served under Part C in “All States.” The percentages ranged from 0 to 77.9 percent in the 49 individual States for which non-suppressed data were available. The percentage was larger than 15 percent in the following seven States: New York (77.9 percent), West Virginia (45.5 percent), Connecticut (25.0 percent), New Hampshire (21.1 percent), District of Columbia (18.8 percent), Montana (17.9 percent), and Massachusetts (16.9 percent). In contrast, the percentage served in Arkansas, Maine, Rhode Island, Vermont, and Wyoming was 0 percent.
• In 2018, 3.6 percent of the resident population birth through age 2 who were White were served under Part C in “All States.” The percentages ranged from 1 to 9.6 percent in the 50 individual States for which non-suppressed data were available. The percentage was larger than 5 percent in the following eight States: Massachusetts (9.6 percent), New Mexico (7.2 percent), Rhode Island (6.8 percent), West Virginia (6.8 percent), Vermont (6.2 percent), Wyoming (6.0 percent), New Hampshire (5.9 percent), and New York (5.5 percent). In contrast, the percentage was 2 percent or less in the following two States: Mississippi (2.0 percent) and Arkansas (1.0 percent).
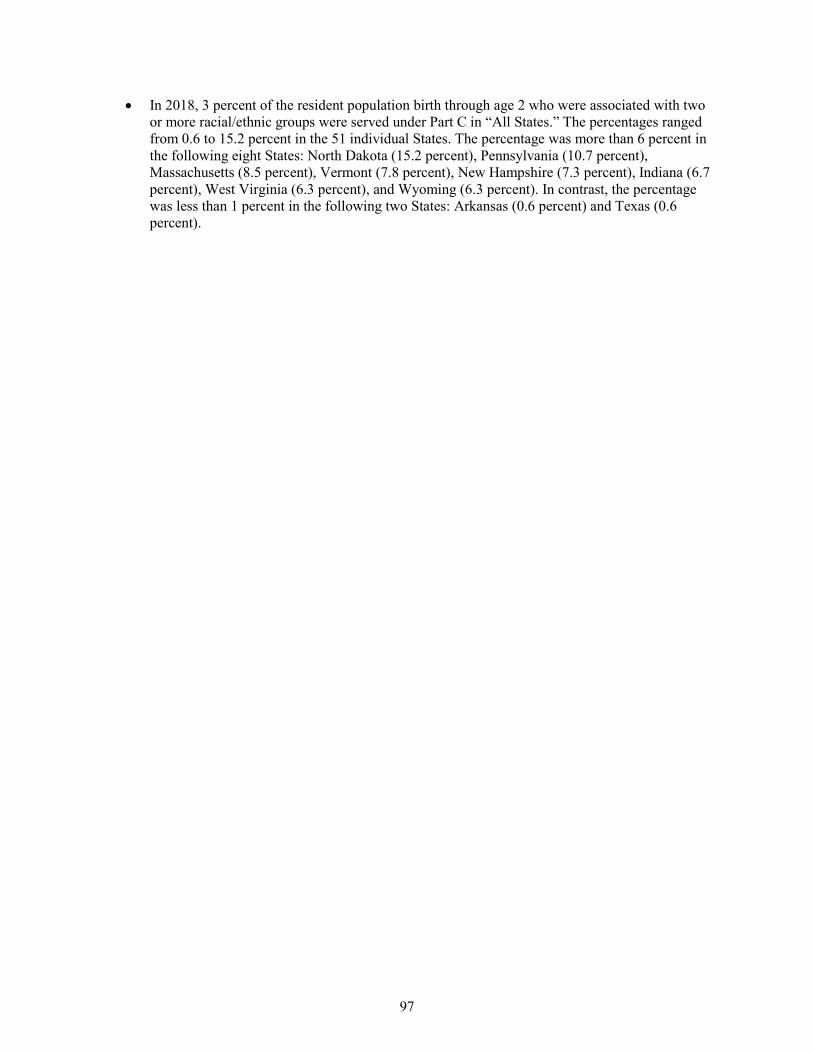
97
• In 2018, 3 percent of the resident population birth through age 2 who were associated with two or more racial/ethnic groups were served under Part C in “All States.” The percentages ranged from 0.6 to 15.2 percent in the 51 individual States. The percentage was more than 6 percent in the following eight States: North Dakota (15.2 percent), Pennsylvania (10.7 percent), Massachusetts (8.5 percent), Vermont (7.8 percent), New Hampshire (7.3 percent), Indiana (6.7 percent), West Virginia (6.3 percent), and Wyoming (6.3 percent). In contrast, the percentage was less than 1 percent in the following two States: Arkansas (0.6 percent) and Texas (0.6 percent).
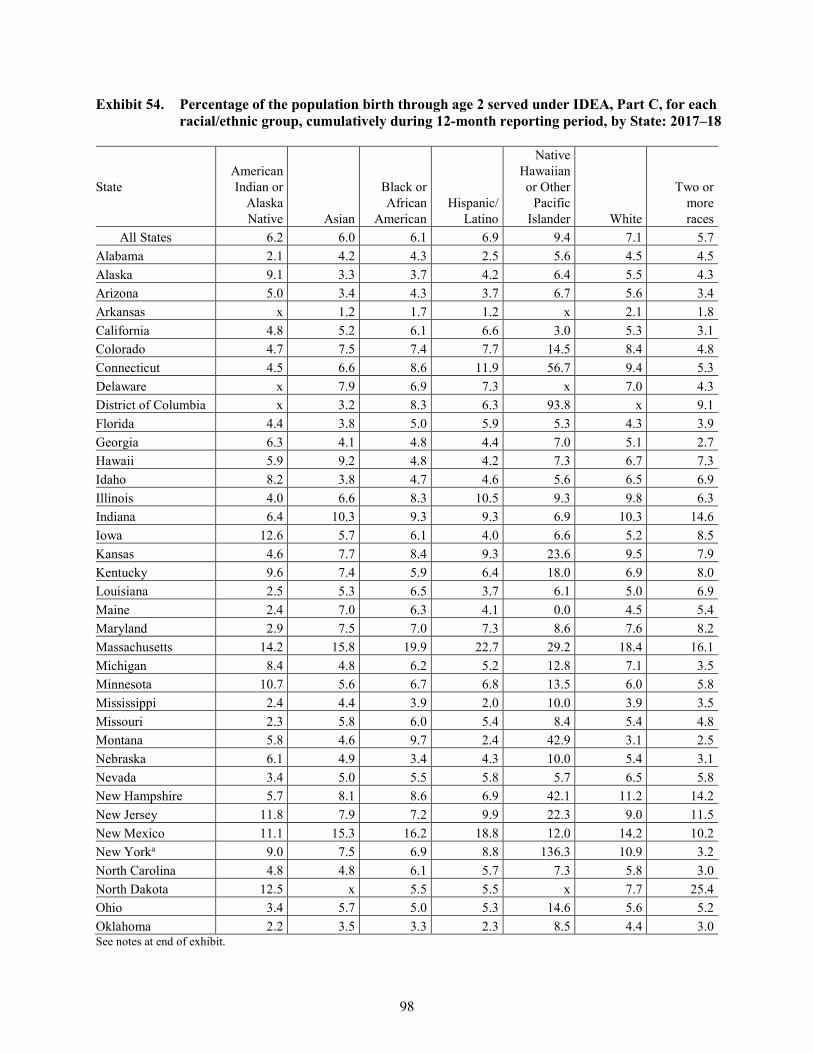
98
Exhibit 54. Percentage of the population birth through age 2 served under IDEA, Part C, for each racial/ethnic group, cumulatively during 12-month reporting period, by State: 2017–18
State American Indian or
Alaska Native Asian
Black or African
American Hispanic/
Latino
Native Hawaiian or Other
Pacific Islander White
Two or more races
All States 6.2 6.0 6.1 6.9 9.4 7.1 5.7 Alabama 2.1 4.2 4.3 2.5 5.6 4.5 4.5 Alaska 9.1 3.3 3.7 4.2 6.4 5.5 4.3 Arizona 5.0 3.4 4.3 3.7 6.7 5.6 3.4 Arkansas x 1.2 1.7 1.2 x 2.1 1.8 California 4.8 5.2 6.1 6.6 3.0 5.3 3.1 Colorado 4.7 7.5 7.4 7.7 14.5 8.4 4.8 Connecticut 4.5 6.6 8.6 11.9 56.7 9.4 5.3 Delaware x 7.9 6.9 7.3 x 7.0 4.3 District of Columbia x 3.2 8.3 6.3 93.8 x 9.1 Florida 4.4 3.8 5.0 5.9 5.3 4.3 3.9 Georgia 6.3 4.1 4.8 4.4 7.0 5.1 2.7 Hawaii 5.9 9.2 4.8 4.2 7.3 6.7 7.3 Idaho 8.2 3.8 4.7 4.6 5.6 6.5 6.9 Illinois 4.0 6.6 8.3 10.5 9.3 9.8 6.3 Indiana 6.4 10.3 9.3 9.3 6.9 10.3 14.6 Iowa 12.6 5.7 6.1 4.0 6.6 5.2 8.5 Kansas 4.6 7.7 8.4 9.3 23.6 9.5 7.9 Kentucky 9.6 7.4 5.9 6.4 18.0 6.9 8.0 Louisiana 2.5 5.3 6.5 3.7 6.1 5.0 6.9 Maine 2.4 7.0 6.3 4.1 0.0 4.5 5.4 Maryland 2.9 7.5 7.0 7.3 8.6 7.6 8.2 Massachusetts 14.2 15.8 19.9 22.7 29.2 18.4 16.1 Michigan 8.4 4.8 6.2 5.2 12.8 7.1 3.5 Minnesota 10.7 5.6 6.7 6.8 13.5 6.0 5.8 Mississippi 2.4 4.4 3.9 2.0 10.0 3.9 3.5 Missouri 2.3 5.8 6.0 5.4 8.4 5.4 4.8 Montana 5.8 4.6 9.7 2.4 42.9 3.1 2.5 Nebraska 6.1 4.9 3.4 4.3 10.0 5.4 3.1 Nevada 3.4 5.0 5.5 5.8 5.7 6.5 5.8 New Hampshire 5.7 8.1 8.6 6.9 42.1 11.2 14.2 New Jersey 11.8 7.9 7.2 9.9 22.3 9.0 11.5 New Mexico 11.1 15.3 16.2 18.8 12.0 14.2 10.2 New Yorka 9.0 7.5 6.9 8.8 136.3 10.9 3.2 North Carolina 4.8 4.8 6.1 5.7 7.3 5.8 3.0 North Dakota 12.5 x 5.5 5.5 x 7.7 25.4 Ohio 3.4 5.7 5.0 5.3 14.6 5.6 5.2 Oklahoma 2.2 3.5 3.3 2.3 8.5 4.4 3.0 See notes at end of exhibit.
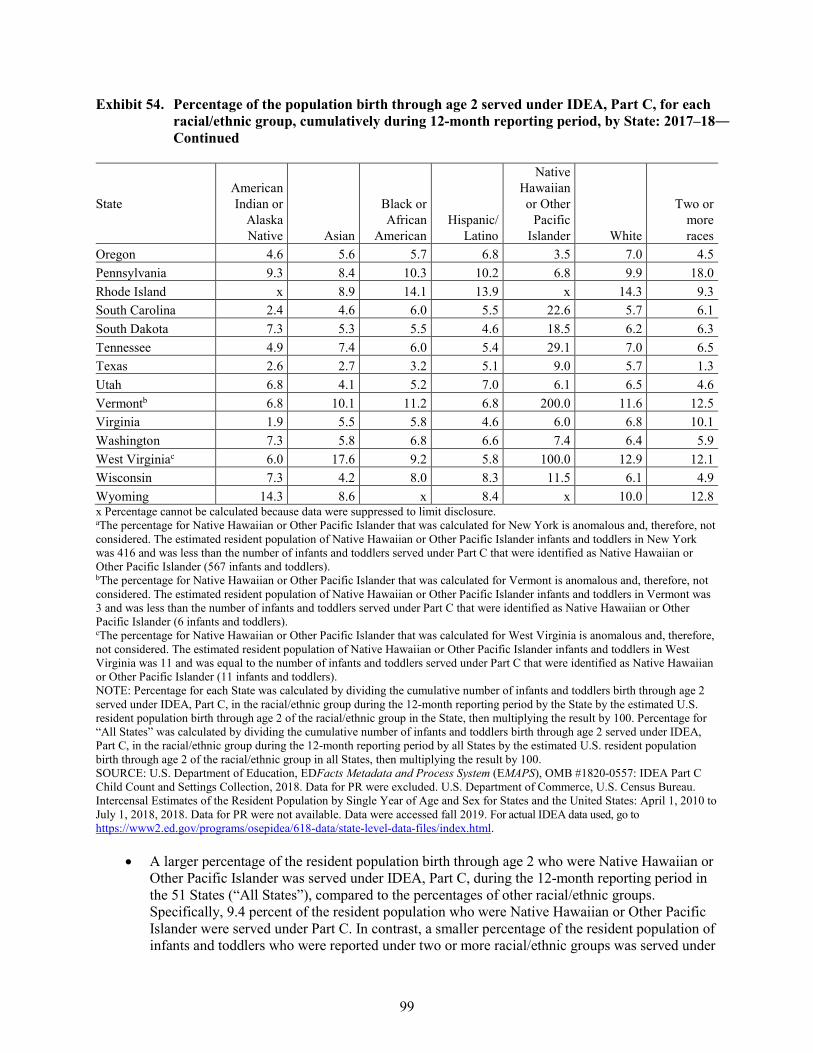
99
Exhibit 54. Percentage of the population birth through age 2 served under IDEA, Part C, for each racial/ethnic group, cumulatively during 12-month reporting period, by State: 2017–18― Continued
State American Indian or
Alaska Native Asian
Black or African
American Hispanic/
Latino
Native Hawaiian or Other
Pacific Islander White
Two or more races
Oregon 4.6 5.6 5.7 6.8 3.5 7.0 4.5 Pennsylvania 9.3 8.4 10.3 10.2 6.8 9.9 18.0 Rhode Island x 8.9 14.1 13.9 x 14.3 9.3 South Carolina 2.4 4.6 6.0 5.5 22.6 5.7 6.1 South Dakota 7.3 5.3 5.5 4.6 18.5 6.2 6.3 Tennessee 4.9 7.4 6.0 5.4 29.1 7.0 6.5 Texas 2.6 2.7 3.2 5.1 9.0 5.7 1.3 Utah 6.8 4.1 5.2 7.0 6.1 6.5 4.6 Vermontb 6.8 10.1 11.2 6.8 200.0 11.6 12.5 Virginia 1.9 5.5 5.8 4.6 6.0 6.8 10.1 Washington 7.3 5.8 6.8 6.6 7.4 6.4 5.9 West Virginiac 6.0 17.6 9.2 5.8 100.0 12.9 12.1 Wisconsin 7.3 4.2 8.0 8.3 11.5 6.1 4.9 Wyoming 14.3 8.6 x 8.4 x 10.0 12.8 x Percentage cannot be calculated because data were suppressed to limit disclosure. aThe percentage for Native Hawaiian or Other Pacific Islander that was calculated for New York is anomalous and, therefore, not considered. The estimated resident population of Native Hawaiian or Other Pacific Islander infants and toddlers in New York was 416 and was less than the number of infants and toddlers served under Part C that were identified as Native Hawaiian or Other Pacific Islander (567 infants and toddlers). bThe percentage for Native Hawaiian or Other Pacific Islander that was calculated for Vermont is anomalous and, therefore, not considered. The estimated resident population of Native Hawaiian or Other Pacific Islander infants and toddlers in Vermont was 3 and was less than the number of infants and toddlers served under Part C that were identified as Native Hawaiian or Other Pacific Islander (6 infants and toddlers). cThe percentage for Native Hawaiian or Other Pacific Islander that was calculated for West Virginia is anomalous and, therefore, not considered. The estimated resident population of Native Hawaiian or Other Pacific Islander infants and toddlers in West Virginia was 11 and was equal to the number of infants and toddlers served under Part C that were identified as Native Hawaiian or Other Pacific Islander (11 infants and toddlers). NOTE: Percentage for each State was calculated by dividing the cumulative number of infants and toddlers birth through age 2 served under IDEA, Part C, in the racial/ethnic group during the 12-month reporting period by the State by the estimated U.S. resident population birth through age 2 of the racial/ethnic group in the State, then multiplying the result by 100. Percentage for “All States” was calculated by dividing the cumulative number of infants and toddlers birth through age 2 served under IDEA, Part C, in the racial/ethnic group during the 12-month reporting period by all States by the estimated U.S. resident population birth through age 2 of the racial/ethnic group in all States, then multiplying the result by 100. SOURCE: U.S. Department of Education, EDFacts Metadata and Process System (EMAPS), OMB #1820-0557: IDEA Part C Child Count and Settings Collection, 2018. Data for PR were excluded. U.S. Department of Commerce, U.S. Census Bureau. Intercensal Estimates of the Resident Population by Single Year of Age and Sex for States and the United States: April 1, 2010 to July 1, 2018, 2018. Data for PR were not available. Data were accessed fall 2019. For actual IDEA data used, go to https://www2.ed.gov/programs/osepidea/618-data/state-level-data-files/index.html.
• A larger percentage of the resident population birth through age 2 who were Native Hawaiian or Other Pacific Islander was served under IDEA, Part C, during the 12-month reporting period in the 51 States (“All States”), compared to the percentages of other racial/ethnic groups. Specifically, 9.4 percent of the resident population who were Native Hawaiian or Other Pacific Islander were served under Part C. In contrast, a smaller percentage of the resident population of infants and toddlers who were reported under two or more racial/ethnic groups was served under
100
IDEA, Part C, in “All States,” compared to the percentages of other racial/ethnic groups. Specifically, 5.7 percent who were associated with two or more racial/ethnic groups were served under Part C.
• In 2017–18, 6.2 percent of the resident population birth through age 2 who were American Indian or Alaska Native were served under Part C during the 12-month reporting period in “All States.” The percentages ranged from 1.9 to 14.3 percent in the 48 individual States for which non-suppressed data were available. The percentage was larger than 10 percent in the following seven States: Wyoming (14.3 percent), Massachusetts (14.2 percent), Iowa (12.6 percent), North Dakota (12.5 percent), New Jersey (11.8 percent), New Mexico (11.1 percent), and Minnesota (10.7 percent). In contrast, less than 3 percent were served in the following 10 States: Maryland (2.9 percent), Texas (2.6 percent), Louisiana (2.5 percent), Maine (2.4 percent), Mississippi (2.4 percent), South Carolina (2.4 percent), Missouri (2.3 percent), Oklahoma (2.2 percent), Alabama (2.1 percent), and Virginia (1.9 percent).
• In 2017–18, 6 percent of the resident population birth through age 2 who were Asian were served under Part C during the 12-month reporting period in “All States.” The percentages ranged from 1.2 percent to 17.6 percent in the 50 individual States for which non-suppressed data were available. The percentage was more than 10 percent in the following five States: West Virginia (17.6 percent), Massachusetts (15.8 percent), New Mexico (15.3 percent), Indiana (10.3 percent), and Vermont (10.1 percent). In contrast, less than 3 percent were served in the following two States: Texas (2.7 percent) and Arkansas (1.2 percent).
• In 2017–18, 6.1 percent of the resident population birth through age 2 who were Black or African American were served under Part C during the 12-month reporting period in “All States.” The percentages ranged from 1.7 to 19.9 percent in the 50 individual States for which non-suppressed data were available. In the following five States, the percentage was more than 10 percent: Massachusetts (19.9 percent), New Mexico (16.2 percent), Rhode Island (14.1 percent), Vermont (11.2 percent), and Pennsylvania (10.3 percent). In contrast, the percentage was less than 4 percent in the following six States: Mississippi (3.9 percent), Alaska (3.7 percent), Nebraska (3.4 percent), Oklahoma (3.3 percent), Texas (3.2 percent), and Arkansas (1.7 percent).
• In 2017–18, 6.9 percent of the resident population birth through age 2 who were Hispanic/Latino were served under Part C during the 12-month reporting period in “All States.” The percentages ranged from 1.2 to 22.7 percent in the 51 individual States. The percentage was larger than 10 percent in the following six States: Massachusetts (22.7 percent), New Mexico (18.8 percent), Rhode Island (13.9 percent), Connecticut (11.9 percent), Illinois (10.5 percent), and Pennsylvania (10.2 percent). In contrast, the percentage was less than 3 percent in the following five States: Alabama (2.5 percent), Montana (2.4 percent), Oklahoma (2.3 percent), Mississippi (2.0 percent), and Arkansas (1.2 percent).
• In 2017–18, 9.4 percent of the resident population birth through age 2 who were Native Hawaiian or Other Pacific Islander were served under Part C during the 12-month reporting period in “All States.” The percentages ranged from 0 to 93.8 percent in the 44 individual States for which non-suppressed data were available.11 The percentage was larger than 40 percent in
11 The percentages calculated for New York, Vermont, and West Virginia are anomalous and, therefore, not considered. The
estimated resident population of Native Hawaiian or Other Pacific Islander infants and toddlers was 420 in New York, 3 in Vermont, and 11 in West Virginia. This was less than or equal to the number of infants and toddlers served under Part C that
101
the following four States: District of Columbia (93.8 percent), Connecticut (56.7 percent), Montana (42.9 percent), and New Hampshire (42.1 percent). In contrast, the percentage was less than 5 percent in the following three States: Oregon (3.5 percent), California (3.0 percent), and Maine (0.0 percent).
• In 2017–18, 7.1 percent of the resident population birth through age 2 who were White were served under Part C during the 12-month reporting period in “All States.” The percentages ranged from 2.1 percent to 18.4 percent in the 50 individual States. The percentage was larger than 10 percent in the following eight States: Massachusetts (18.4 percent), Rhode Island (14.3 percent), New Mexico (14.2 percent), West Virginia (12.9 percent), Vermont (11.6 percent), New Hampshire (11.2 percent), New York (10.9 percent), and Indiana (10.3 percent). In contrast, the percentage was less than 5 percent in the following seven States: Alabama (4.5 percent), Maine (4.5 percent), Oklahoma (4.4 percent), Florida (4.3 percent), Mississippi (3.9 percent), Montana (3.1 percent), and Arkansas (2.1 percent).
• In 2017–18, 5.7 percent of the resident population birth through age 2 who were associated with two or more racial/ethnic groups were served under Part C during the 12-month reporting period in “All States.” The percentages ranged from 1.3 to 25.4 percent in the 51 individual States. The percentage was larger than 15 percent in the following three States: North Dakota (25.4 percent), Pennsylvania (18.0 percent), Massachusetts (16.1 percent). In contrast, the percentage was less than 2 percent in the following two States: Arkansas (1.8 percent) and Texas (1.3 percent).
were identified as Native Hawaiian or Other Pacific Islander in New York (497 infants and toddlers), Vermont (6 infants and toddlers), and West Virginia (11 infants and toddlers).
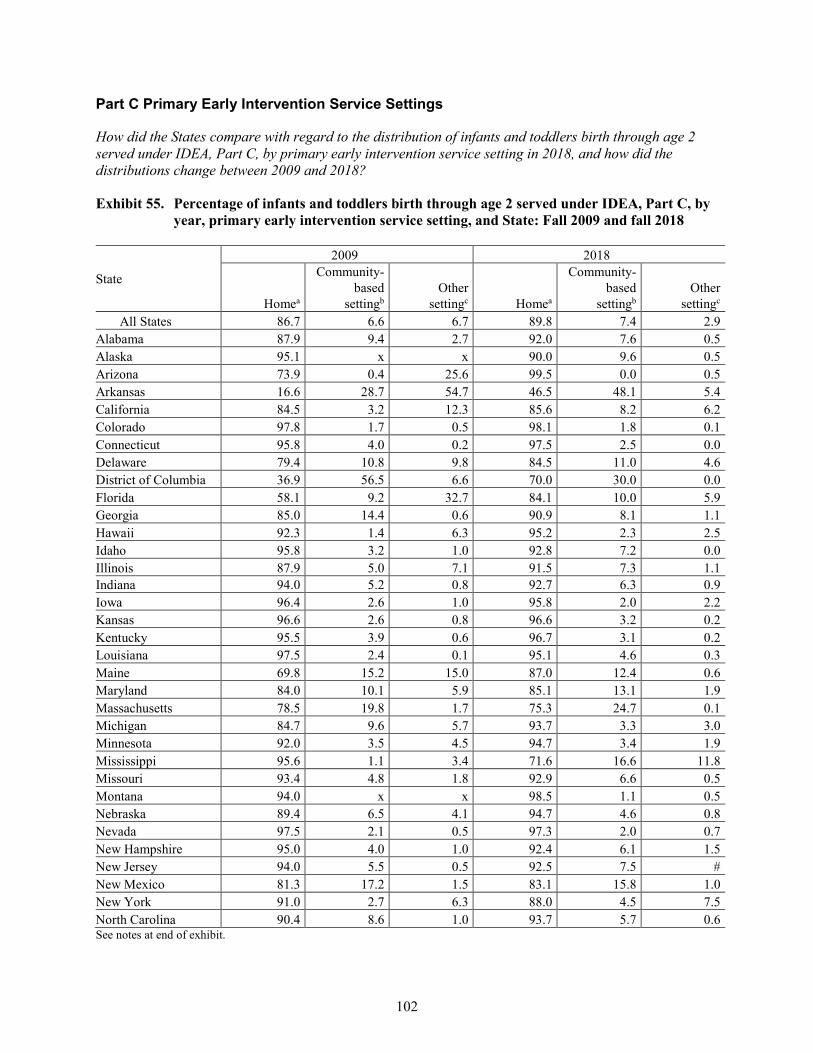
102
Part C Primary Early Intervention Service Settings
How did the States compare with regard to the distribution of infants and toddlers birth through age 2 served under IDEA, Part C, by primary early intervention service setting in 2018, and how did the distributions change between 2009 and 2018?
Exhibit 55. Percentage of infants and toddlers birth through age 2 served under IDEA, Part C, by year, primary early intervention service setting, and State: Fall 2009 and fall 2018
State
2009 2018
Homea
Community-based
settingb Other
settingc Homea
Community-based
settingb Other
settingc All States 86.7 6.6 6.7 89.8 7.4 2.9
Alabama 87.9 9.4 2.7 92.0 7.6 0.5 Alaska 95.1 x x 90.0 9.6 0.5 Arizona 73.9 0.4 25.6 99.5 0.0 0.5 Arkansas 16.6 28.7 54.7 46.5 48.1 5.4 California 84.5 3.2 12.3 85.6 8.2 6.2 Colorado 97.8 1.7 0.5 98.1 1.8 0.1 Connecticut 95.8 4.0 0.2 97.5 2.5 0.0 Delaware 79.4 10.8 9.8 84.5 11.0 4.6 District of Columbia 36.9 56.5 6.6 70.0 30.0 0.0 Florida 58.1 9.2 32.7 84.1 10.0 5.9 Georgia 85.0 14.4 0.6 90.9 8.1 1.1 Hawaii 92.3 1.4 6.3 95.2 2.3 2.5 Idaho 95.8 3.2 1.0 92.8 7.2 0.0 Illinois 87.9 5.0 7.1 91.5 7.3 1.1 Indiana 94.0 5.2 0.8 92.7 6.3 0.9 Iowa 96.4 2.6 1.0 95.8 2.0 2.2 Kansas 96.6 2.6 0.8 96.6 3.2 0.2 Kentucky 95.5 3.9 0.6 96.7 3.1 0.2 Louisiana 97.5 2.4 0.1 95.1 4.6 0.3 Maine 69.8 15.2 15.0 87.0 12.4 0.6 Maryland 84.0 10.1 5.9 85.1 13.1 1.9 Massachusetts 78.5 19.8 1.7 75.3 24.7 0.1 Michigan 84.7 9.6 5.7 93.7 3.3 3.0 Minnesota 92.0 3.5 4.5 94.7 3.4 1.9 Mississippi 95.6 1.1 3.4 71.6 16.6 11.8 Missouri 93.4 4.8 1.8 92.9 6.6 0.5 Montana 94.0 x x 98.5 1.1 0.5 Nebraska 89.4 6.5 4.1 94.7 4.6 0.8 Nevada 97.5 2.1 0.5 97.3 2.0 0.7 New Hampshire 95.0 4.0 1.0 92.4 6.1 1.5 New Jersey 94.0 5.5 0.5 92.5 7.5 # New Mexico 81.3 17.2 1.5 83.1 15.8 1.0 New York 91.0 2.7 6.3 88.0 4.5 7.5 North Carolina 90.4 8.6 1.0 93.7 5.7 0.6 See notes at end of exhibit.
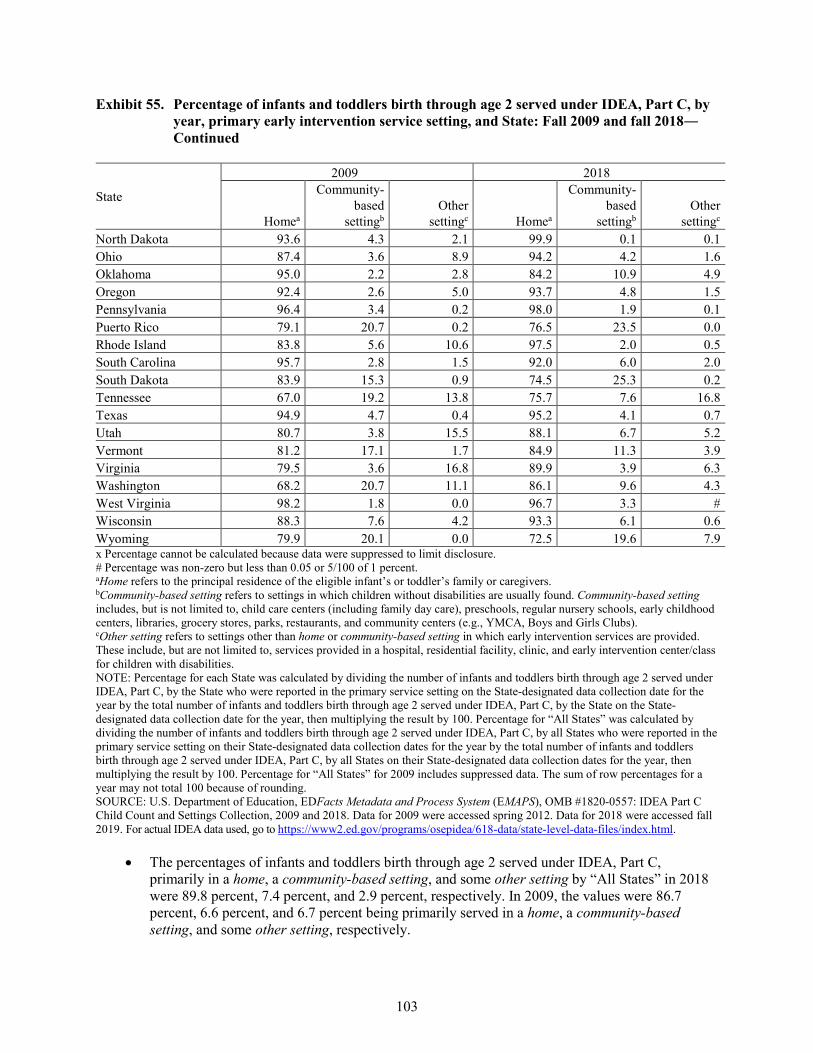
103
Exhibit 55. Percentage of infants and toddlers birth through age 2 served under IDEA, Part C, by year, primary early intervention service setting, and State: Fall 2009 and fall 2018― Continued
State
2009 2018
Homea
Community-based
settingb Other
settingc Homea
Community-based
settingb Other
settingc North Dakota 93.6 4.3 2.1 99.9 0.1 0.1 Ohio 87.4 3.6 8.9 94.2 4.2 1.6 Oklahoma 95.0 2.2 2.8 84.2 10.9 4.9 Oregon 92.4 2.6 5.0 93.7 4.8 1.5 Pennsylvania 96.4 3.4 0.2 98.0 1.9 0.1 Puerto Rico 79.1 20.7 0.2 76.5 23.5 0.0 Rhode Island 83.8 5.6 10.6 97.5 2.0 0.5 South Carolina 95.7 2.8 1.5 92.0 6.0 2.0 South Dakota 83.9 15.3 0.9 74.5 25.3 0.2 Tennessee 67.0 19.2 13.8 75.7 7.6 16.8 Texas 94.9 4.7 0.4 95.2 4.1 0.7 Utah 80.7 3.8 15.5 88.1 6.7 5.2 Vermont 81.2 17.1 1.7 84.9 11.3 3.9 Virginia 79.5 3.6 16.8 89.9 3.9 6.3 Washington 68.2 20.7 11.1 86.1 9.6 4.3 West Virginia 98.2 1.8 0.0 96.7 3.3 # Wisconsin 88.3 7.6 4.2 93.3 6.1 0.6 Wyoming 79.9 20.1 0.0 72.5 19.6 7.9 x Percentage cannot be calculated because data were suppressed to limit disclosure. # Percentage was non-zero but less than 0.05 or 5/100 of 1 percent. aHome refers to the principal residence of the eligible infant’s or toddler’s family or caregivers. bCommunity-based setting refers to settings in which children without disabilities are usually found. Community-based setting includes, but is not limited to, child care centers (including family day care), preschools, regular nursery schools, early childhood centers, libraries, grocery stores, parks, restaurants, and community centers (e.g., YMCA, Boys and Girls Clubs). cOther setting refers to settings other than home or community-based setting in which early intervention services are provided. These include, but are not limited to, services provided in a hospital, residential facility, clinic, and early intervention center/class for children with disabilities. NOTE: Percentage for each State was calculated by dividing the number of infants and toddlers birth through age 2 served under IDEA, Part C, by the State who were reported in the primary service setting on the State-designated data collection date for the year by the total number of infants and toddlers birth through age 2 served under IDEA, Part C, by the State on the State-designated data collection date for the year, then multiplying the result by 100. Percentage for “All States” was calculated by dividing the number of infants and toddlers birth through age 2 served under IDEA, Part C, by all States who were reported in the primary service setting on their State-designated data collection dates for the year by the total number of infants and toddlers birth through age 2 served under IDEA, Part C, by all States on their State-designated data collection dates for the year, then multiplying the result by 100. Percentage for “All States” for 2009 includes suppressed data. The sum of row percentages for a year may not total 100 because of rounding. SOURCE: U.S. Department of Education, EDFacts Metadata and Process System (EMAPS), OMB #1820-0557: IDEA Part C Child Count and Settings Collection, 2009 and 2018. Data for 2009 were accessed spring 2012. Data for 2018 were accessed fall 2019. For actual IDEA data used, go to https://www2.ed.gov/programs/osepidea/618-data/state-level-data-files/index.html.
• The percentages of infants and toddlers birth through age 2 served under IDEA, Part C, primarily in a home, a community-based setting, and some other setting by “All States” in 2018 were 89.8 percent, 7.4 percent, and 2.9 percent, respectively. In 2009, the values were 86.7 percent, 6.6 percent, and 6.7 percent being primarily served in a home, a community-based setting, and some other setting, respectively.
104
• Home was the primary setting for 90 percent or more of infants and toddlers served under IDEA, Part C, by 32 States in 2018. In addition, more than 50 percent of infants and toddlers in every State, with the exception of Arkansas (46.5 percent), were served in a home.
• In 2009, home was the primary setting for 90 percent or more of infants and toddlers served under IDEA, Part C, by 26 States. In addition, more than 50 percent of infants and toddlers in every State except Arkansas and the District of Columbia were served in a home. In the District of Columbia, a community-based setting was the most prevalent primary setting, accounting for 56.5 percent of the infants and toddlers served. In Arkansas, other setting was the most prevalent primary setting, accounting for 54.7 percent of the infants and toddlers served.
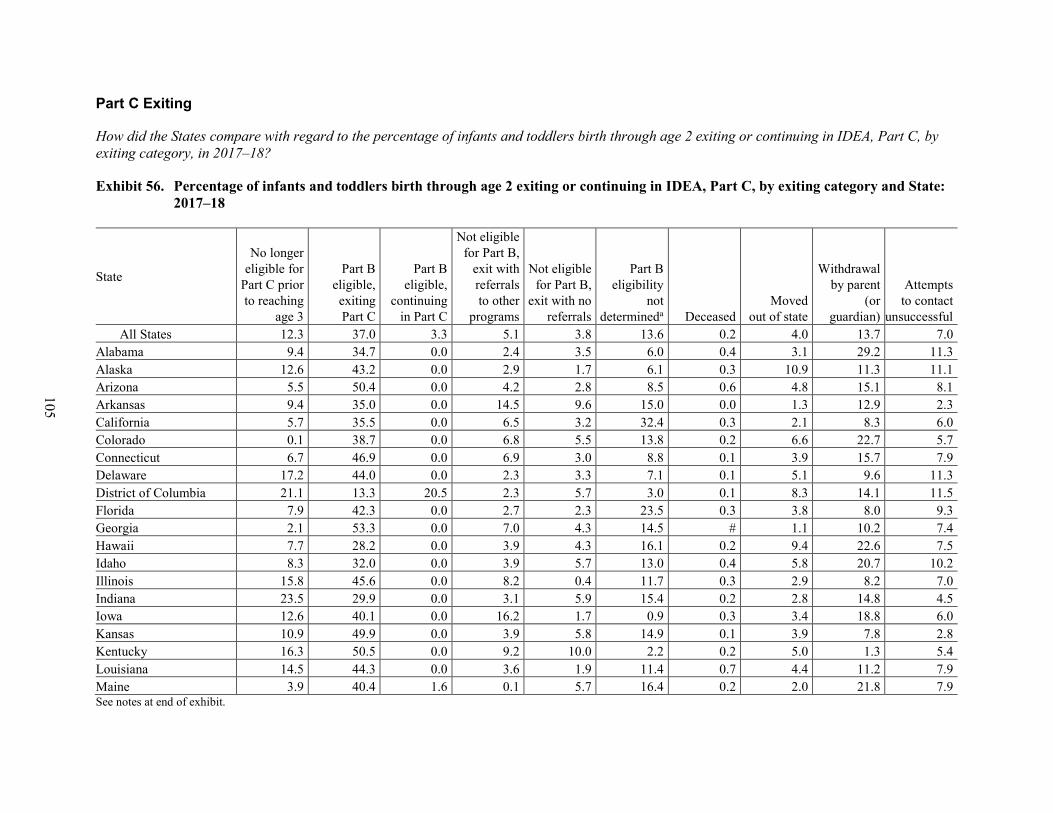
105
Part C Exiting
How did the States compare with regard to the percentage of infants and toddlers birth through age 2 exiting or continuing in IDEA, Part C, by exiting category, in 2017–18?
Exhibit 56. Percentage of infants and toddlers birth through age 2 exiting or continuing in IDEA, Part C, by exiting category and State: 2017–18
State
No longer eligible for
Part C prior to reaching
age 3
Part B eligible, exiting Part C
Part B eligible,
continuing in Part C
Not eligible for Part B,
exit with referrals to other
programs
Not eligible for Part B,
exit with no referrals
Part B eligibility
not determineda Deceased
Moved out of state
Withdrawal by parent
(or guardian)
Attempts to contact
unsuccessful All States 12.3 37.0 3.3 5.1 3.8 13.6 0.2 4.0 13.7 7.0
Alabama 9.4 34.7 0.0 2.4 3.5 6.0 0.4 3.1 29.2 11.3 Alaska 12.6 43.2 0.0 2.9 1.7 6.1 0.3 10.9 11.3 11.1 Arizona 5.5 50.4 0.0 4.2 2.8 8.5 0.6 4.8 15.1 8.1 Arkansas 9.4 35.0 0.0 14.5 9.6 15.0 0.0 1.3 12.9 2.3 California 5.7 35.5 0.0 6.5 3.2 32.4 0.3 2.1 8.3 6.0 Colorado 0.1 38.7 0.0 6.8 5.5 13.8 0.2 6.6 22.7 5.7 Connecticut 6.7 46.9 0.0 6.9 3.0 8.8 0.1 3.9 15.7 7.9 Delaware 17.2 44.0 0.0 2.3 3.3 7.1 0.1 5.1 9.6 11.3 District of Columbia 21.1 13.3 20.5 2.3 5.7 3.0 0.1 8.3 14.1 11.5 Florida 7.9 42.3 0.0 2.7 2.3 23.5 0.3 3.8 8.0 9.3 Georgia 2.1 53.3 0.0 7.0 4.3 14.5 # 1.1 10.2 7.4 Hawaii 7.7 28.2 0.0 3.9 4.3 16.1 0.2 9.4 22.6 7.5 Idaho 8.3 32.0 0.0 3.9 5.7 13.0 0.4 5.8 20.7 10.2 Illinois 15.8 45.6 0.0 8.2 0.4 11.7 0.3 2.9 8.2 7.0 Indiana 23.5 29.9 0.0 3.1 5.9 15.4 0.2 2.8 14.8 4.5 Iowa 12.6 40.1 0.0 16.2 1.7 0.9 0.3 3.4 18.8 6.0 Kansas 10.9 49.9 0.0 3.9 5.8 14.9 0.1 3.9 7.8 2.8 Kentucky 16.3 50.5 0.0 9.2 10.0 2.2 0.2 5.0 1.3 5.4 Louisiana 14.5 44.3 0.0 3.6 1.9 11.4 0.7 4.4 11.2 7.9 Maine 3.9 40.4 1.6 0.1 5.7 16.4 0.2 2.0 21.8 7.9 See notes at end of exhibit.
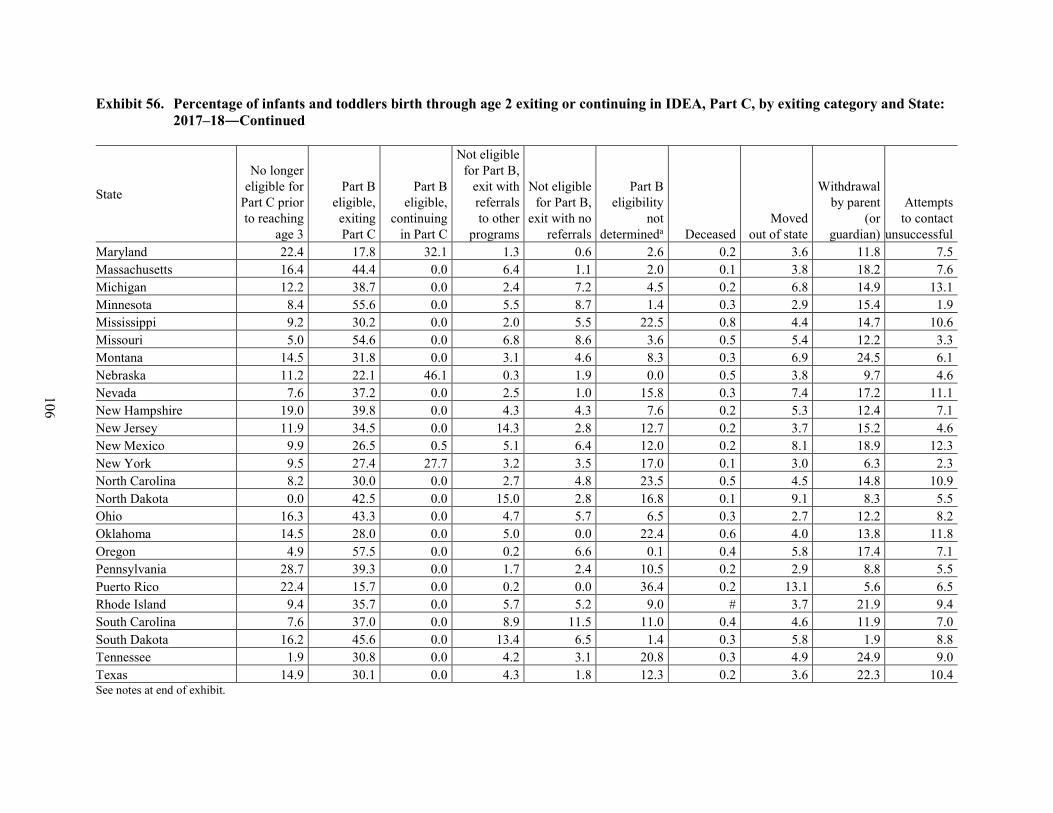
106
Exhibit 56. Percentage of infants and toddlers birth through age 2 exiting or continuing in IDEA, Part C, by exiting category and State: 2017–18―Continued
State
No longer eligible for
Part C prior to reaching
age 3
Part B eligible, exiting Part C
Part B eligible,
continuing in Part C
Not eligible for Part B,
exit with referrals to other
programs
Not eligible for Part B,
exit with no referrals
Part B eligibility
not determineda Deceased
Moved out of state
Withdrawal by parent
(or guardian)
Attempts to contact
unsuccessful Maryland 22.4 17.8 32.1 1.3 0.6 2.6 0.2 3.6 11.8 7.5 Massachusetts 16.4 44.4 0.0 6.4 1.1 2.0 0.1 3.8 18.2 7.6 Michigan 12.2 38.7 0.0 2.4 7.2 4.5 0.2 6.8 14.9 13.1 Minnesota 8.4 55.6 0.0 5.5 8.7 1.4 0.3 2.9 15.4 1.9 Mississippi 9.2 30.2 0.0 2.0 5.5 22.5 0.8 4.4 14.7 10.6 Missouri 5.0 54.6 0.0 6.8 8.6 3.6 0.5 5.4 12.2 3.3 Montana 14.5 31.8 0.0 3.1 4.6 8.3 0.3 6.9 24.5 6.1 Nebraska 11.2 22.1 46.1 0.3 1.9 0.0 0.5 3.8 9.7 4.6 Nevada 7.6 37.2 0.0 2.5 1.0 15.8 0.3 7.4 17.2 11.1 New Hampshire 19.0 39.8 0.0 4.3 4.3 7.6 0.2 5.3 12.4 7.1 New Jersey 11.9 34.5 0.0 14.3 2.8 12.7 0.2 3.7 15.2 4.6 New Mexico 9.9 26.5 0.5 5.1 6.4 12.0 0.2 8.1 18.9 12.3 New York 9.5 27.4 27.7 3.2 3.5 17.0 0.1 3.0 6.3 2.3 North Carolina 8.2 30.0 0.0 2.7 4.8 23.5 0.5 4.5 14.8 10.9 North Dakota 0.0 42.5 0.0 15.0 2.8 16.8 0.1 9.1 8.3 5.5 Ohio 16.3 43.3 0.0 4.7 5.7 6.5 0.3 2.7 12.2 8.2 Oklahoma 14.5 28.0 0.0 5.0 0.0 22.4 0.6 4.0 13.8 11.8 Oregon 4.9 57.5 0.0 0.2 6.6 0.1 0.4 5.8 17.4 7.1 Pennsylvania 28.7 39.3 0.0 1.7 2.4 10.5 0.2 2.9 8.8 5.5 Puerto Rico 22.4 15.7 0.0 0.2 0.0 36.4 0.2 13.1 5.6 6.5 Rhode Island 9.4 35.7 0.0 5.7 5.2 9.0 # 3.7 21.9 9.4 South Carolina 7.6 37.0 0.0 8.9 11.5 11.0 0.4 4.6 11.9 7.0 South Dakota 16.2 45.6 0.0 13.4 6.5 1.4 0.3 5.8 1.9 8.8 Tennessee 1.9 30.8 0.0 4.2 3.1 20.8 0.3 4.9 24.9 9.0 Texas 14.9 30.1 0.0 4.3 1.8 12.3 0.2 3.6 22.3 10.4 See notes at end of exhibit.
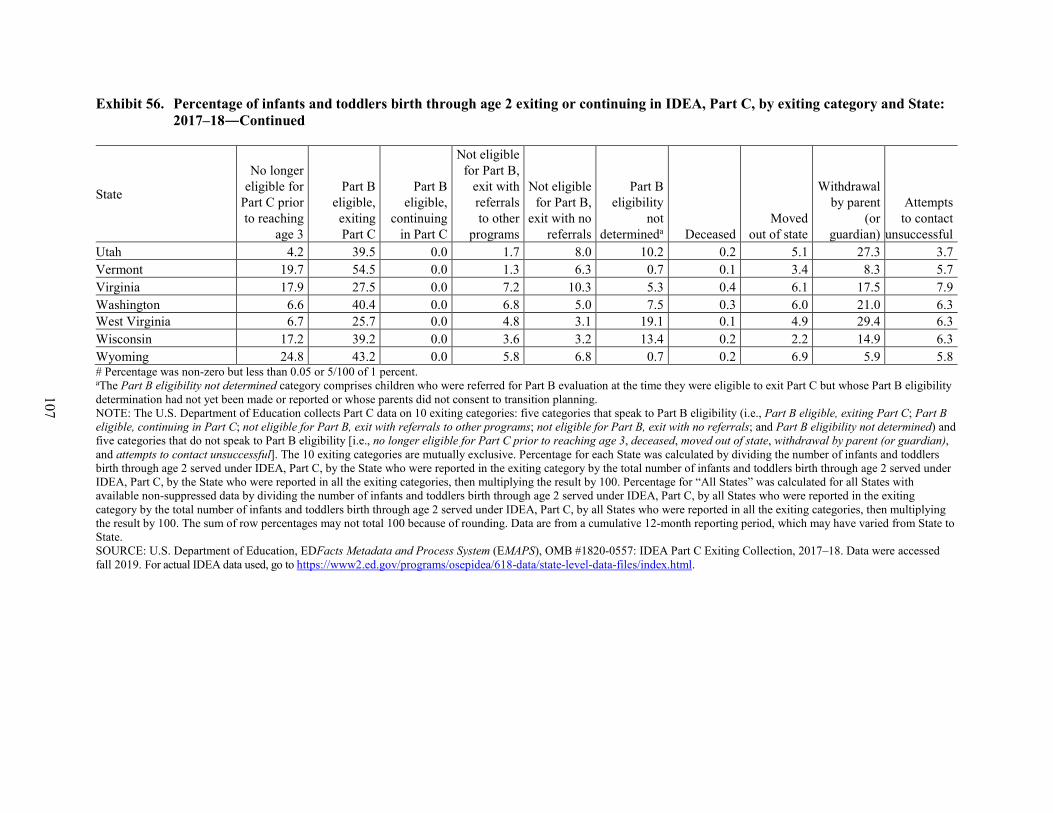
107
Exhibit 56. Percentage of infants and toddlers birth through age 2 exiting or continuing in IDEA, Part C, by exiting category and State: 2017–18―Continued
State
No longer eligible for
Part C prior to reaching
age 3
Part B eligible, exiting Part C
Part B eligible,
continuing in Part C
Not eligible for Part B,
exit with referrals to other
programs
Not eligible for Part B,
exit with no referrals
Part B eligibility
not determineda Deceased
Moved out of state
Withdrawal by parent
(or guardian)
Attempts to contact
unsuccessful Utah 4.2 39.5 0.0 1.7 8.0 10.2 0.2 5.1 27.3 3.7 Vermont 19.7 54.5 0.0 1.3 6.3 0.7 0.1 3.4 8.3 5.7 Virginia 17.9 27.5 0.0 7.2 10.3 5.3 0.4 6.1 17.5 7.9 Washington 6.6 40.4 0.0 6.8 5.0 7.5 0.3 6.0 21.0 6.3 West Virginia 6.7 25.7 0.0 4.8 3.1 19.1 0.1 4.9 29.4 6.3 Wisconsin 17.2 39.2 0.0 3.6 3.2 13.4 0.2 2.2 14.9 6.3 Wyoming 24.8 43.2 0.0 5.8 6.8 0.7 0.2 6.9 5.9 5.8 # Percentage was non-zero but less than 0.05 or 5/100 of 1 percent. aThe Part B eligibility not determined category comprises children who were referred for Part B evaluation at the time they were eligible to exit Part C but whose Part B eligibility determination had not yet been made or reported or whose parents did not consent to transition planning. NOTE: The U.S. Department of Education collects Part C data on 10 exiting categories: five categories that speak to Part B eligibility (i.e., Part B eligible, exiting Part C; Part B eligible, continuing in Part C; not eligible for Part B, exit with referrals to other programs; not eligible for Part B, exit with no referrals; and Part B eligibility not determined) and five categories that do not speak to Part B eligibility [i.e., no longer eligible for Part C prior to reaching age 3, deceased, moved out of state, withdrawal by parent (or guardian), and attempts to contact unsuccessful]. The 10 exiting categories are mutually exclusive. Percentage for each State was calculated by dividing the number of infants and toddlers birth through age 2 served under IDEA, Part C, by the State who were reported in the exiting category by the total number of infants and toddlers birth through age 2 served under IDEA, Part C, by the State who were reported in all the exiting categories, then multiplying the result by 100. Percentage for “All States” was calculated for all States with available non-suppressed data by dividing the number of infants and toddlers birth through age 2 served under IDEA, Part C, by all States who were reported in the exiting category by the total number of infants and toddlers birth through age 2 served under IDEA, Part C, by all States who were reported in all the exiting categories, then multiplying the result by 100. The sum of row percentages may not total 100 because of rounding. Data are from a cumulative 12-month reporting period, which may have varied from State to State. SOURCE: U.S. Department of Education, EDFacts Metadata and Process System (EMAPS), OMB #1820-0557: IDEA Part C Exiting Collection, 2017–18. Data were accessed fall 2019. For actual IDEA data used, go to https://www2.ed.gov/programs/osepidea/618-data/state-level-data-files/index.html.
108
• In 2017–18, the most prevalent Part C exiting category was Part B eligible, exiting Part C. This exiting category accounted for 37 percent of the infants and toddlers birth through age 2 exiting Part C in “All States.” This exiting category also was associated with the largest percentage in 46 of the 52 States. In the following seven States, this exiting category accounted for the majority of exits: Oregon (57.5 percent), Minnesota (55.6 percent), Missouri (54.6 percent), Vermont (54.5 percent), Georgia (53.3 percent), Kentucky (50.5 percent), and Arizona (50.4 percent).
• The category of withdrawal by parent (or guardian) accounted for the second largest percentage of exits for “All States,” and it represented 13.7 percent of the exits. This category was the most prevalent Part C exiting category for West Virginia (29.4 percent).
• The category of Part B eligibility not determined accounted for 13.6 percent of the Part C exits for “All States” and was the most prevalent Part C exiting category for Puerto Rico (36.4 percent).
• The category of Part B eligible, continuing in Part C accounted for 3.3 percent of the Part C exits for “All States” but was the most prevalent Part C exiting category for Nebraska (46.1 percent), Maryland (32.1 percent), and New York (27.7 percent).
109
Part C Dispute Resolution
Unlike the other Part C data collections, which are associated with a specific group of Part C participants defined by the participants’ ages, the Part C dispute resolution data collection is associated with all infants and toddlers served under IDEA, Part C. These infants and toddlers may include individuals who are 3 years of age or older and eligible under Part B but whose parents elect for them to continue receiving Part C services, as States have the authority to define an “infant or toddler with a disability” to include individuals under 3 years of age and individuals 3 years of age and older [see IDEA, Section 632(5)(B) and 34 C.F.R. § 303.21(c)] and serve them under Part C until the beginning of the school year following the child’s third or fourth birthday or until the child is eligible to enter kindergarten [see IDEA, Section 635(c) and 34 C.F.R. § 303.211]. The Part C legal disputes and resolution data represent all complaints associated with any participant in Part C during the 12 months during which the data were collected. Nevertheless, since infants and toddlers birth through age 2 served under IDEA, Part C, account for nearly all of the participants in Part C in all States, the count for infants and toddlers birth through age 2 served as of the State-designated date for the year was deemed a meaningful basis for creating a ratio by which to compare the volume of Part C disputes that occurred in the individual States during the year. For an overview of the Part C dispute resolution process, see the Section I discussion of these same data at the national level.
How did the States compare with regard to the following ratios in 2017–18:
1. The number of written, signed complaints for infants and toddlers served under IDEA, Part C, per 1,000 infants and toddlers birth through age 2 served;
2. The number of due process complaints for infants and toddlers served under IDEA, Part C, per 1,000 infants and toddlers birth through age 2 served; and
3. The number of mediation requests for infants and toddlers served under IDEA, Part C, per 1,000 infants and toddlers birth through age 2 served?
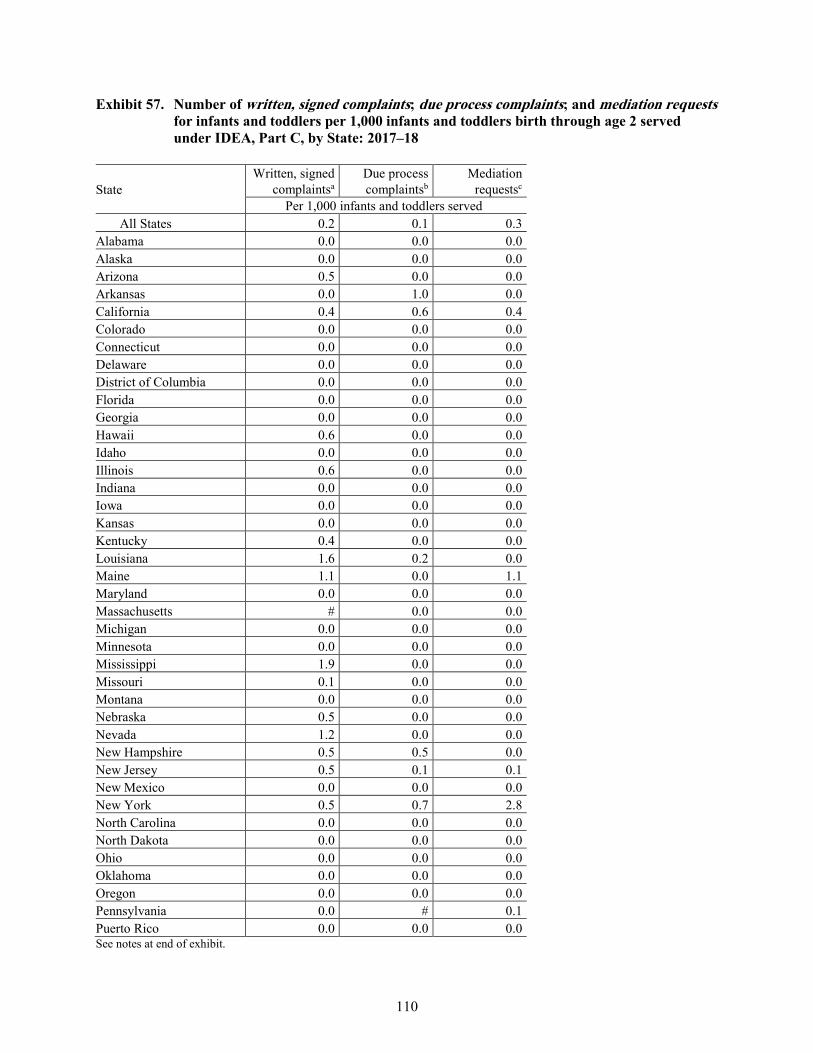
110
Exhibit 57. Number of written, signed complaints; due process complaints; and mediation requests for infants and toddlers per 1,000 infants and toddlers birth through age 2 served under IDEA, Part C, by State: 2017–18
State Written, signed
complaintsa Due process complaintsb
Mediation requestsc
Per 1,000 infants and toddlers served All States 0.2 0.1 0.3
Alabama 0.0 0.0 0.0 Alaska 0.0 0.0 0.0 Arizona 0.5 0.0 0.0 Arkansas 0.0 1.0 0.0 California 0.4 0.6 0.4 Colorado 0.0 0.0 0.0 Connecticut 0.0 0.0 0.0 Delaware 0.0 0.0 0.0 District of Columbia 0.0 0.0 0.0 Florida 0.0 0.0 0.0 Georgia 0.0 0.0 0.0 Hawaii 0.6 0.0 0.0 Idaho 0.0 0.0 0.0 Illinois 0.6 0.0 0.0 Indiana 0.0 0.0 0.0 Iowa 0.0 0.0 0.0 Kansas 0.0 0.0 0.0 Kentucky 0.4 0.0 0.0 Louisiana 1.6 0.2 0.0 Maine 1.1 0.0 1.1 Maryland 0.0 0.0 0.0 Massachusetts # 0.0 0.0 Michigan 0.0 0.0 0.0 Minnesota 0.0 0.0 0.0 Mississippi 1.9 0.0 0.0 Missouri 0.1 0.0 0.0 Montana 0.0 0.0 0.0 Nebraska 0.5 0.0 0.0 Nevada 1.2 0.0 0.0 New Hampshire 0.5 0.5 0.0 New Jersey 0.5 0.1 0.1 New Mexico 0.0 0.0 0.0 New York 0.5 0.7 2.8 North Carolina 0.0 0.0 0.0 North Dakota 0.0 0.0 0.0 Ohio 0.0 0.0 0.0 Oklahoma 0.0 0.0 0.0 Oregon 0.0 0.0 0.0 Pennsylvania 0.0 # 0.1 Puerto Rico 0.0 0.0 0.0 See notes at end of exhibit.
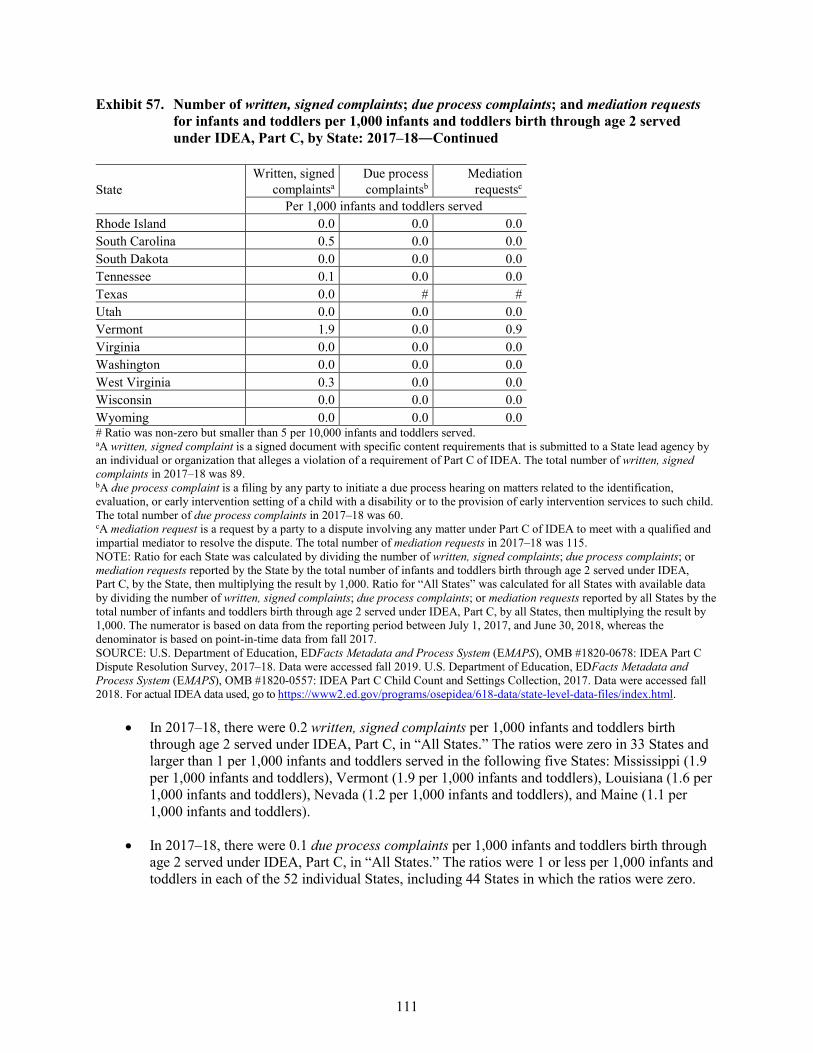
111
Exhibit 57. Number of written, signed complaints; due process complaints; and mediation requests for infants and toddlers per 1,000 infants and toddlers birth through age 2 served under IDEA, Part C, by State: 2017–18―Continued
State Written, signed
complaintsa Due process complaintsb
Mediation requestsc
Per 1,000 infants and toddlers served Rhode Island 0.0 0.0 0.0 South Carolina 0.5 0.0 0.0 South Dakota 0.0 0.0 0.0 Tennessee 0.1 0.0 0.0 Texas 0.0 # # Utah 0.0 0.0 0.0 Vermont 1.9 0.0 0.9 Virginia 0.0 0.0 0.0 Washington 0.0 0.0 0.0 West Virginia 0.3 0.0 0.0 Wisconsin 0.0 0.0 0.0 Wyoming 0.0 0.0 0.0 # Ratio was non-zero but smaller than 5 per 10,000 infants and toddlers served. aA written, signed complaint is a signed document with specific content requirements that is submitted to a State lead agency by an individual or organization that alleges a violation of a requirement of Part C of IDEA. The total number of written, signed complaints in 2017–18 was 89. bA due process complaint is a filing by any party to initiate a due process hearing on matters related to the identification, evaluation, or early intervention setting of a child with a disability or to the provision of early intervention services to such child. The total number of due process complaints in 2017–18 was 60. cA mediation request is a request by a party to a dispute involving any matter under Part C of IDEA to meet with a qualified and impartial mediator to resolve the dispute. The total number of mediation requests in 2017–18 was 115. NOTE: Ratio for each State was calculated by dividing the number of written, signed complaints; due process complaints; or mediation requests reported by the State by the total number of infants and toddlers birth through age 2 served under IDEA, Part C, by the State, then multiplying the result by 1,000. Ratio for “All States” was calculated for all States with available data by dividing the number of written, signed complaints; due process complaints; or mediation requests reported by all States by the total number of infants and toddlers birth through age 2 served under IDEA, Part C, by all States, then multiplying the result by 1,000. The numerator is based on data from the reporting period between July 1, 2017, and June 30, 2018, whereas the denominator is based on point-in-time data from fall 2017. SOURCE: U.S. Department of Education, EDFacts Metadata and Process System (EMAPS), OMB #1820-0678: IDEA Part C Dispute Resolution Survey, 2017–18. Data were accessed fall 2019. U.S. Department of Education, EDFacts Metadata and Process System (EMAPS), OMB #1820-0557: IDEA Part C Child Count and Settings Collection, 2017. Data were accessed fall 2018. For actual IDEA data used, go to https://www2.ed.gov/programs/osepidea/618-data/state-level-data-files/index.html.
• In 2017–18, there were 0.2 written, signed complaints per 1,000 infants and toddlers birth through age 2 served under IDEA, Part C, in “All States.” The ratios were zero in 33 States and larger than 1 per 1,000 infants and toddlers served in the following five States: Mississippi (1.9 per 1,000 infants and toddlers), Vermont (1.9 per 1,000 infants and toddlers), Louisiana (1.6 per 1,000 infants and toddlers), Nevada (1.2 per 1,000 infants and toddlers), and Maine (1.1 per 1,000 infants and toddlers).
• In 2017–18, there were 0.1 due process complaints per 1,000 infants and toddlers birth through age 2 served under IDEA, Part C, in “All States.” The ratios were 1 or less per 1,000 infants and toddlers in each of the 52 individual States, including 44 States in which the ratios were zero.
112
• In 2017–18, there were 0.3 mediation requests per 1,000 infants and toddlers birth through age 2 served under IDEA, Part C, in “All States.” The ratios were zero in 45 States and larger than 1 per 1,000 infants and toddlers served in the following two States: New York (2.8 per 1,000 infants and toddlers) and Maine (1.1 per 1,000 infants and toddlers).
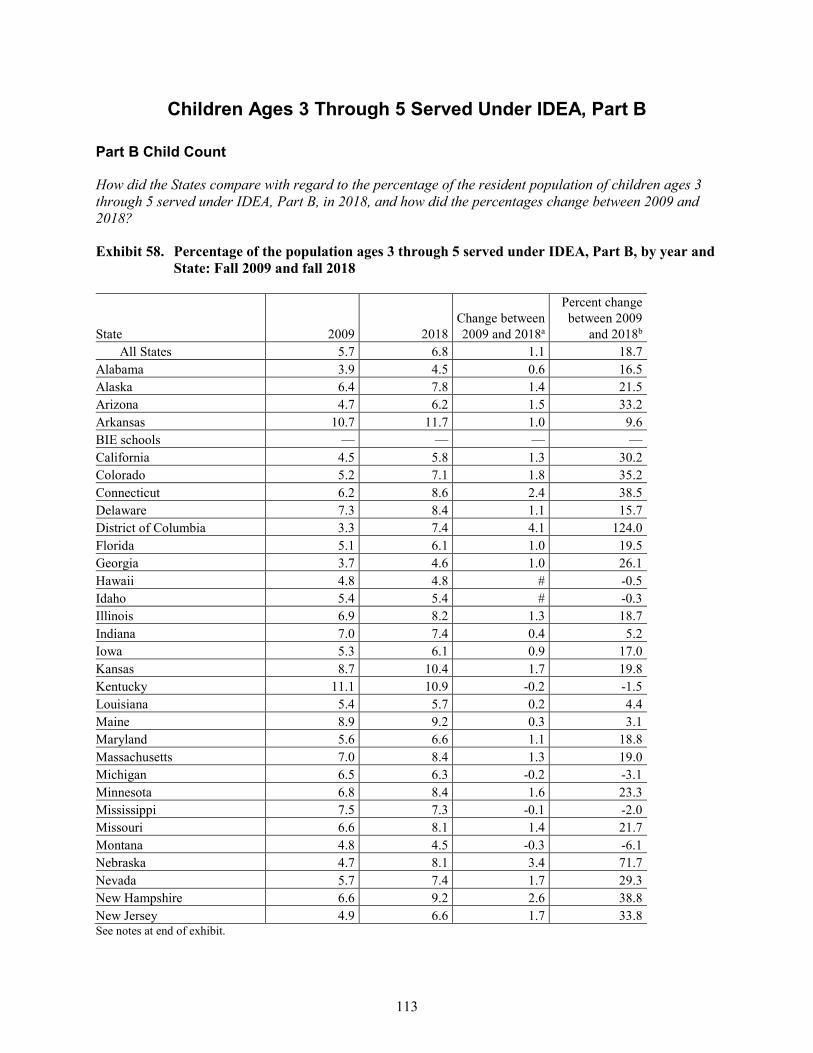
113
Children Ages 3 Through 5 Served Under IDEA, Part B
Part B Child Count
How did the States compare with regard to the percentage of the resident population of children ages 3 through 5 served under IDEA, Part B, in 2018, and how did the percentages change between 2009 and 2018?
Exhibit 58. Percentage of the population ages 3 through 5 served under IDEA, Part B, by year and State: Fall 2009 and fall 2018
State 2009 2018 Change between 2009 and 2018a
Percent change between 2009
and 2018b All States 5.7 6.8 1.1 18.7
Alabama 3.9 4.5 0.6 16.5 Alaska 6.4 7.8 1.4 21.5 Arizona 4.7 6.2 1.5 33.2 Arkansas 10.7 11.7 1.0 9.6 BIE schools — — — — California 4.5 5.8 1.3 30.2 Colorado 5.2 7.1 1.8 35.2 Connecticut 6.2 8.6 2.4 38.5 Delaware 7.3 8.4 1.1 15.7 District of Columbia 3.3 7.4 4.1 124.0 Florida 5.1 6.1 1.0 19.5 Georgia 3.7 4.6 1.0 26.1 Hawaii 4.8 4.8 # -0.5 Idaho 5.4 5.4 # -0.3 Illinois 6.9 8.2 1.3 18.7 Indiana 7.0 7.4 0.4 5.2 Iowa 5.3 6.1 0.9 17.0 Kansas 8.7 10.4 1.7 19.8 Kentucky 11.1 10.9 -0.2 -1.5 Louisiana 5.4 5.7 0.2 4.4 Maine 8.9 9.2 0.3 3.1 Maryland 5.6 6.6 1.1 18.8 Massachusetts 7.0 8.4 1.3 19.0 Michigan 6.5 6.3 -0.2 -3.1 Minnesota 6.8 8.4 1.6 23.3 Mississippi 7.5 7.3 -0.1 -2.0 Missouri 6.6 8.1 1.4 21.7 Montana 4.8 4.5 -0.3 -6.1 Nebraska 4.7 8.1 3.4 71.7 Nevada 5.7 7.4 1.7 29.3 New Hampshire 6.6 9.2 2.6 38.8 New Jersey 4.9 6.6 1.7 33.8 See notes at end of exhibit.
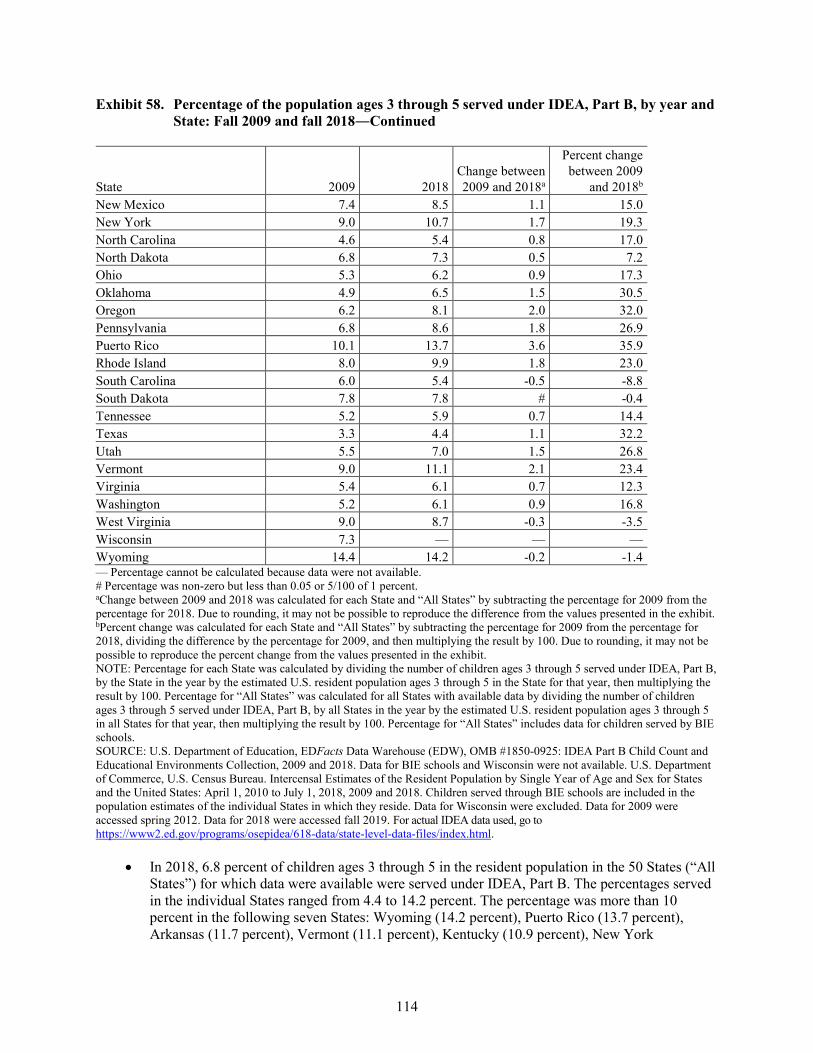
114
Exhibit 58. Percentage of the population ages 3 through 5 served under IDEA, Part B, by year and State: Fall 2009 and fall 2018―Continued
State 2009 2018 Change between 2009 and 2018a
Percent change between 2009
and 2018b New Mexico 7.4 8.5 1.1 15.0 New York 9.0 10.7 1.7 19.3 North Carolina 4.6 5.4 0.8 17.0 North Dakota 6.8 7.3 0.5 7.2 Ohio 5.3 6.2 0.9 17.3 Oklahoma 4.9 6.5 1.5 30.5 Oregon 6.2 8.1 2.0 32.0 Pennsylvania 6.8 8.6 1.8 26.9 Puerto Rico 10.1 13.7 3.6 35.9 Rhode Island 8.0 9.9 1.8 23.0 South Carolina 6.0 5.4 -0.5 -8.8 South Dakota 7.8 7.8 # -0.4 Tennessee 5.2 5.9 0.7 14.4 Texas 3.3 4.4 1.1 32.2 Utah 5.5 7.0 1.5 26.8 Vermont 9.0 11.1 2.1 23.4 Virginia 5.4 6.1 0.7 12.3 Washington 5.2 6.1 0.9 16.8 West Virginia 9.0 8.7 -0.3 -3.5 Wisconsin 7.3 — — — Wyoming 14.4 14.2 -0.2 -1.4 — Percentage cannot be calculated because data were not available. # Percentage was non-zero but less than 0.05 or 5/100 of 1 percent. aChange between 2009 and 2018 was calculated for each State and “All States” by subtracting the percentage for 2009 from the percentage for 2018. Due to rounding, it may not be possible to reproduce the difference from the values presented in the exhibit. bPercent change was calculated for each State and “All States” by subtracting the percentage for 2009 from the percentage for 2018, dividing the difference by the percentage for 2009, and then multiplying the result by 100. Due to rounding, it may not be possible to reproduce the percent change from the values presented in the exhibit. NOTE: Percentage for each State was calculated by dividing the number of children ages 3 through 5 served under IDEA, Part B, by the State in the year by the estimated U.S. resident population ages 3 through 5 in the State for that year, then multiplying the result by 100. Percentage for “All States” was calculated for all States with available data by dividing the number of children ages 3 through 5 served under IDEA, Part B, by all States in the year by the estimated U.S. resident population ages 3 through 5 in all States for that year, then multiplying the result by 100. Percentage for “All States” includes data for children served by BIE schools. SOURCE: U.S. Department of Education, EDFacts Data Warehouse (EDW), OMB #1850-0925: IDEA Part B Child Count and Educational Environments Collection, 2009 and 2018. Data for BIE schools and Wisconsin were not available. U.S. Department of Commerce, U.S. Census Bureau. Intercensal Estimates of the Resident Population by Single Year of Age and Sex for States and the United States: April 1, 2010 to July 1, 2018, 2009 and 2018. Children served through BIE schools are included in the population estimates of the individual States in which they reside. Data for Wisconsin were excluded. Data for 2009 were accessed spring 2012. Data for 2018 were accessed fall 2019. For actual IDEA data used, go to https://www2.ed.gov/programs/osepidea/618-data/state-level-data-files/index.html.
• In 2018, 6.8 percent of children ages 3 through 5 in the resident population in the 50 States (“All States”) for which data were available were served under IDEA, Part B. The percentages served in the individual States ranged from 4.4 to 14.2 percent. The percentage was more than 10 percent in the following seven States: Wyoming (14.2 percent), Puerto Rico (13.7 percent), Arkansas (11.7 percent), Vermont (11.1 percent), Kentucky (10.9 percent), New York
115
(10.7 percent), and Kansas (10.4 percent). In contrast, the percentage was less than 5 percent in the following five States: Hawaii (4.8 percent), Georgia (4.6 percent), Alabama (4.5 percent), Montana (4.5 percent), and Texas (4.4 percent).
• In 2009, 5.7 percent of children ages 3 through 5 in the resident population in the 51 States (“All States”) for which data were available were served under IDEA, Part B.
• The percentage of the population served increased by more than 10 percent between 2009 and 2018 for 36 of the 41 States for which data were available at both time points. A percent change greater than 100 percent occurred only in the District of Columbia (124.0 percent). This change represented a difference of 4.1 percentage points for the District of Columbia.
• Between 2009 and 2018, the following two States experienced a percent change decrease greater than 5 percent: South Carolina (-8.8 percent) and Montana (-6.1 percent). However, this change represented a difference of less than one percentage point for both South Carolina (-0.5 percentage points) and Montana (-0.3 percentage points).
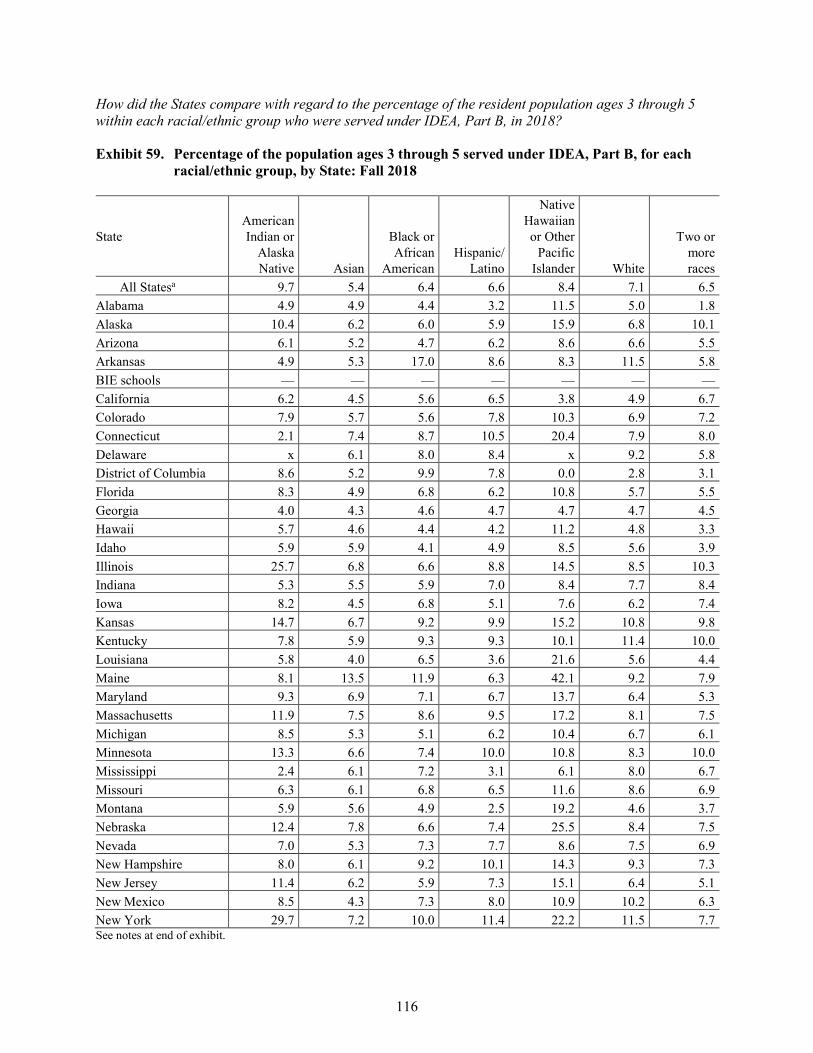
116
How did the States compare with regard to the percentage of the resident population ages 3 through 5 within each racial/ethnic group who were served under IDEA, Part B, in 2018?
Exhibit 59. Percentage of the population ages 3 through 5 served under IDEA, Part B, for each racial/ethnic group, by State: Fall 2018
State American Indian or
Alaska Native Asian
Black or African
American Hispanic/
Latino
Native Hawaiian or Other
Pacific Islander White
Two or more races
All Statesa 9.7 5.4 6.4 6.6 8.4 7.1 6.5 Alabama 4.9 4.9 4.4 3.2 11.5 5.0 1.8 Alaska 10.4 6.2 6.0 5.9 15.9 6.8 10.1 Arizona 6.1 5.2 4.7 6.2 8.6 6.6 5.5 Arkansas 4.9 5.3 17.0 8.6 8.3 11.5 5.8 BIE schools — — — — — — — California 6.2 4.5 5.6 6.5 3.8 4.9 6.7 Colorado 7.9 5.7 5.6 7.8 10.3 6.9 7.2 Connecticut 2.1 7.4 8.7 10.5 20.4 7.9 8.0 Delaware x 6.1 8.0 8.4 x 9.2 5.8 District of Columbia 8.6 5.2 9.9 7.8 0.0 2.8 3.1 Florida 8.3 4.9 6.8 6.2 10.8 5.7 5.5 Georgia 4.0 4.3 4.6 4.7 4.7 4.7 4.5 Hawaii 5.7 4.6 4.4 4.2 11.2 4.8 3.3 Idaho 5.9 5.9 4.1 4.9 8.5 5.6 3.9 Illinois 25.7 6.8 6.6 8.8 14.5 8.5 10.3 Indiana 5.3 5.5 5.9 7.0 8.4 7.7 8.4 Iowa 8.2 4.5 6.8 5.1 7.6 6.2 7.4 Kansas 14.7 6.7 9.2 9.9 15.2 10.8 9.8 Kentucky 7.8 5.9 9.3 9.3 10.1 11.4 10.0 Louisiana 5.8 4.0 6.5 3.6 21.6 5.6 4.4 Maine 8.1 13.5 11.9 6.3 42.1 9.2 7.9 Maryland 9.3 6.9 7.1 6.7 13.7 6.4 5.3 Massachusetts 11.9 7.5 8.6 9.5 17.2 8.1 7.5 Michigan 8.5 5.3 5.1 6.2 10.4 6.7 6.1 Minnesota 13.3 6.6 7.4 10.0 10.8 8.3 10.0 Mississippi 2.4 6.1 7.2 3.1 6.1 8.0 6.7 Missouri 6.3 6.1 6.8 6.5 11.6 8.6 6.9 Montana 5.9 5.6 4.9 2.5 19.2 4.6 3.7 Nebraska 12.4 7.8 6.6 7.4 25.5 8.4 7.5 Nevada 7.0 5.3 7.3 7.7 8.6 7.5 6.9 New Hampshire 8.0 6.1 9.2 10.1 14.3 9.3 7.3 New Jersey 11.4 6.2 5.9 7.3 15.1 6.4 5.1 New Mexico 8.5 4.3 7.3 8.0 10.9 10.2 6.3 New York 29.7 7.2 10.0 11.4 22.2 11.5 7.7 See notes at end of exhibit.
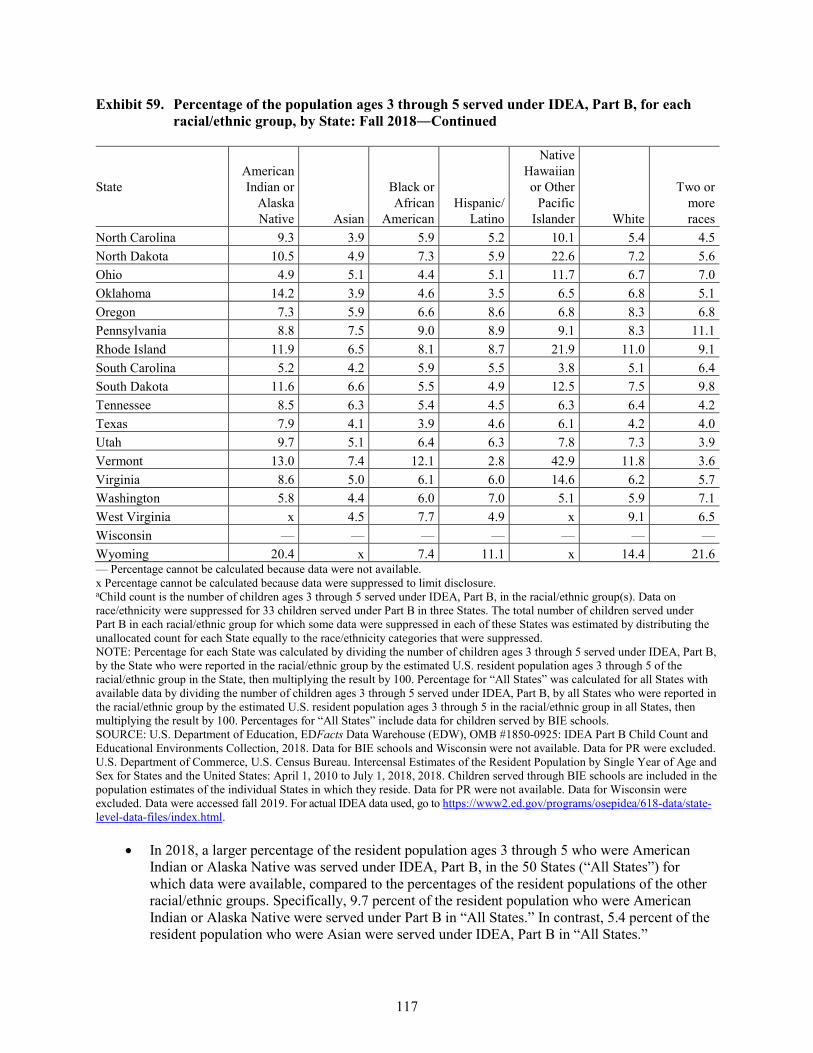
117
Exhibit 59. Percentage of the population ages 3 through 5 served under IDEA, Part B, for each racial/ethnic group, by State: Fall 2018―Continued
State American Indian or
Alaska Native Asian
Black or African
American Hispanic/
Latino
Native Hawaiian or Other
Pacific Islander White
Two or more races
North Carolina 9.3 3.9 5.9 5.2 10.1 5.4 4.5 North Dakota 10.5 4.9 7.3 5.9 22.6 7.2 5.6 Ohio 4.9 5.1 4.4 5.1 11.7 6.7 7.0 Oklahoma 14.2 3.9 4.6 3.5 6.5 6.8 5.1 Oregon 7.3 5.9 6.6 8.6 6.8 8.3 6.8 Pennsylvania 8.8 7.5 9.0 8.9 9.1 8.3 11.1 Rhode Island 11.9 6.5 8.1 8.7 21.9 11.0 9.1 South Carolina 5.2 4.2 5.9 5.5 3.8 5.1 6.4 South Dakota 11.6 6.6 5.5 4.9 12.5 7.5 9.8 Tennessee 8.5 6.3 5.4 4.5 6.3 6.4 4.2 Texas 7.9 4.1 3.9 4.6 6.1 4.2 4.0 Utah 9.7 5.1 6.4 6.3 7.8 7.3 3.9 Vermont 13.0 7.4 12.1 2.8 42.9 11.8 3.6 Virginia 8.6 5.0 6.1 6.0 14.6 6.2 5.7 Washington 5.8 4.4 6.0 7.0 5.1 5.9 7.1 West Virginia x 4.5 7.7 4.9 x 9.1 6.5 Wisconsin — — — — — — — Wyoming 20.4 x 7.4 11.1 x 14.4 21.6 — Percentage cannot be calculated because data were not available. x Percentage cannot be calculated because data were suppressed to limit disclosure. aChild count is the number of children ages 3 through 5 served under IDEA, Part B, in the racial/ethnic group(s). Data on race/ethnicity were suppressed for 33 children served under Part B in three States. The total number of children served under Part B in each racial/ethnic group for which some data were suppressed in each of these States was estimated by distributing the unallocated count for each State equally to the race/ethnicity categories that were suppressed. NOTE: Percentage for each State was calculated by dividing the number of children ages 3 through 5 served under IDEA, Part B, by the State who were reported in the racial/ethnic group by the estimated U.S. resident population ages 3 through 5 of the racial/ethnic group in the State, then multiplying the result by 100. Percentage for “All States” was calculated for all States with available data by dividing the number of children ages 3 through 5 served under IDEA, Part B, by all States who were reported in the racial/ethnic group by the estimated U.S. resident population ages 3 through 5 in the racial/ethnic group in all States, then multiplying the result by 100. Percentages for “All States” include data for children served by BIE schools. SOURCE: U.S. Department of Education, EDFacts Data Warehouse (EDW), OMB #1850-0925: IDEA Part B Child Count and Educational Environments Collection, 2018. Data for BIE schools and Wisconsin were not available. Data for PR were excluded. U.S. Department of Commerce, U.S. Census Bureau. Intercensal Estimates of the Resident Population by Single Year of Age and Sex for States and the United States: April 1, 2010 to July 1, 2018, 2018. Children served through BIE schools are included in the population estimates of the individual States in which they reside. Data for PR were not available. Data for Wisconsin were excluded. Data were accessed fall 2019. For actual IDEA data used, go to https://www2.ed.gov/programs/osepidea/618-data/state-level-data-files/index.html.
• In 2018, a larger percentage of the resident population ages 3 through 5 who were American Indian or Alaska Native was served under IDEA, Part B, in the 50 States (“All States”) for which data were available, compared to the percentages of the resident populations of the other racial/ethnic groups. Specifically, 9.7 percent of the resident population who were American Indian or Alaska Native were served under Part B in “All States.” In contrast, 5.4 percent of the resident population who were Asian were served under IDEA, Part B in “All States.”
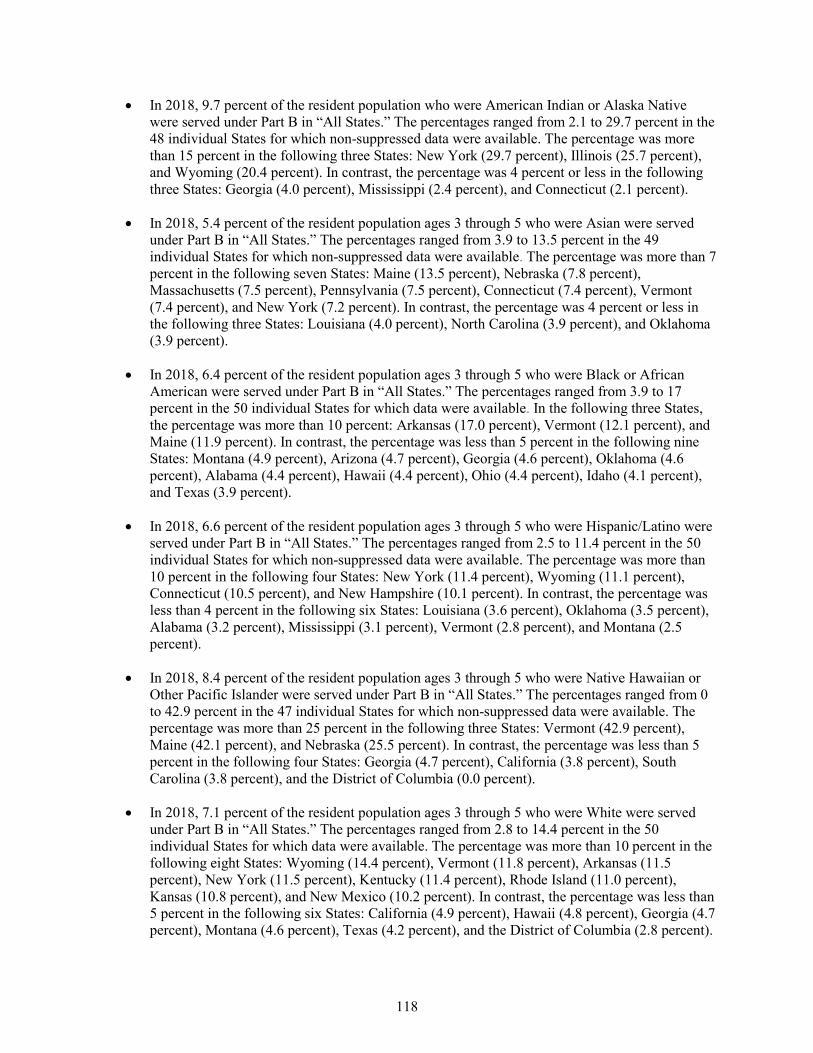
118
• In 2018, 9.7 percent of the resident population who were American Indian or Alaska Native were served under Part B in “All States.” The percentages ranged from 2.1 to 29.7 percent in the 48 individual States for which non-suppressed data were available. The percentage was more than 15 percent in the following three States: New York (29.7 percent), Illinois (25.7 percent), and Wyoming (20.4 percent). In contrast, the percentage was 4 percent or less in the following three States: Georgia (4.0 percent), Mississippi (2.4 percent), and Connecticut (2.1 percent).
• In 2018, 5.4 percent of the resident population ages 3 through 5 who were Asian were served under Part B in “All States.” The percentages ranged from 3.9 to 13.5 percent in the 49 individual States for which non-suppressed data were available. The percentage was more than 7 percent in the following seven States: Maine (13.5 percent), Nebraska (7.8 percent), Massachusetts (7.5 percent), Pennsylvania (7.5 percent), Connecticut (7.4 percent), Vermont (7.4 percent), and New York (7.2 percent). In contrast, the percentage was 4 percent or less in the following three States: Louisiana (4.0 percent), North Carolina (3.9 percent), and Oklahoma (3.9 percent).
• In 2018, 6.4 percent of the resident population ages 3 through 5 who were Black or African American were served under Part B in “All States.” The percentages ranged from 3.9 to 17 percent in the 50 individual States for which data were available. In the following three States, the percentage was more than 10 percent: Arkansas (17.0 percent), Vermont (12.1 percent), and Maine (11.9 percent). In contrast, the percentage was less than 5 percent in the following nine States: Montana (4.9 percent), Arizona (4.7 percent), Georgia (4.6 percent), Oklahoma (4.6 percent), Alabama (4.4 percent), Hawaii (4.4 percent), Ohio (4.4 percent), Idaho (4.1 percent), and Texas (3.9 percent).
• In 2018, 6.6 percent of the resident population ages 3 through 5 who were Hispanic/Latino were served under Part B in “All States.” The percentages ranged from 2.5 to 11.4 percent in the 50 individual States for which non-suppressed data were available. The percentage was more than 10 percent in the following four States: New York (11.4 percent), Wyoming (11.1 percent), Connecticut (10.5 percent), and New Hampshire (10.1 percent). In contrast, the percentage was less than 4 percent in the following six States: Louisiana (3.6 percent), Oklahoma (3.5 percent), Alabama (3.2 percent), Mississippi (3.1 percent), Vermont (2.8 percent), and Montana (2.5 percent).
• In 2018, 8.4 percent of the resident population ages 3 through 5 who were Native Hawaiian or Other Pacific Islander were served under Part B in “All States.” The percentages ranged from 0 to 42.9 percent in the 47 individual States for which non-suppressed data were available. The percentage was more than 25 percent in the following three States: Vermont (42.9 percent), Maine (42.1 percent), and Nebraska (25.5 percent). In contrast, the percentage was less than 5 percent in the following four States: Georgia (4.7 percent), California (3.8 percent), South Carolina (3.8 percent), and the District of Columbia (0.0 percent).
• In 2018, 7.1 percent of the resident population ages 3 through 5 who were White were served under Part B in “All States.” The percentages ranged from 2.8 to 14.4 percent in the 50 individual States for which data were available. The percentage was more than 10 percent in the following eight States: Wyoming (14.4 percent), Vermont (11.8 percent), Arkansas (11.5 percent), New York (11.5 percent), Kentucky (11.4 percent), Rhode Island (11.0 percent), Kansas (10.8 percent), and New Mexico (10.2 percent). In contrast, the percentage was less than 5 percent in the following six States: California (4.9 percent), Hawaii (4.8 percent), Georgia (4.7 percent), Montana (4.6 percent), Texas (4.2 percent), and the District of Columbia (2.8 percent).
119
• In 2018, 6.5 percent of the resident population ages 3 through 5 who were associated with two or more racial/ethnic groups were served under Part B in “All States.” The percentages ranged from 1.8 to 21.6 percent in the 50 individual States for which data were available. In the following four States, the percentage was more than 10 percent: Wyoming (21.6 percent), Pennsylvania (11.1 percent), Illinois (10.3 percent), and Alaska (10.1 percent). In contrast, the percentage was less than 4 percent in the following seven States: Idaho (3.9 percent), Utah (3.9 percent), Montana (3.7 percent), Vermont (3.6 percent), Hawaii (3.3 percent), the District of Columbia (3.1 percent), and Alabama (1.8 percent).
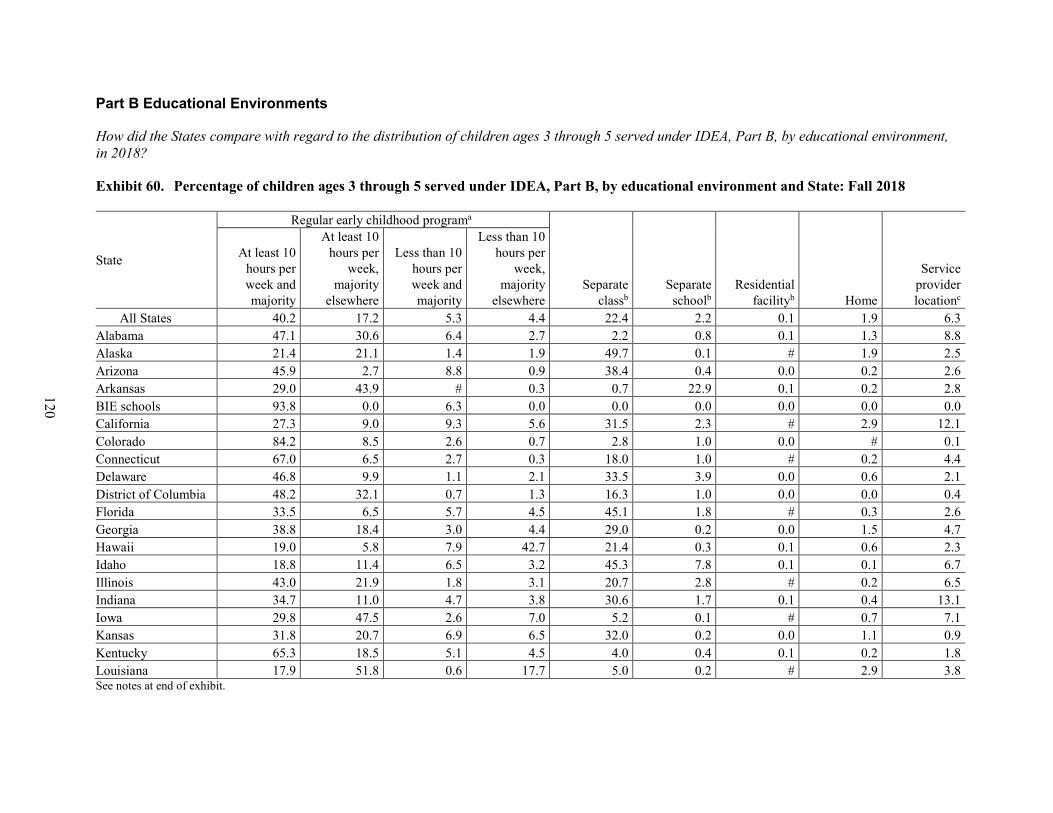
120
Part B Educational Environments
How did the States compare with regard to the distribution of children ages 3 through 5 served under IDEA, Part B, by educational environment, in 2018?
Exhibit 60. Percentage of children ages 3 through 5 served under IDEA, Part B, by educational environment and State: Fall 2018
State
Regular early childhood programa
Separate classb
Separate schoolb
Residential facilityb Home
Service provider locationc
At least 10 hours per week and majority
At least 10 hours per
week, majority
elsewhere
Less than 10 hours per week and majority
Less than 10 hours per
week, majority
elsewhere All States 40.2 17.2 5.3 4.4 22.4 2.2 0.1 1.9 6.3
Alabama 47.1 30.6 6.4 2.7 2.2 0.8 0.1 1.3 8.8 Alaska 21.4 21.1 1.4 1.9 49.7 0.1 # 1.9 2.5 Arizona 45.9 2.7 8.8 0.9 38.4 0.4 0.0 0.2 2.6 Arkansas 29.0 43.9 # 0.3 0.7 22.9 0.1 0.2 2.8 BIE schools 93.8 0.0 6.3 0.0 0.0 0.0 0.0 0.0 0.0 California 27.3 9.0 9.3 5.6 31.5 2.3 # 2.9 12.1 Colorado 84.2 8.5 2.6 0.7 2.8 1.0 0.0 # 0.1 Connecticut 67.0 6.5 2.7 0.3 18.0 1.0 # 0.2 4.4 Delaware 46.8 9.9 1.1 2.1 33.5 3.9 0.0 0.6 2.1 District of Columbia 48.2 32.1 0.7 1.3 16.3 1.0 0.0 0.0 0.4 Florida 33.5 6.5 5.7 4.5 45.1 1.8 # 0.3 2.6 Georgia 38.8 18.4 3.0 4.4 29.0 0.2 0.0 1.5 4.7 Hawaii 19.0 5.8 7.9 42.7 21.4 0.3 0.1 0.6 2.3 Idaho 18.8 11.4 6.5 3.2 45.3 7.8 0.1 0.1 6.7 Illinois 43.0 21.9 1.8 3.1 20.7 2.8 # 0.2 6.5 Indiana 34.7 11.0 4.7 3.8 30.6 1.7 0.1 0.4 13.1 Iowa 29.8 47.5 2.6 7.0 5.2 0.1 # 0.7 7.1 Kansas 31.8 20.7 6.9 6.5 32.0 0.2 0.0 1.1 0.9 Kentucky 65.3 18.5 5.1 4.5 4.0 0.4 0.1 0.2 1.8 Louisiana 17.9 51.8 0.6 17.7 5.0 0.2 # 2.9 3.8 See notes at end of exhibit.
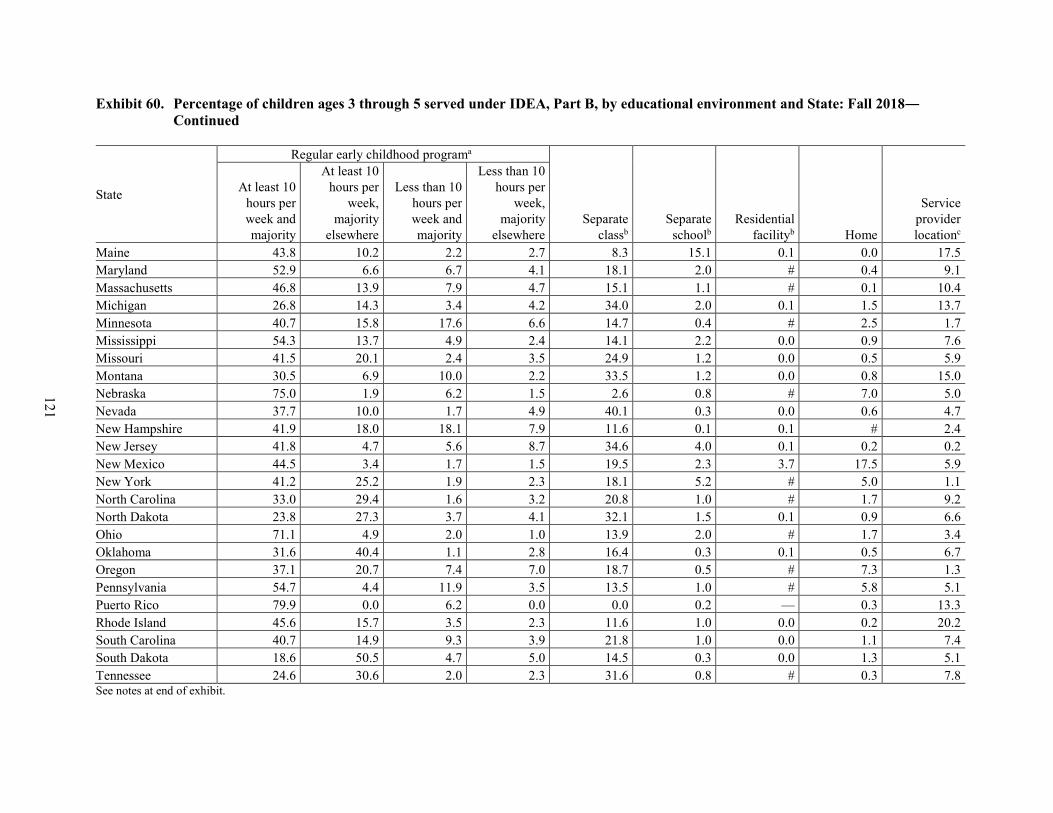
121
Exhibit 60. Percentage of children ages 3 through 5 served under IDEA, Part B, by educational environment and State: Fall 2018― Continued
State
Regular early childhood programa
Separate classb
Separate schoolb
Residential facilityb Home
Service provider locationc
At least 10 hours per week and majority
At least 10 hours per
week, majority
elsewhere
Less than 10 hours per week and majority
Less than 10 hours per
week, majority
elsewhere Maine 43.8 10.2 2.2 2.7 8.3 15.1 0.1 0.0 17.5 Maryland 52.9 6.6 6.7 4.1 18.1 2.0 # 0.4 9.1 Massachusetts 46.8 13.9 7.9 4.7 15.1 1.1 # 0.1 10.4 Michigan 26.8 14.3 3.4 4.2 34.0 2.0 0.1 1.5 13.7 Minnesota 40.7 15.8 17.6 6.6 14.7 0.4 # 2.5 1.7 Mississippi 54.3 13.7 4.9 2.4 14.1 2.2 0.0 0.9 7.6 Missouri 41.5 20.1 2.4 3.5 24.9 1.2 0.0 0.5 5.9 Montana 30.5 6.9 10.0 2.2 33.5 1.2 0.0 0.8 15.0 Nebraska 75.0 1.9 6.2 1.5 2.6 0.8 # 7.0 5.0 Nevada 37.7 10.0 1.7 4.9 40.1 0.3 0.0 0.6 4.7 New Hampshire 41.9 18.0 18.1 7.9 11.6 0.1 0.1 # 2.4 New Jersey 41.8 4.7 5.6 8.7 34.6 4.0 0.1 0.2 0.2 New Mexico 44.5 3.4 1.7 1.5 19.5 2.3 3.7 17.5 5.9 New York 41.2 25.2 1.9 2.3 18.1 5.2 # 5.0 1.1 North Carolina 33.0 29.4 1.6 3.2 20.8 1.0 # 1.7 9.2 North Dakota 23.8 27.3 3.7 4.1 32.1 1.5 0.1 0.9 6.6 Ohio 71.1 4.9 2.0 1.0 13.9 2.0 # 1.7 3.4 Oklahoma 31.6 40.4 1.1 2.8 16.4 0.3 0.1 0.5 6.7 Oregon 37.1 20.7 7.4 7.0 18.7 0.5 # 7.3 1.3 Pennsylvania 54.7 4.4 11.9 3.5 13.5 1.0 # 5.8 5.1 Puerto Rico 79.9 0.0 6.2 0.0 0.0 0.2 — 0.3 13.3 Rhode Island 45.6 15.7 3.5 2.3 11.6 1.0 0.0 0.2 20.2 South Carolina 40.7 14.9 9.3 3.9 21.8 1.0 0.0 1.1 7.4 South Dakota 18.6 50.5 4.7 5.0 14.5 0.3 0.0 1.3 5.1 Tennessee 24.6 30.6 2.0 2.3 31.6 0.8 # 0.3 7.8 See notes at end of exhibit.
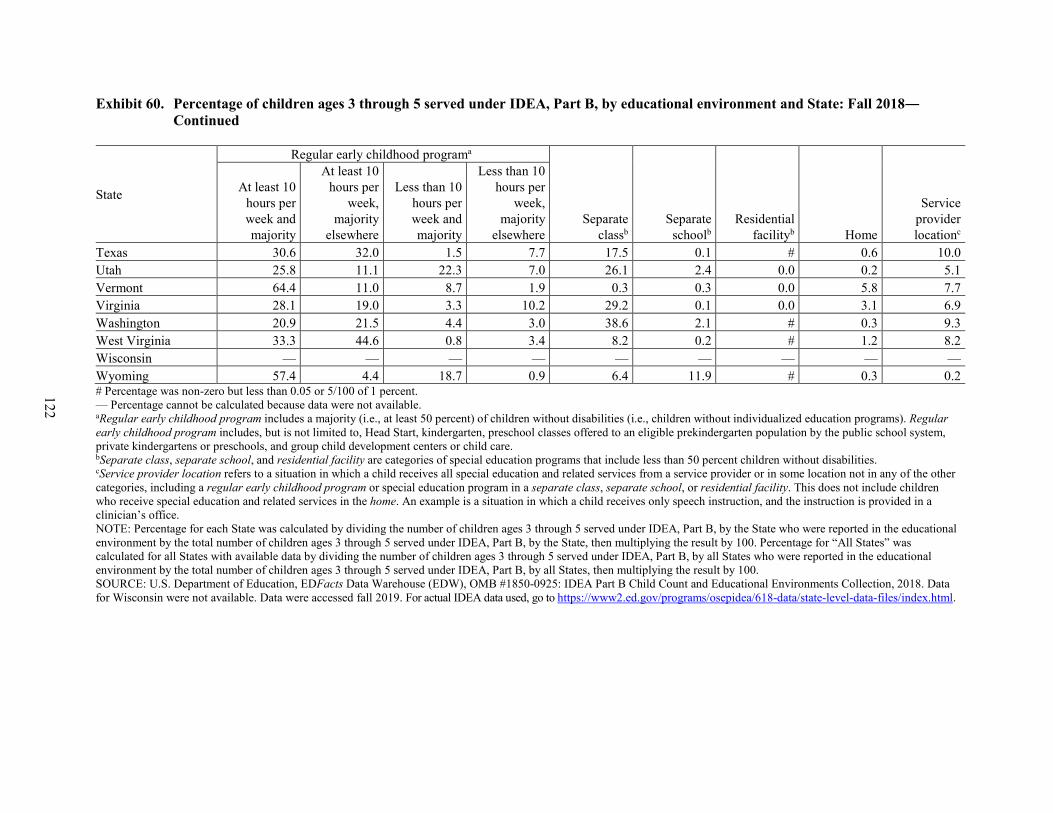
122
Exhibit 60. Percentage of children ages 3 through 5 served under IDEA, Part B, by educational environment and State: Fall 2018― Continued
State
Regular early childhood programa
Separate classb
Separate schoolb
Residential facilityb Home
Service provider locationc
At least 10 hours per week and majority
At least 10 hours per
week, majority
elsewhere
Less than 10 hours per week and majority
Less than 10 hours per
week, majority
elsewhere Texas 30.6 32.0 1.5 7.7 17.5 0.1 # 0.6 10.0 Utah 25.8 11.1 22.3 7.0 26.1 2.4 0.0 0.2 5.1 Vermont 64.4 11.0 8.7 1.9 0.3 0.3 0.0 5.8 7.7 Virginia 28.1 19.0 3.3 10.2 29.2 0.1 0.0 3.1 6.9 Washington 20.9 21.5 4.4 3.0 38.6 2.1 # 0.3 9.3 West Virginia 33.3 44.6 0.8 3.4 8.2 0.2 # 1.2 8.2 Wisconsin — — — — — — — — — Wyoming 57.4 4.4 18.7 0.9 6.4 11.9 # 0.3 0.2 # Percentage was non-zero but less than 0.05 or 5/100 of 1 percent. — Percentage cannot be calculated because data were not available. aRegular early childhood program includes a majority (i.e., at least 50 percent) of children without disabilities (i.e., children without individualized education programs). Regular early childhood program includes, but is not limited to, Head Start, kindergarten, preschool classes offered to an eligible prekindergarten population by the public school system, private kindergartens or preschools, and group child development centers or child care. bSeparate class, separate school, and residential facility are categories of special education programs that include less than 50 percent children without disabilities. cService provider location refers to a situation in which a child receives all special education and related services from a service provider or in some location not in any of the other categories, including a regular early childhood program or special education program in a separate class, separate school, or residential facility. This does not include children who receive special education and related services in the home. An example is a situation in which a child receives only speech instruction, and the instruction is provided in a clinician’s office. NOTE: Percentage for each State was calculated by dividing the number of children ages 3 through 5 served under IDEA, Part B, by the State who were reported in the educational environment by the total number of children ages 3 through 5 served under IDEA, Part B, by the State, then multiplying the result by 100. Percentage for “All States” was calculated for all States with available data by dividing the number of children ages 3 through 5 served under IDEA, Part B, by all States who were reported in the educational environment by the total number of children ages 3 through 5 served under IDEA, Part B, by all States, then multiplying the result by 100. SOURCE: U.S. Department of Education, EDFacts Data Warehouse (EDW), OMB #1850-0925: IDEA Part B Child Count and Educational Environments Collection, 2018. Data for Wisconsin were not available. Data were accessed fall 2019. For actual IDEA data used, go to https://www2.ed.gov/programs/osepidea/618-data/state-level-data-files/index.html.
123
• In 2018, children attending a regular early childhood program at least 10 hours per week and receiving the majority of hours of special education and related services in the regular early childhood program accounted for the largest percentage of children ages 3 to 5 served under IDEA, Part B, in the 52 States (“All States”) for which data were available. Specifically, the percentage associated with this educational environment category for “All States” was 40.2 percent. Separate class accounted for the second largest percentage of students in “All States,” with 22.4 percent of children receiving services in this environment.
• In 31 individual States, children attending a regular early childhood program at least 10 hours per week and receiving the majority of hours of special education and related services in the regular early childhood program accounted for a larger percentage of children than any other educational environment category. In 12 of those States, this category accounted for a majority of the children. The percentage was more than 80 percent in two States: Bureau of Indian Education schools (93.8 percent) and Colorado (84.2 percent).
• In 13 States, separate class accounted for a larger percentage of children than any other educational environment category. The percentage of children accounted for by a separate class was less than 50 percent in all of these States. However, the percentage was more than 45 percent in the following three States: Alaska (49.7 percent), Idaho (45.3 percent), and Florida (45.1 percent).
• In seven States, children attending a regular early childhood program at least 10 hours per week and receiving the majority of hours of special education and related services in some other location accounted for a larger percentage of children than any other educational environment category. The percentage represented a majority of the children in Louisiana (51.8 percent) and South Dakota (50.5 percent).
• The category of children attending a regular early childhood program less than 10 hours per week and receiving the majority of hours of special education and related services in some other location accounted for more children than any other educational environment category in Hawaii (42.7 percent).
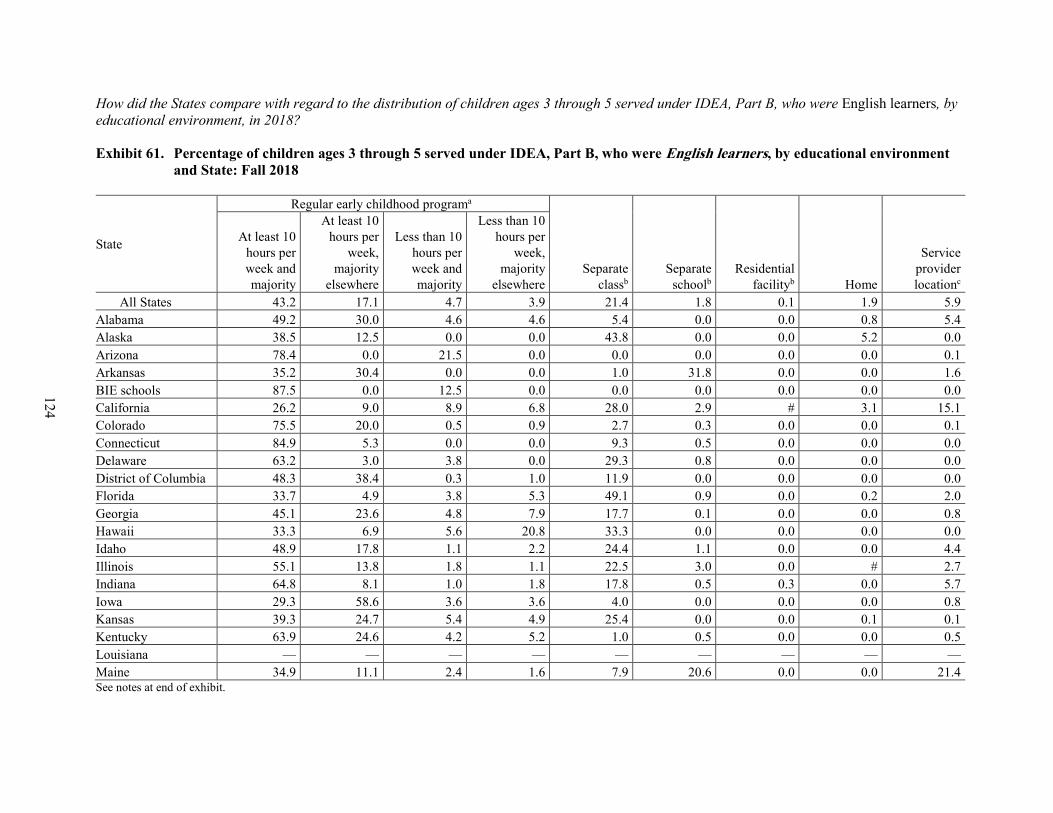
124
How did the States compare with regard to the distribution of children ages 3 through 5 served under IDEA, Part B, who were English learners, by educational environment, in 2018?
Exhibit 61. Percentage of children ages 3 through 5 served under IDEA, Part B, who were English learners, by educational environment and State: Fall 2018
State
Regular early childhood programa
Separate classb
Separate schoolb
Residential facilityb Home
Service provider locationc
At least 10 hours per week and majority
At least 10 hours per
week, majority
elsewhere
Less than 10 hours per week and majority
Less than 10 hours per
week, majority
elsewhere All States 43.2 17.1 4.7 3.9 21.4 1.8 0.1 1.9 5.9
Alabama 49.2 30.0 4.6 4.6 5.4 0.0 0.0 0.8 5.4 Alaska 38.5 12.5 0.0 0.0 43.8 0.0 0.0 5.2 0.0 Arizona 78.4 0.0 21.5 0.0 0.0 0.0 0.0 0.0 0.1 Arkansas 35.2 30.4 0.0 0.0 1.0 31.8 0.0 0.0 1.6 BIE schools 87.5 0.0 12.5 0.0 0.0 0.0 0.0 0.0 0.0 California 26.2 9.0 8.9 6.8 28.0 2.9 # 3.1 15.1 Colorado 75.5 20.0 0.5 0.9 2.7 0.3 0.0 0.0 0.1 Connecticut 84.9 5.3 0.0 0.0 9.3 0.5 0.0 0.0 0.0 Delaware 63.2 3.0 3.8 0.0 29.3 0.8 0.0 0.0 0.0 District of Columbia 48.3 38.4 0.3 1.0 11.9 0.0 0.0 0.0 0.0 Florida 33.7 4.9 3.8 5.3 49.1 0.9 0.0 0.2 2.0 Georgia 45.1 23.6 4.8 7.9 17.7 0.1 0.0 0.0 0.8 Hawaii 33.3 6.9 5.6 20.8 33.3 0.0 0.0 0.0 0.0 Idaho 48.9 17.8 1.1 2.2 24.4 1.1 0.0 0.0 4.4 Illinois 55.1 13.8 1.8 1.1 22.5 3.0 0.0 # 2.7 Indiana 64.8 8.1 1.0 1.8 17.8 0.5 0.3 0.0 5.7 Iowa 29.3 58.6 3.6 3.6 4.0 0.0 0.0 0.0 0.8 Kansas 39.3 24.7 5.4 4.9 25.4 0.0 0.0 0.1 0.1 Kentucky 63.9 24.6 4.2 5.2 1.0 0.5 0.0 0.0 0.5 Louisiana — — — — — — — — — Maine 34.9 11.1 2.4 1.6 7.9 20.6 0.0 0.0 21.4 See notes at end of exhibit.
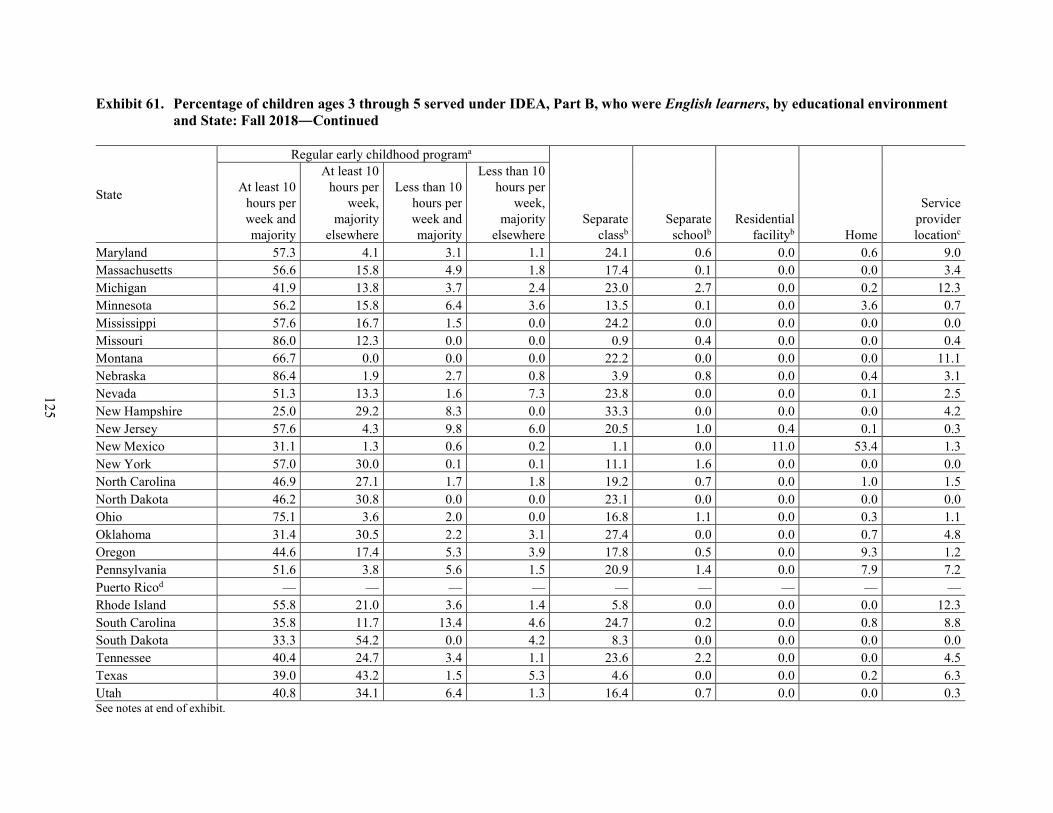
125
Exhibit 61. Percentage of children ages 3 through 5 served under IDEA, Part B, who were English learners, by educational environment and State: Fall 2018―Continued
State
Regular early childhood programa
Separate classb
Separate schoolb
Residential facilityb Home
Service provider locationc
At least 10 hours per week and majority
At least 10 hours per
week, majority
elsewhere
Less than 10 hours per week and majority
Less than 10 hours per
week, majority
elsewhere Maryland 57.3 4.1 3.1 1.1 24.1 0.6 0.0 0.6 9.0 Massachusetts 56.6 15.8 4.9 1.8 17.4 0.1 0.0 0.0 3.4 Michigan 41.9 13.8 3.7 2.4 23.0 2.7 0.0 0.2 12.3 Minnesota 56.2 15.8 6.4 3.6 13.5 0.1 0.0 3.6 0.7 Mississippi 57.6 16.7 1.5 0.0 24.2 0.0 0.0 0.0 0.0 Missouri 86.0 12.3 0.0 0.0 0.9 0.4 0.0 0.0 0.4 Montana 66.7 0.0 0.0 0.0 22.2 0.0 0.0 0.0 11.1 Nebraska 86.4 1.9 2.7 0.8 3.9 0.8 0.0 0.4 3.1 Nevada 51.3 13.3 1.6 7.3 23.8 0.0 0.0 0.1 2.5 New Hampshire 25.0 29.2 8.3 0.0 33.3 0.0 0.0 0.0 4.2 New Jersey 57.6 4.3 9.8 6.0 20.5 1.0 0.4 0.1 0.3 New Mexico 31.1 1.3 0.6 0.2 1.1 0.0 11.0 53.4 1.3 New York 57.0 30.0 0.1 0.1 11.1 1.6 0.0 0.0 0.0 North Carolina 46.9 27.1 1.7 1.8 19.2 0.7 0.0 1.0 1.5 North Dakota 46.2 30.8 0.0 0.0 23.1 0.0 0.0 0.0 0.0 Ohio 75.1 3.6 2.0 0.0 16.8 1.1 0.0 0.3 1.1 Oklahoma 31.4 30.5 2.2 3.1 27.4 0.0 0.0 0.7 4.8 Oregon 44.6 17.4 5.3 3.9 17.8 0.5 0.0 9.3 1.2 Pennsylvania 51.6 3.8 5.6 1.5 20.9 1.4 0.0 7.9 7.2 Puerto Ricod — — — — — — — — — Rhode Island 55.8 21.0 3.6 1.4 5.8 0.0 0.0 0.0 12.3 South Carolina 35.8 11.7 13.4 4.6 24.7 0.2 0.0 0.8 8.8 South Dakota 33.3 54.2 0.0 4.2 8.3 0.0 0.0 0.0 0.0 Tennessee 40.4 24.7 3.4 1.1 23.6 2.2 0.0 0.0 4.5 Texas 39.0 43.2 1.5 5.3 4.6 0.0 0.0 0.2 6.3 Utah 40.8 34.1 6.4 1.3 16.4 0.7 0.0 0.0 0.3 See notes at end of exhibit.
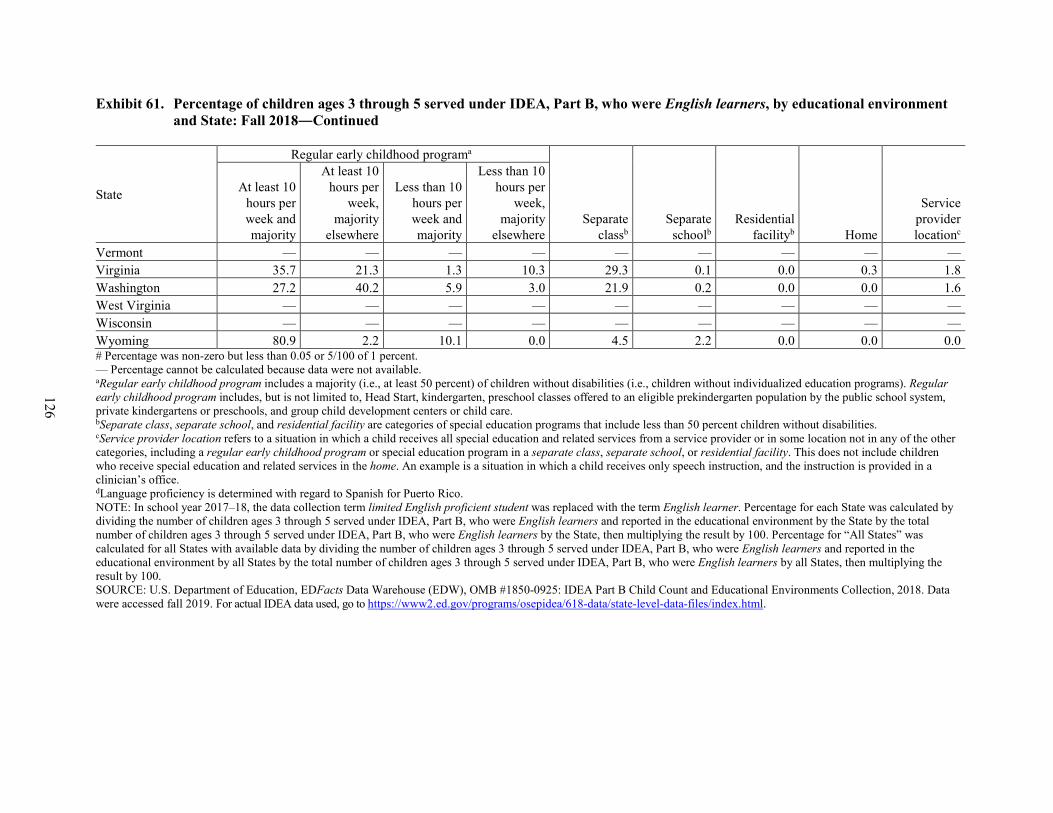
126
Exhibit 61. Percentage of children ages 3 through 5 served under IDEA, Part B, who were English learners, by educational environment and State: Fall 2018―Continued
State
Regular early childhood programa
Separate classb
Separate schoolb
Residential facilityb Home
Service provider locationc
At least 10 hours per week and majority
At least 10 hours per
week, majority
elsewhere
Less than 10 hours per week and majority
Less than 10 hours per
week, majority
elsewhere Vermont — — — — — — — — — Virginia 35.7 21.3 1.3 10.3 29.3 0.1 0.0 0.3 1.8 Washington 27.2 40.2 5.9 3.0 21.9 0.2 0.0 0.0 1.6 West Virginia — — — — — — — — — Wisconsin — — — — — — — — — Wyoming 80.9 2.2 10.1 0.0 4.5 2.2 0.0 0.0 0.0 # Percentage was non-zero but less than 0.05 or 5/100 of 1 percent. — Percentage cannot be calculated because data were not available. aRegular early childhood program includes a majority (i.e., at least 50 percent) of children without disabilities (i.e., children without individualized education programs). Regular early childhood program includes, but is not limited to, Head Start, kindergarten, preschool classes offered to an eligible prekindergarten population by the public school system, private kindergartens or preschools, and group child development centers or child care. bSeparate class, separate school, and residential facility are categories of special education programs that include less than 50 percent children without disabilities. cService provider location refers to a situation in which a child receives all special education and related services from a service provider or in some location not in any of the other categories, including a regular early childhood program or special education program in a separate class, separate school, or residential facility. This does not include children who receive special education and related services in the home. An example is a situation in which a child receives only speech instruction, and the instruction is provided in a clinician’s office. dLanguage proficiency is determined with regard to Spanish for Puerto Rico. NOTE: In school year 2017–18, the data collection term limited English proficient student was replaced with the term English learner. Percentage for each State was calculated by dividing the number of children ages 3 through 5 served under IDEA, Part B, who were English learners and reported in the educational environment by the State by the total number of children ages 3 through 5 served under IDEA, Part B, who were English learners by the State, then multiplying the result by 100. Percentage for “All States” was calculated for all States with available data by dividing the number of children ages 3 through 5 served under IDEA, Part B, who were English learners and reported in the educational environment by all States by the total number of children ages 3 through 5 served under IDEA, Part B, who were English learners by all States, then multiplying the result by 100. SOURCE: U.S. Department of Education, EDFacts Data Warehouse (EDW), OMB #1850-0925: IDEA Part B Child Count and Educational Environments Collection, 2018. Data were accessed fall 2019. For actual IDEA data used, go to https://www2.ed.gov/programs/osepidea/618-data/state-level-data-files/index.html.
127
• In 2018, children attending a regular early childhood program at least 10 hours per week and receiving the majority of hours of special education and related services in the regular early childhood program accounted for the largest percentage of children ages 3 to 5 who were English learners served under IDEA, Part B, in the 48 States (“All States”) that reported some children who were English learners and for which data were available. Specifically, the percentage associated with this educational environment category for “All States” was 43.2 percent. Separate class accounted for the second largest percentage of children in “All States,” with 21.4 percent of children receiving services in this environment.
• In 36 individual States, children attending a regular early childhood program at least 10 hours per week and receiving the majority of hours of special education and related services in the regular early childhood program accounted for a larger percentage of children who were English learners than any other educational environment category. The percentage was larger than 80 percent in the following five States: Bureau of Indian Education schools (87.5 percent), Nebraska (86.4 percent), Missouri (86.0 percent), Connecticut (84.9 percent), and Wyoming (80.9 percent).
• Children attending a regular early childhood program at least 10 hours per week and receiving the majority of hours of special education and related services in some other location accounted for a larger percentage of children who were English learners than any other educational environment category in the following four States: Iowa (58.6 percent), South Dakota (54.2 percent), Texas (43.2 percent), and Washington (40.2 percent).
• Separate class accounted for a larger percentage of children who were English learners than any other educational environment category in the following four States: Florida (49.1 percent), Alaska (43.8 percent), New Hampshire (33.3 percent), and California (28.0 percent).
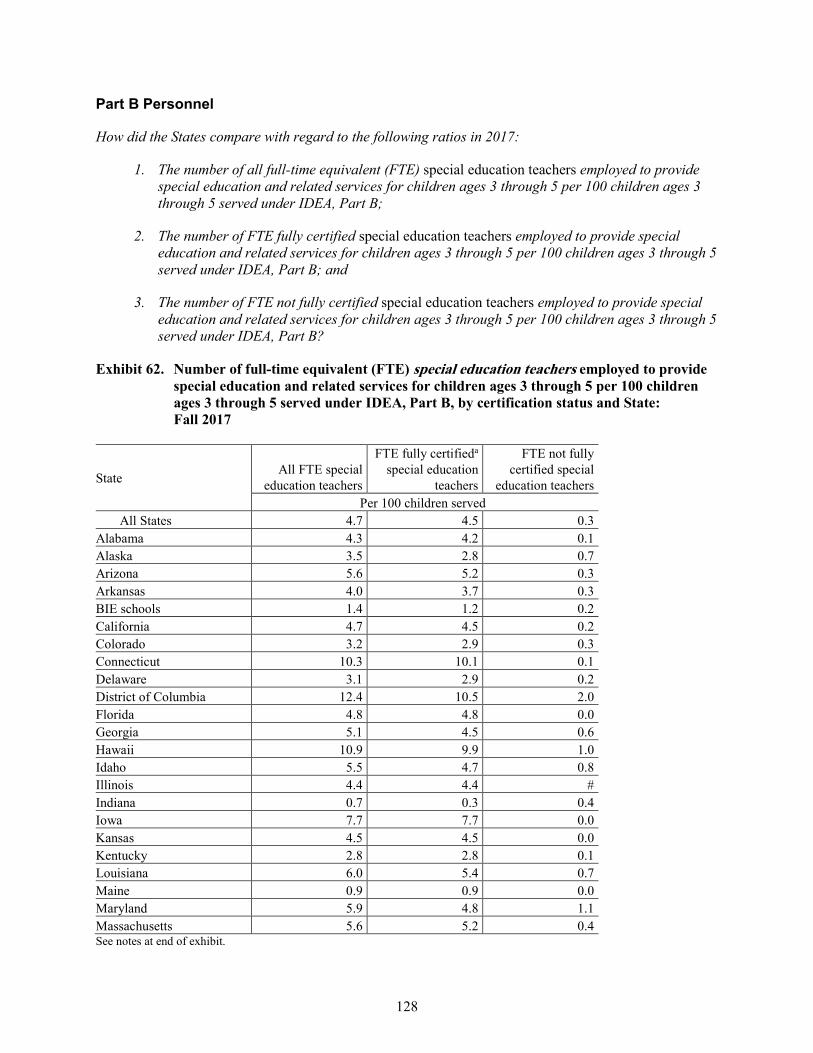
128
Part B Personnel
How did the States compare with regard to the following ratios in 2017:
1. The number of all full-time equivalent (FTE) special education teachers employed to provide special education and related services for children ages 3 through 5 per 100 children ages 3 through 5 served under IDEA, Part B;
2. The number of FTE fully certified special education teachers employed to provide special education and related services for children ages 3 through 5 per 100 children ages 3 through 5 served under IDEA, Part B; and
3. The number of FTE not fully certified special education teachers employed to provide special education and related services for children ages 3 through 5 per 100 children ages 3 through 5 served under IDEA, Part B?
Exhibit 62. Number of full-time equivalent (FTE) special education teachers employed to provide special education and related services for children ages 3 through 5 per 100 children ages 3 through 5 served under IDEA, Part B, by certification status and State: Fall 2017
State All FTE special
education teachers
FTE fully certifieda
special education teachers
FTE not fully certified special
education teachers Per 100 children served
All States 4.7 4.5 0.3 Alabama 4.3 4.2 0.1 Alaska 3.5 2.8 0.7 Arizona 5.6 5.2 0.3 Arkansas 4.0 3.7 0.3 BIE schools 1.4 1.2 0.2 California 4.7 4.5 0.2 Colorado 3.2 2.9 0.3 Connecticut 10.3 10.1 0.1 Delaware 3.1 2.9 0.2 District of Columbia 12.4 10.5 2.0 Florida 4.8 4.8 0.0 Georgia 5.1 4.5 0.6 Hawaii 10.9 9.9 1.0 Idaho 5.5 4.7 0.8 Illinois 4.4 4.4 # Indiana 0.7 0.3 0.4 Iowa 7.7 7.7 0.0 Kansas 4.5 4.5 0.0 Kentucky 2.8 2.8 0.1 Louisiana 6.0 5.4 0.7 Maine 0.9 0.9 0.0 Maryland 5.9 4.8 1.1 Massachusetts 5.6 5.2 0.4 See notes at end of exhibit.
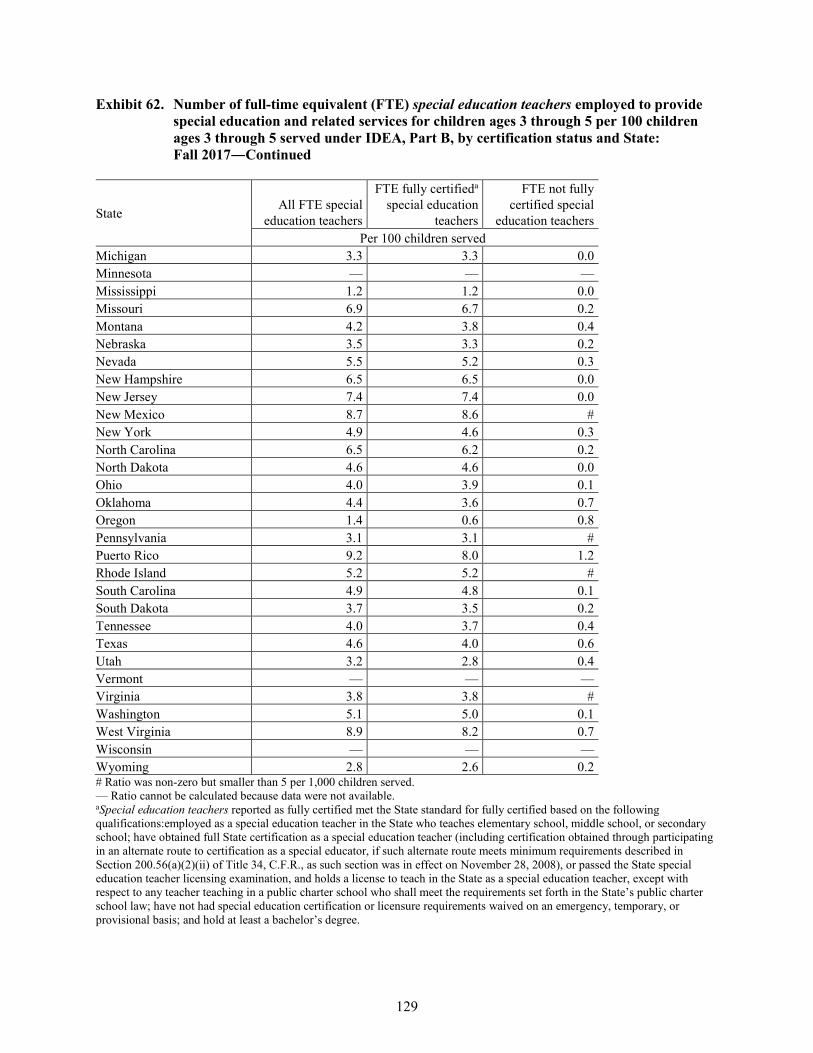
129
Exhibit 62. Number of full-time equivalent (FTE) special education teachers employed to provide special education and related services for children ages 3 through 5 per 100 children ages 3 through 5 served under IDEA, Part B, by certification status and State: Fall 2017―Continued
State All FTE special
education teachers
FTE fully certifieda
special education teachers
FTE not fully certified special
education teachers Per 100 children served
Michigan 3.3 3.3 0.0 Minnesota — — — Mississippi 1.2 1.2 0.0 Missouri 6.9 6.7 0.2 Montana 4.2 3.8 0.4 Nebraska 3.5 3.3 0.2 Nevada 5.5 5.2 0.3 New Hampshire 6.5 6.5 0.0 New Jersey 7.4 7.4 0.0 New Mexico 8.7 8.6 # New York 4.9 4.6 0.3 North Carolina 6.5 6.2 0.2 North Dakota 4.6 4.6 0.0 Ohio 4.0 3.9 0.1 Oklahoma 4.4 3.6 0.7 Oregon 1.4 0.6 0.8 Pennsylvania 3.1 3.1 # Puerto Rico 9.2 8.0 1.2 Rhode Island 5.2 5.2 # South Carolina 4.9 4.8 0.1 South Dakota 3.7 3.5 0.2 Tennessee 4.0 3.7 0.4 Texas 4.6 4.0 0.6 Utah 3.2 2.8 0.4 Vermont — — — Virginia 3.8 3.8 # Washington 5.1 5.0 0.1 West Virginia 8.9 8.2 0.7 Wisconsin — — — Wyoming 2.8 2.6 0.2 # Ratio was non-zero but smaller than 5 per 1,000 children served. — Ratio cannot be calculated because data were not available. aSpecial education teachers reported as fully certified met the State standard for fully certified based on the following qualifications:employed as a special education teacher in the State who teaches elementary school, middle school, or secondary school; have obtained full State certification as a special education teacher (including certification obtained through participating in an alternate route to certification as a special educator, if such alternate route meets minimum requirements described in Section 200.56(a)(2)(ii) of Title 34, C.F.R., as such section was in effect on November 28, 2008), or passed the State special education teacher licensing examination, and holds a license to teach in the State as a special education teacher, except with respect to any teacher teaching in a public charter school who shall meet the requirements set forth in the State’s public charter school law; have not had special education certification or licensure requirements waived on an emergency, temporary, or provisional basis; and hold at least a bachelor’s degree.
130
• In 2017, there were 4.7 FTE special education teachers (including those who were fully certified and not fully certified) employed to provide special education and related services for children ages 3 through 5 served under IDEA, Part B, per 100 children ages 3 through 5 served under IDEA, Part B, in the 50 States for which data were available (“All States”). A ratio of 8 or more FTE special education teachers per 100 children served was observed in the following six States: the District of Columbia (12.4 FTEs per 100 children), Hawaii (10.9 FTEs per 100 children), Connecticut (10.3 FTEs per 100 children), Puerto Rico (9.2 FTEs per 100 children), West Virginia (8.9 FTEs per 100 children), and New Mexico (8.7 FTEs per 100 children). In contrast, the following five States had a ratio smaller than 2 FTE special education teachers per 100 children served: Bureau of Indian Education schools (1.4 FTEs per 100 children), Oregon (1.4 FTEs per 100 children), Mississippi (1.2 FTEs per 100 children), Maine (0.9 FTEs per 100 children), and Indiana (0.7 FTEs per 100 children).
• In 2017, there were 4.5 FTE fully certified special education teachers employed to provide special education and related services for children ages 3 through 5 per 100 children ages 3 through 5 served under IDEA, Part B, in the 50 States for which data were available (“All States”). A ratio of 8 or more FTE fully certified special education teachers per 100 children served was observed in the following six States: the District of Columbia (10.5 FTEs per 100 children), Connecticut (10.1 FTEs per 100 children), Hawaii (9.9 FTEs per 100 children), New Mexico (8.6 FTEs per 100 children), West Virginia (8.2 FTEs per 100 children), and Puerto Rico (8.0 FTEs per 100 children). In contrast, a ratio smaller than 1 FTE fully certified special education teacher per 100 children served was found for the following three States: Maine (0.9 FTEs per 100 children), Oregon (0.6 FTEs per 100 children), and Indiana (0.3 FTEs per 100 children).
• In 2017, there were 0.3 FTE not fully certified special education teachers employed to provide special education and related services for children ages 3 through 5 per 100 children ages 3 through 5 served under IDEA, Part B, in the 50 States for which data were available (“All States”). The ratio was smaller than 1 FTE not fully certified special education teacher per 100 children served for all but the following three States: the District of Columbia (2.0 FTEs per 100 children), Puerto Rico (1.2 FTEs per 100 children), and Maryland (1.1 FTEs per 100 children).
NOTE: Ratio for each State was calculated by dividing the number of all FTE special education teachers, FTE fully certified special education teachers, or FTE not fully certified special education teachers employed to provide special education and related services for children ages 3 through 5 by the State by the total number of children ages 3 through 5 served under IDEA, Part B, by the State, then multiplying the result by 100. Ratio for “All States” was calculated for all States with available data by dividing the number of all FTE special education teachers, FTE fully certified special education teachers, or FTE not fully certified special education teachers employed to provide special education and related services for children ages 3 through 5 by all States by the total number of children ages 3 through 5 served under IDEA, Part B, by all States, then multiplying the result by 100. SOURCE: U.S. Department of Education, EDFacts Data Warehouse (EDW), OMB #1850-0925: IDEA Part B Personnel Collection, 2017. Data for Vermont were not available. Data for Minnesota and Wisconsin were excluded. Data were accessed fall 2019. U.S. Department of Education, EDFacts Data Warehouse (EDW), OMB #1850-0925: IDEA Part B Child Count and Educational Environments Collection, 2017. Data for Minnesota and Wisconsin were not available. Data for Vermont were excluded. Data were accessed fall 2018. For actual IDEA data used, go to https://www2.ed.gov/programs/osepidea/618-data/state-level-data-files/index.html.
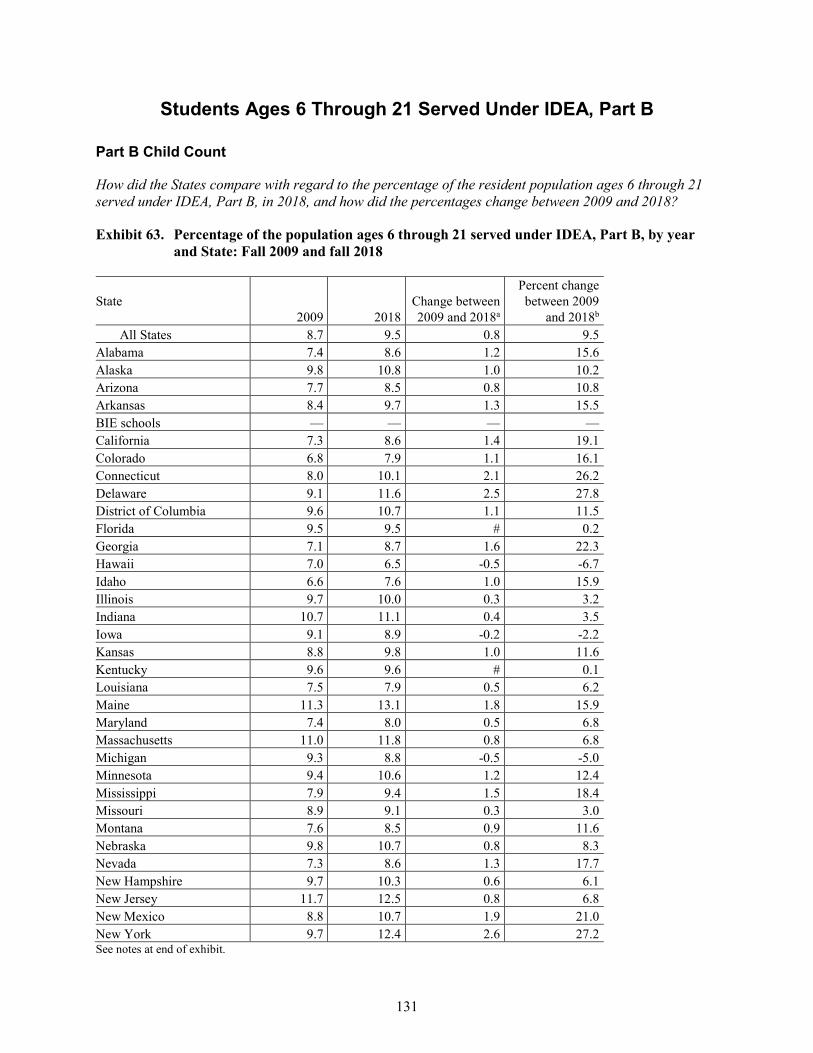
131
Students Ages 6 Through 21 Served Under IDEA, Part B
Part B Child Count
How did the States compare with regard to the percentage of the resident population ages 6 through 21 served under IDEA, Part B, in 2018, and how did the percentages change between 2009 and 2018?
Exhibit 63. Percentage of the population ages 6 through 21 served under IDEA, Part B, by year and State: Fall 2009 and fall 2018
State 2009 2018
Change between 2009 and 2018a
Percent change between 2009
and 2018b All States 8.7 9.5 0.8 9.5
Alabama 7.4 8.6 1.2 15.6 Alaska 9.8 10.8 1.0 10.2 Arizona 7.7 8.5 0.8 10.8 Arkansas 8.4 9.7 1.3 15.5 BIE schools — — — — California 7.3 8.6 1.4 19.1 Colorado 6.8 7.9 1.1 16.1 Connecticut 8.0 10.1 2.1 26.2 Delaware 9.1 11.6 2.5 27.8 District of Columbia 9.6 10.7 1.1 11.5 Florida 9.5 9.5 # 0.2 Georgia 7.1 8.7 1.6 22.3 Hawaii 7.0 6.5 -0.5 -6.7 Idaho 6.6 7.6 1.0 15.9 Illinois 9.7 10.0 0.3 3.2 Indiana 10.7 11.1 0.4 3.5 Iowa 9.1 8.9 -0.2 -2.2 Kansas 8.8 9.8 1.0 11.6 Kentucky 9.6 9.6 # 0.1 Louisiana 7.5 7.9 0.5 6.2 Maine 11.3 13.1 1.8 15.9 Maryland 7.4 8.0 0.5 6.8 Massachusetts 11.0 11.8 0.8 6.8 Michigan 9.3 8.8 -0.5 -5.0 Minnesota 9.4 10.6 1.2 12.4 Mississippi 7.9 9.4 1.5 18.4 Missouri 8.9 9.1 0.3 3.0 Montana 7.6 8.5 0.9 11.6 Nebraska 9.8 10.7 0.8 8.3 Nevada 7.3 8.6 1.3 17.7 New Hampshire 9.7 10.3 0.6 6.1 New Jersey 11.7 12.5 0.8 6.8 New Mexico 8.8 10.7 1.9 21.0 New York 9.7 12.4 2.6 27.2 See notes at end of exhibit.
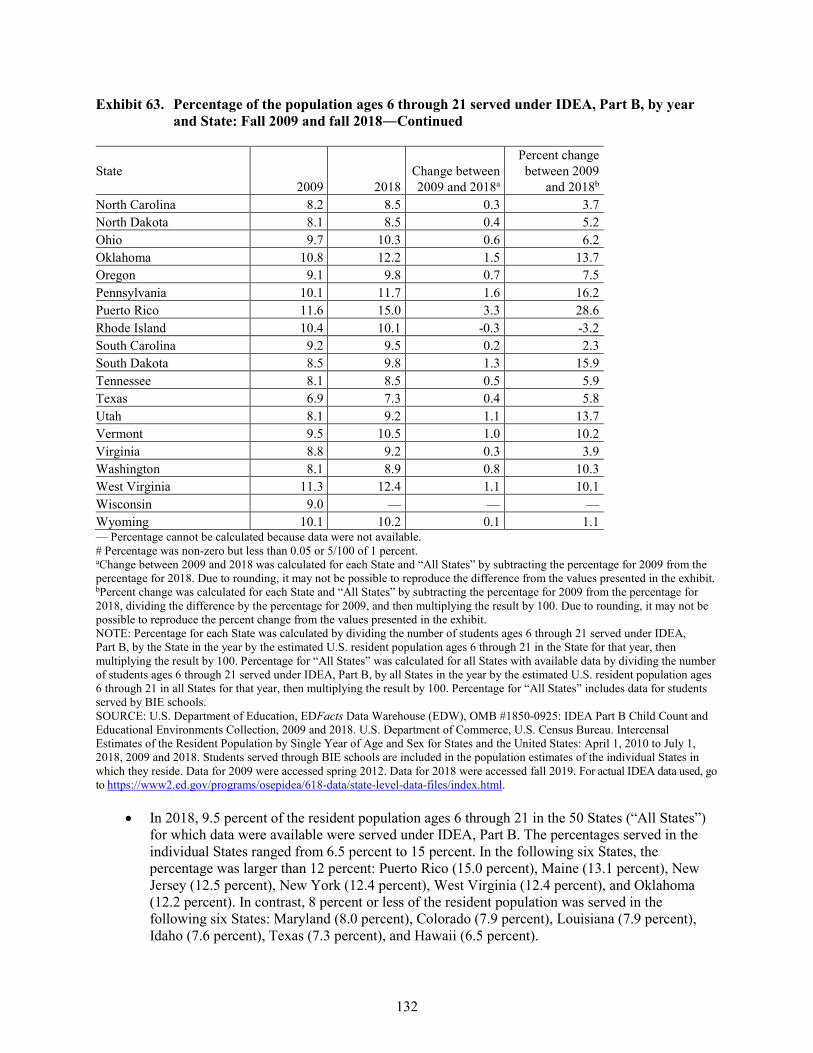
132
Exhibit 63. Percentage of the population ages 6 through 21 served under IDEA, Part B, by year and State: Fall 2009 and fall 2018―Continued
State 2009 2018
Change between 2009 and 2018a
Percent change between 2009
and 2018b North Carolina 8.2 8.5 0.3 3.7 North Dakota 8.1 8.5 0.4 5.2 Ohio 9.7 10.3 0.6 6.2 Oklahoma 10.8 12.2 1.5 13.7 Oregon 9.1 9.8 0.7 7.5 Pennsylvania 10.1 11.7 1.6 16.2 Puerto Rico 11.6 15.0 3.3 28.6 Rhode Island 10.4 10.1 -0.3 -3.2 South Carolina 9.2 9.5 0.2 2.3 South Dakota 8.5 9.8 1.3 15.9 Tennessee 8.1 8.5 0.5 5.9 Texas 6.9 7.3 0.4 5.8 Utah 8.1 9.2 1.1 13.7 Vermont 9.5 10.5 1.0 10.2 Virginia 8.8 9.2 0.3 3.9 Washington 8.1 8.9 0.8 10.3 West Virginia 11.3 12.4 1.1 10.1 Wisconsin 9.0 — — — Wyoming 10.1 10.2 0.1 1.1 — Percentage cannot be calculated because data were not available. # Percentage was non-zero but less than 0.05 or 5/100 of 1 percent. aChange between 2009 and 2018 was calculated for each State and “All States” by subtracting the percentage for 2009 from the percentage for 2018. Due to rounding, it may not be possible to reproduce the difference from the values presented in the exhibit. bPercent change was calculated for each State and “All States” by subtracting the percentage for 2009 from the percentage for 2018, dividing the difference by the percentage for 2009, and then multiplying the result by 100. Due to rounding, it may not be possible to reproduce the percent change from the values presented in the exhibit. NOTE: Percentage for each State was calculated by dividing the number of students ages 6 through 21 served under IDEA, Part B, by the State in the year by the estimated U.S. resident population ages 6 through 21 in the State for that year, then multiplying the result by 100. Percentage for “All States” was calculated for all States with available data by dividing the number of students ages 6 through 21 served under IDEA, Part B, by all States in the year by the estimated U.S. resident population ages 6 through 21 in all States for that year, then multiplying the result by 100. Percentage for “All States” includes data for students served by BIE schools. SOURCE: U.S. Department of Education, EDFacts Data Warehouse (EDW), OMB #1850-0925: IDEA Part B Child Count and Educational Environments Collection, 2009 and 2018. U.S. Department of Commerce, U.S. Census Bureau. Intercensal Estimates of the Resident Population by Single Year of Age and Sex for States and the United States: April 1, 2010 to July 1, 2018, 2009 and 2018. Students served through BIE schools are included in the population estimates of the individual States in which they reside. Data for 2009 were accessed spring 2012. Data for 2018 were accessed fall 2019. For actual IDEA data used, go to https://www2.ed.gov/programs/osepidea/618-data/state-level-data-files/index.html.
• In 2018, 9.5 percent of the resident population ages 6 through 21 in the 50 States (“All States”) for which data were available were served under IDEA, Part B. The percentages served in the individual States ranged from 6.5 percent to 15 percent. In the following six States, the percentage was larger than 12 percent: Puerto Rico (15.0 percent), Maine (13.1 percent), New Jersey (12.5 percent), New York (12.4 percent), West Virginia (12.4 percent), and Oklahoma (12.2 percent). In contrast, 8 percent or less of the resident population was served in the following six States: Maryland (8.0 percent), Colorado (7.9 percent), Louisiana (7.9 percent), Idaho (7.6 percent), Texas (7.3 percent), and Hawaii (6.5 percent).
133
• In 2009, 8.7 percent of the resident population ages 6 through 21 in the 50 States (“All States”) for which data were available were served under IDEA, Part B.
• The percentage of the population served increased by more than 10 percent between 2009 and 2018 for 27 of the 47 States for which data were available at both time points. A percent change greater than 25 percent occurred in the following four States: Puerto Rico (28.6 percent), Delaware (27.8 percent), New York (27.2 percent), and Connecticut (26.2 percent). This change represented a difference greater than 3 percentage points in Puerto Rico (3.3 percentage points).
• Between 2009 and 2018, the following two States experienced a percent change decrease of 5 percent or greater: Hawaii (-6.7 percent) and Michigan (-5.0 percent). However, this change did not represent a difference greater than 1 percentage point for either of these States.
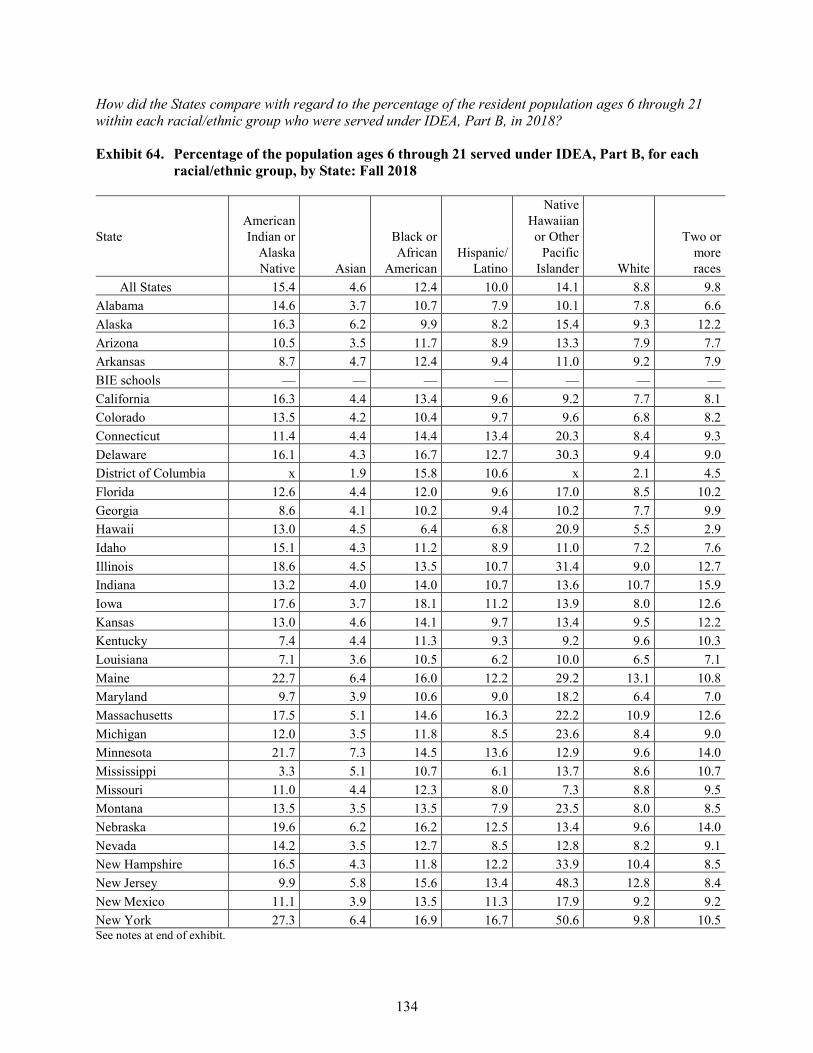
134
How did the States compare with regard to the percentage of the resident population ages 6 through 21 within each racial/ethnic group who were served under IDEA, Part B, in 2018?
Exhibit 64. Percentage of the population ages 6 through 21 served under IDEA, Part B, for each racial/ethnic group, by State: Fall 2018
State American Indian or
Alaska Native Asian
Black or African
American Hispanic/
Latino
Native Hawaiian or Other
Pacific Islander White
Two or more races
All States 15.4 4.6 12.4 10.0 14.1 8.8 9.8 Alabama 14.6 3.7 10.7 7.9 10.1 7.8 6.6 Alaska 16.3 6.2 9.9 8.2 15.4 9.3 12.2 Arizona 10.5 3.5 11.7 8.9 13.3 7.9 7.7 Arkansas 8.7 4.7 12.4 9.4 11.0 9.2 7.9 BIE schools — — — — — — — California 16.3 4.4 13.4 9.6 9.2 7.7 8.1 Colorado 13.5 4.2 10.4 9.7 9.6 6.8 8.2 Connecticut 11.4 4.4 14.4 13.4 20.3 8.4 9.3 Delaware 16.1 4.3 16.7 12.7 30.3 9.4 9.0 District of Columbia x 1.9 15.8 10.6 x 2.1 4.5 Florida 12.6 4.4 12.0 9.6 17.0 8.5 10.2 Georgia 8.6 4.1 10.2 9.4 10.2 7.7 9.9 Hawaii 13.0 4.5 6.4 6.8 20.9 5.5 2.9 Idaho 15.1 4.3 11.2 8.9 11.0 7.2 7.6 Illinois 18.6 4.5 13.5 10.7 31.4 9.0 12.7 Indiana 13.2 4.0 14.0 10.7 13.6 10.7 15.9 Iowa 17.6 3.7 18.1 11.2 13.9 8.0 12.6 Kansas 13.0 4.6 14.1 9.7 13.4 9.5 12.2 Kentucky 7.4 4.4 11.3 9.3 9.2 9.6 10.3 Louisiana 7.1 3.6 10.5 6.2 10.0 6.5 7.1 Maine 22.7 6.4 16.0 12.2 29.2 13.1 10.8 Maryland 9.7 3.9 10.6 9.0 18.2 6.4 7.0 Massachusetts 17.5 5.1 14.6 16.3 22.2 10.9 12.6 Michigan 12.0 3.5 11.8 8.5 23.6 8.4 9.0 Minnesota 21.7 7.3 14.5 13.6 12.9 9.6 14.0 Mississippi 3.3 5.1 10.7 6.1 13.7 8.6 10.7 Missouri 11.0 4.4 12.3 8.0 7.3 8.8 9.5 Montana 13.5 3.5 13.5 7.9 23.5 8.0 8.5 Nebraska 19.6 6.2 16.2 12.5 13.4 9.6 14.0 Nevada 14.2 3.5 12.7 8.5 12.8 8.2 9.1 New Hampshire 16.5 4.3 11.8 12.2 33.9 10.4 8.5 New Jersey 9.9 5.8 15.6 13.4 48.3 12.8 8.4 New Mexico 11.1 3.9 13.5 11.3 17.9 9.2 9.2 New York 27.3 6.4 16.9 16.7 50.6 9.8 10.5 See notes at end of exhibit.
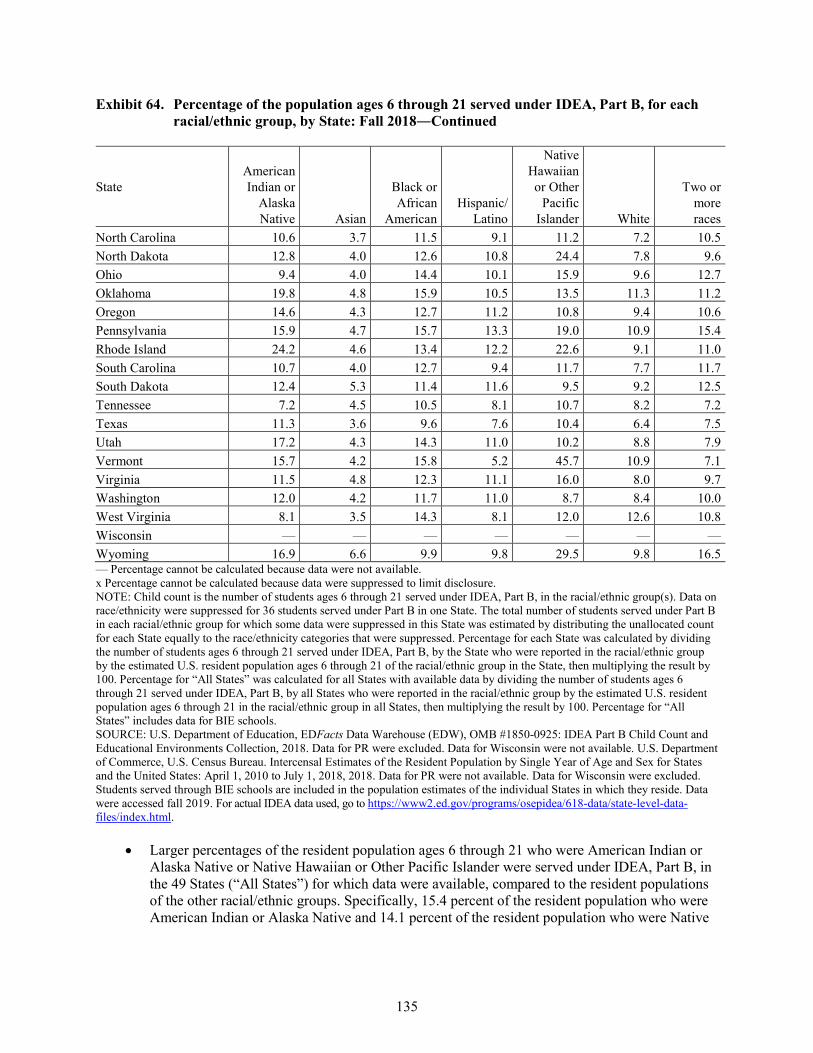
135
Exhibit 64. Percentage of the population ages 6 through 21 served under IDEA, Part B, for each racial/ethnic group, by State: Fall 2018―Continued
State American Indian or
Alaska Native Asian
Black or African
American Hispanic/
Latino
Native Hawaiian or Other
Pacific Islander White
Two or more races
North Carolina 10.6 3.7 11.5 9.1 11.2 7.2 10.5 North Dakota 12.8 4.0 12.6 10.8 24.4 7.8 9.6 Ohio 9.4 4.0 14.4 10.1 15.9 9.6 12.7 Oklahoma 19.8 4.8 15.9 10.5 13.5 11.3 11.2 Oregon 14.6 4.3 12.7 11.2 10.8 9.4 10.6 Pennsylvania 15.9 4.7 15.7 13.3 19.0 10.9 15.4 Rhode Island 24.2 4.6 13.4 12.2 22.6 9.1 11.0 South Carolina 10.7 4.0 12.7 9.4 11.7 7.7 11.7 South Dakota 12.4 5.3 11.4 11.6 9.5 9.2 12.5 Tennessee 7.2 4.5 10.5 8.1 10.7 8.2 7.2 Texas 11.3 3.6 9.6 7.6 10.4 6.4 7.5 Utah 17.2 4.3 14.3 11.0 10.2 8.8 7.9 Vermont 15.7 4.2 15.8 5.2 45.7 10.9 7.1 Virginia 11.5 4.8 12.3 11.1 16.0 8.0 9.7 Washington 12.0 4.2 11.7 11.0 8.7 8.4 10.0 West Virginia 8.1 3.5 14.3 8.1 12.0 12.6 10.8 Wisconsin — — — — — — — Wyoming 16.9 6.6 9.9 9.8 29.5 9.8 16.5 — Percentage cannot be calculated because data were not available. x Percentage cannot be calculated because data were suppressed to limit disclosure. NOTE: Child count is the number of students ages 6 through 21 served under IDEA, Part B, in the racial/ethnic group(s). Data on race/ethnicity were suppressed for 36 students served under Part B in one State. The total number of students served under Part B in each racial/ethnic group for which some data were suppressed in this State was estimated by distributing the unallocated count for each State equally to the race/ethnicity categories that were suppressed. Percentage for each State was calculated by dividing the number of students ages 6 through 21 served under IDEA, Part B, by the State who were reported in the racial/ethnic group by the estimated U.S. resident population ages 6 through 21 of the racial/ethnic group in the State, then multiplying the result by 100. Percentage for “All States” was calculated for all States with available data by dividing the number of students ages 6 through 21 served under IDEA, Part B, by all States who were reported in the racial/ethnic group by the estimated U.S. resident population ages 6 through 21 in the racial/ethnic group in all States, then multiplying the result by 100. Percentage for “All States” includes data for BIE schools. SOURCE: U.S. Department of Education, EDFacts Data Warehouse (EDW), OMB #1850-0925: IDEA Part B Child Count and Educational Environments Collection, 2018. Data for PR were excluded. Data for Wisconsin were not available. U.S. Department of Commerce, U.S. Census Bureau. Intercensal Estimates of the Resident Population by Single Year of Age and Sex for States and the United States: April 1, 2010 to July 1, 2018, 2018. Data for PR were not available. Data for Wisconsin were excluded. Students served through BIE schools are included in the population estimates of the individual States in which they reside. Data were accessed fall 2019. For actual IDEA data used, go to https://www2.ed.gov/programs/osepidea/618-data/state-level-data-files/index.html.
• Larger percentages of the resident population ages 6 through 21 who were American Indian or Alaska Native or Native Hawaiian or Other Pacific Islander were served under IDEA, Part B, in the 49 States (“All States”) for which data were available, compared to the resident populations of the other racial/ethnic groups. Specifically, 15.4 percent of the resident population who were American Indian or Alaska Native and 14.1 percent of the resident population who were Native
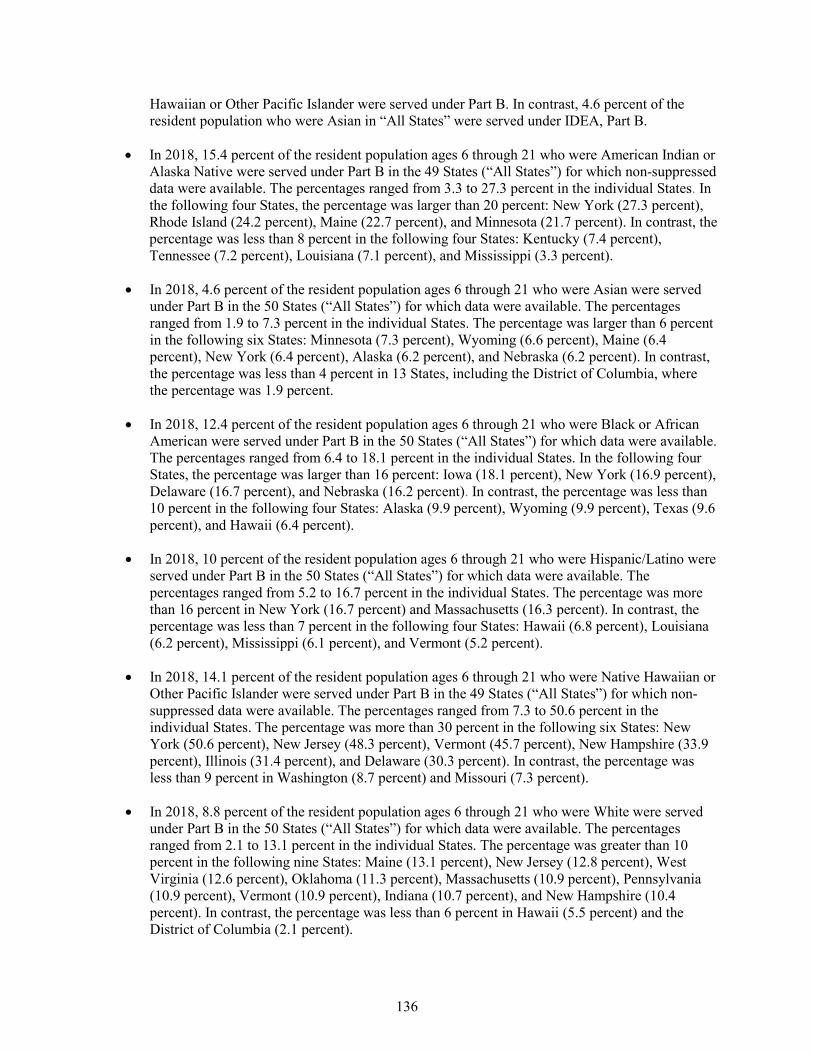
136
Hawaiian or Other Pacific Islander were served under Part B. In contrast, 4.6 percent of the resident population who were Asian in “All States” were served under IDEA, Part B.
• In 2018, 15.4 percent of the resident population ages 6 through 21 who were American Indian or Alaska Native were served under Part B in the 49 States (“All States”) for which non-suppressed data were available. The percentages ranged from 3.3 to 27.3 percent in the individual States. In the following four States, the percentage was larger than 20 percent: New York (27.3 percent), Rhode Island (24.2 percent), Maine (22.7 percent), and Minnesota (21.7 percent). In contrast, the percentage was less than 8 percent in the following four States: Kentucky (7.4 percent), Tennessee (7.2 percent), Louisiana (7.1 percent), and Mississippi (3.3 percent).
• In 2018, 4.6 percent of the resident population ages 6 through 21 who were Asian were served under Part B in the 50 States (“All States”) for which data were available. The percentages ranged from 1.9 to 7.3 percent in the individual States. The percentage was larger than 6 percent in the following six States: Minnesota (7.3 percent), Wyoming (6.6 percent), Maine (6.4 percent), New York (6.4 percent), Alaska (6.2 percent), and Nebraska (6.2 percent). In contrast, the percentage was less than 4 percent in 13 States, including the District of Columbia, where the percentage was 1.9 percent.
• In 2018, 12.4 percent of the resident population ages 6 through 21 who were Black or African American were served under Part B in the 50 States (“All States”) for which data were available. The percentages ranged from 6.4 to 18.1 percent in the individual States. In the following four States, the percentage was larger than 16 percent: Iowa (18.1 percent), New York (16.9 percent), Delaware (16.7 percent), and Nebraska (16.2 percent). In contrast, the percentage was less than 10 percent in the following four States: Alaska (9.9 percent), Wyoming (9.9 percent), Texas (9.6 percent), and Hawaii (6.4 percent).
• In 2018, 10 percent of the resident population ages 6 through 21 who were Hispanic/Latino were served under Part B in the 50 States (“All States”) for which data were available. The percentages ranged from 5.2 to 16.7 percent in the individual States. The percentage was more than 16 percent in New York (16.7 percent) and Massachusetts (16.3 percent). In contrast, the percentage was less than 7 percent in the following four States: Hawaii (6.8 percent), Louisiana (6.2 percent), Mississippi (6.1 percent), and Vermont (5.2 percent).
• In 2018, 14.1 percent of the resident population ages 6 through 21 who were Native Hawaiian or Other Pacific Islander were served under Part B in the 49 States (“All States”) for which non-suppressed data were available. The percentages ranged from 7.3 to 50.6 percent in the individual States. The percentage was more than 30 percent in the following six States: New York (50.6 percent), New Jersey (48.3 percent), Vermont (45.7 percent), New Hampshire (33.9 percent), Illinois (31.4 percent), and Delaware (30.3 percent). In contrast, the percentage was less than 9 percent in Washington (8.7 percent) and Missouri (7.3 percent).
• In 2018, 8.8 percent of the resident population ages 6 through 21 who were White were served under Part B in the 50 States (“All States”) for which data were available. The percentages ranged from 2.1 to 13.1 percent in the individual States. The percentage was greater than 10 percent in the following nine States: Maine (13.1 percent), New Jersey (12.8 percent), West Virginia (12.6 percent), Oklahoma (11.3 percent), Massachusetts (10.9 percent), Pennsylvania (10.9 percent), Vermont (10.9 percent), Indiana (10.7 percent), and New Hampshire (10.4 percent). In contrast, the percentage was less than 6 percent in Hawaii (5.5 percent) and the District of Columbia (2.1 percent).
137
• In 2018, 9.8 percent of the resident population ages 6 through 21 who were associated with two or more races were served under Part B in the 50 States (“All States”) for which data were available. The percentages ranged from 2.9 to 16.5 percent in the individual States. The percentage was greater than 13 percent in the following five States: Wyoming (16.5 percent), Indiana (15.9 percent), Pennsylvania (15.4 percent), Minnesota (14.0 percent), and Nebraska (14.0 percent). In contrast, the percentage was less than 5 percent in the District of Columbia (4.5 percent) and Hawaii (2.9 percent).
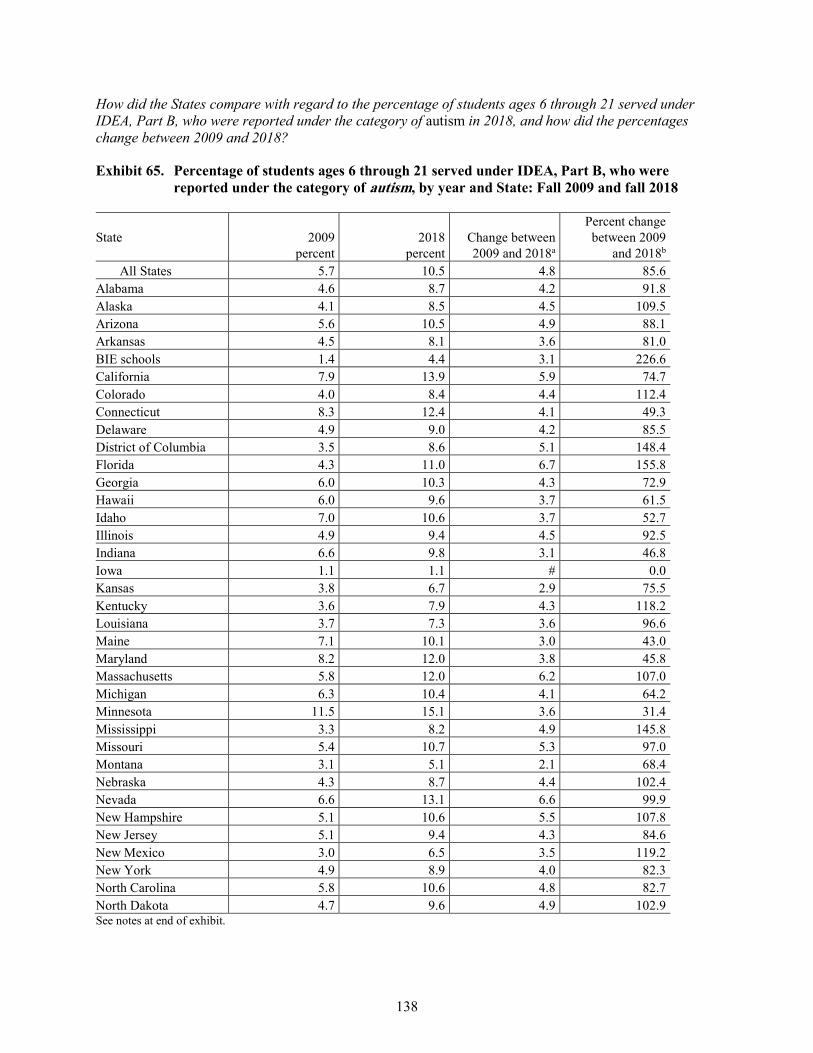
138
How did the States compare with regard to the percentage of students ages 6 through 21 served under IDEA, Part B, who were reported under the category of autism in 2018, and how did the percentages change between 2009 and 2018?
Exhibit 65. Percentage of students ages 6 through 21 served under IDEA, Part B, who were reported under the category of autism, by year and State: Fall 2009 and fall 2018
State 2009 percent
2018 percent
Change between 2009 and 2018a
Percent change between 2009
and 2018b All States 5.7 10.5 4.8 85.6
Alabama 4.6 8.7 4.2 91.8 Alaska 4.1 8.5 4.5 109.5 Arizona 5.6 10.5 4.9 88.1 Arkansas 4.5 8.1 3.6 81.0 BIE schools 1.4 4.4 3.1 226.6 California 7.9 13.9 5.9 74.7 Colorado 4.0 8.4 4.4 112.4 Connecticut 8.3 12.4 4.1 49.3 Delaware 4.9 9.0 4.2 85.5 District of Columbia 3.5 8.6 5.1 148.4 Florida 4.3 11.0 6.7 155.8 Georgia 6.0 10.3 4.3 72.9 Hawaii 6.0 9.6 3.7 61.5 Idaho 7.0 10.6 3.7 52.7 Illinois 4.9 9.4 4.5 92.5 Indiana 6.6 9.8 3.1 46.8 Iowa 1.1 1.1 # 0.0 Kansas 3.8 6.7 2.9 75.5 Kentucky 3.6 7.9 4.3 118.2 Louisiana 3.7 7.3 3.6 96.6 Maine 7.1 10.1 3.0 43.0 Maryland 8.2 12.0 3.8 45.8 Massachusetts 5.8 12.0 6.2 107.0 Michigan 6.3 10.4 4.1 64.2 Minnesota 11.5 15.1 3.6 31.4 Mississippi 3.3 8.2 4.9 145.8 Missouri 5.4 10.7 5.3 97.0 Montana 3.1 5.1 2.1 68.4 Nebraska 4.3 8.7 4.4 102.4 Nevada 6.6 13.1 6.6 99.9 New Hampshire 5.1 10.6 5.5 107.8 New Jersey 5.1 9.4 4.3 84.6 New Mexico 3.0 6.5 3.5 119.2 New York 4.9 8.9 4.0 82.3 North Carolina 5.8 10.6 4.8 82.7 North Dakota 4.7 9.6 4.9 102.9 See notes at end of exhibit.
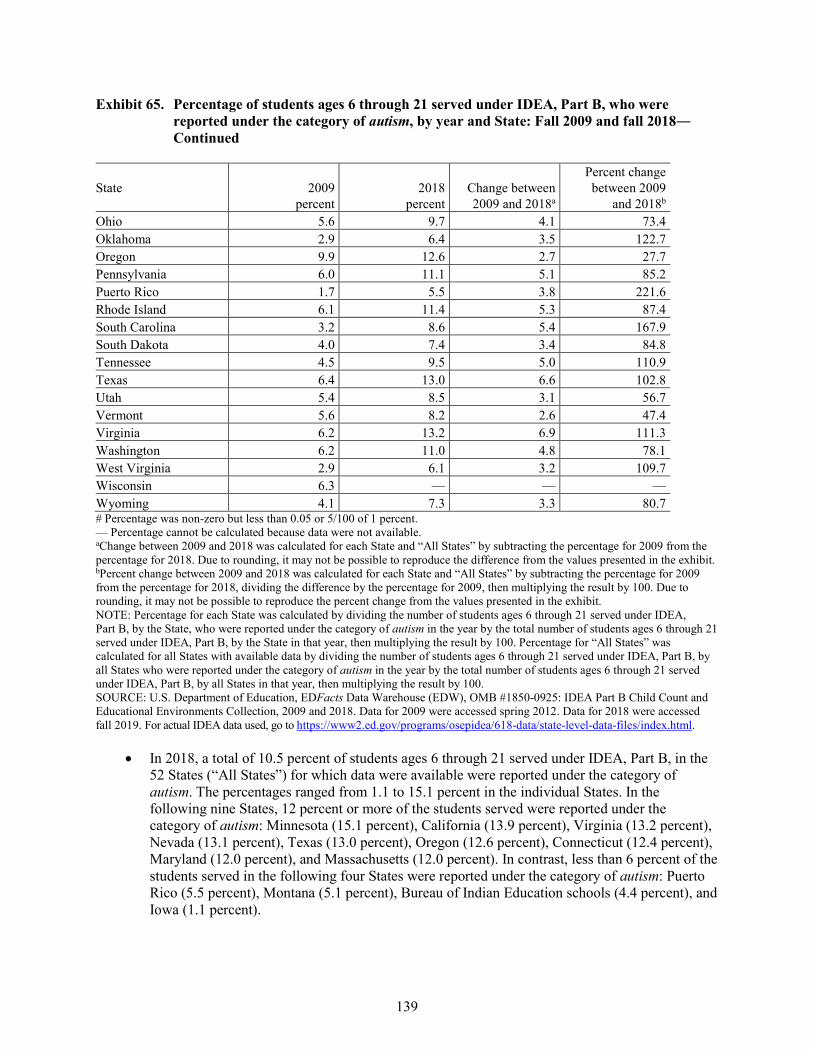
139
Exhibit 65. Percentage of students ages 6 through 21 served under IDEA, Part B, who were reported under the category of autism, by year and State: Fall 2009 and fall 2018― Continued
State 2009 percent
2018 percent
Change between 2009 and 2018a
Percent change between 2009
and 2018b Ohio 5.6 9.7 4.1 73.4 Oklahoma 2.9 6.4 3.5 122.7 Oregon 9.9 12.6 2.7 27.7 Pennsylvania 6.0 11.1 5.1 85.2 Puerto Rico 1.7 5.5 3.8 221.6 Rhode Island 6.1 11.4 5.3 87.4 South Carolina 3.2 8.6 5.4 167.9 South Dakota 4.0 7.4 3.4 84.8 Tennessee 4.5 9.5 5.0 110.9 Texas 6.4 13.0 6.6 102.8 Utah 5.4 8.5 3.1 56.7 Vermont 5.6 8.2 2.6 47.4 Virginia 6.2 13.2 6.9 111.3 Washington 6.2 11.0 4.8 78.1 West Virginia 2.9 6.1 3.2 109.7 Wisconsin 6.3 — — — Wyoming 4.1 7.3 3.3 80.7 # Percentage was non-zero but less than 0.05 or 5/100 of 1 percent. — Percentage cannot be calculated because data were not available. aChange between 2009 and 2018 was calculated for each State and “All States” by subtracting the percentage for 2009 from the percentage for 2018. Due to rounding, it may not be possible to reproduce the difference from the values presented in the exhibit. bPercent change between 2009 and 2018 was calculated for each State and “All States” by subtracting the percentage for 2009 from the percentage for 2018, dividing the difference by the percentage for 2009, then multiplying the result by 100. Due to rounding, it may not be possible to reproduce the percent change from the values presented in the exhibit. NOTE: Percentage for each State was calculated by dividing the number of students ages 6 through 21 served under IDEA, Part B, by the State, who were reported under the category of autism in the year by the total number of students ages 6 through 21 served under IDEA, Part B, by the State in that year, then multiplying the result by 100. Percentage for “All States” was calculated for all States with available data by dividing the number of students ages 6 through 21 served under IDEA, Part B, by all States who were reported under the category of autism in the year by the total number of students ages 6 through 21 served under IDEA, Part B, by all States in that year, then multiplying the result by 100. SOURCE: U.S. Department of Education, EDFacts Data Warehouse (EDW), OMB #1850-0925: IDEA Part B Child Count and Educational Environments Collection, 2009 and 2018. Data for 2009 were accessed spring 2012. Data for 2018 were accessed fall 2019. For actual IDEA data used, go to https://www2.ed.gov/programs/osepidea/618-data/state-level-data-files/index.html.
• In 2018, a total of 10.5 percent of students ages 6 through 21 served under IDEA, Part B, in the 52 States (“All States”) for which data were available were reported under the category of autism. The percentages ranged from 1.1 to 15.1 percent in the individual States. In the following nine States, 12 percent or more of the students served were reported under the category of autism: Minnesota (15.1 percent), California (13.9 percent), Virginia (13.2 percent), Nevada (13.1 percent), Texas (13.0 percent), Oregon (12.6 percent), Connecticut (12.4 percent), Maryland (12.0 percent), and Massachusetts (12.0 percent). In contrast, less than 6 percent of the students served in the following four States were reported under the category of autism: Puerto Rico (5.5 percent), Montana (5.1 percent), Bureau of Indian Education schools (4.4 percent), and Iowa (1.1 percent).
140
• In 2009, a total of 5.7 percent of students ages 6 through 21 served under IDEA, Part B, in the 53 States (“All States”) for which data were available were reported under the category of autism.
• The percentage of students ages 6 through 21 served under IDEA, Part B, who were reported under the category of autism was larger in 2018 than in 2009 in 51 of the 52 States for which data for both time periods were available. The sole exception was Iowa.
• The percent change for 19 of the 51 States in which a larger percentage of the students ages 6 through 21 served under IDEA, Part B, were reported under the category of autism in 2018 than in 2009 exceeded 100 percent. A percent change increase of more than 200 percent was found in Bureau of Indian Education schools (226.6 percent) and Puerto Rico (221.6 percent). This percent change represented a difference of less than 4 percentage points for Bureau of Indian Education schools (3.1 percentage points) and Puerto Rico (3.8 percentage points).
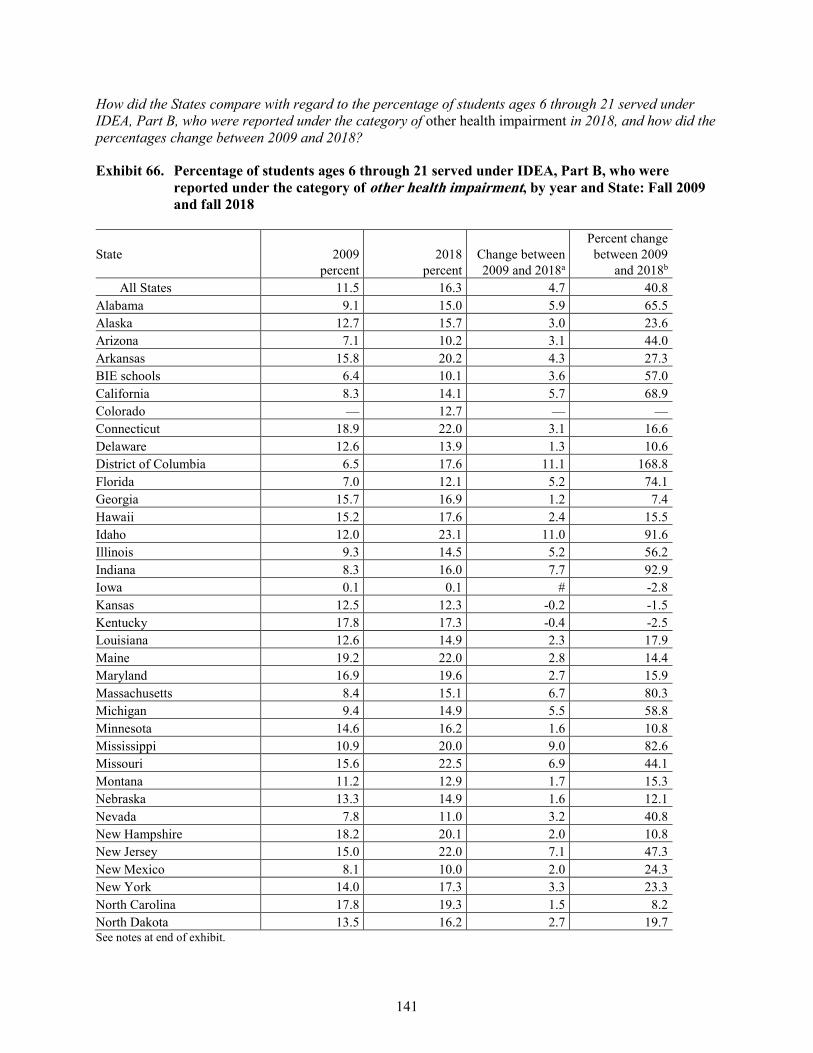
141
How did the States compare with regard to the percentage of students ages 6 through 21 served under IDEA, Part B, who were reported under the category of other health impairment in 2018, and how did the percentages change between 2009 and 2018?
Exhibit 66. Percentage of students ages 6 through 21 served under IDEA, Part B, who were reported under the category of other health impairment, by year and State: Fall 2009 and fall 2018
State 2009 percent
2018 percent
Change between 2009 and 2018a
Percent change between 2009
and 2018b All States 11.5 16.3 4.7 40.8
Alabama 9.1 15.0 5.9 65.5 Alaska 12.7 15.7 3.0 23.6 Arizona 7.1 10.2 3.1 44.0 Arkansas 15.8 20.2 4.3 27.3 BIE schools 6.4 10.1 3.6 57.0 California 8.3 14.1 5.7 68.9 Colorado — 12.7 — — Connecticut 18.9 22.0 3.1 16.6 Delaware 12.6 13.9 1.3 10.6 District of Columbia 6.5 17.6 11.1 168.8 Florida 7.0 12.1 5.2 74.1 Georgia 15.7 16.9 1.2 7.4 Hawaii 15.2 17.6 2.4 15.5 Idaho 12.0 23.1 11.0 91.6 Illinois 9.3 14.5 5.2 56.2 Indiana 8.3 16.0 7.7 92.9 Iowa 0.1 0.1 # -2.8 Kansas 12.5 12.3 -0.2 -1.5 Kentucky 17.8 17.3 -0.4 -2.5 Louisiana 12.6 14.9 2.3 17.9 Maine 19.2 22.0 2.8 14.4 Maryland 16.9 19.6 2.7 15.9 Massachusetts 8.4 15.1 6.7 80.3 Michigan 9.4 14.9 5.5 58.8 Minnesota 14.6 16.2 1.6 10.8 Mississippi 10.9 20.0 9.0 82.6 Missouri 15.6 22.5 6.9 44.1 Montana 11.2 12.9 1.7 15.3 Nebraska 13.3 14.9 1.6 12.1 Nevada 7.8 11.0 3.2 40.8 New Hampshire 18.2 20.1 2.0 10.8 New Jersey 15.0 22.0 7.1 47.3 New Mexico 8.1 10.0 2.0 24.3 New York 14.0 17.3 3.3 23.3 North Carolina 17.8 19.3 1.5 8.2 North Dakota 13.5 16.2 2.7 19.7 See notes at end of exhibit.
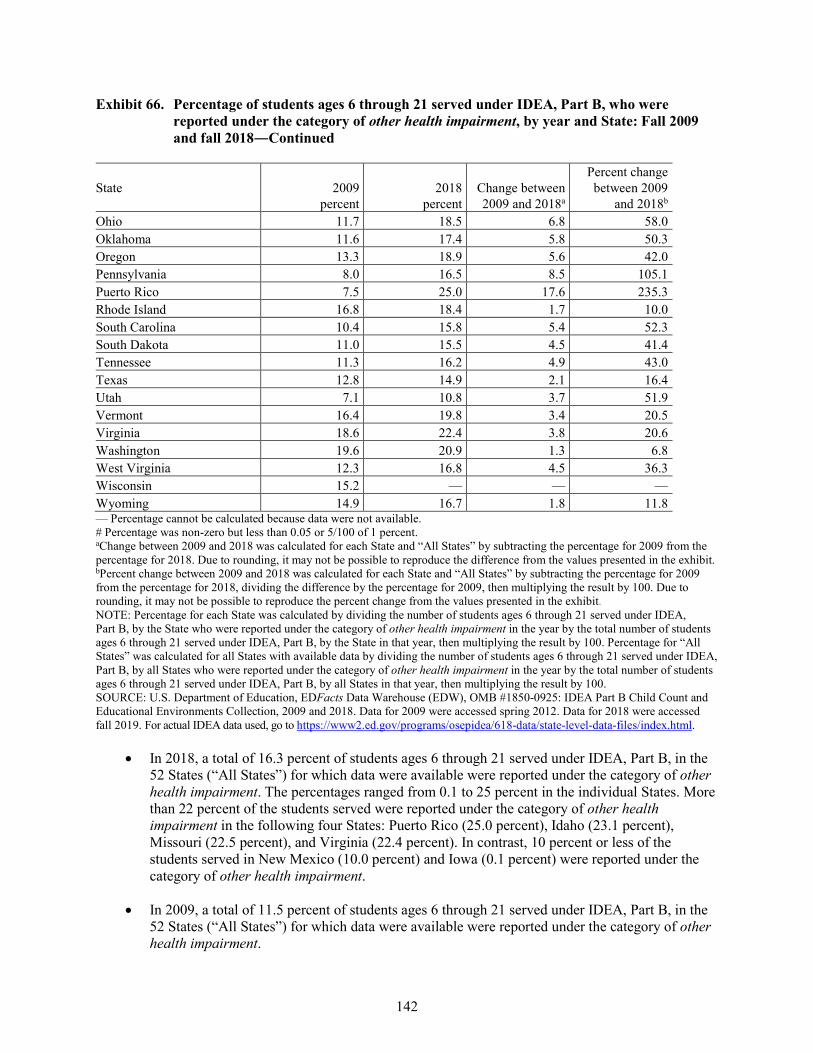
142
Exhibit 66. Percentage of students ages 6 through 21 served under IDEA, Part B, who were reported under the category of other health impairment, by year and State: Fall 2009 and fall 2018―Continued
State 2009 percent
2018 percent
Change between 2009 and 2018a
Percent change between 2009
and 2018b Ohio 11.7 18.5 6.8 58.0 Oklahoma 11.6 17.4 5.8 50.3 Oregon 13.3 18.9 5.6 42.0 Pennsylvania 8.0 16.5 8.5 105.1 Puerto Rico 7.5 25.0 17.6 235.3 Rhode Island 16.8 18.4 1.7 10.0 South Carolina 10.4 15.8 5.4 52.3 South Dakota 11.0 15.5 4.5 41.4 Tennessee 11.3 16.2 4.9 43.0 Texas 12.8 14.9 2.1 16.4 Utah 7.1 10.8 3.7 51.9 Vermont 16.4 19.8 3.4 20.5 Virginia 18.6 22.4 3.8 20.6 Washington 19.6 20.9 1.3 6.8 West Virginia 12.3 16.8 4.5 36.3 Wisconsin 15.2 — — — Wyoming 14.9 16.7 1.8 11.8 — Percentage cannot be calculated because data were not available. # Percentage was non-zero but less than 0.05 or 5/100 of 1 percent. aChange between 2009 and 2018 was calculated for each State and “All States” by subtracting the percentage for 2009 from the percentage for 2018. Due to rounding, it may not be possible to reproduce the difference from the values presented in the exhibit. bPercent change between 2009 and 2018 was calculated for each State and “All States” by subtracting the percentage for 2009 from the percentage for 2018, dividing the difference by the percentage for 2009, then multiplying the result by 100. Due to rounding, it may not be possible to reproduce the percent change from the values presented in the exhibit. NOTE: Percentage for each State was calculated by dividing the number of students ages 6 through 21 served under IDEA, Part B, by the State who were reported under the category of other health impairment in the year by the total number of students ages 6 through 21 served under IDEA, Part B, by the State in that year, then multiplying the result by 100. Percentage for “All States” was calculated for all States with available data by dividing the number of students ages 6 through 21 served under IDEA, Part B, by all States who were reported under the category of other health impairment in the year by the total number of students ages 6 through 21 served under IDEA, Part B, by all States in that year, then multiplying the result by 100. SOURCE: U.S. Department of Education, EDFacts Data Warehouse (EDW), OMB #1850-0925: IDEA Part B Child Count and Educational Environments Collection, 2009 and 2018. Data for 2009 were accessed spring 2012. Data for 2018 were accessed fall 2019. For actual IDEA data used, go to https://www2.ed.gov/programs/osepidea/618-data/state-level-data-files/index.html.
• In 2018, a total of 16.3 percent of students ages 6 through 21 served under IDEA, Part B, in the 52 States (“All States”) for which data were available were reported under the category of other health impairment. The percentages ranged from 0.1 to 25 percent in the individual States. More than 22 percent of the students served were reported under the category of other health impairment in the following four States: Puerto Rico (25.0 percent), Idaho (23.1 percent), Missouri (22.5 percent), and Virginia (22.4 percent). In contrast, 10 percent or less of the students served in New Mexico (10.0 percent) and Iowa (0.1 percent) were reported under the category of other health impairment.
• In 2009, a total of 11.5 percent of students ages 6 through 21 served under IDEA, Part B, in the 52 States (“All States”) for which data were available were reported under the category of other health impairment.
143
• In 48 of the 50 States for which data were available for both years, the percentage of students reported under the category of other health impairment was larger in 2018 than in 2009. The percentage of students reported under the category of other health impairment was smaller in 2018 than in 2009 in Iowa, Kansas, and Kentucky; however, the difference was less than 1 percentage point for each of these three States.
• The percent change for 17 of the 48 States in which a larger percentage of students ages 6 through 21 served under IDEA, Part B, were reported under the category of other health impairment in 2018 than in 2009 exceeded 50 percent. A percent change of more than 100 percent was found in the following three States: Puerto Rico (235.3 percent), the District of Columbia (168.8 percent), and Pennsylvania (105.1 percent). This percent change represented an increase greater than 8 percentage points in all three States: Puerto Rico (17.6 percentage points), the District of Columbia (11.1 percentage points), and Pennsylvania (8.5 percentage points).
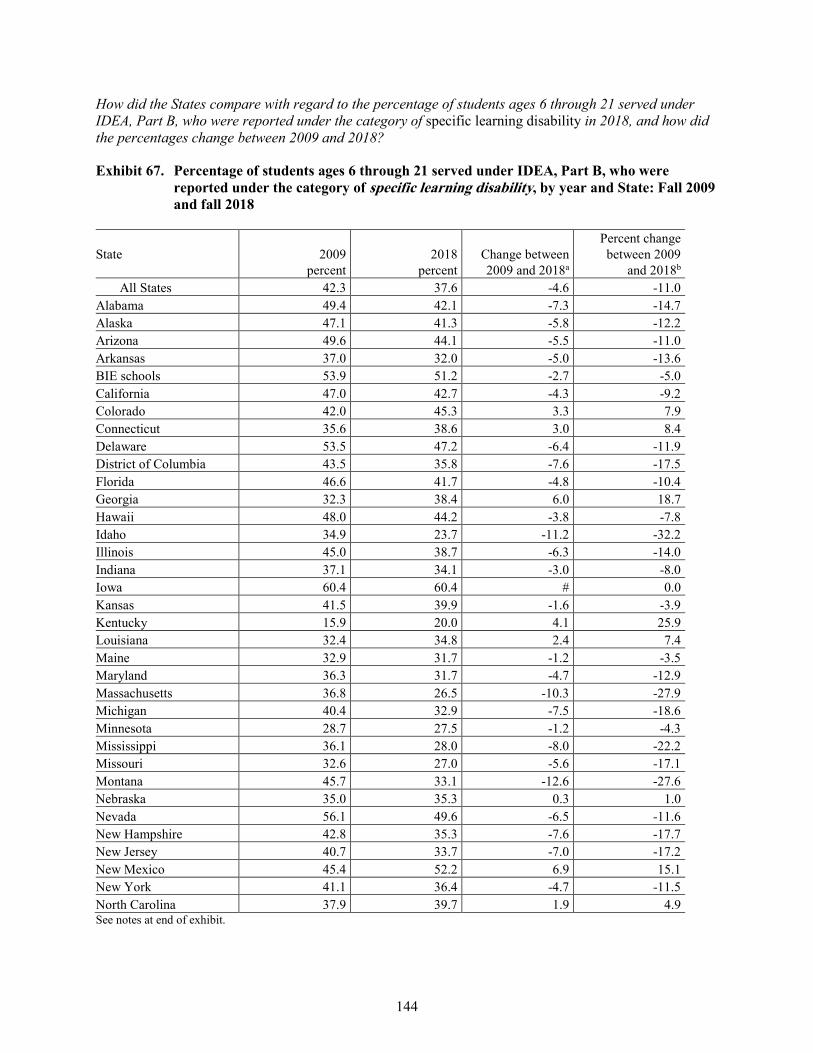
144
How did the States compare with regard to the percentage of students ages 6 through 21 served under IDEA, Part B, who were reported under the category of specific learning disability in 2018, and how did the percentages change between 2009 and 2018?
Exhibit 67. Percentage of students ages 6 through 21 served under IDEA, Part B, who were reported under the category of specific learning disability, by year and State: Fall 2009 and fall 2018
State 2009 percent
2018 percent
Change between 2009 and 2018a
Percent change between 2009
and 2018b All States 42.3 37.6 -4.6 -11.0
Alabama 49.4 42.1 -7.3 -14.7 Alaska 47.1 41.3 -5.8 -12.2 Arizona 49.6 44.1 -5.5 -11.0 Arkansas 37.0 32.0 -5.0 -13.6 BIE schools 53.9 51.2 -2.7 -5.0 California 47.0 42.7 -4.3 -9.2 Colorado 42.0 45.3 3.3 7.9 Connecticut 35.6 38.6 3.0 8.4 Delaware 53.5 47.2 -6.4 -11.9 District of Columbia 43.5 35.8 -7.6 -17.5 Florida 46.6 41.7 -4.8 -10.4 Georgia 32.3 38.4 6.0 18.7 Hawaii 48.0 44.2 -3.8 -7.8 Idaho 34.9 23.7 -11.2 -32.2 Illinois 45.0 38.7 -6.3 -14.0 Indiana 37.1 34.1 -3.0 -8.0 Iowa 60.4 60.4 # 0.0 Kansas 41.5 39.9 -1.6 -3.9 Kentucky 15.9 20.0 4.1 25.9 Louisiana 32.4 34.8 2.4 7.4 Maine 32.9 31.7 -1.2 -3.5 Maryland 36.3 31.7 -4.7 -12.9 Massachusetts 36.8 26.5 -10.3 -27.9 Michigan 40.4 32.9 -7.5 -18.6 Minnesota 28.7 27.5 -1.2 -4.3 Mississippi 36.1 28.0 -8.0 -22.2 Missouri 32.6 27.0 -5.6 -17.1 Montana 45.7 33.1 -12.6 -27.6 Nebraska 35.0 35.3 0.3 1.0 Nevada 56.1 49.6 -6.5 -11.6 New Hampshire 42.8 35.3 -7.6 -17.7 New Jersey 40.7 33.7 -7.0 -17.2 New Mexico 45.4 52.2 6.9 15.1 New York 41.1 36.4 -4.7 -11.5 North Carolina 37.9 39.7 1.9 4.9 See notes at end of exhibit.
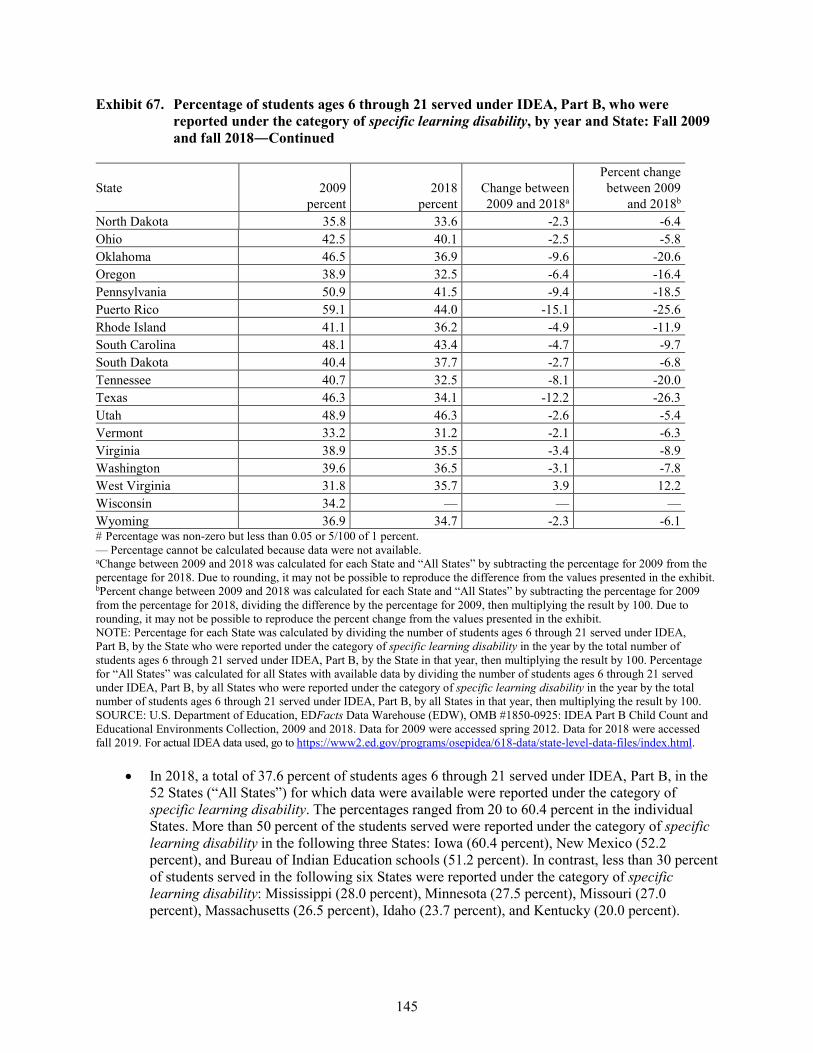
145
Exhibit 67. Percentage of students ages 6 through 21 served under IDEA, Part B, who were reported under the category of specific learning disability, by year and State: Fall 2009 and fall 2018―Continued
State 2009 percent
2018 percent
Change between 2009 and 2018a
Percent change between 2009
and 2018b North Dakota 35.8 33.6 -2.3 -6.4 Ohio 42.5 40.1 -2.5 -5.8 Oklahoma 46.5 36.9 -9.6 -20.6 Oregon 38.9 32.5 -6.4 -16.4 Pennsylvania 50.9 41.5 -9.4 -18.5 Puerto Rico 59.1 44.0 -15.1 -25.6 Rhode Island 41.1 36.2 -4.9 -11.9 South Carolina 48.1 43.4 -4.7 -9.7 South Dakota 40.4 37.7 -2.7 -6.8 Tennessee 40.7 32.5 -8.1 -20.0 Texas 46.3 34.1 -12.2 -26.3 Utah 48.9 46.3 -2.6 -5.4 Vermont 33.2 31.2 -2.1 -6.3 Virginia 38.9 35.5 -3.4 -8.9 Washington 39.6 36.5 -3.1 -7.8 West Virginia 31.8 35.7 3.9 12.2 Wisconsin 34.2 — — — Wyoming 36.9 34.7 -2.3 -6.1 # Percentage was non-zero but less than 0.05 or 5/100 of 1 percent. — Percentage cannot be calculated because data were not available. aChange between 2009 and 2018 was calculated for each State and “All States” by subtracting the percentage for 2009 from the percentage for 2018. Due to rounding, it may not be possible to reproduce the difference from the values presented in the exhibit. bPercent change between 2009 and 2018 was calculated for each State and “All States” by subtracting the percentage for 2009 from the percentage for 2018, dividing the difference by the percentage for 2009, then multiplying the result by 100. Due to rounding, it may not be possible to reproduce the percent change from the values presented in the exhibit. NOTE: Percentage for each State was calculated by dividing the number of students ages 6 through 21 served under IDEA, Part B, by the State who were reported under the category of specific learning disability in the year by the total number of students ages 6 through 21 served under IDEA, Part B, by the State in that year, then multiplying the result by 100. Percentage for “All States” was calculated for all States with available data by dividing the number of students ages 6 through 21 served under IDEA, Part B, by all States who were reported under the category of specific learning disability in the year by the total number of students ages 6 through 21 served under IDEA, Part B, by all States in that year, then multiplying the result by 100. SOURCE: U.S. Department of Education, EDFacts Data Warehouse (EDW), OMB #1850-0925: IDEA Part B Child Count and Educational Environments Collection, 2009 and 2018. Data for 2009 were accessed spring 2012. Data for 2018 were accessed fall 2019. For actual IDEA data used, go to https://www2.ed.gov/programs/osepidea/618-data/state-level-data-files/index.html.
• In 2018, a total of 37.6 percent of students ages 6 through 21 served under IDEA, Part B, in the 52 States (“All States”) for which data were available were reported under the category of specific learning disability. The percentages ranged from 20 to 60.4 percent in the individual States. More than 50 percent of the students served were reported under the category of specific learning disability in the following three States: Iowa (60.4 percent), New Mexico (52.2 percent), and Bureau of Indian Education schools (51.2 percent). In contrast, less than 30 percent of students served in the following six States were reported under the category of specific learning disability: Mississippi (28.0 percent), Minnesota (27.5 percent), Missouri (27.0 percent), Massachusetts (26.5 percent), Idaho (23.7 percent), and Kentucky (20.0 percent).
146
• In 2009, a total of 42.3 percent of students ages 6 through 21 served under IDEA, Part B, in the 53 States (“All States”) for which data were available were reported under the category of specific learning disability.
• The percentage of students reported under the category of specific learning disability decreased by more than 10 percent between 2009 and 2018 for 26 of the 52 States for which data were available for both time periods. A decrease of more than 25 percent occurred in the following five States: Idaho (-32.2 percent), Massachusetts (-27.9 percent), Montana (-27.6 percent), Texas (-26.3 percent), and Puerto Rico (-25.6 percent). This percent change represented a decrease of more than 10 percentage points for all five States: Puerto Rico (-15.1 percentage points), Montana (-12.6 percentage points), Texas (-12.2 percentage points), Idaho (-11.2 percentage points), and Massachusetts (-10.3 percentage points).
• The percentage of students reported under the category of specific learning disability increased by at least 10 percent between 2009 and 2018 for four of the 52 States for which data were available for both time periods. The four States were Kentucky (25.9 percent), Georgia (18.7 percent), New Mexico (15.1 percent), and West Virginia (12.2 percent). This percent change represented a difference of more than 4 percentage points for three of the four States: New Mexico (6.9 percentage points), Georgia (6.0 percentage points), and Kentucky (4.1 percentage points).
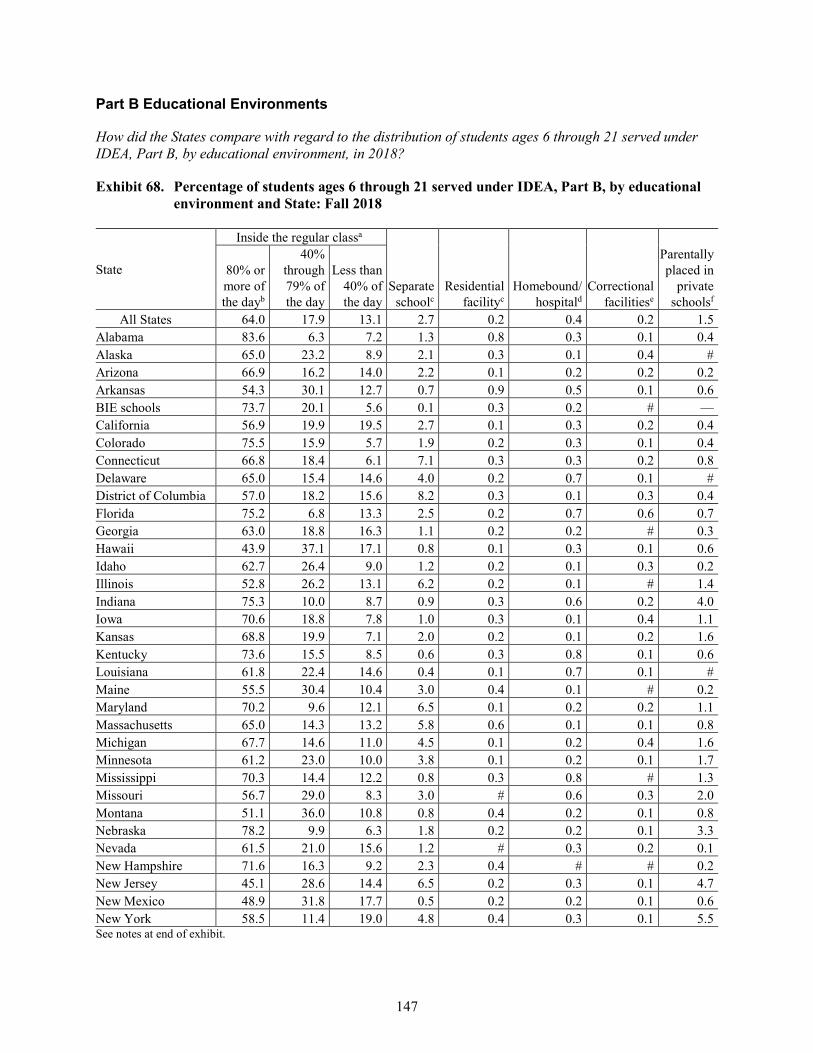
147
Part B Educational Environments
How did the States compare with regard to the distribution of students ages 6 through 21 served under IDEA, Part B, by educational environment, in 2018?
Exhibit 68. Percentage of students ages 6 through 21 served under IDEA, Part B, by educational environment and State: Fall 2018
State
Inside the regular classa
Separate schoolc
Residential facilityc
Homebound/ hospitald
Correctional facilitiese
Parentally placed in
private schoolsf
80% or more of the dayb
40% through 79% of the day
Less than 40% of the day
All States 64.0 17.9 13.1 2.7 0.2 0.4 0.2 1.5 Alabama 83.6 6.3 7.2 1.3 0.8 0.3 0.1 0.4 Alaska 65.0 23.2 8.9 2.1 0.3 0.1 0.4 # Arizona 66.9 16.2 14.0 2.2 0.1 0.2 0.2 0.2 Arkansas 54.3 30.1 12.7 0.7 0.9 0.5 0.1 0.6 BIE schools 73.7 20.1 5.6 0.1 0.3 0.2 # — California 56.9 19.9 19.5 2.7 0.1 0.3 0.2 0.4 Colorado 75.5 15.9 5.7 1.9 0.2 0.3 0.1 0.4 Connecticut 66.8 18.4 6.1 7.1 0.3 0.3 0.2 0.8 Delaware 65.0 15.4 14.6 4.0 0.2 0.7 0.1 # District of Columbia 57.0 18.2 15.6 8.2 0.3 0.1 0.3 0.4 Florida 75.2 6.8 13.3 2.5 0.2 0.7 0.6 0.7 Georgia 63.0 18.8 16.3 1.1 0.2 0.2 # 0.3 Hawaii 43.9 37.1 17.1 0.8 0.1 0.3 0.1 0.6 Idaho 62.7 26.4 9.0 1.2 0.2 0.1 0.3 0.2 Illinois 52.8 26.2 13.1 6.2 0.2 0.1 # 1.4 Indiana 75.3 10.0 8.7 0.9 0.3 0.6 0.2 4.0 Iowa 70.6 18.8 7.8 1.0 0.3 0.1 0.4 1.1 Kansas 68.8 19.9 7.1 2.0 0.2 0.1 0.2 1.6 Kentucky 73.6 15.5 8.5 0.6 0.3 0.8 0.1 0.6 Louisiana 61.8 22.4 14.6 0.4 0.1 0.7 0.1 # Maine 55.5 30.4 10.4 3.0 0.4 0.1 # 0.2 Maryland 70.2 9.6 12.1 6.5 0.1 0.2 0.2 1.1 Massachusetts 65.0 14.3 13.2 5.8 0.6 0.1 0.1 0.8 Michigan 67.7 14.6 11.0 4.5 0.1 0.2 0.4 1.6 Minnesota 61.2 23.0 10.0 3.8 0.1 0.2 0.1 1.7 Mississippi 70.3 14.4 12.2 0.8 0.3 0.8 # 1.3 Missouri 56.7 29.0 8.3 3.0 # 0.6 0.3 2.0 Montana 51.1 36.0 10.8 0.8 0.4 0.2 0.1 0.8 Nebraska 78.2 9.9 6.3 1.8 0.2 0.2 0.1 3.3 Nevada 61.5 21.0 15.6 1.2 # 0.3 0.2 0.1 New Hampshire 71.6 16.3 9.2 2.3 0.4 # # 0.2 New Jersey 45.1 28.6 14.4 6.5 0.2 0.3 0.1 4.7 New Mexico 48.9 31.8 17.7 0.5 0.2 0.2 0.1 0.6 New York 58.5 11.4 19.0 4.8 0.4 0.3 0.1 5.5 See notes at end of exhibit.
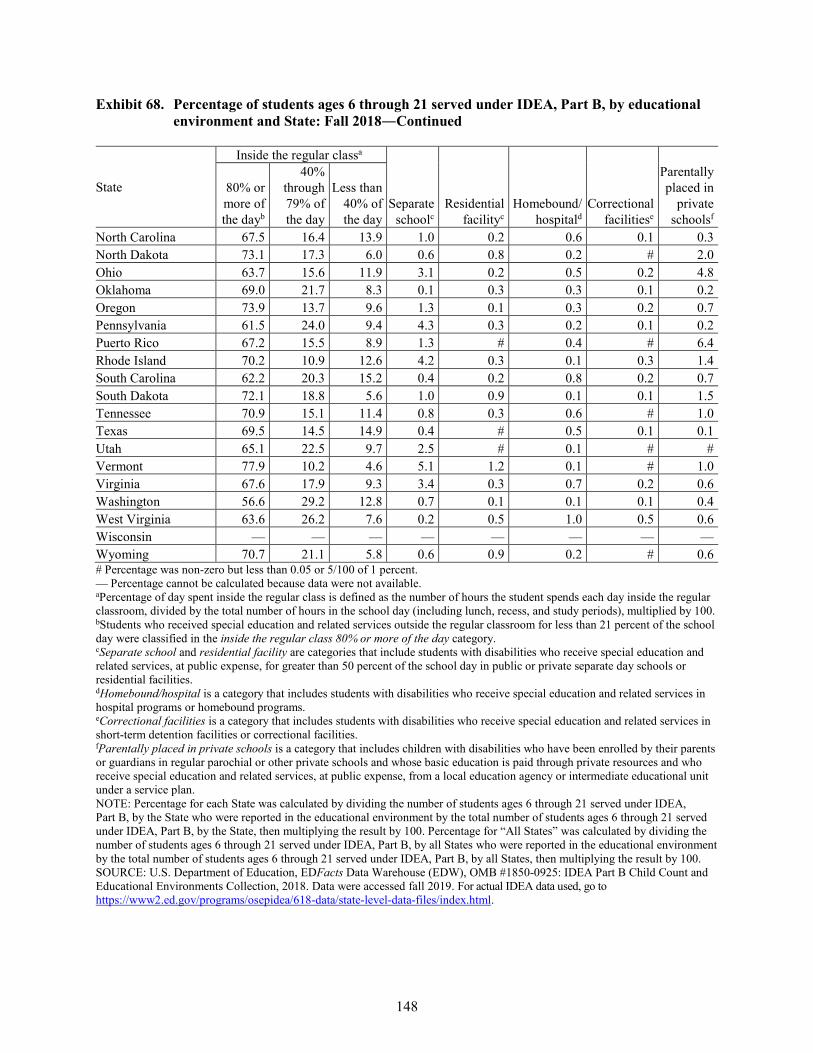
148
Exhibit 68. Percentage of students ages 6 through 21 served under IDEA, Part B, by educational environment and State: Fall 2018―Continued
State
Inside the regular classa
Separate schoolc
Residential facilityc
Homebound/ hospitald
Correctional facilitiese
Parentally placed in
private schoolsf
80% or more of the dayb
40% through 79% of the day
Less than 40% of the day
North Carolina 67.5 16.4 13.9 1.0 0.2 0.6 0.1 0.3 North Dakota 73.1 17.3 6.0 0.6 0.8 0.2 # 2.0 Ohio 63.7 15.6 11.9 3.1 0.2 0.5 0.2 4.8 Oklahoma 69.0 21.7 8.3 0.1 0.3 0.3 0.1 0.2 Oregon 73.9 13.7 9.6 1.3 0.1 0.3 0.2 0.7 Pennsylvania 61.5 24.0 9.4 4.3 0.3 0.2 0.1 0.2 Puerto Rico 67.2 15.5 8.9 1.3 # 0.4 # 6.4 Rhode Island 70.2 10.9 12.6 4.2 0.3 0.1 0.3 1.4 South Carolina 62.2 20.3 15.2 0.4 0.2 0.8 0.2 0.7 South Dakota 72.1 18.8 5.6 1.0 0.9 0.1 0.1 1.5 Tennessee 70.9 15.1 11.4 0.8 0.3 0.6 # 1.0 Texas 69.5 14.5 14.9 0.4 # 0.5 0.1 0.1 Utah 65.1 22.5 9.7 2.5 # 0.1 # # Vermont 77.9 10.2 4.6 5.1 1.2 0.1 # 1.0 Virginia 67.6 17.9 9.3 3.4 0.3 0.7 0.2 0.6 Washington 56.6 29.2 12.8 0.7 0.1 0.1 0.1 0.4 West Virginia 63.6 26.2 7.6 0.2 0.5 1.0 0.5 0.6 Wisconsin — — — — — — — — Wyoming 70.7 21.1 5.8 0.6 0.9 0.2 # 0.6 # Percentage was non-zero but less than 0.05 or 5/100 of 1 percent. — Percentage cannot be calculated because data were not available. aPercentage of day spent inside the regular class is defined as the number of hours the student spends each day inside the regular classroom, divided by the total number of hours in the school day (including lunch, recess, and study periods), multiplied by 100. bStudents who received special education and related services outside the regular classroom for less than 21 percent of the school day were classified in the inside the regular class 80% or more of the day category. cSeparate school and residential facility are categories that include students with disabilities who receive special education and related services, at public expense, for greater than 50 percent of the school day in public or private separate day schools or residential facilities. dHomebound/hospital is a category that includes students with disabilities who receive special education and related services in hospital programs or homebound programs. eCorrectional facilities is a category that includes students with disabilities who receive special education and related services in short-term detention facilities or correctional facilities. fParentally placed in private schools is a category that includes children with disabilities who have been enrolled by their parents or guardians in regular parochial or other private schools and whose basic education is paid through private resources and who receive special education and related services, at public expense, from a local education agency or intermediate educational unit under a service plan. NOTE: Percentage for each State was calculated by dividing the number of students ages 6 through 21 served under IDEA, Part B, by the State who were reported in the educational environment by the total number of students ages 6 through 21 served under IDEA, Part B, by the State, then multiplying the result by 100. Percentage for “All States” was calculated by dividing the number of students ages 6 through 21 served under IDEA, Part B, by all States who were reported in the educational environment by the total number of students ages 6 through 21 served under IDEA, Part B, by all States, then multiplying the result by 100. SOURCE: U.S. Department of Education, EDFacts Data Warehouse (EDW), OMB #1850-0925: IDEA Part B Child Count and Educational Environments Collection, 2018. Data were accessed fall 2019. For actual IDEA data used, go to https://www2.ed.gov/programs/osepidea/618-data/state-level-data-files/index.html.
149
• In 2018, a total of 64 percent of students ages 6 through 21 served under IDEA, Part B, in the 50 States (“All States”) for which data were available were educated inside the regular class 80% or more of the day.
• In each of the 52 individual States, a larger percentage of students was accounted for by the category of inside the regular class 80% or more of the day than any other educational environment category. Moreover, in 49 of these States, a majority of such students were educated inside the regular class 80% or more of the day. This category accounted for more than 75 percent of such students in the following six States: Alabama (83.6 percent), Nebraska (78.2 percent), Vermont (77.9 percent), Colorado (75.5 percent), Indiana (75.3 percent), and Florida (75.2 percent). In each of the three other States in which a larger percentage of students was accounted for by the category of inside the regular class 80% or more of the day than any other educational environment category, the percentage was larger than 40 percent: New Mexico (48.9 percent), New Jersey (45.1 percent), and Hawaii (43.9 percent).
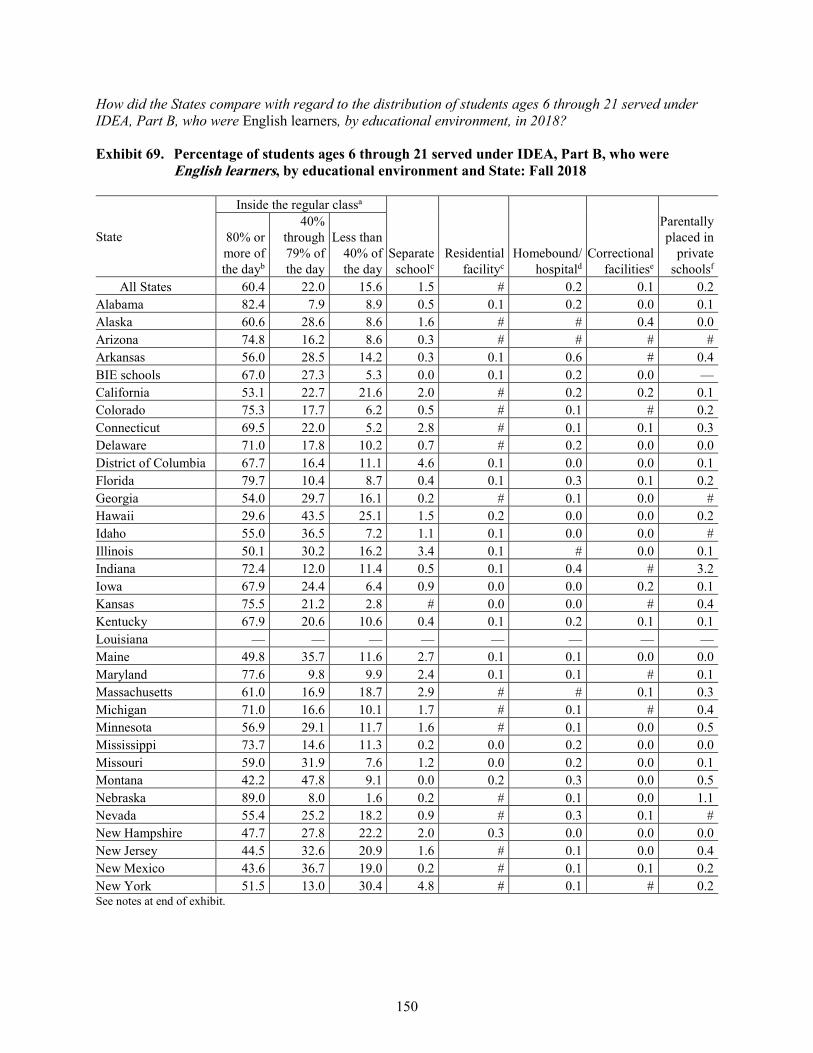
150
How did the States compare with regard to the distribution of students ages 6 through 21 served under IDEA, Part B, who were English learners, by educational environment, in 2018?
Exhibit 69. Percentage of students ages 6 through 21 served under IDEA, Part B, who were English learners, by educational environment and State: Fall 2018
State
Inside the regular classa
Separate schoolc
Residential facilityc
Homebound/ hospitald
Correctional facilitiese
Parentally placed in
private schoolsf
80% or more of the dayb
40% through 79% of the day
Less than 40% of the day
All States 60.4 22.0 15.6 1.5 # 0.2 0.1 0.2 Alabama 82.4 7.9 8.9 0.5 0.1 0.2 0.0 0.1 Alaska 60.6 28.6 8.6 1.6 # # 0.4 0.0 Arizona 74.8 16.2 8.6 0.3 # # # # Arkansas 56.0 28.5 14.2 0.3 0.1 0.6 # 0.4 BIE schools 67.0 27.3 5.3 0.0 0.1 0.2 0.0 — California 53.1 22.7 21.6 2.0 # 0.2 0.2 0.1 Colorado 75.3 17.7 6.2 0.5 # 0.1 # 0.2 Connecticut 69.5 22.0 5.2 2.8 # 0.1 0.1 0.3 Delaware 71.0 17.8 10.2 0.7 # 0.2 0.0 0.0 District of Columbia 67.7 16.4 11.1 4.6 0.1 0.0 0.0 0.1 Florida 79.7 10.4 8.7 0.4 0.1 0.3 0.1 0.2 Georgia 54.0 29.7 16.1 0.2 # 0.1 0.0 # Hawaii 29.6 43.5 25.1 1.5 0.2 0.0 0.0 0.2 Idaho 55.0 36.5 7.2 1.1 0.1 0.0 0.0 # Illinois 50.1 30.2 16.2 3.4 0.1 # 0.0 0.1 Indiana 72.4 12.0 11.4 0.5 0.1 0.4 # 3.2 Iowa 67.9 24.4 6.4 0.9 0.0 0.0 0.2 0.1 Kansas 75.5 21.2 2.8 # 0.0 0.0 # 0.4 Kentucky 67.9 20.6 10.6 0.4 0.1 0.2 0.1 0.1 Louisiana — — — — — — — — Maine 49.8 35.7 11.6 2.7 0.1 0.1 0.0 0.0 Maryland 77.6 9.8 9.9 2.4 0.1 0.1 # 0.1 Massachusetts 61.0 16.9 18.7 2.9 # # 0.1 0.3 Michigan 71.0 16.6 10.1 1.7 # 0.1 # 0.4 Minnesota 56.9 29.1 11.7 1.6 # 0.1 0.0 0.5 Mississippi 73.7 14.6 11.3 0.2 0.0 0.2 0.0 0.0 Missouri 59.0 31.9 7.6 1.2 0.0 0.2 0.0 0.1 Montana 42.2 47.8 9.1 0.0 0.2 0.3 0.0 0.5 Nebraska 89.0 8.0 1.6 0.2 # 0.1 0.0 1.1 Nevada 55.4 25.2 18.2 0.9 # 0.3 0.1 # New Hampshire 47.7 27.8 22.2 2.0 0.3 0.0 0.0 0.0 New Jersey 44.5 32.6 20.9 1.6 # 0.1 0.0 0.4 New Mexico 43.6 36.7 19.0 0.2 # 0.1 0.1 0.2 New York 51.5 13.0 30.4 4.8 # 0.1 # 0.2 See notes at end of exhibit.
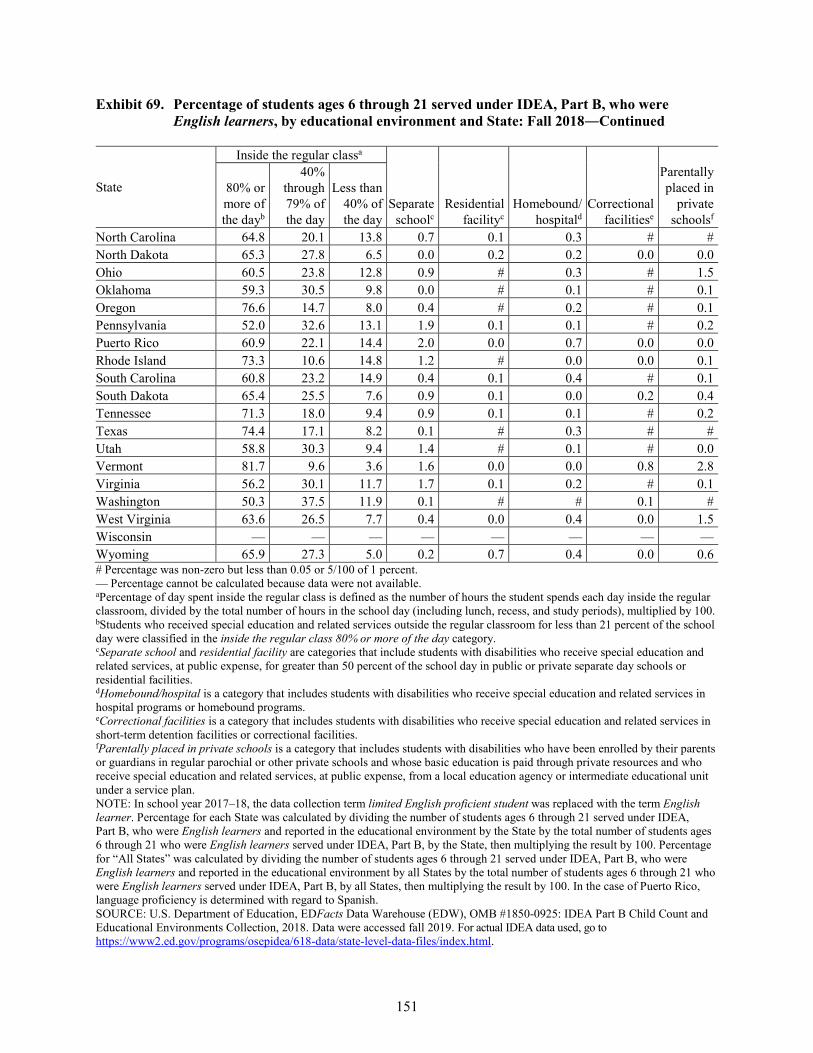
151
Exhibit 69. Percentage of students ages 6 through 21 served under IDEA, Part B, who were English learners, by educational environment and State: Fall 2018―Continued
State
Inside the regular classa
Separate schoolc
Residential facilityc
Homebound/ hospitald
Correctional facilitiese
Parentally placed in
private schoolsf
80% or more of the dayb
40% through 79% of the day
Less than 40% of the day
North Carolina 64.8 20.1 13.8 0.7 0.1 0.3 # # North Dakota 65.3 27.8 6.5 0.0 0.2 0.2 0.0 0.0 Ohio 60.5 23.8 12.8 0.9 # 0.3 # 1.5 Oklahoma 59.3 30.5 9.8 0.0 # 0.1 # 0.1 Oregon 76.6 14.7 8.0 0.4 # 0.2 # 0.1 Pennsylvania 52.0 32.6 13.1 1.9 0.1 0.1 # 0.2 Puerto Rico 60.9 22.1 14.4 2.0 0.0 0.7 0.0 0.0 Rhode Island 73.3 10.6 14.8 1.2 # 0.0 0.0 0.1 South Carolina 60.8 23.2 14.9 0.4 0.1 0.4 # 0.1 South Dakota 65.4 25.5 7.6 0.9 0.1 0.0 0.2 0.4 Tennessee 71.3 18.0 9.4 0.9 0.1 0.1 # 0.2 Texas 74.4 17.1 8.2 0.1 # 0.3 # # Utah 58.8 30.3 9.4 1.4 # 0.1 # 0.0 Vermont 81.7 9.6 3.6 1.6 0.0 0.0 0.8 2.8 Virginia 56.2 30.1 11.7 1.7 0.1 0.2 # 0.1 Washington 50.3 37.5 11.9 0.1 # # 0.1 # West Virginia 63.6 26.5 7.7 0.4 0.0 0.4 0.0 1.5 Wisconsin — — — — — — — — Wyoming 65.9 27.3 5.0 0.2 0.7 0.4 0.0 0.6 # Percentage was non-zero but less than 0.05 or 5/100 of 1 percent. — Percentage cannot be calculated because data were not available. aPercentage of day spent inside the regular class is defined as the number of hours the student spends each day inside the regular classroom, divided by the total number of hours in the school day (including lunch, recess, and study periods), multiplied by 100. bStudents who received special education and related services outside the regular classroom for less than 21 percent of the school day were classified in the inside the regular class 80% or more of the day category. cSeparate school and residential facility are categories that include students with disabilities who receive special education and related services, at public expense, for greater than 50 percent of the school day in public or private separate day schools or residential facilities. dHomebound/hospital is a category that includes students with disabilities who receive special education and related services in hospital programs or homebound programs. eCorrectional facilities is a category that includes students with disabilities who receive special education and related services in short-term detention facilities or correctional facilities. fParentally placed in private schools is a category that includes students with disabilities who have been enrolled by their parents or guardians in regular parochial or other private schools and whose basic education is paid through private resources and who receive special education and related services, at public expense, from a local education agency or intermediate educational unit under a service plan. NOTE: In school year 2017–18, the data collection term limited English proficient student was replaced with the term English learner. Percentage for each State was calculated by dividing the number of students ages 6 through 21 served under IDEA, Part B, who were English learners and reported in the educational environment by the State by the total number of students ages 6 through 21 who were English learners served under IDEA, Part B, by the State, then multiplying the result by 100. Percentage for “All States” was calculated by dividing the number of students ages 6 through 21 served under IDEA, Part B, who were English learners and reported in the educational environment by all States by the total number of students ages 6 through 21 who were English learners served under IDEA, Part B, by all States, then multiplying the result by 100. In the case of Puerto Rico, language proficiency is determined with regard to Spanish. SOURCE: U.S. Department of Education, EDFacts Data Warehouse (EDW), OMB #1850-0925: IDEA Part B Child Count and Educational Environments Collection, 2018. Data were accessed fall 2019. For actual IDEA data used, go to https://www2.ed.gov/programs/osepidea/618-data/state-level-data-files/index.html.
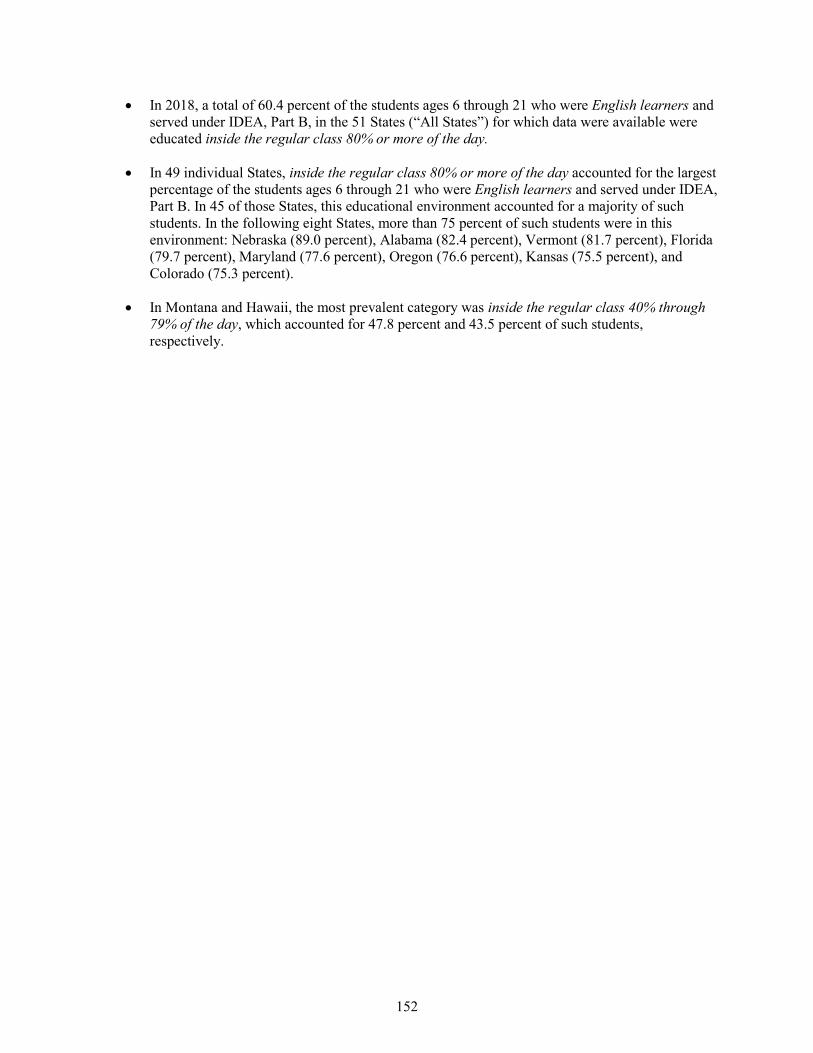
152
• In 2018, a total of 60.4 percent of the students ages 6 through 21 who were English learners and served under IDEA, Part B, in the 51 States (“All States”) for which data were available were educated inside the regular class 80% or more of the day.
• In 49 individual States, inside the regular class 80% or more of the day accounted for the largest percentage of the students ages 6 through 21 who were English learners and served under IDEA, Part B. In 45 of those States, this educational environment accounted for a majority of such students. In the following eight States, more than 75 percent of such students were in this environment: Nebraska (89.0 percent), Alabama (82.4 percent), Vermont (81.7 percent), Florida (79.7 percent), Maryland (77.6 percent), Oregon (76.6 percent), Kansas (75.5 percent), and Colorado (75.3 percent).
• In Montana and Hawaii, the most prevalent category was inside the regular class 40% through 79% of the day, which accounted for 47.8 percent and 43.5 percent of such students, respectively.
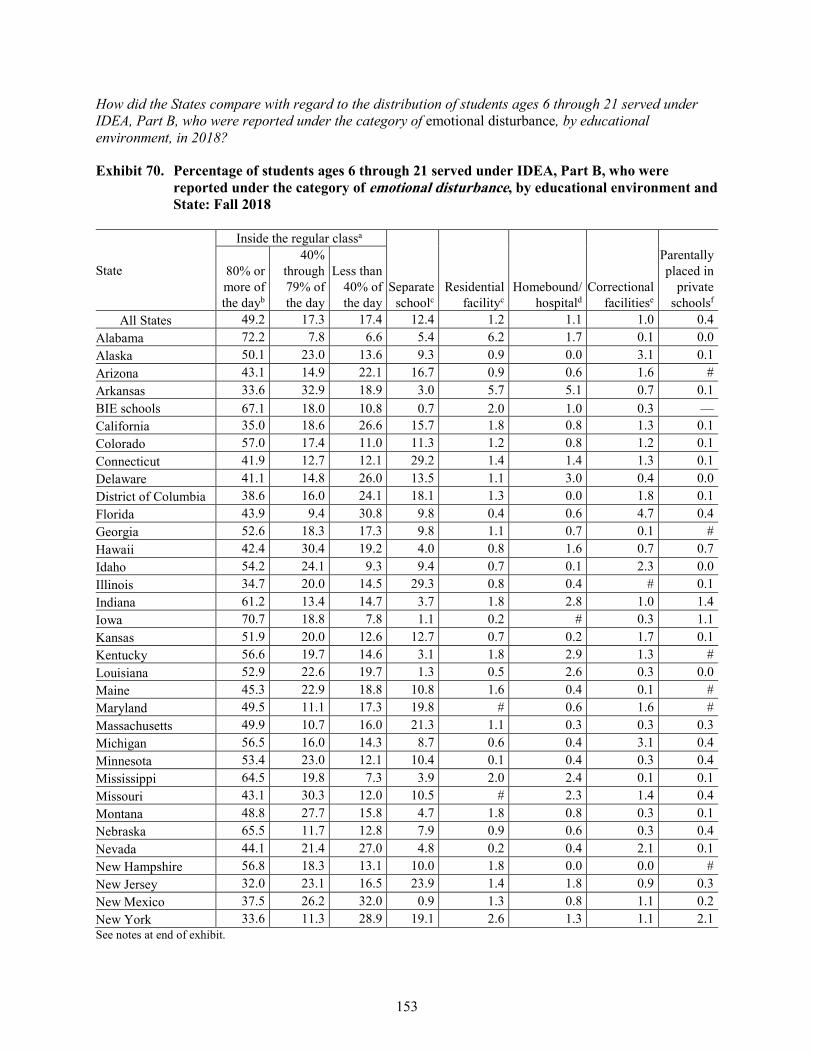
153
How did the States compare with regard to the distribution of students ages 6 through 21 served under IDEA, Part B, who were reported under the category of emotional disturbance, by educational environment, in 2018?
Exhibit 70. Percentage of students ages 6 through 21 served under IDEA, Part B, who were reported under the category of emotional disturbance, by educational environment and State: Fall 2018
State
Inside the regular classa
Separate schoolc
Residential facilityc
Homebound/ hospitald
Correctional facilitiese
Parentally placed in
private schoolsf
80% or more of the dayb
40% through 79% of the day
Less than 40% of the day
All States 49.2 17.3 17.4 12.4 1.2 1.1 1.0 0.4 Alabama 72.2 7.8 6.6 5.4 6.2 1.7 0.1 0.0 Alaska 50.1 23.0 13.6 9.3 0.9 0.0 3.1 0.1 Arizona 43.1 14.9 22.1 16.7 0.9 0.6 1.6 # Arkansas 33.6 32.9 18.9 3.0 5.7 5.1 0.7 0.1 BIE schools 67.1 18.0 10.8 0.7 2.0 1.0 0.3 — California 35.0 18.6 26.6 15.7 1.8 0.8 1.3 0.1 Colorado 57.0 17.4 11.0 11.3 1.2 0.8 1.2 0.1 Connecticut 41.9 12.7 12.1 29.2 1.4 1.4 1.3 0.1 Delaware 41.1 14.8 26.0 13.5 1.1 3.0 0.4 0.0 District of Columbia 38.6 16.0 24.1 18.1 1.3 0.0 1.8 0.1 Florida 43.9 9.4 30.8 9.8 0.4 0.6 4.7 0.4 Georgia 52.6 18.3 17.3 9.8 1.1 0.7 0.1 # Hawaii 42.4 30.4 19.2 4.0 0.8 1.6 0.7 0.7 Idaho 54.2 24.1 9.3 9.4 0.7 0.1 2.3 0.0 Illinois 34.7 20.0 14.5 29.3 0.8 0.4 # 0.1 Indiana 61.2 13.4 14.7 3.7 1.8 2.8 1.0 1.4 Iowa 70.7 18.8 7.8 1.1 0.2 # 0.3 1.1 Kansas 51.9 20.0 12.6 12.7 0.7 0.2 1.7 0.1 Kentucky 56.6 19.7 14.6 3.1 1.8 2.9 1.3 # Louisiana 52.9 22.6 19.7 1.3 0.5 2.6 0.3 0.0 Maine 45.3 22.9 18.8 10.8 1.6 0.4 0.1 # Maryland 49.5 11.1 17.3 19.8 # 0.6 1.6 # Massachusetts 49.9 10.7 16.0 21.3 1.1 0.3 0.3 0.3 Michigan 56.5 16.0 14.3 8.7 0.6 0.4 3.1 0.4 Minnesota 53.4 23.0 12.1 10.4 0.1 0.4 0.3 0.4 Mississippi 64.5 19.8 7.3 3.9 2.0 2.4 0.1 0.1 Missouri 43.1 30.3 12.0 10.5 # 2.3 1.4 0.4 Montana 48.8 27.7 15.8 4.7 1.8 0.8 0.3 0.1 Nebraska 65.5 11.7 12.8 7.9 0.9 0.6 0.3 0.4 Nevada 44.1 21.4 27.0 4.8 0.2 0.4 2.1 0.1 New Hampshire 56.8 18.3 13.1 10.0 1.8 0.0 0.0 # New Jersey 32.0 23.1 16.5 23.9 1.4 1.8 0.9 0.3 New Mexico 37.5 26.2 32.0 0.9 1.3 0.8 1.1 0.2 New York 33.6 11.3 28.9 19.1 2.6 1.3 1.1 2.1 See notes at end of exhibit.
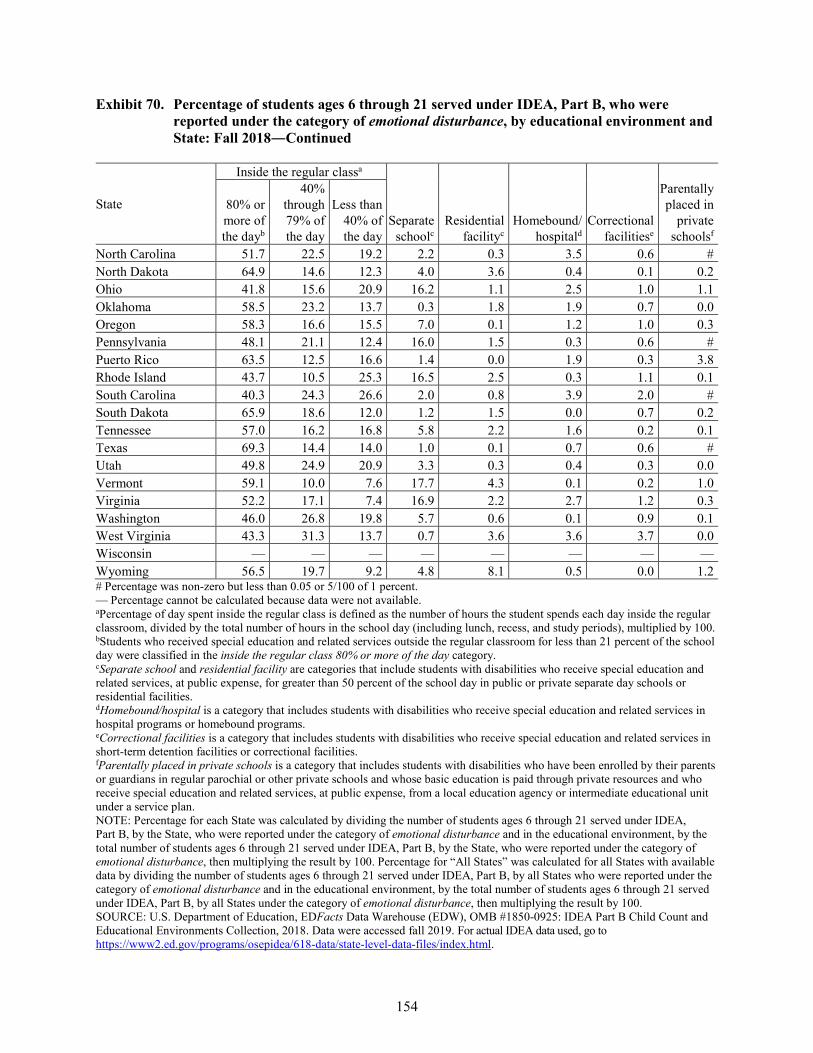
154
Exhibit 70. Percentage of students ages 6 through 21 served under IDEA, Part B, who were reported under the category of emotional disturbance, by educational environment and State: Fall 2018―Continued
State
Inside the regular classa
Separate schoolc
Residential facilityc
Homebound/ hospitald
Correctional facilitiese
Parentally placed in
private schoolsf
80% or more of the dayb
40% through 79% of the day
Less than 40% of the day
North Carolina 51.7 22.5 19.2 2.2 0.3 3.5 0.6 # North Dakota 64.9 14.6 12.3 4.0 3.6 0.4 0.1 0.2 Ohio 41.8 15.6 20.9 16.2 1.1 2.5 1.0 1.1 Oklahoma 58.5 23.2 13.7 0.3 1.8 1.9 0.7 0.0 Oregon 58.3 16.6 15.5 7.0 0.1 1.2 1.0 0.3 Pennsylvania 48.1 21.1 12.4 16.0 1.5 0.3 0.6 # Puerto Rico 63.5 12.5 16.6 1.4 0.0 1.9 0.3 3.8 Rhode Island 43.7 10.5 25.3 16.5 2.5 0.3 1.1 0.1 South Carolina 40.3 24.3 26.6 2.0 0.8 3.9 2.0 # South Dakota 65.9 18.6 12.0 1.2 1.5 0.0 0.7 0.2 Tennessee 57.0 16.2 16.8 5.8 2.2 1.6 0.2 0.1 Texas 69.3 14.4 14.0 1.0 0.1 0.7 0.6 # Utah 49.8 24.9 20.9 3.3 0.3 0.4 0.3 0.0 Vermont 59.1 10.0 7.6 17.7 4.3 0.1 0.2 1.0 Virginia 52.2 17.1 7.4 16.9 2.2 2.7 1.2 0.3 Washington 46.0 26.8 19.8 5.7 0.6 0.1 0.9 0.1 West Virginia 43.3 31.3 13.7 0.7 3.6 3.6 3.7 0.0 Wisconsin — — — — — — — — Wyoming 56.5 19.7 9.2 4.8 8.1 0.5 0.0 1.2 # Percentage was non-zero but less than 0.05 or 5/100 of 1 percent. — Percentage cannot be calculated because data were not available. aPercentage of day spent inside the regular class is defined as the number of hours the student spends each day inside the regular classroom, divided by the total number of hours in the school day (including lunch, recess, and study periods), multiplied by 100. bStudents who received special education and related services outside the regular classroom for less than 21 percent of the school day were classified in the inside the regular class 80% or more of the day category. cSeparate school and residential facility are categories that include students with disabilities who receive special education and related services, at public expense, for greater than 50 percent of the school day in public or private separate day schools or residential facilities. dHomebound/hospital is a category that includes students with disabilities who receive special education and related services in hospital programs or homebound programs. eCorrectional facilities is a category that includes students with disabilities who receive special education and related services in short-term detention facilities or correctional facilities. fParentally placed in private schools is a category that includes students with disabilities who have been enrolled by their parents or guardians in regular parochial or other private schools and whose basic education is paid through private resources and who receive special education and related services, at public expense, from a local education agency or intermediate educational unit under a service plan. NOTE: Percentage for each State was calculated by dividing the number of students ages 6 through 21 served under IDEA, Part B, by the State, who were reported under the category of emotional disturbance and in the educational environment, by the total number of students ages 6 through 21 served under IDEA, Part B, by the State, who were reported under the category of emotional disturbance, then multiplying the result by 100. Percentage for “All States” was calculated for all States with available data by dividing the number of students ages 6 through 21 served under IDEA, Part B, by all States who were reported under the category of emotional disturbance and in the educational environment, by the total number of students ages 6 through 21 served under IDEA, Part B, by all States under the category of emotional disturbance, then multiplying the result by 100. SOURCE: U.S. Department of Education, EDFacts Data Warehouse (EDW), OMB #1850-0925: IDEA Part B Child Count and Educational Environments Collection, 2018. Data were accessed fall 2019. For actual IDEA data used, go to https://www2.ed.gov/programs/osepidea/618-data/state-level-data-files/index.html.
155
• In 2018, a total of 49.2 percent of students ages 6 through 21 served under IDEA, Part B, who were reported under the category of emotional disturbance were served inside the regular class 80% or more of the day. The percentage of students served in this environment was larger than that for each of the other educational environments in the 52 States (“All States”) for which data were available. The percentage exceeded 50 percent in 27 States, including the following six States in which the percentage exceeded 65 percent: Alabama (72.2 percent), Iowa (70.7 percent), Texas (69.3 percent), Bureau of Indian Education schools (67.1 percent), South Dakota (65.9 percent), and Nebraska (65.5 percent).
• Inside the regular class less than 40% of the day accounted for the second largest percentage (17.4 percent) of students ages 6 through 21 served under IDEA, Part B, who were reported under the category of emotional disturbance.
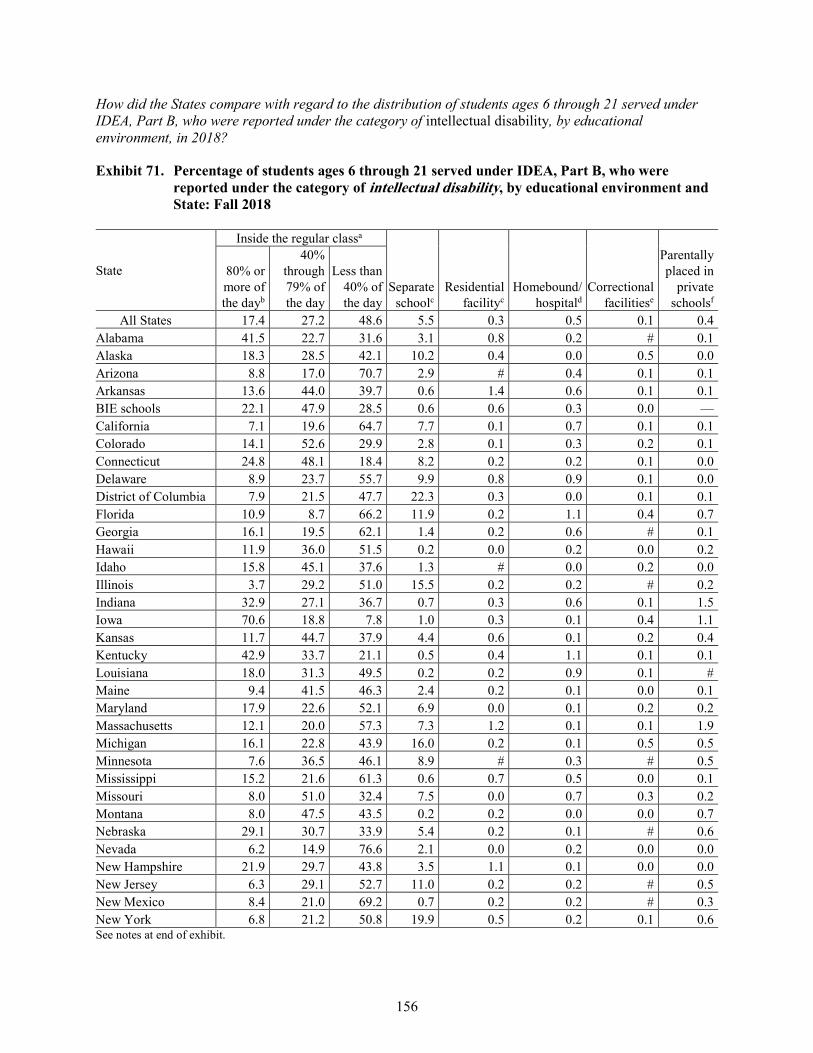
156
How did the States compare with regard to the distribution of students ages 6 through 21 served under IDEA, Part B, who were reported under the category of intellectual disability, by educational environment, in 2018?
Exhibit 71. Percentage of students ages 6 through 21 served under IDEA, Part B, who were reported under the category of intellectual disability, by educational environment and State: Fall 2018
State
Inside the regular classa
Separate schoolc
Residential facilityc
Homebound/ hospitald
Correctional facilitiese
Parentally placed in
private schoolsf
80% or more of the dayb
40% through 79% of the day
Less than 40% of the day
All States 17.4 27.2 48.6 5.5 0.3 0.5 0.1 0.4 Alabama 41.5 22.7 31.6 3.1 0.8 0.2 # 0.1 Alaska 18.3 28.5 42.1 10.2 0.4 0.0 0.5 0.0 Arizona 8.8 17.0 70.7 2.9 # 0.4 0.1 0.1 Arkansas 13.6 44.0 39.7 0.6 1.4 0.6 0.1 0.1 BIE schools 22.1 47.9 28.5 0.6 0.6 0.3 0.0 — California 7.1 19.6 64.7 7.7 0.1 0.7 0.1 0.1 Colorado 14.1 52.6 29.9 2.8 0.1 0.3 0.2 0.1 Connecticut 24.8 48.1 18.4 8.2 0.2 0.2 0.1 0.0 Delaware 8.9 23.7 55.7 9.9 0.8 0.9 0.1 0.0 District of Columbia 7.9 21.5 47.7 22.3 0.3 0.0 0.1 0.1 Florida 10.9 8.7 66.2 11.9 0.2 1.1 0.4 0.7 Georgia 16.1 19.5 62.1 1.4 0.2 0.6 # 0.1 Hawaii 11.9 36.0 51.5 0.2 0.0 0.2 0.0 0.2 Idaho 15.8 45.1 37.6 1.3 # 0.0 0.2 0.0 Illinois 3.7 29.2 51.0 15.5 0.2 0.2 # 0.2 Indiana 32.9 27.1 36.7 0.7 0.3 0.6 0.1 1.5 Iowa 70.6 18.8 7.8 1.0 0.3 0.1 0.4 1.1 Kansas 11.7 44.7 37.9 4.4 0.6 0.1 0.2 0.4 Kentucky 42.9 33.7 21.1 0.5 0.4 1.1 0.1 0.1 Louisiana 18.0 31.3 49.5 0.2 0.2 0.9 0.1 # Maine 9.4 41.5 46.3 2.4 0.2 0.1 0.0 0.1 Maryland 17.9 22.6 52.1 6.9 0.0 0.1 0.2 0.2 Massachusetts 12.1 20.0 57.3 7.3 1.2 0.1 0.1 1.9 Michigan 16.1 22.8 43.9 16.0 0.2 0.1 0.5 0.5 Minnesota 7.6 36.5 46.1 8.9 # 0.3 # 0.5 Mississippi 15.2 21.6 61.3 0.6 0.7 0.5 0.0 0.1 Missouri 8.0 51.0 32.4 7.5 0.0 0.7 0.3 0.2 Montana 8.0 47.5 43.5 0.2 0.2 0.0 0.0 0.7 Nebraska 29.1 30.7 33.9 5.4 0.2 0.1 # 0.6 Nevada 6.2 14.9 76.6 2.1 0.0 0.2 0.0 0.0 New Hampshire 21.9 29.7 43.8 3.5 1.1 0.1 0.0 0.0 New Jersey 6.3 29.1 52.7 11.0 0.2 0.2 # 0.5 New Mexico 8.4 21.0 69.2 0.7 0.2 0.2 # 0.3 New York 6.8 21.2 50.8 19.9 0.5 0.2 0.1 0.6 See notes at end of exhibit.
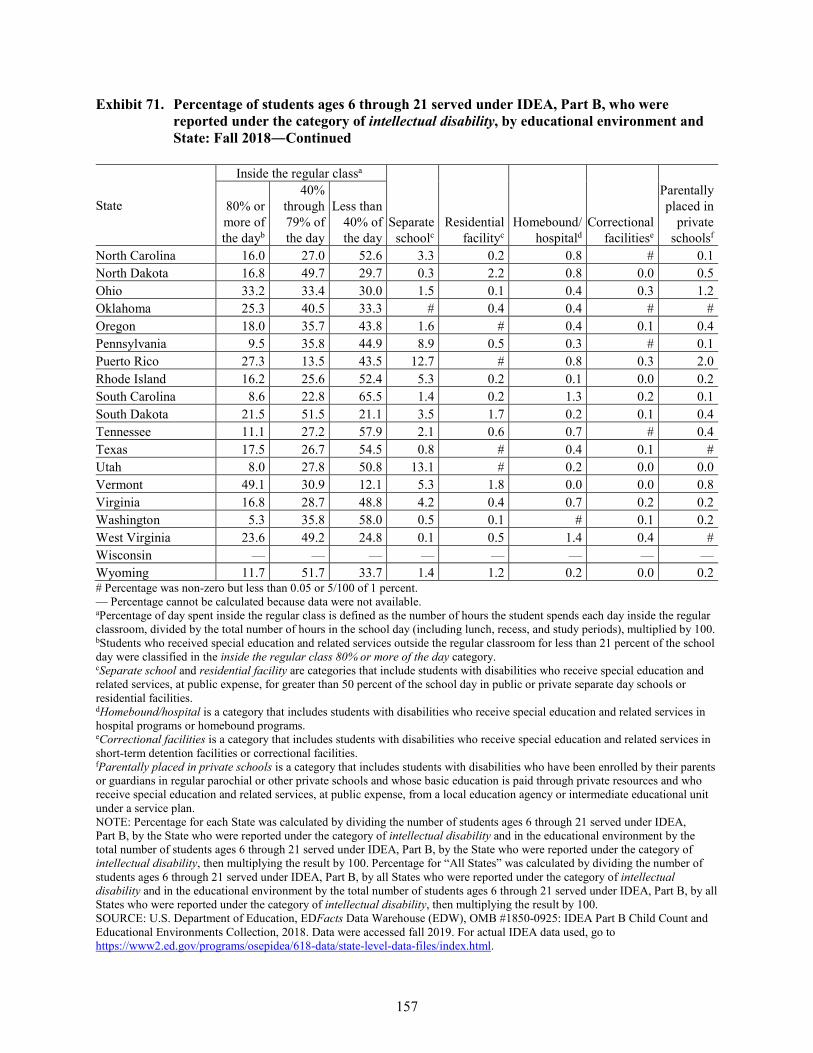
157
Exhibit 71. Percentage of students ages 6 through 21 served under IDEA, Part B, who were reported under the category of intellectual disability, by educational environment and State: Fall 2018―Continued
State
Inside the regular classa
Separate schoolc
Residential facilityc
Homebound/ hospitald
Correctional facilitiese
Parentally placed in
private schoolsf
80% or more of the dayb
40% through 79% of the day
Less than 40% of the day
North Carolina 16.0 27.0 52.6 3.3 0.2 0.8 # 0.1 North Dakota 16.8 49.7 29.7 0.3 2.2 0.8 0.0 0.5 Ohio 33.2 33.4 30.0 1.5 0.1 0.4 0.3 1.2 Oklahoma 25.3 40.5 33.3 # 0.4 0.4 # # Oregon 18.0 35.7 43.8 1.6 # 0.4 0.1 0.4 Pennsylvania 9.5 35.8 44.9 8.9 0.5 0.3 # 0.1 Puerto Rico 27.3 13.5 43.5 12.7 # 0.8 0.3 2.0 Rhode Island 16.2 25.6 52.4 5.3 0.2 0.1 0.0 0.2 South Carolina 8.6 22.8 65.5 1.4 0.2 1.3 0.2 0.1 South Dakota 21.5 51.5 21.1 3.5 1.7 0.2 0.1 0.4 Tennessee 11.1 27.2 57.9 2.1 0.6 0.7 # 0.4 Texas 17.5 26.7 54.5 0.8 # 0.4 0.1 # Utah 8.0 27.8 50.8 13.1 # 0.2 0.0 0.0 Vermont 49.1 30.9 12.1 5.3 1.8 0.0 0.0 0.8 Virginia 16.8 28.7 48.8 4.2 0.4 0.7 0.2 0.2 Washington 5.3 35.8 58.0 0.5 0.1 # 0.1 0.2 West Virginia 23.6 49.2 24.8 0.1 0.5 1.4 0.4 # Wisconsin — — — — — — — — Wyoming 11.7 51.7 33.7 1.4 1.2 0.2 0.0 0.2 # Percentage was non-zero but less than 0.05 or 5/100 of 1 percent. — Percentage cannot be calculated because data were not available. aPercentage of day spent inside the regular class is defined as the number of hours the student spends each day inside the regular classroom, divided by the total number of hours in the school day (including lunch, recess, and study periods), multiplied by 100. bStudents who received special education and related services outside the regular classroom for less than 21 percent of the school day were classified in the inside the regular class 80% or more of the day category. cSeparate school and residential facility are categories that include students with disabilities who receive special education and related services, at public expense, for greater than 50 percent of the school day in public or private separate day schools or residential facilities. dHomebound/hospital is a category that includes students with disabilities who receive special education and related services in hospital programs or homebound programs. eCorrectional facilities is a category that includes students with disabilities who receive special education and related services in short-term detention facilities or correctional facilities. fParentally placed in private schools is a category that includes students with disabilities who have been enrolled by their parents or guardians in regular parochial or other private schools and whose basic education is paid through private resources and who receive special education and related services, at public expense, from a local education agency or intermediate educational unit under a service plan. NOTE: Percentage for each State was calculated by dividing the number of students ages 6 through 21 served under IDEA, Part B, by the State who were reported under the category of intellectual disability and in the educational environment by the total number of students ages 6 through 21 served under IDEA, Part B, by the State who were reported under the category of intellectual disability, then multiplying the result by 100. Percentage for “All States” was calculated by dividing the number of students ages 6 through 21 served under IDEA, Part B, by all States who were reported under the category of intellectual disability and in the educational environment by the total number of students ages 6 through 21 served under IDEA, Part B, by all States who were reported under the category of intellectual disability, then multiplying the result by 100. SOURCE: U.S. Department of Education, EDFacts Data Warehouse (EDW), OMB #1850-0925: IDEA Part B Child Count and Educational Environments Collection, 2018. Data were accessed fall 2019. For actual IDEA data used, go to https://www2.ed.gov/programs/osepidea/618-data/state-level-data-files/index.html.
158
• In 2018, a total of 48.6 percent of students ages 6 through 21 served under IDEA, Part B, who were reported under the category of intellectual disability were served inside the regular class less than 40% of the day. The percentage of students served in this educational environment category was larger than that for each of the other educational environment categories in the 52 States (“All States”) for which data were available. The percentage exceeded 50 percent in 21 States, including the following five States in which the percentage exceeded 65 percent: Nevada (76.6 percent), Arizona (70.7 percent), New Mexico (69.2 percent), Florida (66.2 percent), and South Carolina (65.5 percent).
• In 14 States, inside the regular class 40% through 79% of the day accounted for the largest percentage of students ages 6 through 21 served under IDEA, Part B, who were reported under the category of intellectual disability. The percentage of students served in this educational environment category exceeded 50 percent in the following four States: Colorado (52.6 percent), Wyoming (51.7 percent), South Dakota (51.5 percent), and Missouri (51.0 percent).
• In four States, inside the regular class 80% or more of the day accounted for the largest percentage of students ages 6 through 21 served under IDEA, Part B, who were reported under the category of intellectual disability. The four States were Iowa (70.6 percent), Vermont (49.1 percent), Kentucky (42.9 percent), and Alabama (41.5 percent).
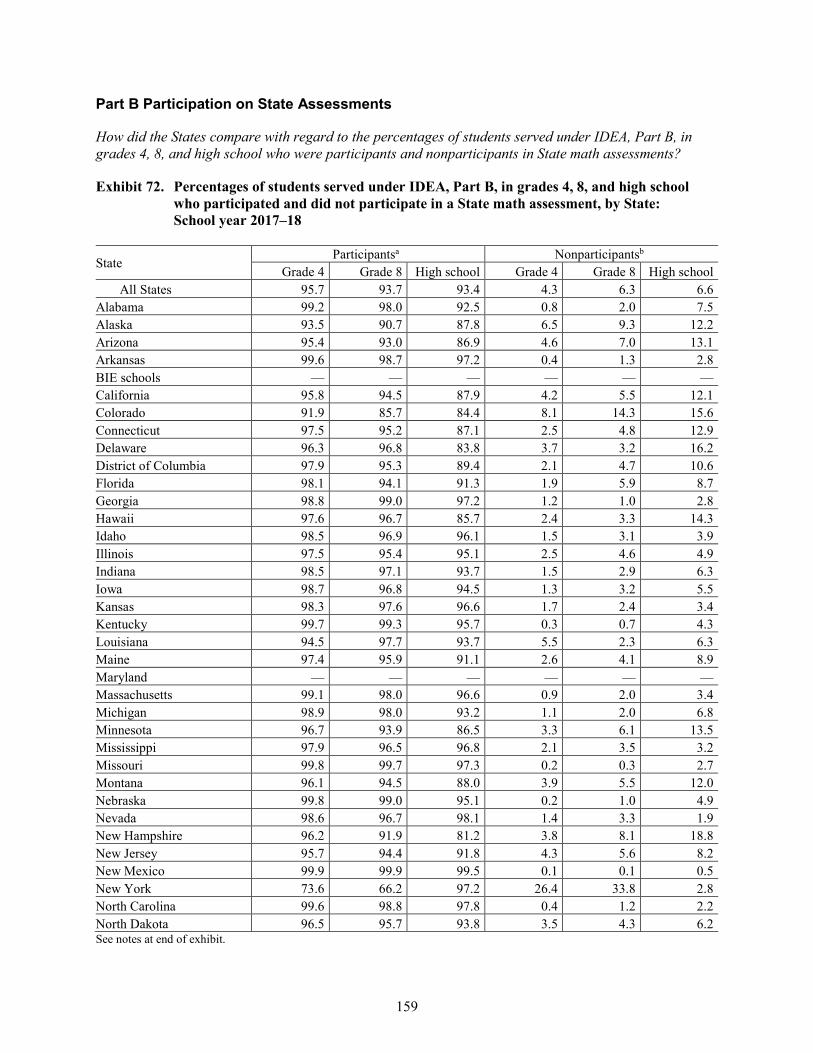
159
Part B Participation on State Assessments
How did the States compare with regard to the percentages of students served under IDEA, Part B, in grades 4, 8, and high school who were participants and nonparticipants in State math assessments?
Exhibit 72. Percentages of students served under IDEA, Part B, in grades 4, 8, and high school who participated and did not participate in a State math assessment, by State: School year 2017–18
State Participantsa Nonparticipantsb
Grade 4 Grade 8 High school Grade 4 Grade 8 High school All States 95.7 93.7 93.4 4.3 6.3 6.6
Alabama 99.2 98.0 92.5 0.8 2.0 7.5 Alaska 93.5 90.7 87.8 6.5 9.3 12.2 Arizona 95.4 93.0 86.9 4.6 7.0 13.1 Arkansas 99.6 98.7 97.2 0.4 1.3 2.8 BIE schools — — — — — — California 95.8 94.5 87.9 4.2 5.5 12.1 Colorado 91.9 85.7 84.4 8.1 14.3 15.6 Connecticut 97.5 95.2 87.1 2.5 4.8 12.9 Delaware 96.3 96.8 83.8 3.7 3.2 16.2 District of Columbia 97.9 95.3 89.4 2.1 4.7 10.6 Florida 98.1 94.1 91.3 1.9 5.9 8.7 Georgia 98.8 99.0 97.2 1.2 1.0 2.8 Hawaii 97.6 96.7 85.7 2.4 3.3 14.3 Idaho 98.5 96.9 96.1 1.5 3.1 3.9 Illinois 97.5 95.4 95.1 2.5 4.6 4.9 Indiana 98.5 97.1 93.7 1.5 2.9 6.3 Iowa 98.7 96.8 94.5 1.3 3.2 5.5 Kansas 98.3 97.6 96.6 1.7 2.4 3.4 Kentucky 99.7 99.3 95.7 0.3 0.7 4.3 Louisiana 94.5 97.7 93.7 5.5 2.3 6.3 Maine 97.4 95.9 91.1 2.6 4.1 8.9 Maryland — — — — — — Massachusetts 99.1 98.0 96.6 0.9 2.0 3.4 Michigan 98.9 98.0 93.2 1.1 2.0 6.8 Minnesota 96.7 93.9 86.5 3.3 6.1 13.5 Mississippi 97.9 96.5 96.8 2.1 3.5 3.2 Missouri 99.8 99.7 97.3 0.2 0.3 2.7 Montana 96.1 94.5 88.0 3.9 5.5 12.0 Nebraska 99.8 99.0 95.1 0.2 1.0 4.9 Nevada 98.6 96.7 98.1 1.4 3.3 1.9 New Hampshire 96.2 91.9 81.2 3.8 8.1 18.8 New Jersey 95.7 94.4 91.8 4.3 5.6 8.2 New Mexico 99.9 99.9 99.5 0.1 0.1 0.5 New York 73.6 66.2 97.2 26.4 33.8 2.8 North Carolina 99.6 98.8 97.8 0.4 1.2 2.2 North Dakota 96.5 95.7 93.8 3.5 4.3 6.2 See notes at end of exhibit.
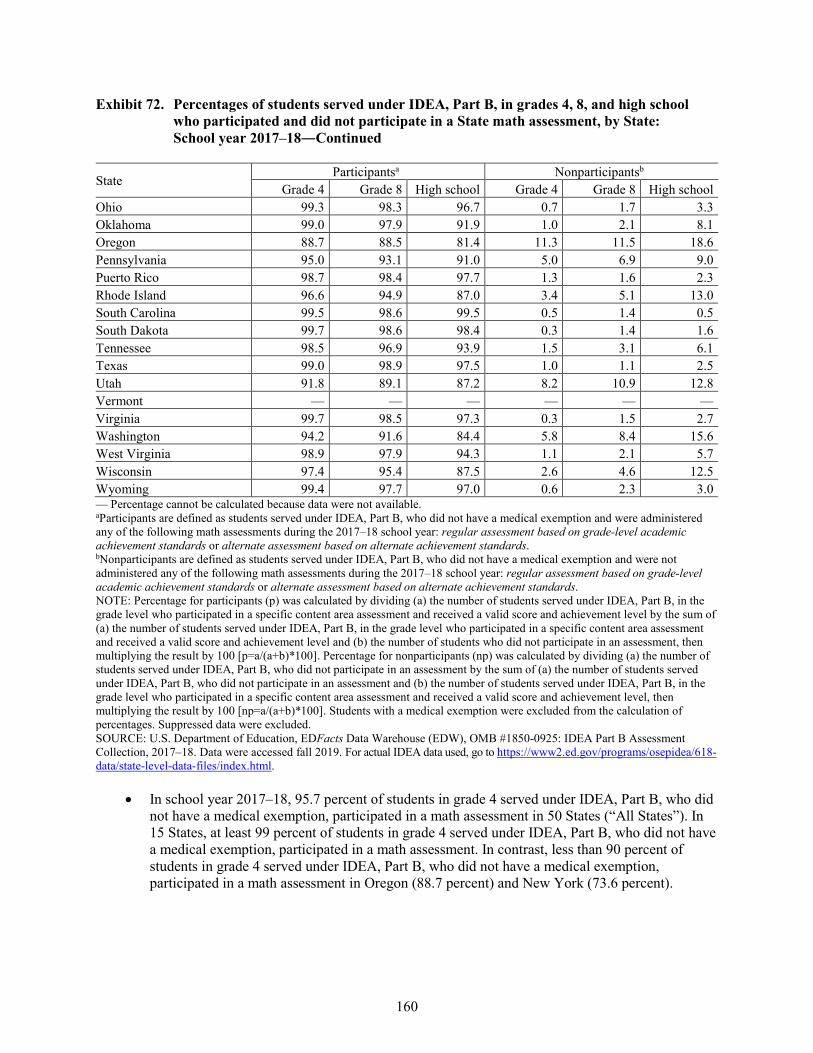
160
Exhibit 72. Percentages of students served under IDEA, Part B, in grades 4, 8, and high school who participated and did not participate in a State math assessment, by State: School year 2017–18―Continued
State Participantsa Nonparticipantsb
Grade 4 Grade 8 High school Grade 4 Grade 8 High school Ohio 99.3 98.3 96.7 0.7 1.7 3.3 Oklahoma 99.0 97.9 91.9 1.0 2.1 8.1 Oregon 88.7 88.5 81.4 11.3 11.5 18.6 Pennsylvania 95.0 93.1 91.0 5.0 6.9 9.0 Puerto Rico 98.7 98.4 97.7 1.3 1.6 2.3 Rhode Island 96.6 94.9 87.0 3.4 5.1 13.0 South Carolina 99.5 98.6 99.5 0.5 1.4 0.5 South Dakota 99.7 98.6 98.4 0.3 1.4 1.6 Tennessee 98.5 96.9 93.9 1.5 3.1 6.1 Texas 99.0 98.9 97.5 1.0 1.1 2.5 Utah 91.8 89.1 87.2 8.2 10.9 12.8 Vermont — — — — — — Virginia 99.7 98.5 97.3 0.3 1.5 2.7 Washington 94.2 91.6 84.4 5.8 8.4 15.6 West Virginia 98.9 97.9 94.3 1.1 2.1 5.7 Wisconsin 97.4 95.4 87.5 2.6 4.6 12.5 Wyoming 99.4 97.7 97.0 0.6 2.3 3.0 — Percentage cannot be calculated because data were not available. aParticipants are defined as students served under IDEA, Part B, who did not have a medical exemption and were administered any of the following math assessments during the 2017–18 school year: regular assessment based on grade-level academic achievement standards or alternate assessment based on alternate achievement standards. bNonparticipants are defined as students served under IDEA, Part B, who did not have a medical exemption and were not administered any of the following math assessments during the 2017–18 school year: regular assessment based on grade-level academic achievement standards or alternate assessment based on alternate achievement standards. NOTE: Percentage for participants (p) was calculated by dividing (a) the number of students served under IDEA, Part B, in the grade level who participated in a specific content area assessment and received a valid score and achievement level by the sum of (a) the number of students served under IDEA, Part B, in the grade level who participated in a specific content area assessment and received a valid score and achievement level and (b) the number of students who did not participate in an assessment, then multiplying the result by 100 [p=a/(a+b)*100]. Percentage for nonparticipants (np) was calculated by dividing (a) the number of students served under IDEA, Part B, who did not participate in an assessment by the sum of (a) the number of students served under IDEA, Part B, who did not participate in an assessment and (b) the number of students served under IDEA, Part B, in the grade level who participated in a specific content area assessment and received a valid score and achievement level, then multiplying the result by 100 [np=a/(a+b)*100]. Students with a medical exemption were excluded from the calculation of percentages. Suppressed data were excluded. SOURCE: U.S. Department of Education, EDFacts Data Warehouse (EDW), OMB #1850-0925: IDEA Part B Assessment Collection, 2017–18. Data were accessed fall 2019. For actual IDEA data used, go to https://www2.ed.gov/programs/osepidea/618-data/state-level-data-files/index.html.
• In school year 2017–18, 95.7 percent of students in grade 4 served under IDEA, Part B, who did not have a medical exemption, participated in a math assessment in 50 States (“All States”). In 15 States, at least 99 percent of students in grade 4 served under IDEA, Part B, who did not have a medical exemption, participated in a math assessment. In contrast, less than 90 percent of students in grade 4 served under IDEA, Part B, who did not have a medical exemption, participated in a math assessment in Oregon (88.7 percent) and New York (73.6 percent).
161
• In school year 2017–18, 93.7 percent of students in grade 8 served under IDEA, Part B, who did not have a medical exemption, participated in a math assessment in 50 States (“All States”). In five States, at least 99 percent of students in grade 8 served under IDEA, Part B, who did not have a medical exemption, participated in a math assessment. In contrast, less than 90 percent of students in grade 8 served under IDEA, Part B, who did not have a medical exemption, participated in a math assessment in the following four States: Utah (89.1 percent), Oregon (88.5 percent), Colorado (85.7 percent), and New York (66.2 percent).
• In school year 2017–18, 93.4 percent of students in high school served under IDEA, Part B, who did not have a medical exemption, participated in a math assessment in 50 States (“All States”). In the following four States, at least 98 percent of students in high school served under IDEA, Part B, who did not have a medical exemption, participated in a math assessment: New Mexico (99.5 percent), South Carolina (99.5 percent), South Dakota (98.4 percent), and Nevada (98.1 percent). In contrast, less than 85 percent of students in high school served under IDEA, Part B, who did not have a medical exemption, participated in a math assessment in the following five States: Colorado (84.4 percent), Washington (84.4 percent), Delaware (83.8 percent), Oregon (81.4 percent), and New Hampshire (81.2 percent).
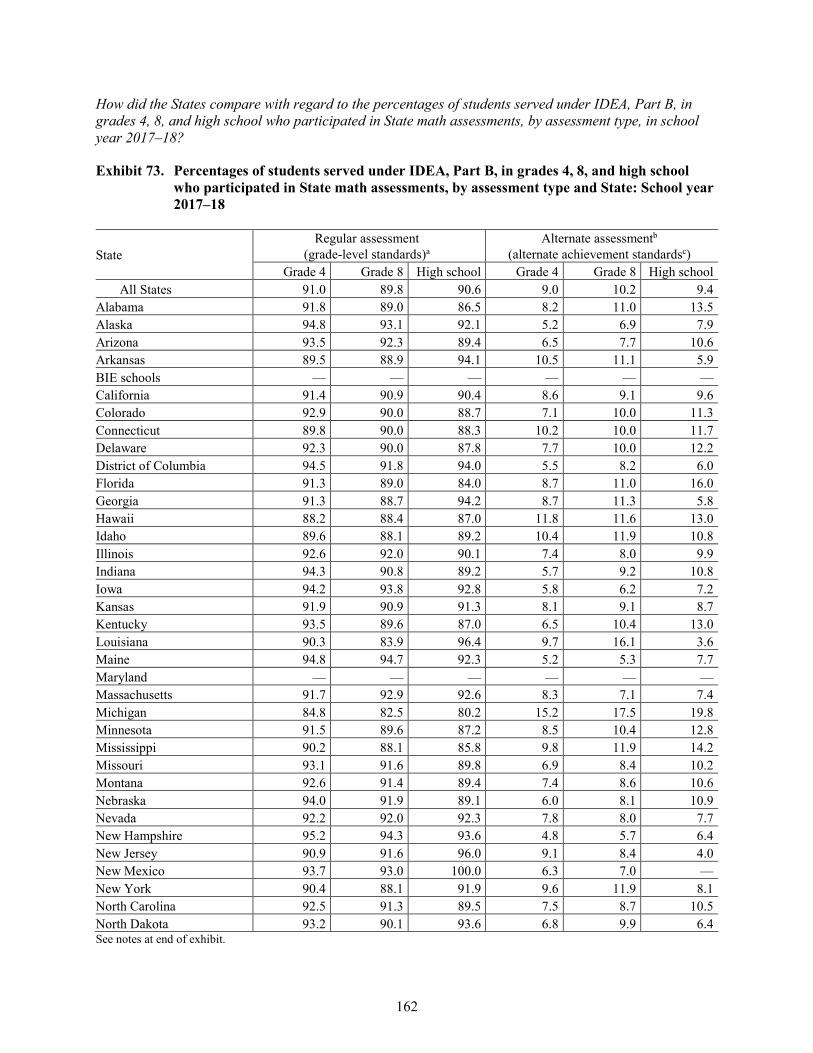
162
How did the States compare with regard to the percentages of students served under IDEA, Part B, in grades 4, 8, and high school who participated in State math assessments, by assessment type, in school year 2017–18?
Exhibit 73. Percentages of students served under IDEA, Part B, in grades 4, 8, and high school who participated in State math assessments, by assessment type and State: School year 2017–18
State Regular assessment
(grade-level standards)a Alternate assessmentb
(alternate achievement standardsc) Grade 4 Grade 8 High school Grade 4 Grade 8 High school
All States 91.0 89.8 90.6 9.0 10.2 9.4 Alabama 91.8 89.0 86.5 8.2 11.0 13.5 Alaska 94.8 93.1 92.1 5.2 6.9 7.9 Arizona 93.5 92.3 89.4 6.5 7.7 10.6 Arkansas 89.5 88.9 94.1 10.5 11.1 5.9 BIE schools — — — — — — California 91.4 90.9 90.4 8.6 9.1 9.6 Colorado 92.9 90.0 88.7 7.1 10.0 11.3 Connecticut 89.8 90.0 88.3 10.2 10.0 11.7 Delaware 92.3 90.0 87.8 7.7 10.0 12.2 District of Columbia 94.5 91.8 94.0 5.5 8.2 6.0 Florida 91.3 89.0 84.0 8.7 11.0 16.0 Georgia 91.3 88.7 94.2 8.7 11.3 5.8 Hawaii 88.2 88.4 87.0 11.8 11.6 13.0 Idaho 89.6 88.1 89.2 10.4 11.9 10.8 Illinois 92.6 92.0 90.1 7.4 8.0 9.9 Indiana 94.3 90.8 89.2 5.7 9.2 10.8 Iowa 94.2 93.8 92.8 5.8 6.2 7.2 Kansas 91.9 90.9 91.3 8.1 9.1 8.7 Kentucky 93.5 89.6 87.0 6.5 10.4 13.0 Louisiana 90.3 83.9 96.4 9.7 16.1 3.6 Maine 94.8 94.7 92.3 5.2 5.3 7.7 Maryland — — — — — — Massachusetts 91.7 92.9 92.6 8.3 7.1 7.4 Michigan 84.8 82.5 80.2 15.2 17.5 19.8 Minnesota 91.5 89.6 87.2 8.5 10.4 12.8 Mississippi 90.2 88.1 85.8 9.8 11.9 14.2 Missouri 93.1 91.6 89.8 6.9 8.4 10.2 Montana 92.6 91.4 89.4 7.4 8.6 10.6 Nebraska 94.0 91.9 89.1 6.0 8.1 10.9 Nevada 92.2 92.0 92.3 7.8 8.0 7.7 New Hampshire 95.2 94.3 93.6 4.8 5.7 6.4 New Jersey 90.9 91.6 96.0 9.1 8.4 4.0 New Mexico 93.7 93.0 100.0 6.3 7.0 — New York 90.4 88.1 91.9 9.6 11.9 8.1 North Carolina 92.5 91.3 89.5 7.5 8.7 10.5 North Dakota 93.2 90.1 93.6 6.8 9.9 6.4 See notes at end of exhibit.
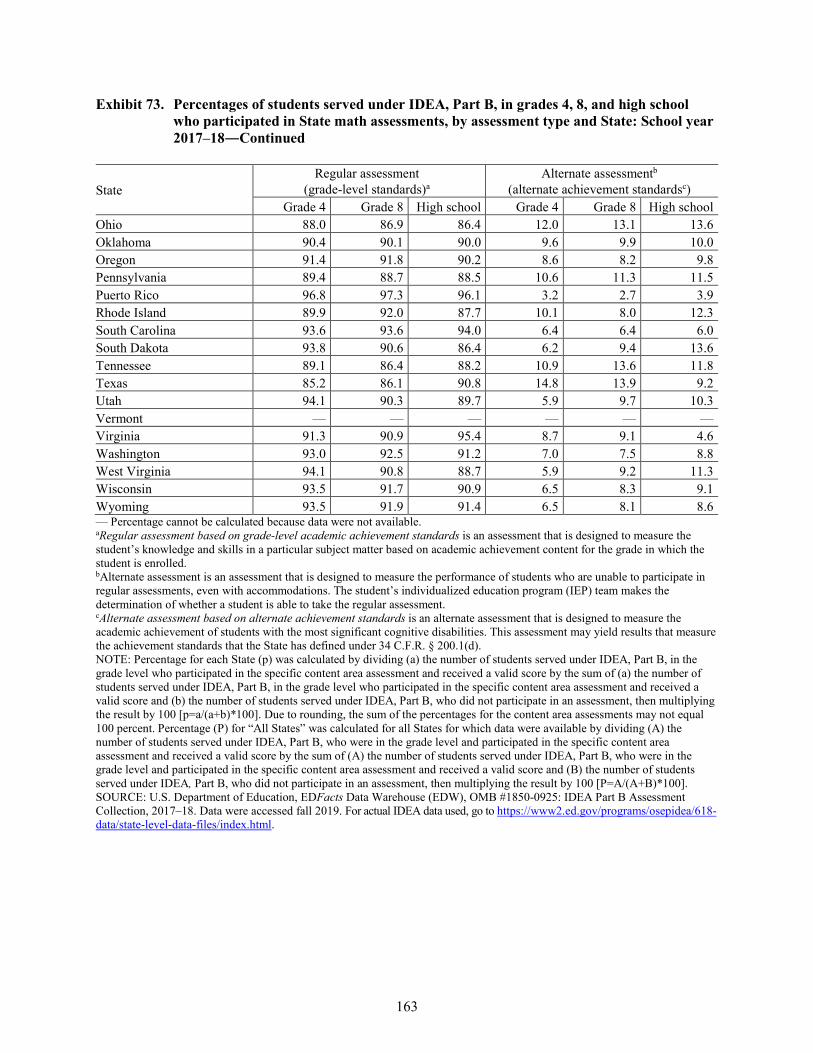
163
Exhibit 73. Percentages of students served under IDEA, Part B, in grades 4, 8, and high school who participated in State math assessments, by assessment type and State: School year 2017–18―Continued
State Regular assessment
(grade-level standards)a Alternate assessmentb
(alternate achievement standardsc) Grade 4 Grade 8 High school Grade 4 Grade 8 High school
Ohio 88.0 86.9 86.4 12.0 13.1 13.6 Oklahoma 90.4 90.1 90.0 9.6 9.9 10.0 Oregon 91.4 91.8 90.2 8.6 8.2 9.8 Pennsylvania 89.4 88.7 88.5 10.6 11.3 11.5 Puerto Rico 96.8 97.3 96.1 3.2 2.7 3.9 Rhode Island 89.9 92.0 87.7 10.1 8.0 12.3 South Carolina 93.6 93.6 94.0 6.4 6.4 6.0 South Dakota 93.8 90.6 86.4 6.2 9.4 13.6 Tennessee 89.1 86.4 88.2 10.9 13.6 11.8 Texas 85.2 86.1 90.8 14.8 13.9 9.2 Utah 94.1 90.3 89.7 5.9 9.7 10.3 Vermont — — — — — — Virginia 91.3 90.9 95.4 8.7 9.1 4.6 Washington 93.0 92.5 91.2 7.0 7.5 8.8 West Virginia 94.1 90.8 88.7 5.9 9.2 11.3 Wisconsin 93.5 91.7 90.9 6.5 8.3 9.1 Wyoming 93.5 91.9 91.4 6.5 8.1 8.6 — Percentage cannot be calculated because data were not available. aRegular assessment based on grade-level academic achievement standards is an assessment that is designed to measure the student’s knowledge and skills in a particular subject matter based on academic achievement content for the grade in which the student is enrolled. bAlternate assessment is an assessment that is designed to measure the performance of students who are unable to participate in regular assessments, even with accommodations. The student’s individualized education program (IEP) team makes the determination of whether a student is able to take the regular assessment. cAlternate assessment based on alternate achievement standards is an alternate assessment that is designed to measure the academic achievement of students with the most significant cognitive disabilities. This assessment may yield results that measure the achievement standards that the State has defined under 34 C.F.R. § 200.1(d). NOTE: Percentage for each State (p) was calculated by dividing (a) the number of students served under IDEA, Part B, in the grade level who participated in the specific content area assessment and received a valid score by the sum of (a) the number of students served under IDEA, Part B, in the grade level who participated in the specific content area assessment and received a valid score and (b) the number of students served under IDEA, Part B, who did not participate in an assessment, then multiplying the result by 100 [p=a/(a+b)*100]. Due to rounding, the sum of the percentages for the content area assessments may not equal 100 percent. Percentage (P) for “All States” was calculated for all States for which data were available by dividing (A) the number of students served under IDEA, Part B, who were in the grade level and participated in the specific content area assessment and received a valid score by the sum of (A) the number of students served under IDEA, Part B, who were in the grade level and participated in the specific content area assessment and received a valid score and (B) the number of students served under IDEA, Part B, who did not participate in an assessment, then multiplying the result by 100 [P=A/(A+B)*100]. SOURCE: U.S. Department of Education, EDFacts Data Warehouse (EDW), OMB #1850-0925: IDEA Part B Assessment Collection, 2017–18. Data were accessed fall 2019. For actual IDEA data used, go to https://www2.ed.gov/programs/osepidea/618-data/state-level-data-files/index.html.
164
• A regular assessment based on grade-level academic achievement standards in math was administered to some students in grade 4, grade 8, and high school by 50 States. An alternate assessment based on alternate achievement standards was administered to some students in grade 4 by the 50 States and in grade 8 by the 50 States for which data were available. An alternate assessment based on alternate achievement standards was administered to some students in high school by 49 States.
• Of the two types of State math assessments, a regular assessment based on grade-level academic achievement standards was taken by larger percentages of the students with disabilities in “All States” for which data were available in grade 4 (91.0 percent), grade 8 (89.8 percent), and high school (90.6 percent).
• Compared to the other type of State math assessments, a regular assessment based on grade-level academic achievement standards was taken by a larger percentage of students with disabilities in grade 4, grade 8, and high school in 49 States.
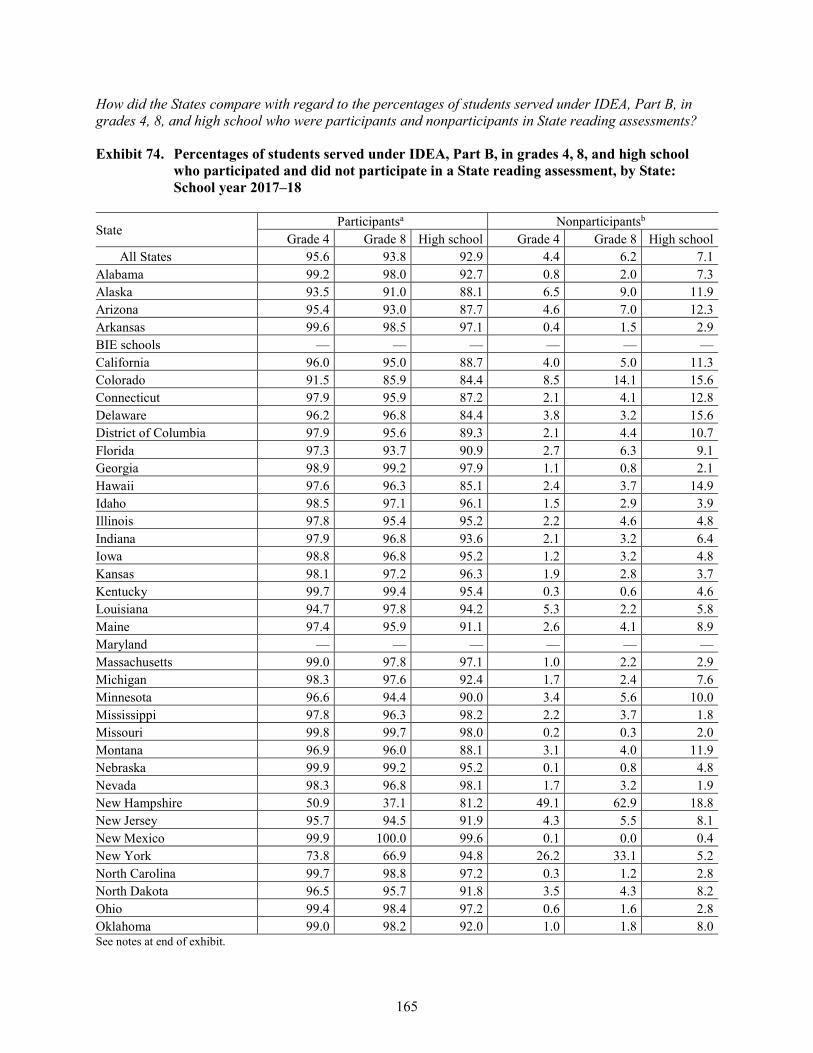
165
How did the States compare with regard to the percentages of students served under IDEA, Part B, in grades 4, 8, and high school who were participants and nonparticipants in State reading assessments?
Exhibit 74. Percentages of students served under IDEA, Part B, in grades 4, 8, and high school who participated and did not participate in a State reading assessment, by State: School year 2017–18
State Participantsa Nonparticipantsb
Grade 4 Grade 8 High school Grade 4 Grade 8 High school All States 95.6 93.8 92.9 4.4 6.2 7.1
Alabama 99.2 98.0 92.7 0.8 2.0 7.3 Alaska 93.5 91.0 88.1 6.5 9.0 11.9 Arizona 95.4 93.0 87.7 4.6 7.0 12.3 Arkansas 99.6 98.5 97.1 0.4 1.5 2.9 BIE schools — — — — — — California 96.0 95.0 88.7 4.0 5.0 11.3 Colorado 91.5 85.9 84.4 8.5 14.1 15.6 Connecticut 97.9 95.9 87.2 2.1 4.1 12.8 Delaware 96.2 96.8 84.4 3.8 3.2 15.6 District of Columbia 97.9 95.6 89.3 2.1 4.4 10.7 Florida 97.3 93.7 90.9 2.7 6.3 9.1 Georgia 98.9 99.2 97.9 1.1 0.8 2.1 Hawaii 97.6 96.3 85.1 2.4 3.7 14.9 Idaho 98.5 97.1 96.1 1.5 2.9 3.9 Illinois 97.8 95.4 95.2 2.2 4.6 4.8 Indiana 97.9 96.8 93.6 2.1 3.2 6.4 Iowa 98.8 96.8 95.2 1.2 3.2 4.8 Kansas 98.1 97.2 96.3 1.9 2.8 3.7 Kentucky 99.7 99.4 95.4 0.3 0.6 4.6 Louisiana 94.7 97.8 94.2 5.3 2.2 5.8 Maine 97.4 95.9 91.1 2.6 4.1 8.9 Maryland — — — — — — Massachusetts 99.0 97.8 97.1 1.0 2.2 2.9 Michigan 98.3 97.6 92.4 1.7 2.4 7.6 Minnesota 96.6 94.4 90.0 3.4 5.6 10.0 Mississippi 97.8 96.3 98.2 2.2 3.7 1.8 Missouri 99.8 99.7 98.0 0.2 0.3 2.0 Montana 96.9 96.0 88.1 3.1 4.0 11.9 Nebraska 99.9 99.2 95.2 0.1 0.8 4.8 Nevada 98.3 96.8 98.1 1.7 3.2 1.9 New Hampshire 50.9 37.1 81.2 49.1 62.9 18.8 New Jersey 95.7 94.5 91.9 4.3 5.5 8.1 New Mexico 99.9 100.0 99.6 0.1 0.0 0.4 New York 73.8 66.9 94.8 26.2 33.1 5.2 North Carolina 99.7 98.8 97.2 0.3 1.2 2.8 North Dakota 96.5 95.7 91.8 3.5 4.3 8.2 Ohio 99.4 98.4 97.2 0.6 1.6 2.8 Oklahoma 99.0 98.2 92.0 1.0 1.8 8.0 See notes at end of exhibit.
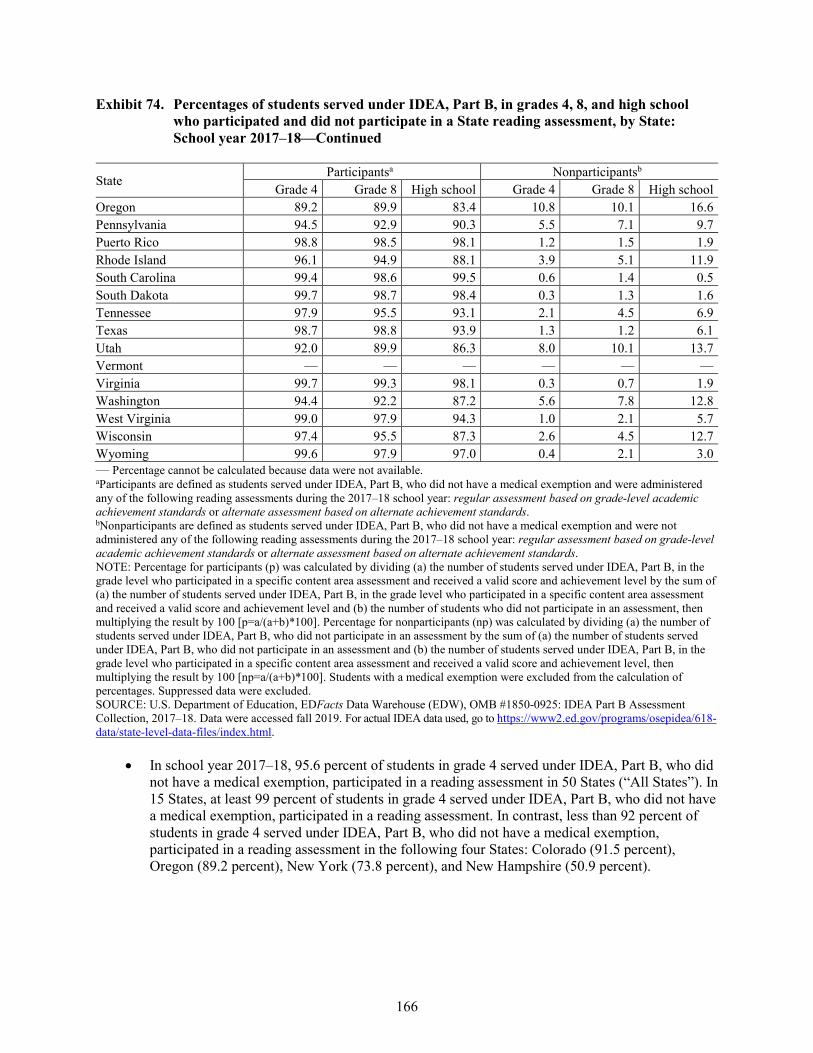
166
Exhibit 74. Percentages of students served under IDEA, Part B, in grades 4, 8, and high school who participated and did not participate in a State reading assessment, by State: School year 2017–18—Continued
State Participantsa Nonparticipantsb
Grade 4 Grade 8 High school Grade 4 Grade 8 High school Oregon 89.2 89.9 83.4 10.8 10.1 16.6 Pennsylvania 94.5 92.9 90.3 5.5 7.1 9.7 Puerto Rico 98.8 98.5 98.1 1.2 1.5 1.9 Rhode Island 96.1 94.9 88.1 3.9 5.1 11.9 South Carolina 99.4 98.6 99.5 0.6 1.4 0.5 South Dakota 99.7 98.7 98.4 0.3 1.3 1.6 Tennessee 97.9 95.5 93.1 2.1 4.5 6.9 Texas 98.7 98.8 93.9 1.3 1.2 6.1 Utah 92.0 89.9 86.3 8.0 10.1 13.7 Vermont — — — — — — Virginia 99.7 99.3 98.1 0.3 0.7 1.9 Washington 94.4 92.2 87.2 5.6 7.8 12.8 West Virginia 99.0 97.9 94.3 1.0 2.1 5.7 Wisconsin 97.4 95.5 87.3 2.6 4.5 12.7 Wyoming 99.6 97.9 97.0 0.4 2.1 3.0 — Percentage cannot be calculated because data were not available. aParticipants are defined as students served under IDEA, Part B, who did not have a medical exemption and were administered any of the following reading assessments during the 2017–18 school year: regular assessment based on grade-level academic achievement standards or alternate assessment based on alternate achievement standards. bNonparticipants are defined as students served under IDEA, Part B, who did not have a medical exemption and were not administered any of the following reading assessments during the 2017–18 school year: regular assessment based on grade-level academic achievement standards or alternate assessment based on alternate achievement standards. NOTE: Percentage for participants (p) was calculated by dividing (a) the number of students served under IDEA, Part B, in the grade level who participated in a specific content area assessment and received a valid score and achievement level by the sum of (a) the number of students served under IDEA, Part B, in the grade level who participated in a specific content area assessment and received a valid score and achievement level and (b) the number of students who did not participate in an assessment, then multiplying the result by 100 [p=a/(a+b)*100]. Percentage for nonparticipants (np) was calculated by dividing (a) the number of students served under IDEA, Part B, who did not participate in an assessment by the sum of (a) the number of students served under IDEA, Part B, who did not participate in an assessment and (b) the number of students served under IDEA, Part B, in the grade level who participated in a specific content area assessment and received a valid score and achievement level, then multiplying the result by 100 [np=a/(a+b)*100]. Students with a medical exemption were excluded from the calculation of percentages. Suppressed data were excluded. SOURCE: U.S. Department of Education, EDFacts Data Warehouse (EDW), OMB #1850-0925: IDEA Part B Assessment Collection, 2017–18. Data were accessed fall 2019. For actual IDEA data used, go to https://www2.ed.gov/programs/osepidea/618-data/state-level-data-files/index.html.
• In school year 2017–18, 95.6 percent of students in grade 4 served under IDEA, Part B, who did not have a medical exemption, participated in a reading assessment in 50 States (“All States”). In 15 States, at least 99 percent of students in grade 4 served under IDEA, Part B, who did not have a medical exemption, participated in a reading assessment. In contrast, less than 92 percent of students in grade 4 served under IDEA, Part B, who did not have a medical exemption, participated in a reading assessment in the following four States: Colorado (91.5 percent), Oregon (89.2 percent), New York (73.8 percent), and New Hampshire (50.9 percent).
167
• In school year 2017–18, 93.8 percent of students in grade 8 served under IDEA, Part B, who did not have a medical exemption, participated in a reading assessment in 50 States (“All States”). In 15 States, at least 98 percent of students in grade 8 served under IDEA, Part B, who did not have a medical exemption, participated in a reading assessment. In contrast, less than 90 percent of students in grade 8 served under IDEA, Part B, who did not have a medical exemption, participated in a reading assessment in the following five States: Oregon (89.9 percent), Utah (89.9 percent), Colorado (85.9 percent), New York (66.9 percent), and New Hampshire (37.1 percent).
• In school year 2017–18, 92.9 percent of students in high school served under IDEA, Part B, who did not have a medical exemption, participated in a reading assessment in 50 States (“All States”). In the following eight States, at least 98 percent of students in high school served under IDEA, Part B, who did not have a medical exemption, participated in a reading assessment: New Mexico (99.6 percent), South Carolina (99.5 percent), South Dakota (98.4 percent), Mississippi (98.2 percent), Puerto Rico (98.1 percent), Nevada (98.1 percent), Virginia (98.1 percent), and Missouri (98.0 percent). In contrast, less than 85 percent of students in high school served under IDEA, Part B, who did not have a medical exemption, participated in a reading assessment in the following four States: Colorado (84.4 percent), Delaware (84.4 percent), Oregon (83.4 percent), and New Hampshire (81.2 percent).
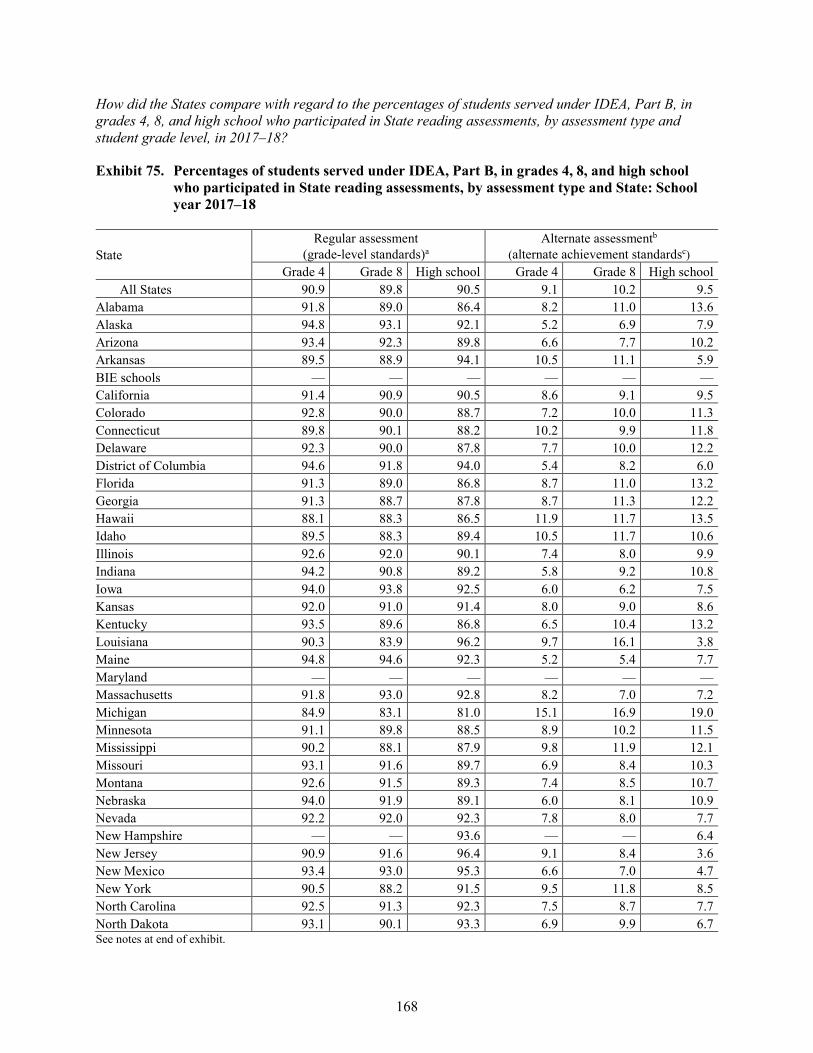
168
How did the States compare with regard to the percentages of students served under IDEA, Part B, in grades 4, 8, and high school who participated in State reading assessments, by assessment type and student grade level, in 2017–18?
Exhibit 75. Percentages of students served under IDEA, Part B, in grades 4, 8, and high school who participated in State reading assessments, by assessment type and State: School year 2017–18
State Regular assessment
(grade-level standards)a Alternate assessmentb
(alternate achievement standardsc) Grade 4 Grade 8 High school Grade 4 Grade 8 High school
All States 90.9 89.8 90.5 9.1 10.2 9.5 Alabama 91.8 89.0 86.4 8.2 11.0 13.6 Alaska 94.8 93.1 92.1 5.2 6.9 7.9 Arizona 93.4 92.3 89.8 6.6 7.7 10.2 Arkansas 89.5 88.9 94.1 10.5 11.1 5.9 BIE schools — — — — — — California 91.4 90.9 90.5 8.6 9.1 9.5 Colorado 92.8 90.0 88.7 7.2 10.0 11.3 Connecticut 89.8 90.1 88.2 10.2 9.9 11.8 Delaware 92.3 90.0 87.8 7.7 10.0 12.2 District of Columbia 94.6 91.8 94.0 5.4 8.2 6.0 Florida 91.3 89.0 86.8 8.7 11.0 13.2 Georgia 91.3 88.7 87.8 8.7 11.3 12.2 Hawaii 88.1 88.3 86.5 11.9 11.7 13.5 Idaho 89.5 88.3 89.4 10.5 11.7 10.6 Illinois 92.6 92.0 90.1 7.4 8.0 9.9 Indiana 94.2 90.8 89.2 5.8 9.2 10.8 Iowa 94.0 93.8 92.5 6.0 6.2 7.5 Kansas 92.0 91.0 91.4 8.0 9.0 8.6 Kentucky 93.5 89.6 86.8 6.5 10.4 13.2 Louisiana 90.3 83.9 96.2 9.7 16.1 3.8 Maine 94.8 94.6 92.3 5.2 5.4 7.7 Maryland — — — — — — Massachusetts 91.8 93.0 92.8 8.2 7.0 7.2 Michigan 84.9 83.1 81.0 15.1 16.9 19.0 Minnesota 91.1 89.8 88.5 8.9 10.2 11.5 Mississippi 90.2 88.1 87.9 9.8 11.9 12.1 Missouri 93.1 91.6 89.7 6.9 8.4 10.3 Montana 92.6 91.5 89.3 7.4 8.5 10.7 Nebraska 94.0 91.9 89.1 6.0 8.1 10.9 Nevada 92.2 92.0 92.3 7.8 8.0 7.7 New Hampshire — — 93.6 — — 6.4 New Jersey 90.9 91.6 96.4 9.1 8.4 3.6 New Mexico 93.4 93.0 95.3 6.6 7.0 4.7 New York 90.5 88.2 91.5 9.5 11.8 8.5 North Carolina 92.5 91.3 92.3 7.5 8.7 7.7 North Dakota 93.1 90.1 93.3 6.9 9.9 6.7 See notes at end of exhibit.
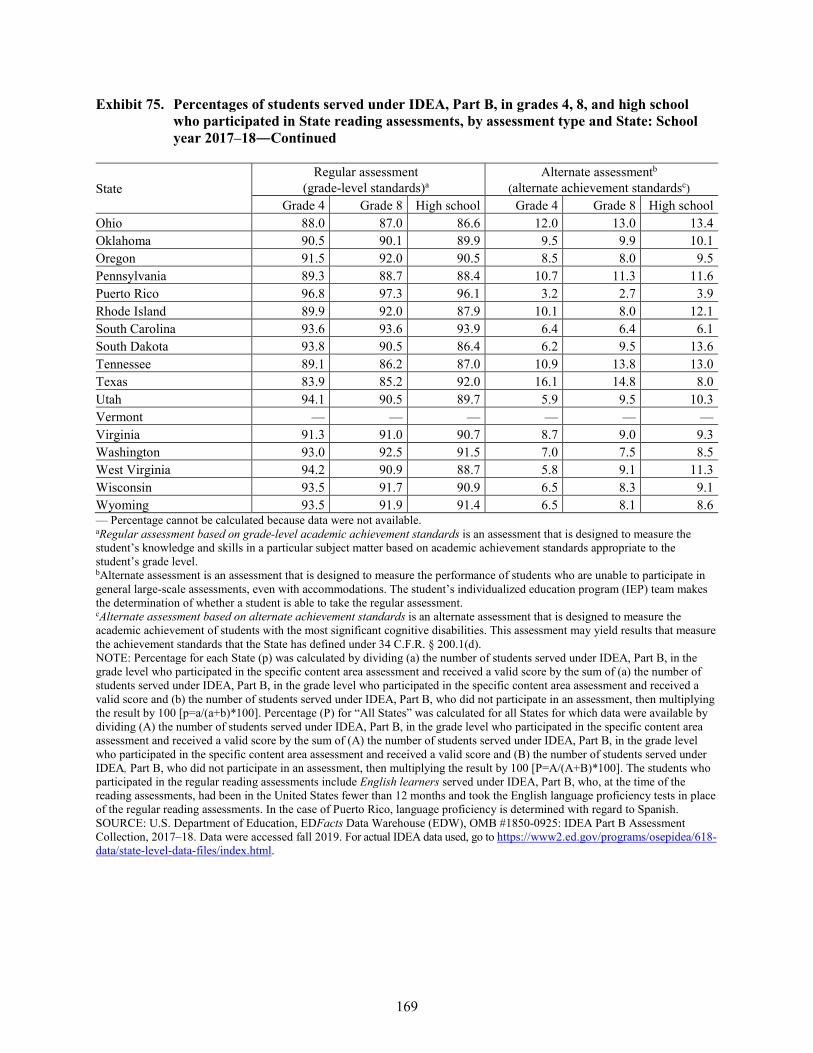
169
Exhibit 75. Percentages of students served under IDEA, Part B, in grades 4, 8, and high school who participated in State reading assessments, by assessment type and State: School year 2017–18―Continued
State Regular assessment
(grade-level standards)a Alternate assessmentb
(alternate achievement standardsc) Grade 4 Grade 8 High school Grade 4 Grade 8 High school
Ohio 88.0 87.0 86.6 12.0 13.0 13.4 Oklahoma 90.5 90.1 89.9 9.5 9.9 10.1 Oregon 91.5 92.0 90.5 8.5 8.0 9.5 Pennsylvania 89.3 88.7 88.4 10.7 11.3 11.6 Puerto Rico 96.8 97.3 96.1 3.2 2.7 3.9 Rhode Island 89.9 92.0 87.9 10.1 8.0 12.1 South Carolina 93.6 93.6 93.9 6.4 6.4 6.1 South Dakota 93.8 90.5 86.4 6.2 9.5 13.6 Tennessee 89.1 86.2 87.0 10.9 13.8 13.0 Texas 83.9 85.2 92.0 16.1 14.8 8.0 Utah 94.1 90.5 89.7 5.9 9.5 10.3 Vermont — — — — — — Virginia 91.3 91.0 90.7 8.7 9.0 9.3 Washington 93.0 92.5 91.5 7.0 7.5 8.5 West Virginia 94.2 90.9 88.7 5.8 9.1 11.3 Wisconsin 93.5 91.7 90.9 6.5 8.3 9.1 Wyoming 93.5 91.9 91.4 6.5 8.1 8.6 — Percentage cannot be calculated because data were not available. aRegular assessment based on grade-level academic achievement standards is an assessment that is designed to measure the student’s knowledge and skills in a particular subject matter based on academic achievement standards appropriate to the student’s grade level. bAlternate assessment is an assessment that is designed to measure the performance of students who are unable to participate in general large-scale assessments, even with accommodations. The student’s individualized education program (IEP) team makes the determination of whether a student is able to take the regular assessment. cAlternate assessment based on alternate achievement standards is an alternate assessment that is designed to measure the academic achievement of students with the most significant cognitive disabilities. This assessment may yield results that measure the achievement standards that the State has defined under 34 C.F.R. § 200.1(d). NOTE: Percentage for each State (p) was calculated by dividing (a) the number of students served under IDEA, Part B, in the grade level who participated in the specific content area assessment and received a valid score by the sum of (a) the number of students served under IDEA, Part B, in the grade level who participated in the specific content area assessment and received a valid score and (b) the number of students served under IDEA, Part B, who did not participate in an assessment, then multiplying the result by 100 [p=a/(a+b)*100]. Percentage (P) for “All States” was calculated for all States for which data were available by dividing (A) the number of students served under IDEA, Part B, in the grade level who participated in the specific content area assessment and received a valid score by the sum of (A) the number of students served under IDEA, Part B, in the grade level who participated in the specific content area assessment and received a valid score and (B) the number of students served under IDEA, Part B, who did not participate in an assessment, then multiplying the result by 100 [P=A/(A+B)*100]. The students who participated in the regular reading assessments include English learners served under IDEA, Part B, who, at the time of the reading assessments, had been in the United States fewer than 12 months and took the English language proficiency tests in place of the regular reading assessments. In the case of Puerto Rico, language proficiency is determined with regard to Spanish. SOURCE: U.S. Department of Education, EDFacts Data Warehouse (EDW), OMB #1850-0925: IDEA Part B Assessment Collection, 2017–18. Data were accessed fall 2019. For actual IDEA data used, go to https://www2.ed.gov/programs/osepidea/618-data/state-level-data-files/index.html.
170
• A regular assessment based on grade-level academic achievement standards in reading was administered to some students in grade 4 and grade 8 by 49 States and to some students in high school by 50 States. An alternate assessment based on alternate achievement standards was administered to some students in grade 4 and grade 8 by the 49 States for which data were available. An alternate assessment based on alternate achievement standards was administered to some students in high school by 50 States.
• Of the two types of State reading assessments, a regular assessment based on grade-level academic achievement standards was taken by larger percentages of the students with disabilities in “All States” in grade 4 (90.9 percent), grade 8 (89.8 percent), and high school (90.5 percent).
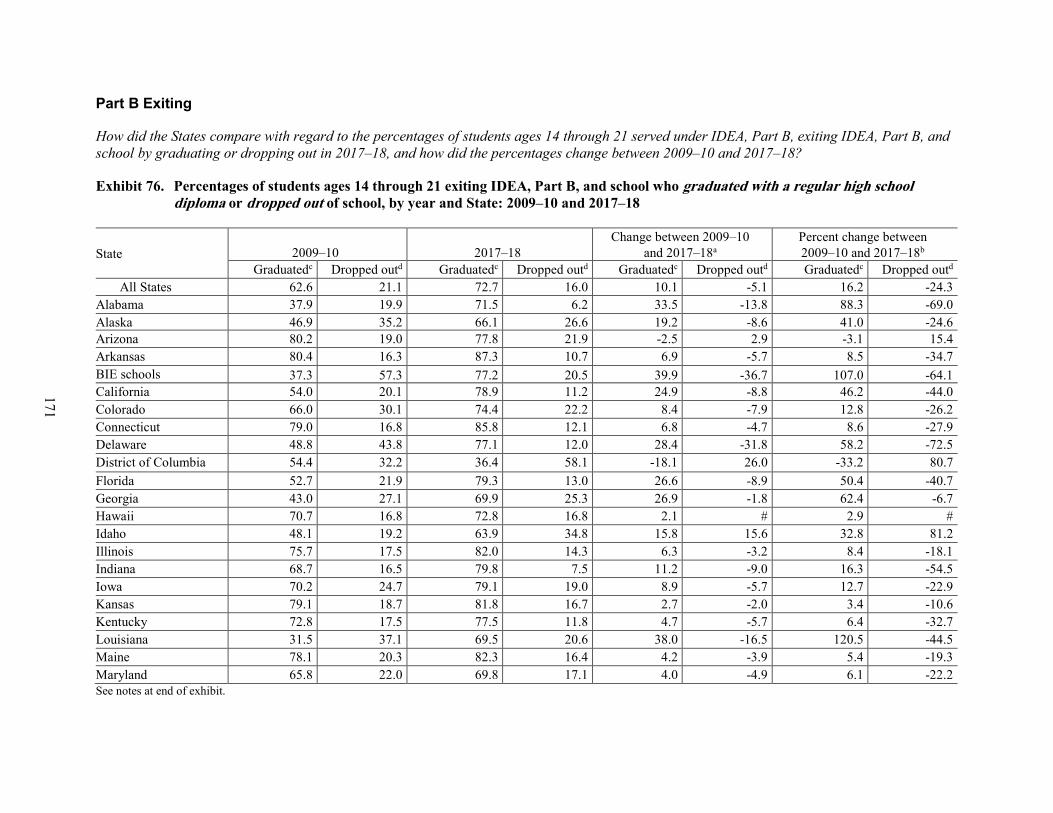
171
Part B Exiting
How did the States compare with regard to the percentages of students ages 14 through 21 served under IDEA, Part B, exiting IDEA, Part B, and school by graduating or dropping out in 2017–18, and how did the percentages change between 2009–10 and 2017–18?
Exhibit 76. Percentages of students ages 14 through 21 exiting IDEA, Part B, and school who graduated with a regular high school diploma or dropped out of school, by year and State: 2009–10 and 2017–18
State 2009–10 2017–18 Change between 2009–10
and 2017–18a Percent change between 2009–10 and 2017–18b
Graduatedc Dropped outd Graduatedc Dropped outd Graduatedc Dropped outd Graduatedc Dropped outd All States 62.6 21.1 72.7 16.0 10.1 -5.1 16.2 -24.3
Alabama 37.9 19.9 71.5 6.2 33.5 -13.8 88.3 -69.0 Alaska 46.9 35.2 66.1 26.6 19.2 -8.6 41.0 -24.6 Arizona 80.2 19.0 77.8 21.9 -2.5 2.9 -3.1 15.4 Arkansas 80.4 16.3 87.3 10.7 6.9 -5.7 8.5 -34.7 BIE schools 37.3 57.3 77.2 20.5 39.9 -36.7 107.0 -64.1 California 54.0 20.1 78.9 11.2 24.9 -8.8 46.2 -44.0 Colorado 66.0 30.1 74.4 22.2 8.4 -7.9 12.8 -26.2 Connecticut 79.0 16.8 85.8 12.1 6.8 -4.7 8.6 -27.9 Delaware 48.8 43.8 77.1 12.0 28.4 -31.8 58.2 -72.5 District of Columbia 54.4 32.2 36.4 58.1 -18.1 26.0 -33.2 80.7 Florida 52.7 21.9 79.3 13.0 26.6 -8.9 50.4 -40.7 Georgia 43.0 27.1 69.9 25.3 26.9 -1.8 62.4 -6.7 Hawaii 70.7 16.8 72.8 16.8 2.1 # 2.9 # Idaho 48.1 19.2 63.9 34.8 15.8 15.6 32.8 81.2 Illinois 75.7 17.5 82.0 14.3 6.3 -3.2 8.4 -18.1 Indiana 68.7 16.5 79.8 7.5 11.2 -9.0 16.3 -54.5 Iowa 70.2 24.7 79.1 19.0 8.9 -5.7 12.7 -22.9 Kansas 79.1 18.7 81.8 16.7 2.7 -2.0 3.4 -10.6 Kentucky 72.8 17.5 77.5 11.8 4.7 -5.7 6.4 -32.7 Louisiana 31.5 37.1 69.5 20.6 38.0 -16.5 120.5 -44.5 Maine 78.1 20.3 82.3 16.4 4.2 -3.9 5.4 -19.3 Maryland 65.8 22.0 69.8 17.1 4.0 -4.9 6.1 -22.2 See notes at end of exhibit.
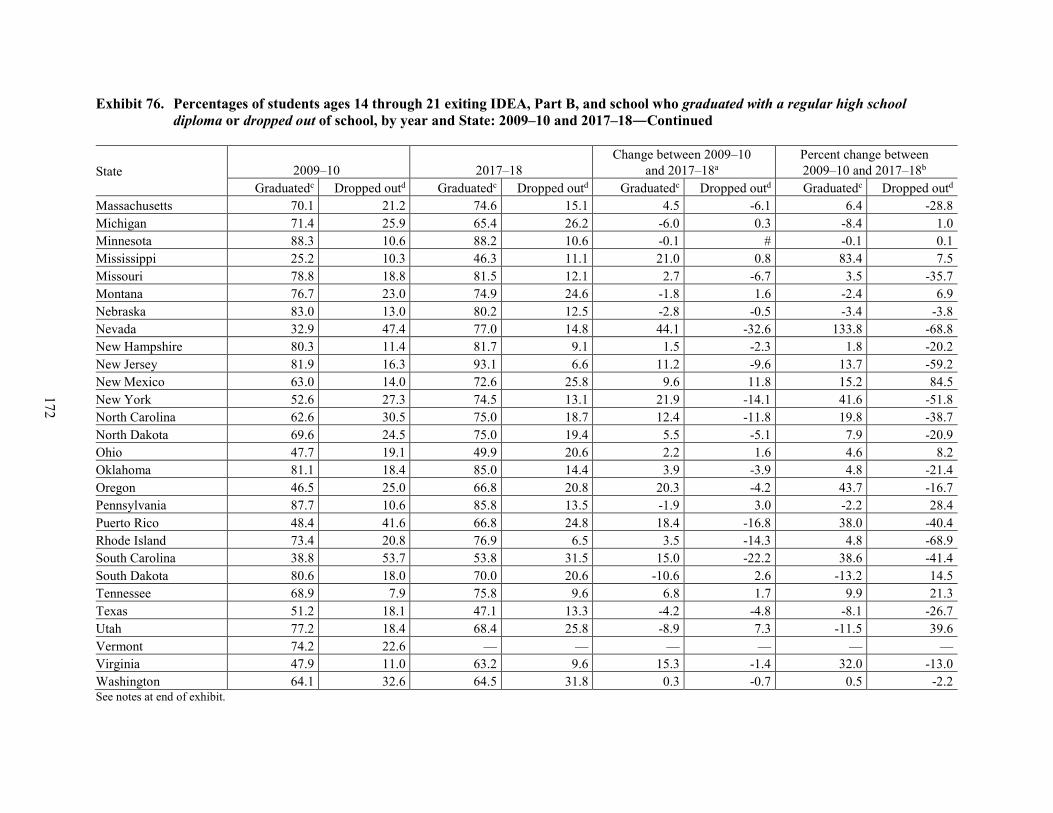
172
Exhibit 76. Percentages of students ages 14 through 21 exiting IDEA, Part B, and school who graduated with a regular high school diploma or dropped out of school, by year and State: 2009–10 and 2017–18―Continued
State 2009–10 2017–18 Change between 2009–10
and 2017–18a Percent change between 2009–10 and 2017–18b
Graduatedc Dropped outd Graduatedc Dropped outd Graduatedc Dropped outd Graduatedc Dropped outd Massachusetts 70.1 21.2 74.6 15.1 4.5 -6.1 6.4 -28.8 Michigan 71.4 25.9 65.4 26.2 -6.0 0.3 -8.4 1.0 Minnesota 88.3 10.6 88.2 10.6 -0.1 # -0.1 0.1 Mississippi 25.2 10.3 46.3 11.1 21.0 0.8 83.4 7.5 Missouri 78.8 18.8 81.5 12.1 2.7 -6.7 3.5 -35.7 Montana 76.7 23.0 74.9 24.6 -1.8 1.6 -2.4 6.9 Nebraska 83.0 13.0 80.2 12.5 -2.8 -0.5 -3.4 -3.8 Nevada 32.9 47.4 77.0 14.8 44.1 -32.6 133.8 -68.8 New Hampshire 80.3 11.4 81.7 9.1 1.5 -2.3 1.8 -20.2 New Jersey 81.9 16.3 93.1 6.6 11.2 -9.6 13.7 -59.2 New Mexico 63.0 14.0 72.6 25.8 9.6 11.8 15.2 84.5 New York 52.6 27.3 74.5 13.1 21.9 -14.1 41.6 -51.8 North Carolina 62.6 30.5 75.0 18.7 12.4 -11.8 19.8 -38.7 North Dakota 69.6 24.5 75.0 19.4 5.5 -5.1 7.9 -20.9 Ohio 47.7 19.1 49.9 20.6 2.2 1.6 4.6 8.2 Oklahoma 81.1 18.4 85.0 14.4 3.9 -3.9 4.8 -21.4 Oregon 46.5 25.0 66.8 20.8 20.3 -4.2 43.7 -16.7 Pennsylvania 87.7 10.6 85.8 13.5 -1.9 3.0 -2.2 28.4 Puerto Rico 48.4 41.6 66.8 24.8 18.4 -16.8 38.0 -40.4 Rhode Island 73.4 20.8 76.9 6.5 3.5 -14.3 4.8 -68.9 South Carolina 38.8 53.7 53.8 31.5 15.0 -22.2 38.6 -41.4 South Dakota 80.6 18.0 70.0 20.6 -10.6 2.6 -13.2 14.5 Tennessee 68.9 7.9 75.8 9.6 6.8 1.7 9.9 21.3 Texas 51.2 18.1 47.1 13.3 -4.2 -4.8 -8.1 -26.7 Utah 77.2 18.4 68.4 25.8 -8.9 7.3 -11.5 39.6 Vermont 74.2 22.6 — — — — — — Virginia 47.9 11.0 63.2 9.6 15.3 -1.4 32.0 -13.0 Washington 64.1 32.6 64.5 31.8 0.3 -0.7 0.5 -2.2 See notes at end of exhibit.
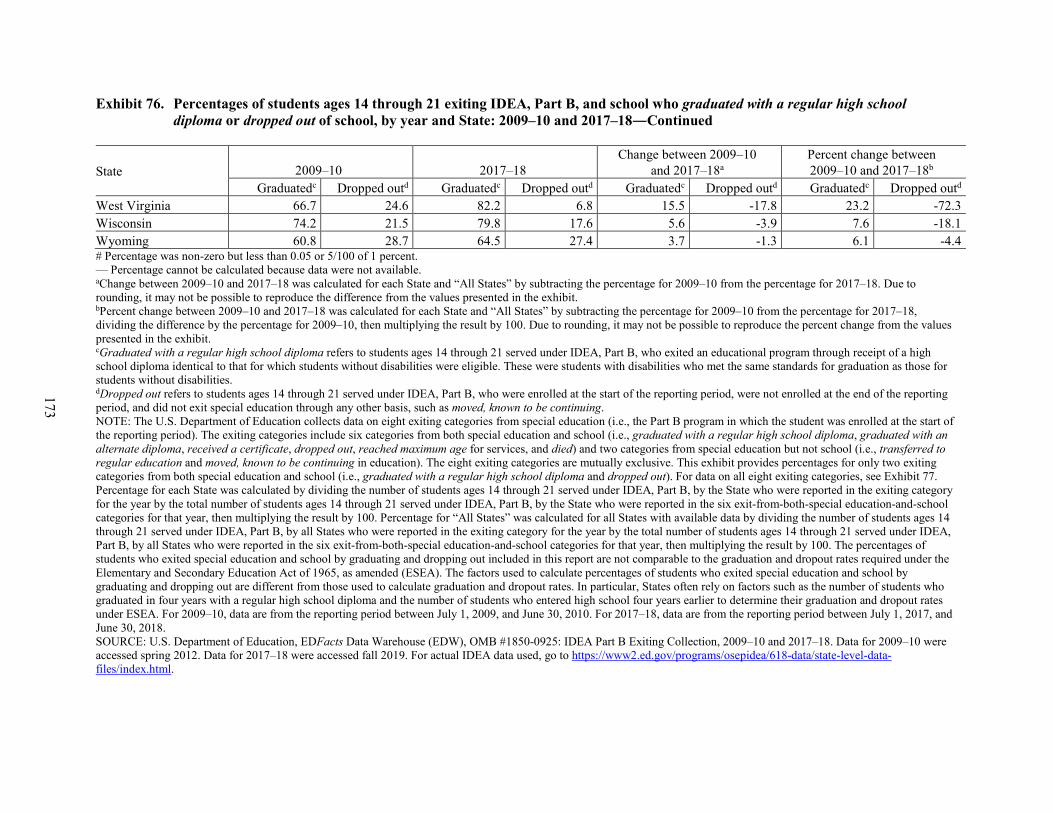
173
Exhibit 76. Percentages of students ages 14 through 21 exiting IDEA, Part B, and school who graduated with a regular high school diploma or dropped out of school, by year and State: 2009–10 and 2017–18―Continued
State 2009–10 2017–18 Change between 2009–10
and 2017–18a Percent change between 2009–10 and 2017–18b
Graduatedc Dropped outd Graduatedc Dropped outd Graduatedc Dropped outd Graduatedc Dropped outd West Virginia 66.7 24.6 82.2 6.8 15.5 -17.8 23.2 -72.3 Wisconsin 74.2 21.5 79.8 17.6 5.6 -3.9 7.6 -18.1 Wyoming 60.8 28.7 64.5 27.4 3.7 -1.3 6.1 -4.4 # Percentage was non-zero but less than 0.05 or 5/100 of 1 percent. — Percentage cannot be calculated because data were not available. aChange between 2009–10 and 2017–18 was calculated for each State and “All States” by subtracting the percentage for 2009–10 from the percentage for 2017–18. Due to rounding, it may not be possible to reproduce the difference from the values presented in the exhibit. bPercent change between 2009–10 and 2017–18 was calculated for each State and “All States” by subtracting the percentage for 2009–10 from the percentage for 2017–18, dividing the difference by the percentage for 2009–10, then multiplying the result by 100. Due to rounding, it may not be possible to reproduce the percent change from the values presented in the exhibit. cGraduated with a regular high school diploma refers to students ages 14 through 21 served under IDEA, Part B, who exited an educational program through receipt of a high school diploma identical to that for which students without disabilities were eligible. These were students with disabilities who met the same standards for graduation as those for students without disabilities. dDropped out refers to students ages 14 through 21 served under IDEA, Part B, who were enrolled at the start of the reporting period, were not enrolled at the end of the reporting period, and did not exit special education through any other basis, such as moved, known to be continuing. NOTE: The U.S. Department of Education collects data on eight exiting categories from special education (i.e., the Part B program in which the student was enrolled at the start of the reporting period). The exiting categories include six categories from both special education and school (i.e., graduated with a regular high school diploma, graduated with an alternate diploma, received a certificate, dropped out, reached maximum age for services, and died) and two categories from special education but not school (i.e., transferred to regular education and moved, known to be continuing in education). The eight exiting categories are mutually exclusive. This exhibit provides percentages for only two exiting categories from both special education and school (i.e., graduated with a regular high school diploma and dropped out). For data on all eight exiting categories, see Exhibit 77. Percentage for each State was calculated by dividing the number of students ages 14 through 21 served under IDEA, Part B, by the State who were reported in the exiting category for the year by the total number of students ages 14 through 21 served under IDEA, Part B, by the State who were reported in the six exit-from-both-special education-and-school categories for that year, then multiplying the result by 100. Percentage for “All States” was calculated for all States with available data by dividing the number of students ages 14 through 21 served under IDEA, Part B, by all States who were reported in the exiting category for the year by the total number of students ages 14 through 21 served under IDEA, Part B, by all States who were reported in the six exit-from-both-special education-and-school categories for that year, then multiplying the result by 100. The percentages of students who exited special education and school by graduating and dropping out included in this report are not comparable to the graduation and dropout rates required under the Elementary and Secondary Education Act of 1965, as amended (ESEA). The factors used to calculate percentages of students who exited special education and school by graduating and dropping out are different from those used to calculate graduation and dropout rates. In particular, States often rely on factors such as the number of students who graduated in four years with a regular high school diploma and the number of students who entered high school four years earlier to determine their graduation and dropout rates under ESEA. For 2009–10, data are from the reporting period between July 1, 2009, and June 30, 2010. For 2017–18, data are from the reporting period between July 1, 2017, and June 30, 2018. SOURCE: U.S. Department of Education, EDFacts Data Warehouse (EDW), OMB #1850-0925: IDEA Part B Exiting Collection, 2009–10 and 2017–18. Data for 2009–10 were accessed spring 2012. Data for 2017–18 were accessed fall 2019. For actual IDEA data used, go to https://www2.ed.gov/programs/osepidea/618-data/state-level-data-files/index.html.
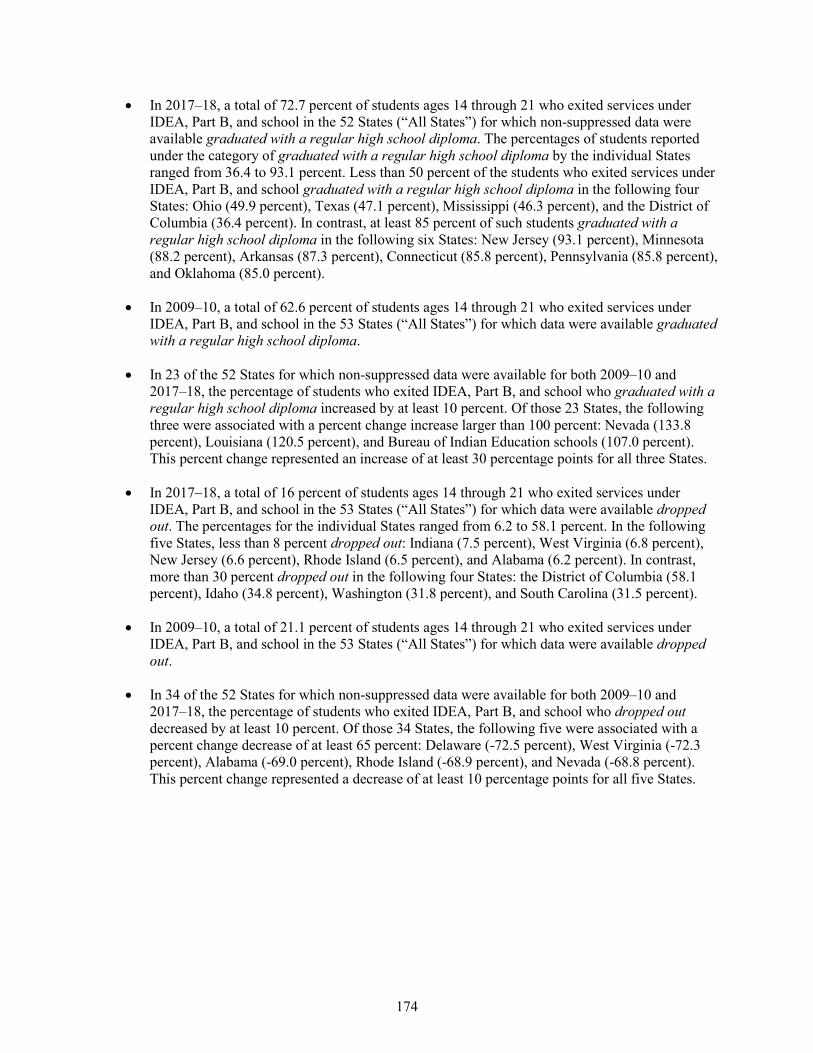
174
• In 2017–18, a total of 72.7 percent of students ages 14 through 21 who exited services under IDEA, Part B, and school in the 52 States (“All States”) for which non-suppressed data were available graduated with a regular high school diploma. The percentages of students reported under the category of graduated with a regular high school diploma by the individual States ranged from 36.4 to 93.1 percent. Less than 50 percent of the students who exited services under IDEA, Part B, and school graduated with a regular high school diploma in the following four States: Ohio (49.9 percent), Texas (47.1 percent), Mississippi (46.3 percent), and the District of Columbia (36.4 percent). In contrast, at least 85 percent of such students graduated with a regular high school diploma in the following six States: New Jersey (93.1 percent), Minnesota (88.2 percent), Arkansas (87.3 percent), Connecticut (85.8 percent), Pennsylvania (85.8 percent), and Oklahoma (85.0 percent).
• In 2009–10, a total of 62.6 percent of students ages 14 through 21 who exited services under IDEA, Part B, and school in the 53 States (“All States”) for which data were available graduated with a regular high school diploma.
• In 23 of the 52 States for which non-suppressed data were available for both 2009–10 and 2017–18, the percentage of students who exited IDEA, Part B, and school who graduated with a regular high school diploma increased by at least 10 percent. Of those 23 States, the following three were associated with a percent change increase larger than 100 percent: Nevada (133.8 percent), Louisiana (120.5 percent), and Bureau of Indian Education schools (107.0 percent). This percent change represented an increase of at least 30 percentage points for all three States.
• In 2017–18, a total of 16 percent of students ages 14 through 21 who exited services under IDEA, Part B, and school in the 53 States (“All States”) for which data were available dropped out. The percentages for the individual States ranged from 6.2 to 58.1 percent. In the following five States, less than 8 percent dropped out: Indiana (7.5 percent), West Virginia (6.8 percent), New Jersey (6.6 percent), Rhode Island (6.5 percent), and Alabama (6.2 percent). In contrast, more than 30 percent dropped out in the following four States: the District of Columbia (58.1 percent), Idaho (34.8 percent), Washington (31.8 percent), and South Carolina (31.5 percent).
• In 2009–10, a total of 21.1 percent of students ages 14 through 21 who exited services under IDEA, Part B, and school in the 53 States (“All States”) for which data were available dropped out.
• In 34 of the 52 States for which non-suppressed data were available for both 2009–10 and 2017–18, the percentage of students who exited IDEA, Part B, and school who dropped out decreased by at least 10 percent. Of those 34 States, the following five were associated with a percent change decrease of at least 65 percent: Delaware (-72.5 percent), West Virginia (-72.3 percent), Alabama (-69.0 percent), Rhode Island (-68.9 percent), and Nevada (-68.8 percent). This percent change represented a decrease of at least 10 percentage points for all five States.
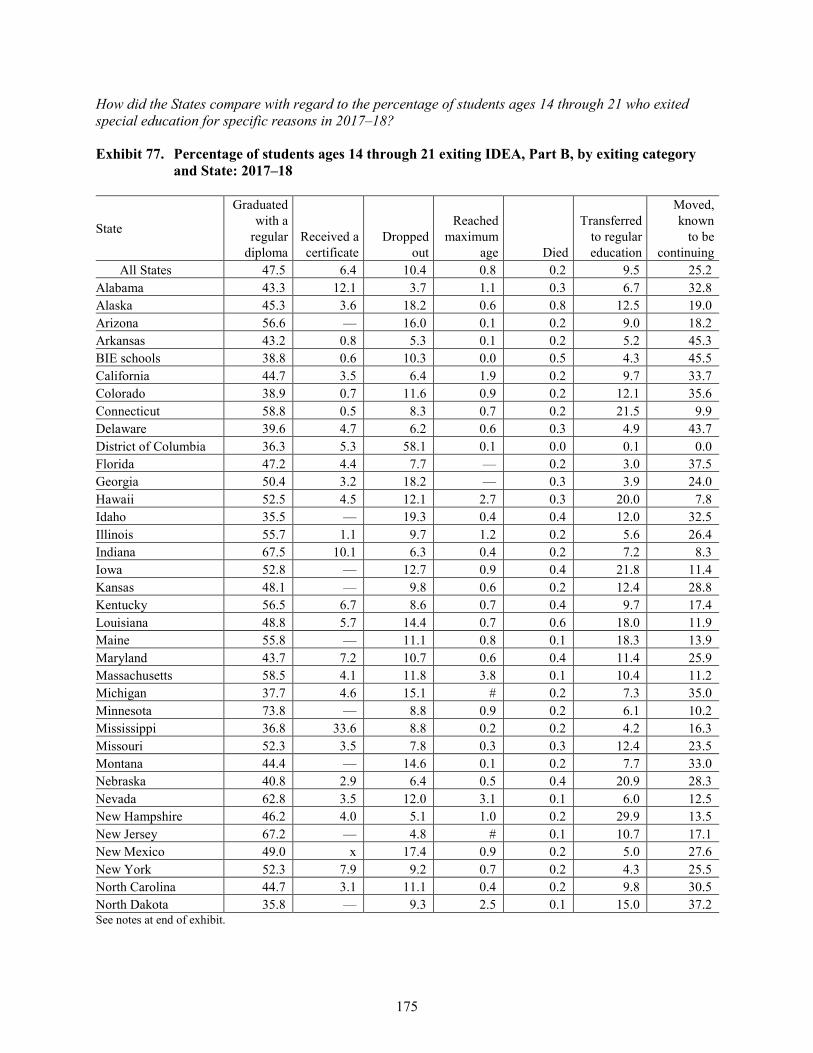
175
How did the States compare with regard to the percentage of students ages 14 through 21 who exited special education for specific reasons in 2017–18?
Exhibit 77. Percentage of students ages 14 through 21 exiting IDEA, Part B, by exiting category and State: 2017–18
State
Graduated with a
regular diploma
Received a certificate
Dropped out
Reached maximum
age Died
Transferred to regular education
Moved, known to be
continuing All States 47.5 6.4 10.4 0.8 0.2 9.5 25.2
Alabama 43.3 12.1 3.7 1.1 0.3 6.7 32.8 Alaska 45.3 3.6 18.2 0.6 0.8 12.5 19.0 Arizona 56.6 — 16.0 0.1 0.2 9.0 18.2 Arkansas 43.2 0.8 5.3 0.1 0.2 5.2 45.3 BIE schools 38.8 0.6 10.3 0.0 0.5 4.3 45.5 California 44.7 3.5 6.4 1.9 0.2 9.7 33.7 Colorado 38.9 0.7 11.6 0.9 0.2 12.1 35.6 Connecticut 58.8 0.5 8.3 0.7 0.2 21.5 9.9 Delaware 39.6 4.7 6.2 0.6 0.3 4.9 43.7 District of Columbia 36.3 5.3 58.1 0.1 0.0 0.1 0.0 Florida 47.2 4.4 7.7 — 0.2 3.0 37.5 Georgia 50.4 3.2 18.2 — 0.3 3.9 24.0 Hawaii 52.5 4.5 12.1 2.7 0.3 20.0 7.8 Idaho 35.5 — 19.3 0.4 0.4 12.0 32.5 Illinois 55.7 1.1 9.7 1.2 0.2 5.6 26.4 Indiana 67.5 10.1 6.3 0.4 0.2 7.2 8.3 Iowa 52.8 — 12.7 0.9 0.4 21.8 11.4 Kansas 48.1 — 9.8 0.6 0.2 12.4 28.8 Kentucky 56.5 6.7 8.6 0.7 0.4 9.7 17.4 Louisiana 48.8 5.7 14.4 0.7 0.6 18.0 11.9 Maine 55.8 — 11.1 0.8 0.1 18.3 13.9 Maryland 43.7 7.2 10.7 0.6 0.4 11.4 25.9 Massachusetts 58.5 4.1 11.8 3.8 0.1 10.4 11.2 Michigan 37.7 4.6 15.1 # 0.2 7.3 35.0 Minnesota 73.8 — 8.8 0.9 0.2 6.1 10.2 Mississippi 36.8 33.6 8.8 0.2 0.2 4.2 16.3 Missouri 52.3 3.5 7.8 0.3 0.3 12.4 23.5 Montana 44.4 — 14.6 0.1 0.2 7.7 33.0 Nebraska 40.8 2.9 6.4 0.5 0.4 20.9 28.3 Nevada 62.8 3.5 12.0 3.1 0.1 6.0 12.5 New Hampshire 46.2 4.0 5.1 1.0 0.2 29.9 13.5 New Jersey 67.2 — 4.8 # 0.1 10.7 17.1 New Mexico 49.0 x 17.4 0.9 0.2 5.0 27.6 New York 52.3 7.9 9.2 0.7 0.2 4.3 25.5 North Carolina 44.7 3.1 11.1 0.4 0.2 9.8 30.5 North Dakota 35.8 — 9.3 2.5 0.1 15.0 37.2 See notes at end of exhibit.
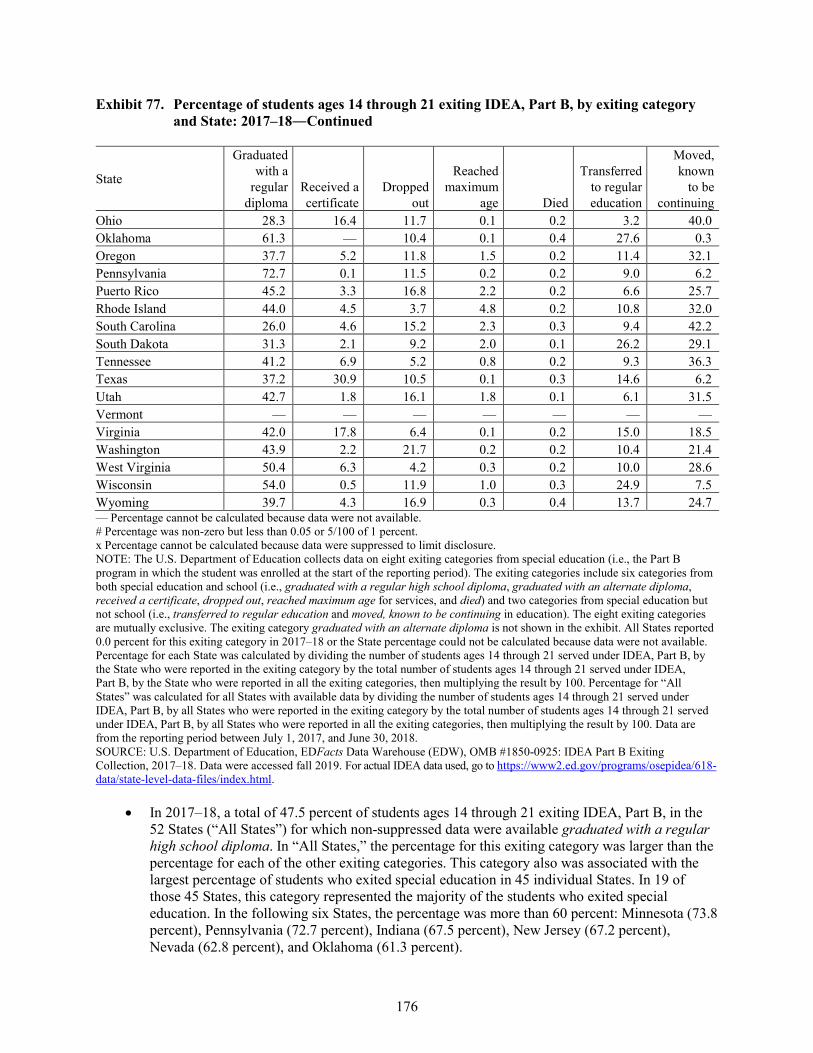
176
Exhibit 77. Percentage of students ages 14 through 21 exiting IDEA, Part B, by exiting category and State: 2017–18―Continued
State
Graduated with a
regular diploma
Received a certificate
Dropped out
Reached maximum
age Died
Transferred to regular education
Moved, known to be
continuing Ohio 28.3 16.4 11.7 0.1 0.2 3.2 40.0 Oklahoma 61.3 — 10.4 0.1 0.4 27.6 0.3 Oregon 37.7 5.2 11.8 1.5 0.2 11.4 32.1 Pennsylvania 72.7 0.1 11.5 0.2 0.2 9.0 6.2 Puerto Rico 45.2 3.3 16.8 2.2 0.2 6.6 25.7 Rhode Island 44.0 4.5 3.7 4.8 0.2 10.8 32.0 South Carolina 26.0 4.6 15.2 2.3 0.3 9.4 42.2 South Dakota 31.3 2.1 9.2 2.0 0.1 26.2 29.1 Tennessee 41.2 6.9 5.2 0.8 0.2 9.3 36.3 Texas 37.2 30.9 10.5 0.1 0.3 14.6 6.2 Utah 42.7 1.8 16.1 1.8 0.1 6.1 31.5 Vermont — — — — — — — Virginia 42.0 17.8 6.4 0.1 0.2 15.0 18.5 Washington 43.9 2.2 21.7 0.2 0.2 10.4 21.4 West Virginia 50.4 6.3 4.2 0.3 0.2 10.0 28.6 Wisconsin 54.0 0.5 11.9 1.0 0.3 24.9 7.5 Wyoming 39.7 4.3 16.9 0.3 0.4 13.7 24.7 — Percentage cannot be calculated because data were not available. # Percentage was non-zero but less than 0.05 or 5/100 of 1 percent. x Percentage cannot be calculated because data were suppressed to limit disclosure. NOTE: The U.S. Department of Education collects data on eight exiting categories from special education (i.e., the Part B program in which the student was enrolled at the start of the reporting period). The exiting categories include six categories from both special education and school (i.e., graduated with a regular high school diploma, graduated with an alternate diploma, received a certificate, dropped out, reached maximum age for services, and died) and two categories from special education but not school (i.e., transferred to regular education and moved, known to be continuing in education). The eight exiting categories are mutually exclusive. The exiting category graduated with an alternate diploma is not shown in the exhibit. All States reported 0.0 percent for this exiting category in 2017–18 or the State percentage could not be calculated because data were not available. Percentage for each State was calculated by dividing the number of students ages 14 through 21 served under IDEA, Part B, by the State who were reported in the exiting category by the total number of students ages 14 through 21 served under IDEA, Part B, by the State who were reported in all the exiting categories, then multiplying the result by 100. Percentage for “All States” was calculated for all States with available data by dividing the number of students ages 14 through 21 served under IDEA, Part B, by all States who were reported in the exiting category by the total number of students ages 14 through 21 served under IDEA, Part B, by all States who were reported in all the exiting categories, then multiplying the result by 100. Data are from the reporting period between July 1, 2017, and June 30, 2018. SOURCE: U.S. Department of Education, EDFacts Data Warehouse (EDW), OMB #1850-0925: IDEA Part B Exiting Collection, 2017–18. Data were accessed fall 2019. For actual IDEA data used, go to https://www2.ed.gov/programs/osepidea/618-data/state-level-data-files/index.html.
• In 2017–18, a total of 47.5 percent of students ages 14 through 21 exiting IDEA, Part B, in the 52 States (“All States”) for which non-suppressed data were available graduated with a regular high school diploma. In “All States,” the percentage for this exiting category was larger than the percentage for each of the other exiting categories. This category also was associated with the largest percentage of students who exited special education in 45 individual States. In 19 of those 45 States, this category represented the majority of the students who exited special education. In the following six States, the percentage was more than 60 percent: Minnesota (73.8 percent), Pennsylvania (72.7 percent), Indiana (67.5 percent), New Jersey (67.2 percent), Nevada (62.8 percent), and Oklahoma (61.3 percent).
177
• The second most prevalent exiting category, accounting for 25.2 percent of students ages 14 through 21 who exited special education in “All States” in 2017–18, was moved, known to be continuing in education. In six of the 52 individual States, this category was associated with the largest percentage of students who exited special education. More than 40 percent of the students who exited special education were associated with this exiting category in the following four States: Bureau of Indian Education schools (45.5 percent), Arkansas (45.3 percent), Delaware (43.7 percent), and South Carolina (42.2 percent).
• The exiting categories received a certificate and transferred to regular education did not represent the largest percentage of the students ages 14 through 21 served under IDEA, Part B, who exited special education in 2017–18 in any of the 52 States.
• The exiting category dropped out represented the largest percentage of the students ages 14 through 21 served under IDEA, Part B, who exited special education in 2017–18 in one State: the District of Columbia (58.1 percent).
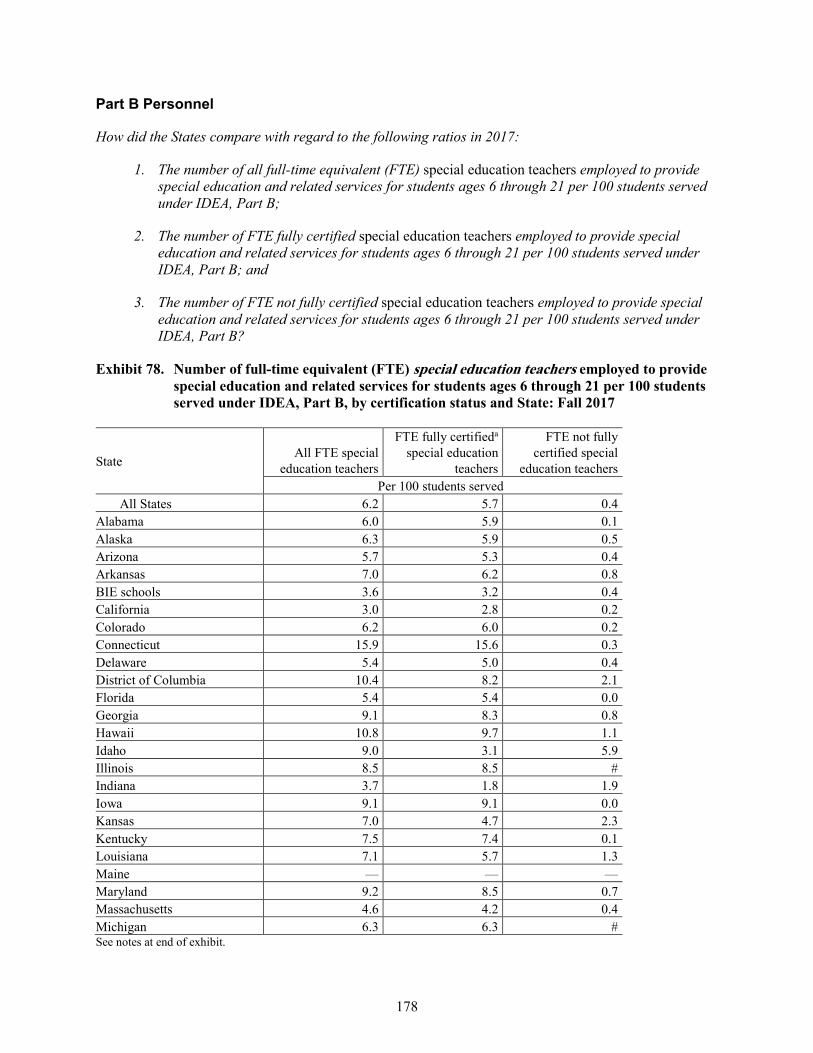
178
Part B Personnel
How did the States compare with regard to the following ratios in 2017:
1. The number of all full-time equivalent (FTE) special education teachers employed to provide special education and related services for students ages 6 through 21 per 100 students served under IDEA, Part B;
2. The number of FTE fully certified special education teachers employed to provide special education and related services for students ages 6 through 21 per 100 students served under IDEA, Part B; and
3. The number of FTE not fully certified special education teachers employed to provide special education and related services for students ages 6 through 21 per 100 students served under IDEA, Part B?
Exhibit 78. Number of full-time equivalent (FTE) special education teachers employed to provide special education and related services for students ages 6 through 21 per 100 students served under IDEA, Part B, by certification status and State: Fall 2017
State All FTE special
education teachers
FTE fully certifieda
special education teachers
FTE not fully certified special
education teachers Per 100 students served
All States 6.2 5.7 0.4 Alabama 6.0 5.9 0.1 Alaska 6.3 5.9 0.5 Arizona 5.7 5.3 0.4 Arkansas 7.0 6.2 0.8 BIE schools 3.6 3.2 0.4 California 3.0 2.8 0.2 Colorado 6.2 6.0 0.2 Connecticut 15.9 15.6 0.3 Delaware 5.4 5.0 0.4 District of Columbia 10.4 8.2 2.1 Florida 5.4 5.4 0.0 Georgia 9.1 8.3 0.8 Hawaii 10.8 9.7 1.1 Idaho 9.0 3.1 5.9 Illinois 8.5 8.5 # Indiana 3.7 1.8 1.9 Iowa 9.1 9.1 0.0 Kansas 7.0 4.7 2.3 Kentucky 7.5 7.4 0.1 Louisiana 7.1 5.7 1.3 Maine — — — Maryland 9.2 8.5 0.7 Massachusetts 4.6 4.2 0.4 Michigan 6.3 6.3 # See notes at end of exhibit.
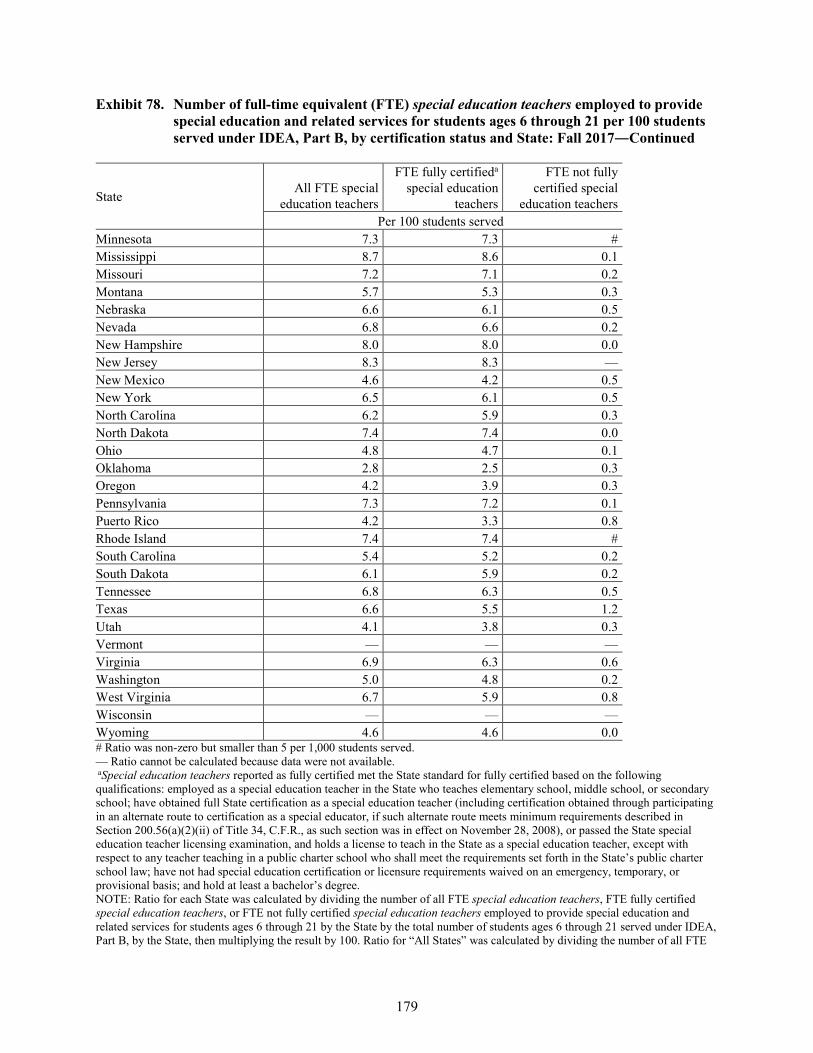
179
Exhibit 78. Number of full-time equivalent (FTE) special education teachers employed to provide special education and related services for students ages 6 through 21 per 100 students served under IDEA, Part B, by certification status and State: Fall 2017―Continued
State All FTE special
education teachers
FTE fully certifieda
special education teachers
FTE not fully certified special
education teachers Per 100 students served
Minnesota 7.3 7.3 # Mississippi 8.7 8.6 0.1 Missouri 7.2 7.1 0.2 Montana 5.7 5.3 0.3 Nebraska 6.6 6.1 0.5 Nevada 6.8 6.6 0.2 New Hampshire 8.0 8.0 0.0 New Jersey 8.3 8.3 — New Mexico 4.6 4.2 0.5 New York 6.5 6.1 0.5 North Carolina 6.2 5.9 0.3 North Dakota 7.4 7.4 0.0 Ohio 4.8 4.7 0.1 Oklahoma 2.8 2.5 0.3 Oregon 4.2 3.9 0.3 Pennsylvania 7.3 7.2 0.1 Puerto Rico 4.2 3.3 0.8 Rhode Island 7.4 7.4 # South Carolina 5.4 5.2 0.2 South Dakota 6.1 5.9 0.2 Tennessee 6.8 6.3 0.5 Texas 6.6 5.5 1.2 Utah 4.1 3.8 0.3 Vermont — — — Virginia 6.9 6.3 0.6 Washington 5.0 4.8 0.2 West Virginia 6.7 5.9 0.8 Wisconsin — — — Wyoming 4.6 4.6 0.0 # Ratio was non-zero but smaller than 5 per 1,000 students served. — Ratio cannot be calculated because data were not available. aSpecial education teachers reported as fully certified met the State standard for fully certified based on the following qualifications: employed as a special education teacher in the State who teaches elementary school, middle school, or secondary school; have obtained full State certification as a special education teacher (including certification obtained through participating in an alternate route to certification as a special educator, if such alternate route meets minimum requirements described in Section 200.56(a)(2)(ii) of Title 34, C.F.R., as such section was in effect on November 28, 2008), or passed the State special education teacher licensing examination, and holds a license to teach in the State as a special education teacher, except with respect to any teacher teaching in a public charter school who shall meet the requirements set forth in the State’s public charter school law; have not had special education certification or licensure requirements waived on an emergency, temporary, or provisional basis; and hold at least a bachelor’s degree. NOTE: Ratio for each State was calculated by dividing the number of all FTE special education teachers, FTE fully certified special education teachers, or FTE not fully certified special education teachers employed to provide special education and related services for students ages 6 through 21 by the State by the total number of students ages 6 through 21 served under IDEA, Part B, by the State, then multiplying the result by 100. Ratio for “All States” was calculated by dividing the number of all FTE
180
• In 2017, there were 6.2 FTE special education teachers (including those who were fully certified and those who were not fully certified) employed by the 50 States (“All States”) for which data were available per 100 students ages 6 through 21 served under IDEA, Part B. A ratio of 9 or more FTE special education teachers per 100 students served was found for the following seven States: Connecticut (15.9 FTEs per 100 students), Hawaii (10.8 FTEs per 100 students), the District of Columbia (10.4 FTEs per 100 students), Maryland (9.2 FTEs per 100 students), Georgia (9.1 FTEs per 100 students), Iowa (9.1 FTEs per 100 students), and Idaho (9.0 FTEs per 100 students). In contrast, a ratio smaller than 4 FTE special education teachers per 100 students served was found for the following four States: Indiana (3.7 FTEs per 100 students), Bureau of Indian Education schools (3.6 FTEs per 100 students), California (3.0 FTEs per 100 students), and Oklahoma (2.8 FTEs per 100 students).
• In 2017, there were 5.7 FTE fully certified special education teachers employed by the 50 States (“All States”) for which data were available per 100 students ages 6 through 21 served under IDEA, Part B. A ratio larger than 9 fully certified FTE special education teachers per 100 students served was found for the following three States: Connecticut (15.6 FTEs per 100 students), Hawaii (9.7 FTEs per 100 students), and Iowa (9.1 FTEs per 100 students). In contrast, a ratio smaller than 3 FTE fully certified special education teachers per 100 students served was found for the following three States: California (2.8 FTEs per 100 students), Oklahoma (2.5 FTEs per 100 students), and Indiana (1.8 FTEs per 100 students).
• In 2017, there were 0.4 FTE not fully certified special education teachers employed by the 49 States (“All States”) for which data were available per 100 students ages 6 through 21 served under IDEA, Part B. The ratio was smaller than 2 FTE not fully certified special education teachers per 100 students served for all but the following three States: Idaho (5.9 FTEs per 100 students), Kansas (2.3 FTEs per 100 students), and the District of Columbia (2.1 FTEs per 100 students).
special education teachers, FTE fully certified special education teachers, or FTE not fully certified special education teachers employed to provide special education and related services for students ages 6 through 21 by all States by the total number of students ages 6 through 21 served under IDEA, Part B, by all States, then multiplying the result by 100. SOURCE: U.S. Department of Education, EDFacts Data Warehouse (EDW), OMB #1850-0925: IDEA Part B Personnel Collection, 2017. Data for Vermont were not available. Data were accessed fall 2019. U.S. Department of Education, EDFacts Data Warehouse (EDW), OMB #1850-0925: IDEA Part B Child Count and Educational Environments Collection, 2017. Data for Maine, Vermont, and Wisconsin were not available. Data were accessed fall 2018. For actual IDEA data used, go to https://www2.ed.gov/programs/osepidea/618-data/state-level-data-files/index.html.
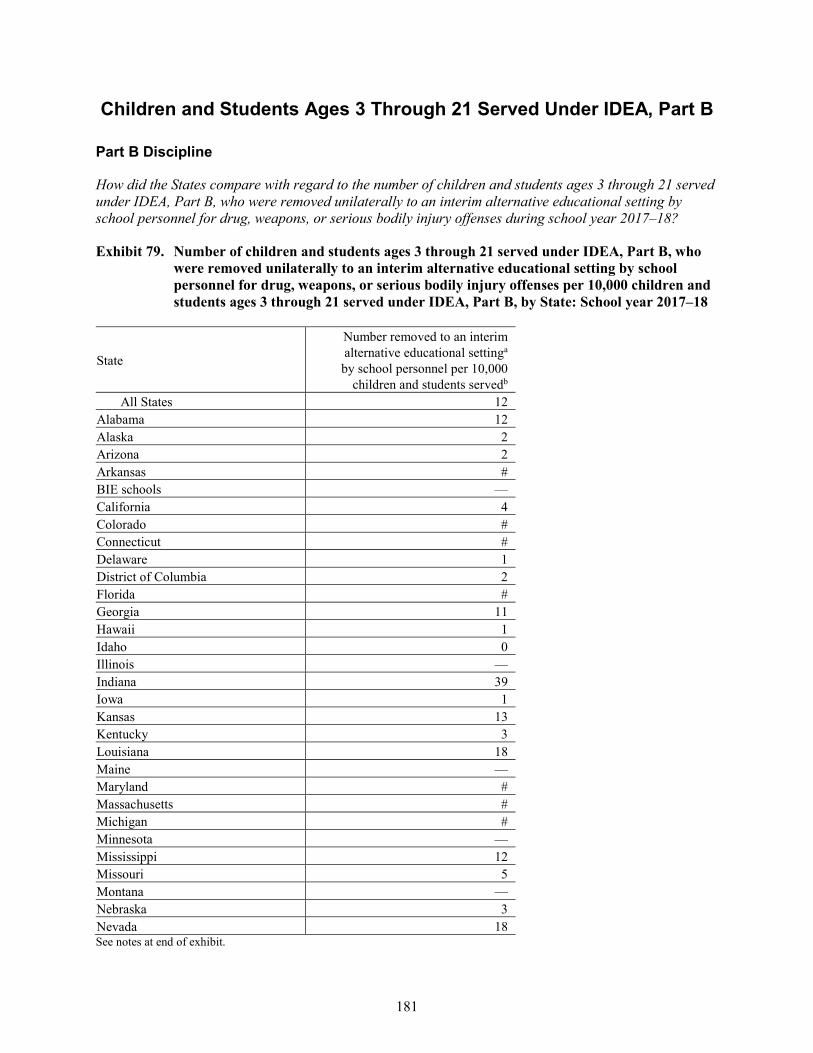
181
Children and Students Ages 3 Through 21 Served Under IDEA, Part B
Part B Discipline
How did the States compare with regard to the number of children and students ages 3 through 21 served under IDEA, Part B, who were removed unilaterally to an interim alternative educational setting by school personnel for drug, weapons, or serious bodily injury offenses during school year 2017–18?
Exhibit 79. Number of children and students ages 3 through 21 served under IDEA, Part B, who were removed unilaterally to an interim alternative educational setting by school personnel for drug, weapons, or serious bodily injury offenses per 10,000 children and students ages 3 through 21 served under IDEA, Part B, by State: School year 2017–18
State
Number removed to an interim alternative educational settinga by school personnel per 10,000
children and students servedb All States 12
Alabama 12 Alaska 2 Arizona 2 Arkansas # BIE schools — California 4 Colorado # Connecticut # Delaware 1 District of Columbia 2 Florida # Georgia 11 Hawaii 1 Idaho 0 Illinois — Indiana 39 Iowa 1 Kansas 13 Kentucky 3 Louisiana 18 Maine — Maryland # Massachusetts # Michigan # Minnesota — Mississippi 12 Missouri 5 Montana — Nebraska 3 Nevada 18 See notes at end of exhibit.
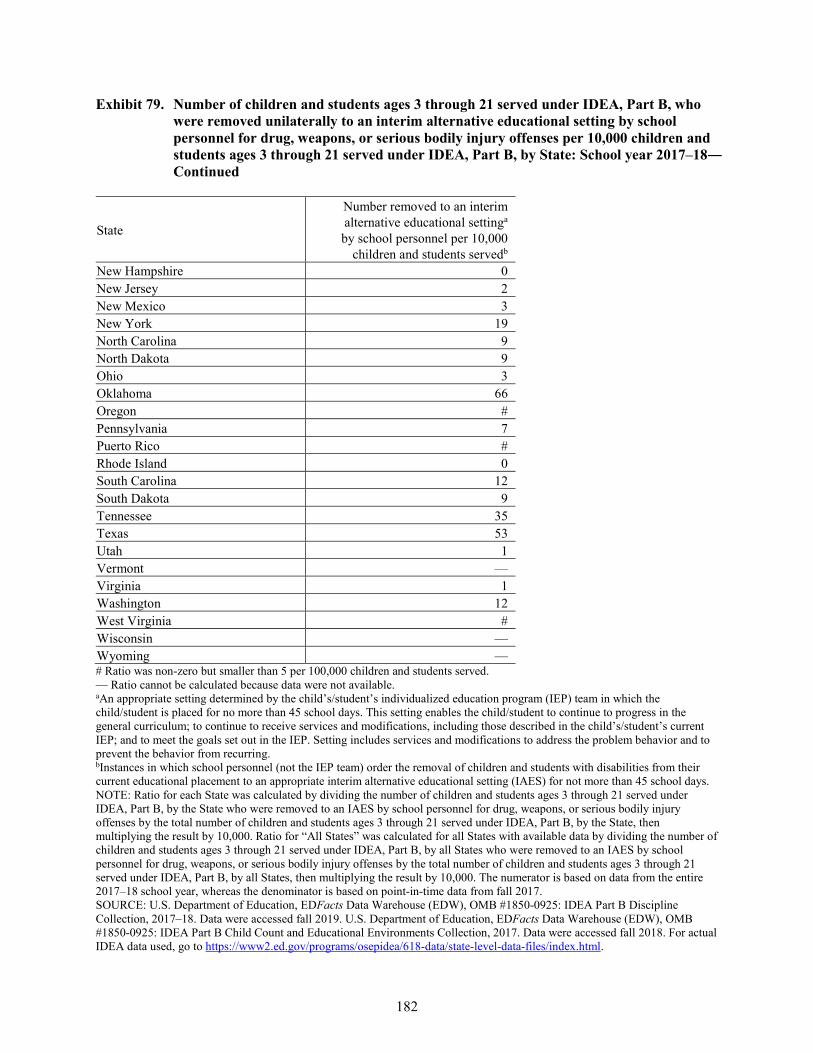
182
Exhibit 79. Number of children and students ages 3 through 21 served under IDEA, Part B, who were removed unilaterally to an interim alternative educational setting by school personnel for drug, weapons, or serious bodily injury offenses per 10,000 children and students ages 3 through 21 served under IDEA, Part B, by State: School year 2017–18― Continued
State
Number removed to an interim alternative educational settinga by school personnel per 10,000
children and students servedb New Hampshire 0 New Jersey 2 New Mexico 3 New York 19 North Carolina 9 North Dakota 9 Ohio 3 Oklahoma 66 Oregon # Pennsylvania 7 Puerto Rico # Rhode Island 0 South Carolina 12 South Dakota 9 Tennessee 35 Texas 53 Utah 1 Vermont — Virginia 1 Washington 12 West Virginia # Wisconsin — Wyoming — # Ratio was non-zero but smaller than 5 per 100,000 children and students served. — Ratio cannot be calculated because data were not available. aAn appropriate setting determined by the child’s/student’s individualized education program (IEP) team in which the child/student is placed for no more than 45 school days. This setting enables the child/student to continue to progress in the general curriculum; to continue to receive services and modifications, including those described in the child’s/student’s current IEP; and to meet the goals set out in the IEP. Setting includes services and modifications to address the problem behavior and to prevent the behavior from recurring. bInstances in which school personnel (not the IEP team) order the removal of children and students with disabilities from their current educational placement to an appropriate interim alternative educational setting (IAES) for not more than 45 school days. NOTE: Ratio for each State was calculated by dividing the number of children and students ages 3 through 21 served under IDEA, Part B, by the State who were removed to an IAES by school personnel for drug, weapons, or serious bodily injury offenses by the total number of children and students ages 3 through 21 served under IDEA, Part B, by the State, then multiplying the result by 10,000. Ratio for “All States” was calculated for all States with available data by dividing the number of children and students ages 3 through 21 served under IDEA, Part B, by all States who were removed to an IAES by school personnel for drug, weapons, or serious bodily injury offenses by the total number of children and students ages 3 through 21 served under IDEA, Part B, by all States, then multiplying the result by 10,000. The numerator is based on data from the entire 2017–18 school year, whereas the denominator is based on point-in-time data from fall 2017. SOURCE: U.S. Department of Education, EDFacts Data Warehouse (EDW), OMB #1850-0925: IDEA Part B Discipline Collection, 2017–18. Data were accessed fall 2019. U.S. Department of Education, EDFacts Data Warehouse (EDW), OMB #1850-0925: IDEA Part B Child Count and Educational Environments Collection, 2017. Data were accessed fall 2018. For actual IDEA data used, go to https://www2.ed.gov/programs/osepidea/618-data/state-level-data-files/index.html.
183
• For every 10,000 children and students ages 3 through 21 served under IDEA, Part B, in 2017 by the 45 States (“All States”) for which data were available, 12 children and students experienced a unilateral removal to an interim alternative educational setting by school personnel (not the IEP team) for drugs, weapons, or serious bodily injury in school year 2017–18.
• The numbers of children and students ages 3 through 21 served under IDEA, Part B, who experienced a unilateral removal to an interim alternative educational setting by school personnel (not the IEP team) for drugs, weapons, or serious bodily injury during school year 2017–18 ranged from 0 to 66 per 10,000 children and students served in the 45 individual States. More than 30 for every 10,000 children and students served were removed to an interim alternative educational setting by school personnel for such offenses in the following four States: Oklahoma (66 per 10,000 children and students), Texas (53 per 10,000 children and students), Indiana (39 per 10,000 children and students), and Tennessee (35 per 10,000 children and students). In contrast, no more than one child or student for every 10,000 children and students served was removed to an interim alternative educational setting by school personnel for these offenses in 18 States.
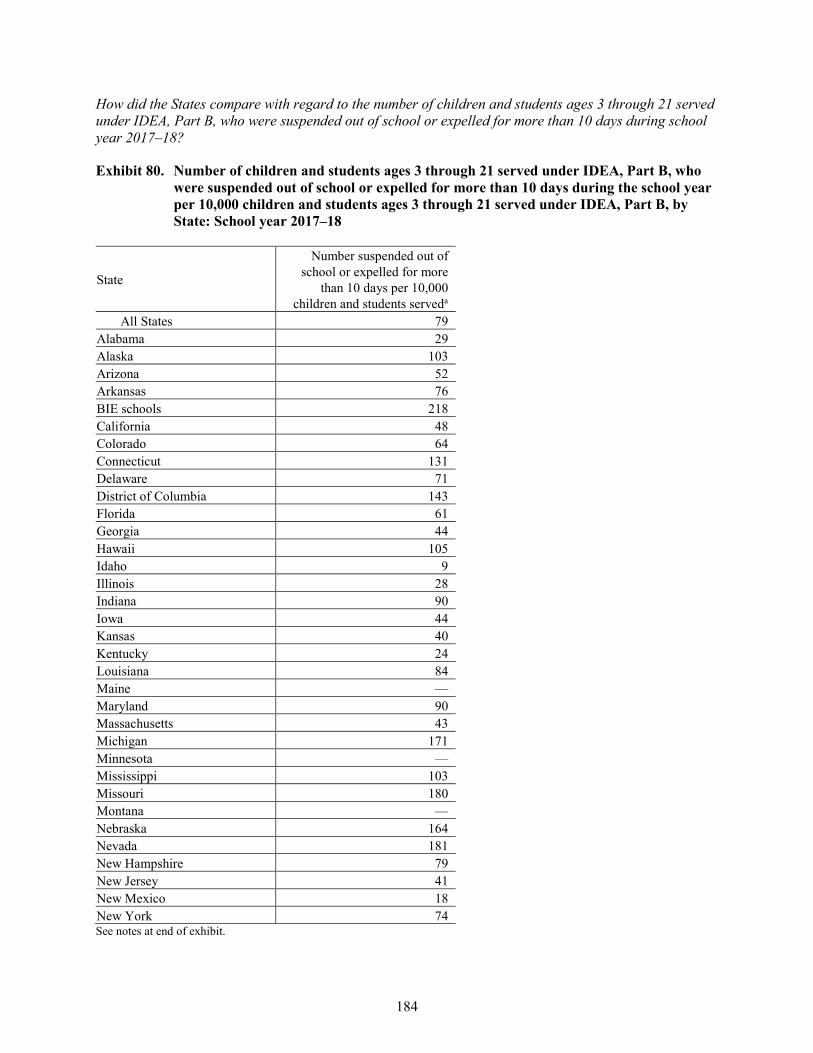
184
How did the States compare with regard to the number of children and students ages 3 through 21 served under IDEA, Part B, who were suspended out of school or expelled for more than 10 days during school year 2017–18?
Exhibit 80. Number of children and students ages 3 through 21 served under IDEA, Part B, who were suspended out of school or expelled for more than 10 days during the school year per 10,000 children and students ages 3 through 21 served under IDEA, Part B, by State: School year 2017–18
State
Number suspended out of school or expelled for more
than 10 days per 10,000 children and students serveda
All States 79 Alabama 29 Alaska 103 Arizona 52 Arkansas 76 BIE schools 218 California 48 Colorado 64 Connecticut 131 Delaware 71 District of Columbia 143 Florida 61 Georgia 44 Hawaii 105 Idaho 9 Illinois 28 Indiana 90 Iowa 44 Kansas 40 Kentucky 24 Louisiana 84 Maine — Maryland 90 Massachusetts 43 Michigan 171 Minnesota — Mississippi 103 Missouri 180 Montana — Nebraska 164 Nevada 181 New Hampshire 79 New Jersey 41 New Mexico 18 New York 74 See notes at end of exhibit.
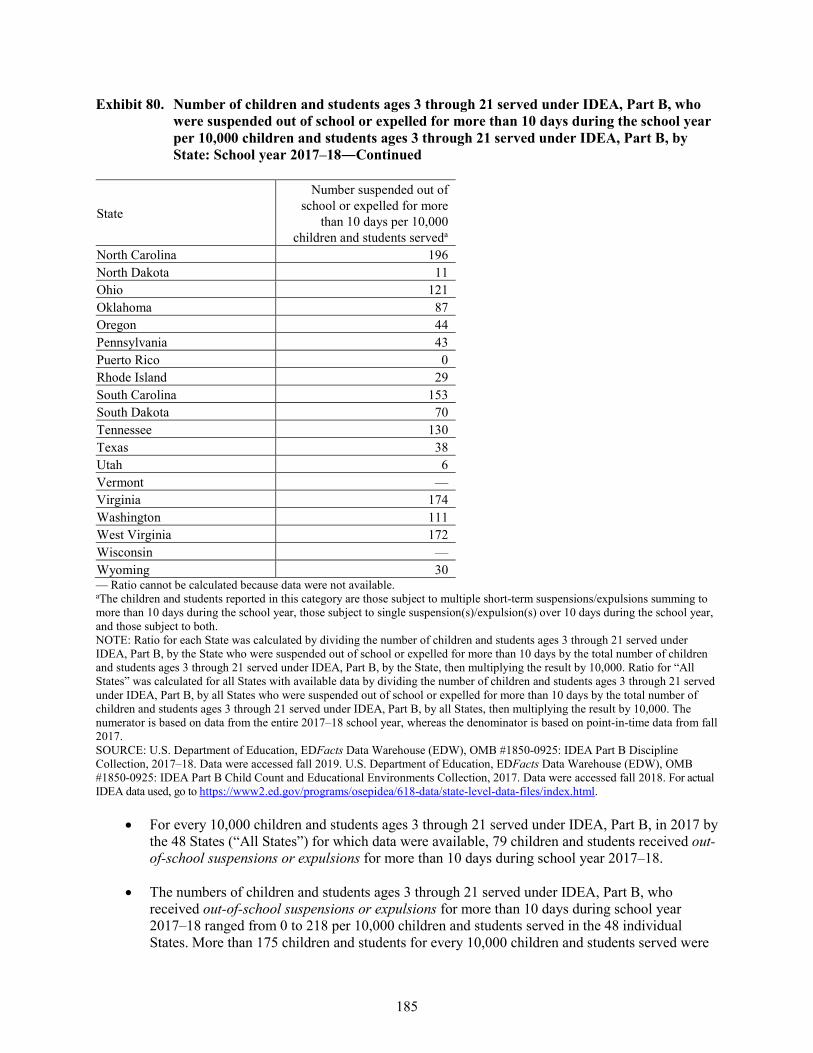
185
Exhibit 80. Number of children and students ages 3 through 21 served under IDEA, Part B, who were suspended out of school or expelled for more than 10 days during the school year per 10,000 children and students ages 3 through 21 served under IDEA, Part B, by State: School year 2017–18―Continued
State
Number suspended out of school or expelled for more
than 10 days per 10,000 children and students serveda
North Carolina 196 North Dakota 11 Ohio 121 Oklahoma 87 Oregon 44 Pennsylvania 43 Puerto Rico 0 Rhode Island 29 South Carolina 153 South Dakota 70 Tennessee 130 Texas 38 Utah 6 Vermont — Virginia 174 Washington 111 West Virginia 172 Wisconsin — Wyoming 30 — Ratio cannot be calculated because data were not available. aThe children and students reported in this category are those subject to multiple short-term suspensions/expulsions summing to more than 10 days during the school year, those subject to single suspension(s)/expulsion(s) over 10 days during the school year, and those subject to both. NOTE: Ratio for each State was calculated by dividing the number of children and students ages 3 through 21 served under IDEA, Part B, by the State who were suspended out of school or expelled for more than 10 days by the total number of children and students ages 3 through 21 served under IDEA, Part B, by the State, then multiplying the result by 10,000. Ratio for “All States” was calculated for all States with available data by dividing the number of children and students ages 3 through 21 served under IDEA, Part B, by all States who were suspended out of school or expelled for more than 10 days by the total number of children and students ages 3 through 21 served under IDEA, Part B, by all States, then multiplying the result by 10,000. The numerator is based on data from the entire 2017–18 school year, whereas the denominator is based on point-in-time data from fall 2017. SOURCE: U.S. Department of Education, EDFacts Data Warehouse (EDW), OMB #1850-0925: IDEA Part B Discipline Collection, 2017–18. Data were accessed fall 2019. U.S. Department of Education, EDFacts Data Warehouse (EDW), OMB #1850-0925: IDEA Part B Child Count and Educational Environments Collection, 2017. Data were accessed fall 2018. For actual IDEA data used, go to https://www2.ed.gov/programs/osepidea/618-data/state-level-data-files/index.html.
• For every 10,000 children and students ages 3 through 21 served under IDEA, Part B, in 2017 by the 48 States (“All States”) for which data were available, 79 children and students received out-of-school suspensions or expulsions for more than 10 days during school year 2017–18.
• The numbers of children and students ages 3 through 21 served under IDEA, Part B, who received out-of-school suspensions or expulsions for more than 10 days during school year 2017–18 ranged from 0 to 218 per 10,000 children and students served in the 48 individual States. More than 175 children and students for every 10,000 children and students served were
186
suspended out of school or expelled for more than 10 days during school year 2017–18 in the following four States: Bureau of Indian Education schools (218 per 10,000 children or students), North Carolina (196 per 10,000 children and students), Nevada (181 per 10,000 children and students), and Missouri (180 per 10,000 children and students). In contrast, 10 or fewer children and students for every 10,000 children and students served received out-of-school suspensions or expulsions for more than 10 days in the following three States: Idaho (9 per 10,000 children and students), Utah (6 per 10,000 children and students), and Puerto Rico (0 per 10,000 children and students).
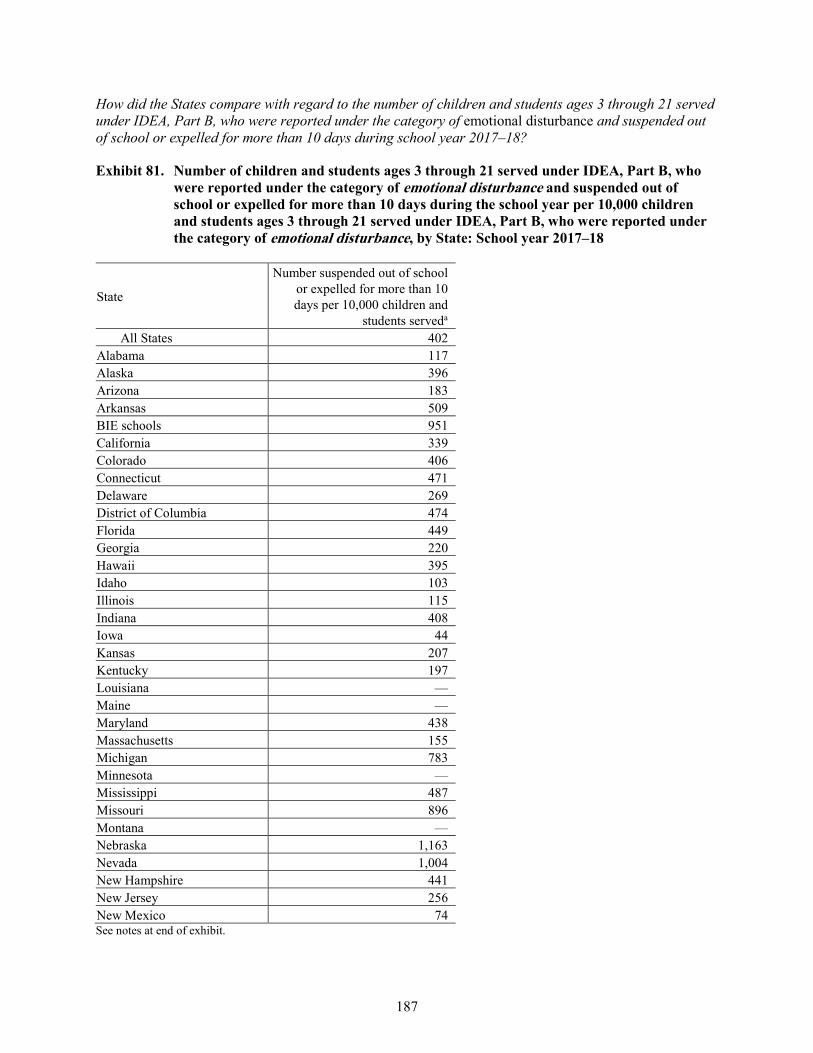
187
How did the States compare with regard to the number of children and students ages 3 through 21 served under IDEA, Part B, who were reported under the category of emotional disturbance and suspended out of school or expelled for more than 10 days during school year 2017–18?
Exhibit 81. Number of children and students ages 3 through 21 served under IDEA, Part B, who were reported under the category of emotional disturbance and suspended out of school or expelled for more than 10 days during the school year per 10,000 children and students ages 3 through 21 served under IDEA, Part B, who were reported under the category of emotional disturbance, by State: School year 2017–18
State
Number suspended out of school or expelled for more than 10 days per 10,000 children and
students serveda All States 402
Alabama 117 Alaska 396 Arizona 183 Arkansas 509 BIE schools 951 California 339 Colorado 406 Connecticut 471 Delaware 269 District of Columbia 474 Florida 449 Georgia 220 Hawaii 395 Idaho 103 Illinois 115 Indiana 408 Iowa 44 Kansas 207 Kentucky 197 Louisiana — Maine — Maryland 438 Massachusetts 155 Michigan 783 Minnesota — Mississippi 487 Missouri 896 Montana — Nebraska 1,163 Nevada 1,004 New Hampshire 441 New Jersey 256 New Mexico 74 See notes at end of exhibit.
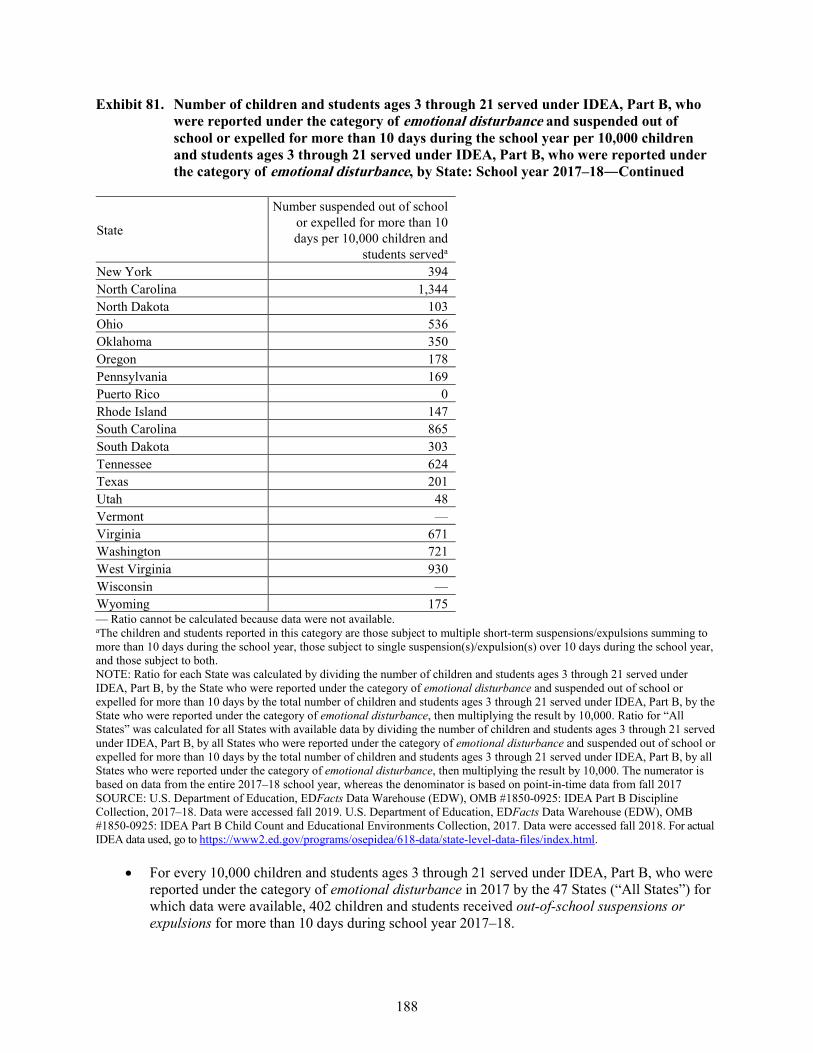
188
Exhibit 81. Number of children and students ages 3 through 21 served under IDEA, Part B, who were reported under the category of emotional disturbance and suspended out of school or expelled for more than 10 days during the school year per 10,000 children and students ages 3 through 21 served under IDEA, Part B, who were reported under the category of emotional disturbance, by State: School year 2017–18―Continued
State
Number suspended out of school or expelled for more than 10 days per 10,000 children and
students serveda New York 394 North Carolina 1,344 North Dakota 103 Ohio 536 Oklahoma 350 Oregon 178 Pennsylvania 169 Puerto Rico 0 Rhode Island 147 South Carolina 865 South Dakota 303 Tennessee 624 Texas 201 Utah 48 Vermont — Virginia 671 Washington 721 West Virginia 930 Wisconsin — Wyoming 175 — Ratio cannot be calculated because data were not available. aThe children and students reported in this category are those subject to multiple short-term suspensions/expulsions summing to more than 10 days during the school year, those subject to single suspension(s)/expulsion(s) over 10 days during the school year, and those subject to both. NOTE: Ratio for each State was calculated by dividing the number of children and students ages 3 through 21 served under IDEA, Part B, by the State who were reported under the category of emotional disturbance and suspended out of school or expelled for more than 10 days by the total number of children and students ages 3 through 21 served under IDEA, Part B, by the State who were reported under the category of emotional disturbance, then multiplying the result by 10,000. Ratio for “All States” was calculated for all States with available data by dividing the number of children and students ages 3 through 21 served under IDEA, Part B, by all States who were reported under the category of emotional disturbance and suspended out of school or expelled for more than 10 days by the total number of children and students ages 3 through 21 served under IDEA, Part B, by all States who were reported under the category of emotional disturbance, then multiplying the result by 10,000. The numerator is based on data from the entire 2017–18 school year, whereas the denominator is based on point-in-time data from fall 2017 SOURCE: U.S. Department of Education, EDFacts Data Warehouse (EDW), OMB #1850-0925: IDEA Part B Discipline Collection, 2017–18. Data were accessed fall 2019. U.S. Department of Education, EDFacts Data Warehouse (EDW), OMB #1850-0925: IDEA Part B Child Count and Educational Environments Collection, 2017. Data were accessed fall 2018. For actual IDEA data used, go to https://www2.ed.gov/programs/osepidea/618-data/state-level-data-files/index.html.
• For every 10,000 children and students ages 3 through 21 served under IDEA, Part B, who were reported under the category of emotional disturbance in 2017 by the 47 States (“All States”) for which data were available, 402 children and students received out-of-school suspensions or expulsions for more than 10 days during school year 2017–18.
189
• The numbers of children and students ages 3 through 21 served under IDEA, Part B, who were reported under the category of emotional disturbance and received out-of-school suspensions or expulsions more than 10 days during school year 2017–18 ranged from 0 to 1,344 per 10,000 children and students served in the 47 individual States. More than 900 such children and students for every 10,000 children and students served were suspended out of school or expelled for more than 10 days during school year 2017–18 in the following five States: North Carolina (1,344 per 10,000 children and students), Nebraska (1,163 per 10,000 children and students), Nevada (1,004 per 10,000 children and students), Bureau of Indian Education schools (951 per 10,000 children and students), and West Virginia (930 per 10,000 children and students). In contrast, less than 60 out of every 10,000 such children and students served received out-of-school suspensions or expulsions for more than 10 days during school year 2017–18 in the following three States: Utah (48 per 10,000 children and students), Iowa (44 per 10,000 children and students), and Puerto Rico (0 per 10,000 children and students).
190
Part B Dispute Resolution
Unlike the other Part B data collections, which are associated with a specific group of Part B participants defined by the participants’ ages, the Part B dispute resolution data collection is associated with all children and students served under IDEA, Part B. These children and students include individuals ages 3 through 21, as well as older individuals, as States have the option of serving students 22 years of age and older. The Part B legal disputes and resolution data represent all complaints associated with any participant in Part B during the 12 months during which the data were collected. Nevertheless, since children and students ages 3 through 21 served under IDEA, Part B, account for nearly all of the participants in Part B in all States, the count for children and students ages 3 through 21 served as of the State-designated date for the year was deemed a meaningful basis for creating a ratio by which to compare the volume of Part B disputes that occurred in the individual States during the year. For an overview of the Part B dispute resolution process, see the discussion of these same data at the national level in Section I.
How did the States compare with regard to the following ratios in 2017–18:
1. The number of written, signed complaints for children and students served under IDEA, Part B, per 10,000 children and students ages 3 through 21 served;
2. The number of due process complaints for children and students served under IDEA, Part B, per 10,000 children and students ages 3 through 21 served; and
3. The number of mediation requests for children and students served under IDEA, Part B, per 10,000 children and students ages 3 through 21 served?
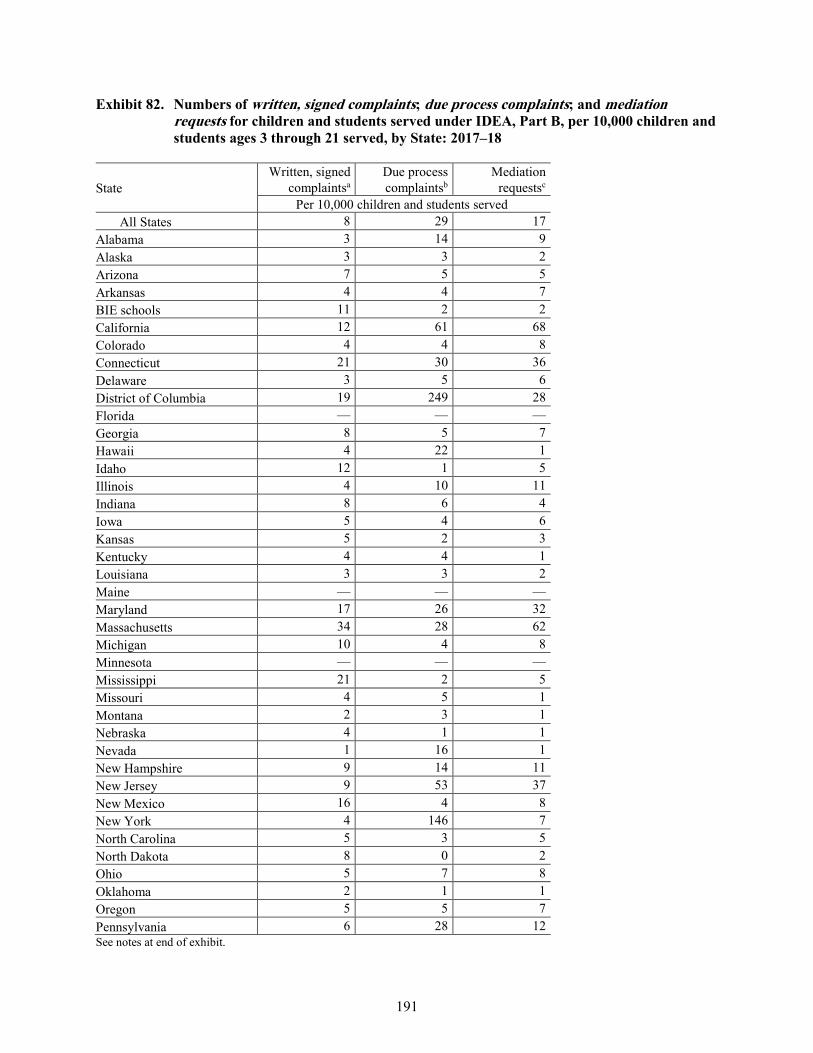
191
Exhibit 82. Numbers of written, signed complaints; due process complaints; and mediation requests for children and students served under IDEA, Part B, per 10,000 children and students ages 3 through 21 served, by State: 2017–18
State Written, signed
complaintsa Due process complaintsb
Mediation requestsc
Per 10,000 children and students served All States 8 29 17
Alabama 3 14 9 Alaska 3 3 2 Arizona 7 5 5 Arkansas 4 4 7 BIE schools 11 2 2 California 12 61 68 Colorado 4 4 8 Connecticut 21 30 36 Delaware 3 5 6 District of Columbia 19 249 28 Florida — — — Georgia 8 5 7 Hawaii 4 22 1 Idaho 12 1 5 Illinois 4 10 11 Indiana 8 6 4 Iowa 5 4 6 Kansas 5 2 3 Kentucky 4 4 1 Louisiana 3 3 2 Maine — — — Maryland 17 26 32 Massachusetts 34 28 62 Michigan 10 4 8 Minnesota — — — Mississippi 21 2 5 Missouri 4 5 1 Montana 2 3 1 Nebraska 4 1 1 Nevada 1 16 1 New Hampshire 9 14 11 New Jersey 9 53 37 New Mexico 16 4 8 New York 4 146 7 North Carolina 5 3 5 North Dakota 8 0 2 Ohio 5 7 8 Oklahoma 2 1 1 Oregon 5 5 7 Pennsylvania 6 28 12 See notes at end of exhibit.
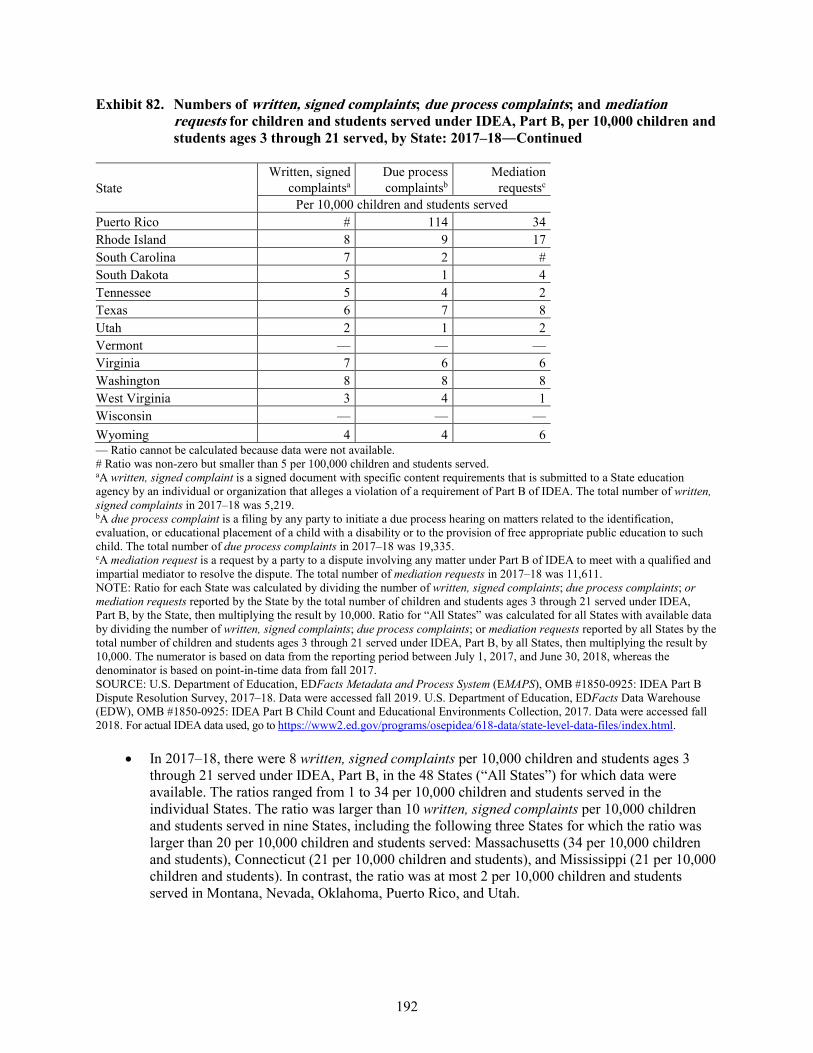
192
Exhibit 82. Numbers of written, signed complaints; due process complaints; and mediation requests for children and students served under IDEA, Part B, per 10,000 children and students ages 3 through 21 served, by State: 2017–18―Continued
State Written, signed
complaintsa Due process complaintsb
Mediation requestsc
Per 10,000 children and students served Puerto Rico # 114 34 Rhode Island 8 9 17 South Carolina 7 2 # South Dakota 5 1 4 Tennessee 5 4 2 Texas 6 7 8 Utah 2 1 2 Vermont — — — Virginia 7 6 6 Washington 8 8 8 West Virginia 3 4 1 Wisconsin — — — Wyoming 4 4 6 — Ratio cannot be calculated because data were not available. # Ratio was non-zero but smaller than 5 per 100,000 children and students served. aA written, signed complaint is a signed document with specific content requirements that is submitted to a State education agency by an individual or organization that alleges a violation of a requirement of Part B of IDEA. The total number of written, signed complaints in 2017–18 was 5,219. bA due process complaint is a filing by any party to initiate a due process hearing on matters related to the identification, evaluation, or educational placement of a child with a disability or to the provision of free appropriate public education to such child. The total number of due process complaints in 2017–18 was 19,335. cA mediation request is a request by a party to a dispute involving any matter under Part B of IDEA to meet with a qualified and impartial mediator to resolve the dispute. The total number of mediation requests in 2017–18 was 11,611. NOTE: Ratio for each State was calculated by dividing the number of written, signed complaints; due process complaints; or mediation requests reported by the State by the total number of children and students ages 3 through 21 served under IDEA, Part B, by the State, then multiplying the result by 10,000. Ratio for “All States” was calculated for all States with available data by dividing the number of written, signed complaints; due process complaints; or mediation requests reported by all States by the total number of children and students ages 3 through 21 served under IDEA, Part B, by all States, then multiplying the result by 10,000. The numerator is based on data from the reporting period between July 1, 2017, and June 30, 2018, whereas the denominator is based on point-in-time data from fall 2017. SOURCE: U.S. Department of Education, EDFacts Metadata and Process System (EMAPS), OMB #1850-0925: IDEA Part B Dispute Resolution Survey, 2017–18. Data were accessed fall 2019. U.S. Department of Education, EDFacts Data Warehouse (EDW), OMB #1850-0925: IDEA Part B Child Count and Educational Environments Collection, 2017. Data were accessed fall 2018. For actual IDEA data used, go to https://www2.ed.gov/programs/osepidea/618-data/state-level-data-files/index.html.
• In 2017–18, there were 8 written, signed complaints per 10,000 children and students ages 3 through 21 served under IDEA, Part B, in the 48 States (“All States”) for which data were available. The ratios ranged from 1 to 34 per 10,000 children and students served in the individual States. The ratio was larger than 10 written, signed complaints per 10,000 children and students served in nine States, including the following three States for which the ratio was larger than 20 per 10,000 children and students served: Massachusetts (34 per 10,000 children and students), Connecticut (21 per 10,000 children and students), and Mississippi (21 per 10,000 children and students). In contrast, the ratio was at most 2 per 10,000 children and students served in Montana, Nevada, Oklahoma, Puerto Rico, and Utah.
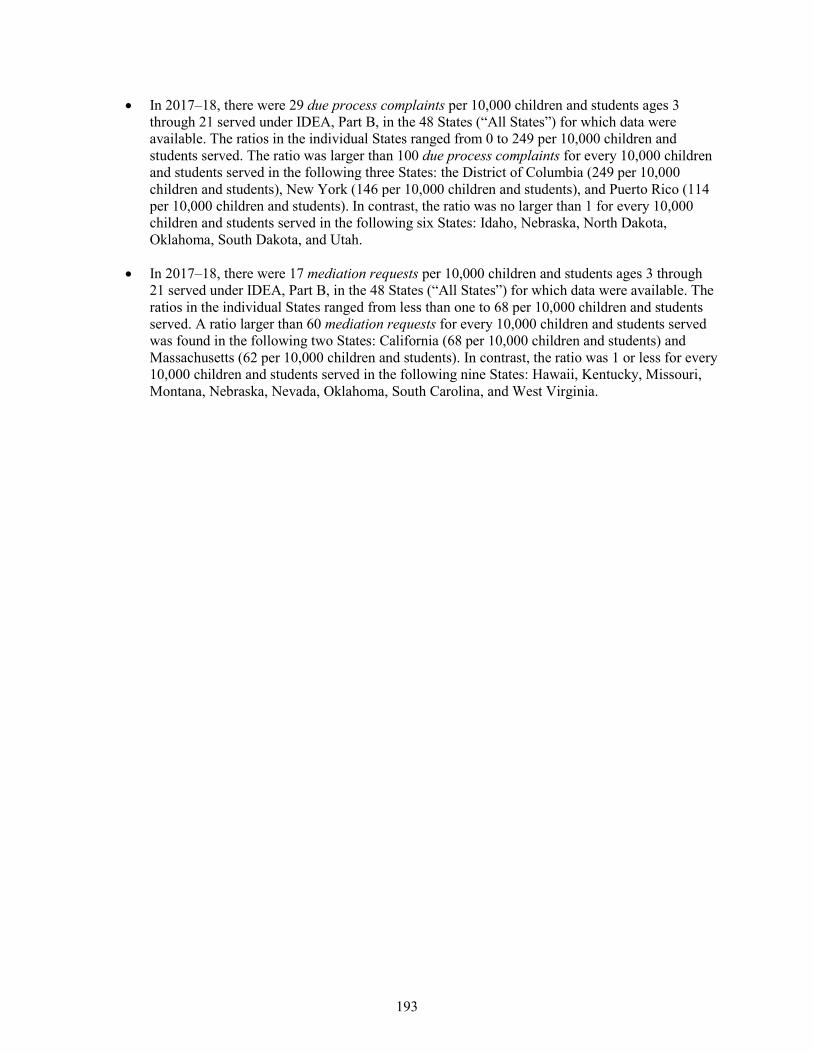
193
• In 2017–18, there were 29 due process complaints per 10,000 children and students ages 3 through 21 served under IDEA, Part B, in the 48 States (“All States”) for which data were available. The ratios in the individual States ranged from 0 to 249 per 10,000 children and students served. The ratio was larger than 100 due process complaints for every 10,000 children and students served in the following three States: the District of Columbia (249 per 10,000 children and students), New York (146 per 10,000 children and students), and Puerto Rico (114 per 10,000 children and students). In contrast, the ratio was no larger than 1 for every 10,000 children and students served in the following six States: Idaho, Nebraska, North Dakota, Oklahoma, South Dakota, and Utah.
• In 2017–18, there were 17 mediation requests per 10,000 children and students ages 3 through 21 served under IDEA, Part B, in the 48 States (“All States”) for which data were available. The ratios in the individual States ranged from less than one to 68 per 10,000 children and students served. A ratio larger than 60 mediation requests for every 10,000 children and students served was found in the following two States: California (68 per 10,000 children and students) and Massachusetts (62 per 10,000 children and students). In contrast, the ratio was 1 or less for every 10,000 children and students served in the following nine States: Hawaii, Kentucky, Missouri, Montana, Nebraska, Nevada, Oklahoma, South Carolina, and West Virginia.
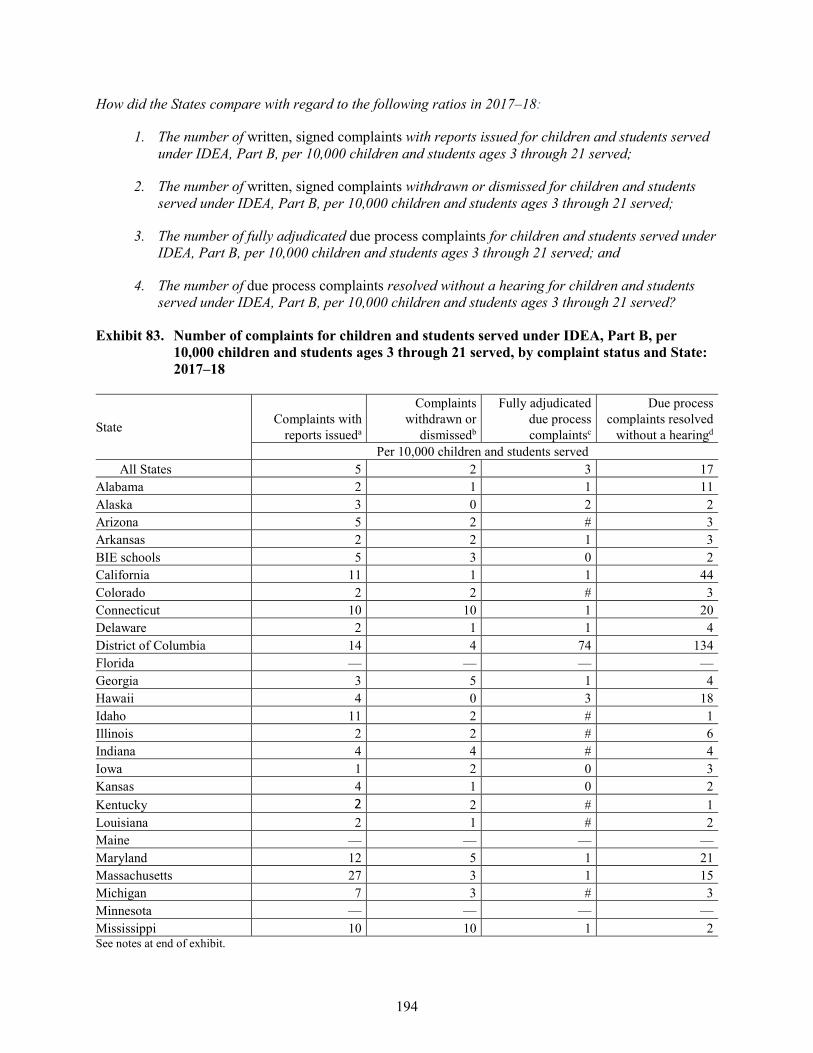
194
How did the States compare with regard to the following ratios in 2017–18:
1. The number of written, signed complaints with reports issued for children and students served under IDEA, Part B, per 10,000 children and students ages 3 through 21 served;
2. The number of written, signed complaints withdrawn or dismissed for children and students served under IDEA, Part B, per 10,000 children and students ages 3 through 21 served;
3. The number of fully adjudicated due process complaints for children and students served under IDEA, Part B, per 10,000 children and students ages 3 through 21 served; and
4. The number of due process complaints resolved without a hearing for children and students served under IDEA, Part B, per 10,000 children and students ages 3 through 21 served?
Exhibit 83. Number of complaints for children and students served under IDEA, Part B, per 10,000 children and students ages 3 through 21 served, by complaint status and State: 2017–18
State Complaints with reports issueda
Complaints withdrawn or
dismissedb
Fully adjudicated due process complaintsc
Due process complaints resolved
without a hearingd Per 10,000 children and students served
All States 5 2 3 17 Alabama 2 1 1 11 Alaska 3 0 2 2 Arizona 5 2 # 3 Arkansas 2 2 1 3 BIE schools 5 3 0 2 California 11 1 1 44 Colorado 2 2 # 3 Connecticut 10 10 1 20 Delaware 2 1 1 4 District of Columbia 14 4 74 134 Florida — — — — Georgia 3 5 1 4 Hawaii 4 0 3 18 Idaho 11 2 # 1 Illinois 2 2 # 6 Indiana 4 4 # 4 Iowa 1 2 0 3 Kansas 4 1 0 2 Kentucky 2 2 # 1 Louisiana 2 1 # 2 Maine — — — — Maryland 12 5 1 21 Massachusetts 27 3 1 15 Michigan 7 3 # 3 Minnesota — — — — Mississippi 10 10 1 2 See notes at end of exhibit.
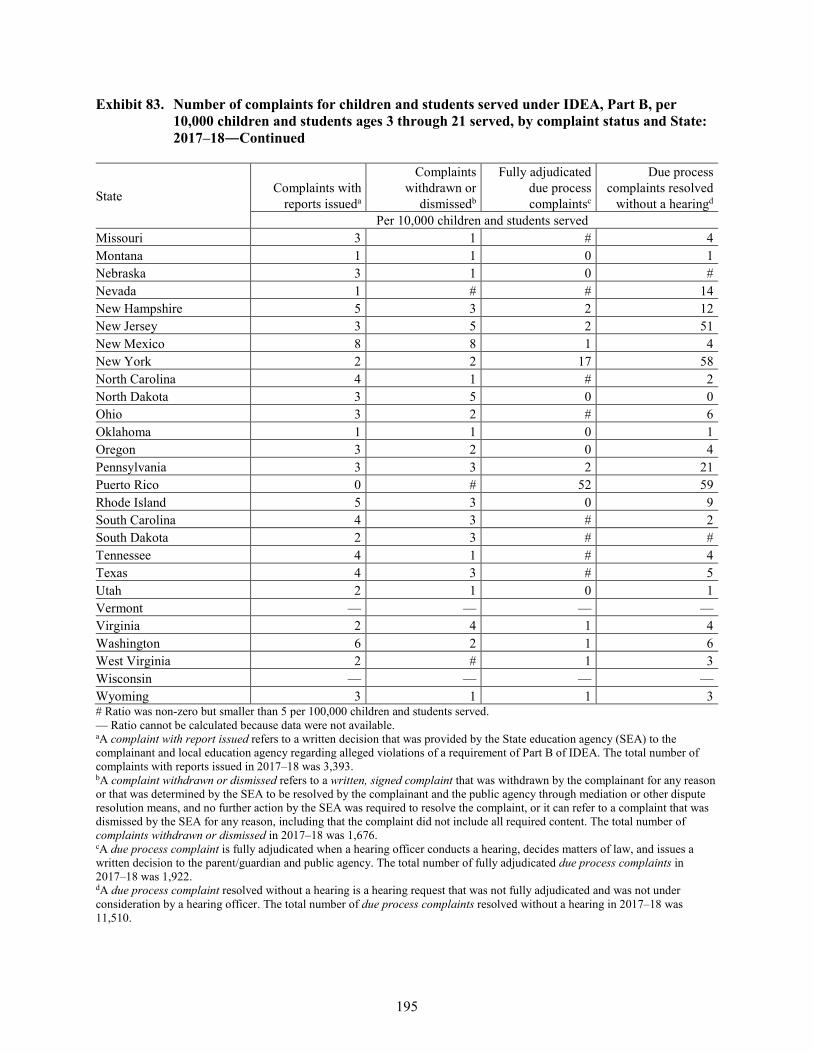
195
Exhibit 83. Number of complaints for children and students served under IDEA, Part B, per 10,000 children and students ages 3 through 21 served, by complaint status and State: 2017–18―Continued
State Complaints with reports issueda
Complaints withdrawn or
dismissedb
Fully adjudicated due process complaintsc
Due process complaints resolved
without a hearingd Per 10,000 children and students served
Missouri 3 1 # 4 Montana 1 1 0 1 Nebraska 3 1 0 # Nevada 1 # # 14 New Hampshire 5 3 2 12 New Jersey 3 5 2 51 New Mexico 8 8 1 4 New York 2 2 17 58 North Carolina 4 1 # 2 North Dakota 3 5 0 0 Ohio 3 2 # 6 Oklahoma 1 1 0 1 Oregon 3 2 0 4 Pennsylvania 3 3 2 21 Puerto Rico 0 # 52 59 Rhode Island 5 3 0 9 South Carolina 4 3 # 2 South Dakota 2 3 # # Tennessee 4 1 # 4 Texas 4 3 # 5 Utah 2 1 0 1 Vermont — — — — Virginia 2 4 1 4 Washington 6 2 1 6 West Virginia 2 # 1 3 Wisconsin — — — — Wyoming 3 1 1 3 # Ratio was non-zero but smaller than 5 per 100,000 children and students served. — Ratio cannot be calculated because data were not available. aA complaint with report issued refers to a written decision that was provided by the State education agency (SEA) to the complainant and local education agency regarding alleged violations of a requirement of Part B of IDEA. The total number of complaints with reports issued in 2017–18 was 3,393. bA complaint withdrawn or dismissed refers to a written, signed complaint that was withdrawn by the complainant for any reason or that was determined by the SEA to be resolved by the complainant and the public agency through mediation or other dispute resolution means, and no further action by the SEA was required to resolve the complaint, or it can refer to a complaint that was dismissed by the SEA for any reason, including that the complaint did not include all required content. The total number of complaints withdrawn or dismissed in 2017–18 was 1,676. cA due process complaint is fully adjudicated when a hearing officer conducts a hearing, decides matters of law, and issues a written decision to the parent/guardian and public agency. The total number of fully adjudicated due process complaints in 2017–18 was 1,922. dA due process complaint resolved without a hearing is a hearing request that was not fully adjudicated and was not under consideration by a hearing officer. The total number of due process complaints resolved without a hearing in 2017–18 was 11,510.
196
• In 2017–18, there were 5 written, signed complaints with reports issued per 10,000 children and students ages 3 through 21 served under IDEA, Part B, in the 48 States (“All States”) for which data were available. The ratios in the individual States ranged from 1 to 27 per 10,000 children and students served. The ratio was 10 or more for every 10,000 children and students served in the following seven States: Massachusetts (27 per 10,000 children and students), the District of Columbia (14 per 10,000 children and students), Maryland (12 per 10,000 children and students), California (11 per 10,000 children and students), Idaho (11 per 10,000 children and students), Connecticut (10 per 10,000 children and students), and Mississippi (10 per 10,000 children and students). In contrast, the ratio was 1 for every 10,000 children and students served in the following four States: Iowa, Montana, Nevada, and Oklahoma.
• In 2017–18, there were 2 written, signed complaints withdrawn or dismissed per 10,000 children and students ages 3 through 21 served under IDEA, Part B, in the 48 States (“All States”) for which data were available. The ratios in the individual States ranged from 0 to 10 per 10,000 children and students served. The ratio was more than 5 for every 10,000 children and students served in the following three States: Connecticut (10 per 10,000 children and students), Mississippi (10 per 10,000 children and students), and New Mexico (8 per 10,000 children and students). In contrast, the ratio was less than 1 for every 10,000 children and students served in the following five States: Alaska, Hawaii, Nevada, Puerto Rico, and West Virginia.
• In 2017–18, there were 3 fully adjudicated due process complaints per 10,000 children and students ages 3 through 21 served under IDEA, Part B, in the 48 States (“All States”) for which data were available. The ratios in the individual States ranged from 0 to 74 per 10,000 children and students served. The ratio was larger than 10 for every 10,000 children and students served in the following three States: the District of Columbia (74 per 10,000 children and students), Puerto Rico (52 per 10,000 children and students), and New York (17 per 10,000 children and students). In contrast, the ratio was zero in 10 States.
• In 2017–18, there were 17 due process complaints resolved without a hearing per 10,000 children and students ages 3 through 21 served under IDEA, Part B, in the 48 States (“All States”) for which data were available. The ratios in the individual States ranged from 0 to 134 per 10,000 children and students served. The ratio was larger than 50 for every 10,000 children and students served in the following four States: the District of Columbia (134 per 10,000 children and students), Puerto Rico (59 per 10,000 children and students), New York (58 per 10,000 children and students), and New Jersey (51 per 10,000 children and students). In contrast, the ratio was no more than 1 for every 10,000 children and students served in eight States.
NOTE: A written, signed complaint is a signed document with specific content requirements that is submitted to an SEA by an individual or organization that alleges a violation of a requirement of Part B of IDEA. A hearing request is a filing by any party to initiate a due process hearing on matters related to the identification, evaluation, or educational placement of a child with a disability or to the provision of free appropriate public education to such child. Ratio for each State was calculated by dividing the number of complaints with reports issued, complaints withdrawn or dismissed, fully adjudicated due process complaints, or due process complaints resolved without a hearing reported by the State by the total number of children and students ages 3 through 21 served under IDEA, Part B, by the State, then multiplying the result by 10,000. Ratio for “All States” was calculated for all States with available data by dividing the number of complaints with reports issued, complaints withdrawn or dismissed, fully adjudicated due process complaints, or due process complaints resolved without a hearing reported by all States by the total number of children and students ages 3 through 21 served under IDEA, Part B, by all States, then multiplying the result by 10,000. The numerator is based on data from the reporting period between July 1, 2017, and June 30, 2018, whereas the denominator is based on point-in-time data from fall 2017. SOURCE: U.S. Department of Education, EDFacts Metadata and Process System (EMAPS), OMB #1850-0925: IDEA Part B Dispute Resolution Survey, 2017–18. Data were accessed fall 2019. U.S. Department of Education, EDFacts Data Warehouse (EDW), OMB #1850-0925: IDEA Part B Child Count and Educational Environments Collection, 2017. Data were accessed fall 2018. For actual IDEA data used, go to https://www2.ed.gov/programs/osepidea/618-data/state-level-data-files/index.html.
Section III
Findings and Determinations Resulting From Reviews of State Implementation of IDEA

199
Findings and Determinations Resulting From Reviews of State Implementation of IDEA
Section 616(a)(1)(A) of the Individuals with Disabilities Education Act (IDEA) requires the Secretary of the U.S. Department of Education (Department) to monitor the implementation of IDEA. Under IDEA Sections 616(d) and 642, the Department performs an annual review of each State’s implementation of IDEA, Part B and Part C, through oversight of general supervision by the States and through the State performance plans (SPPs) described in Section 616(b). To fulfill these requirements, the Office of Special Education Programs (OSEP), on behalf of the Secretary, has implemented the Continuous Improvement and Focused Monitoring System (CIFMS), which focuses resources on critical compliance and performance areas in IDEA. Under IDEA Sections 616(d) and 642, the Department performs an annual review of each State’s SPP and the associated annual performance report (APR) (collectively, the SPP/APR) under Part B and Part C of IDEA and other publicly available information to make an annual determination of the extent to which the State is meeting the requirements and purposes of Part B and Part C of IDEA. The SPPs/APRs and the Department’s annual determinations are components of CIFMS.
The State Performance Plan and Annual Performance Report
Sections 616(b) and 642 of IDEA require each State to have an SPP in place for evaluating the State’s efforts to implement the requirements and purposes of IDEA and for describing how the State will improve its implementation of IDEA. The original SPP that each State submitted in 2005 covered a period of six years for Federal fiscal year (FFY) 2005 through FFY 2010 and was made up of quantifiable indicators (20 under Part B and 14 under Part C), established by the Secretary under Sections 616(a)(3) and 642 of IDEA, which measured either compliance with specific statutory or regulatory provisions of IDEA (compliance indicators) or results and outcomes for children with disabilities and their families (results indicators). SPPs were submitted in December 2005 by each State education agency (SEA) under Part B and by each State lead agency under Part C. Each SPP includes measurable and rigorous targets and improvement activities for each indicator. The original SPP was extended for two years for FFYs 2011 and 2012. On February 2, 2015, each State was required to submit a new SPP with revised quantifiable compliance and results indicators (16 under Part B and 10 under Part C) that covered the six-year period for FFYs 2013 through 2018 and included a new indicator for both Part B and Part C, the State Systemic Improvement Plan (SSIP) that is part of OSEP’s Results Driven Accountability (RDA) framework.
200
Every February, pursuant to Sections 616(b)(2)(C)(ii)(II) and 642 of IDEA, each State must submit an APR that documents its progress or slippage toward meeting the measurable and rigorous targets established for each indicator in the SPP for a specific FFY. In February 2019, each State submitted an SPP/APR under Part B and Part C to OSEP for the FFY 2017 APR reporting period (i.e., July 1, 2017, through June 30, 2018). Beginning with the FFY 2013 SPP/APR submitted in February 2015, each State was required to submit its SPP/APR online using the SPP/APR module on GRADS360° (https://osep.grads360.org/#program/spp-apr-resources). This section examines and summarizes the States’ performance during FFY 2017 under both Part B and Part C of IDEA.
Please note that throughout this section, the term “States” is used to reference all of the jurisdictions that submitted FFY 2017 SPPs/APRs. The jurisdictions include the 50 States, the District of Columbia (DC), Puerto Rico (PR), and the four outlying areas of American Samoa, Guam, the Northern Mariana Islands, and the Virgin Islands, all of which reported separately on Part B and Part C. In addition, for Part B, the Bureau of Indian Education (BIE), as well as the three freely associated states of the Federated States of Micronesia, the Republic of Palau, and the Republic of the Marshall Islands, submitted SPPs/APRs. The Bureau of Indian Education, which receives funds under both Part B and Part C of IDEA, has a separate reporting requirement under Part C of IDEA.12 Thus, unless stated otherwise, the discussion and exhibits in this section concern the 60 States for Part B and 56 States for Part C.
Indicators
In 2005, the Secretary established, with broad stakeholder input, a reporting requirement for the SPP/APR for FFYs 2005 through 2010 to include reporting on 20 indicators for Part B (nine compliance indicators, 10 results indicators, and one results/compliance indicator) and 14 indicators for Part C (seven compliance indicators and seven results indicators) for the very first SPP/APR submitted after the enactment of the IDEA 2004 amendments. The Department extended the original SPP for FFYs 2011 and 2012, and States reported under their original SPP. On February 2, 2015, each State was required to submit a new SPP with revised quantifiable compliance and results indicators (16 under Part B and 10 under Part C) that covered the six-year period for FFYs 2013 through 2018 and included the State Systemic Improvement Plan (SSIP) as a new qualitative indicator for both Part B and Part C. Exhibits 84 and 85 explain the measurement that was in place during the FFY 2017 reporting period for each Part B and Part C indicator on which States were required to report by February 2019 (17 Part B indicators and 11 Part C indicators) and identify whether each indicator is a compliance or a results indicator.
12 The Bureau of Indian Education reports separately under IDEA Section 643(b)(5) and 34 Code of Federal Regulations (C.F.R.)
§ 303.731(e)(3) on its child find coordination efforts. The Department responds to these reports separately from the RDA determination process.
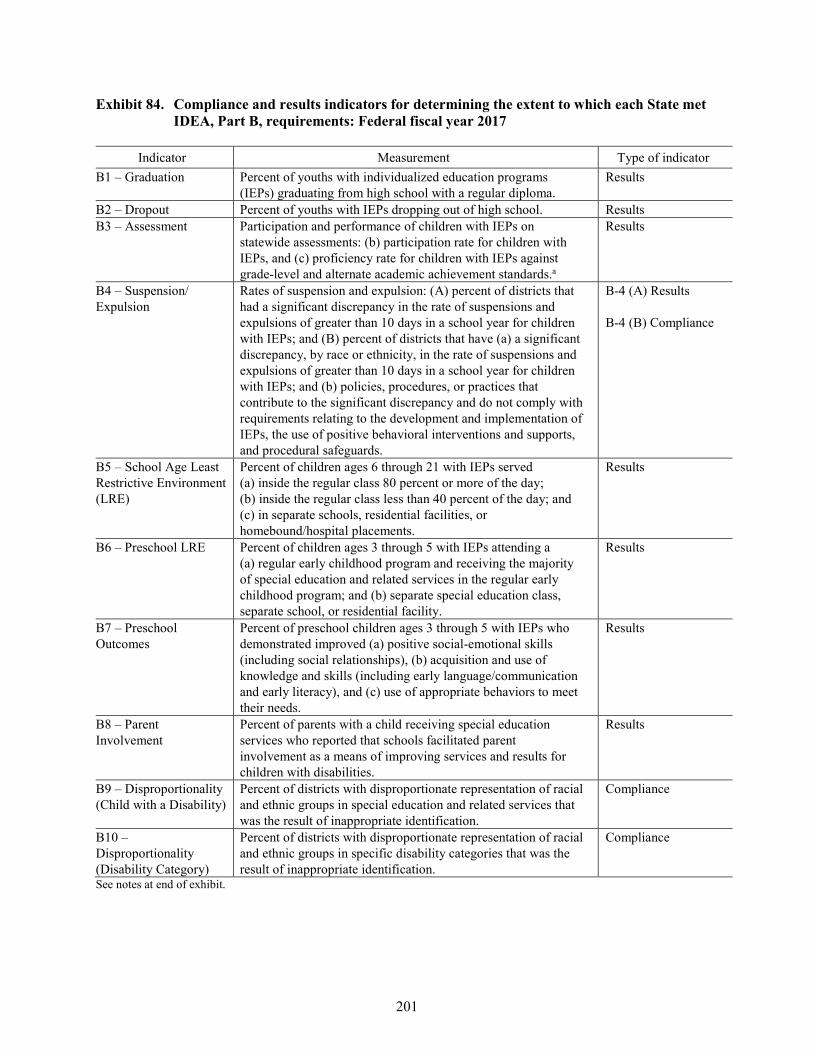
201
Exhibit 84. Compliance and results indicators for determining the extent to which each State met IDEA, Part B, requirements: Federal fiscal year 2017
Indicator Measurement Type of indicator B1 – Graduation Percent of youths with individualized education programs
(IEPs) graduating from high school with a regular diploma. Results
B2 – Dropout Percent of youths with IEPs dropping out of high school. Results B3 – Assessment Participation and performance of children with IEPs on
statewide assessments: (b) participation rate for children with IEPs, and (c) proficiency rate for children with IEPs against grade-level and alternate academic achievement standards.a
Results
B4 – Suspension/ Expulsion
Rates of suspension and expulsion: (A) percent of districts that had a significant discrepancy in the rate of suspensions and expulsions of greater than 10 days in a school year for children with IEPs; and (B) percent of districts that have (a) a significant discrepancy, by race or ethnicity, in the rate of suspensions and expulsions of greater than 10 days in a school year for children with IEPs; and (b) policies, procedures, or practices that contribute to the significant discrepancy and do not comply with requirements relating to the development and implementation of IEPs, the use of positive behavioral interventions and supports, and procedural safeguards.
B-4 (A) Results
B-4 (B) Compliance
B5 – School Age Least Restrictive Environment (LRE)
Percent of children ages 6 through 21 with IEPs served (a) inside the regular class 80 percent or more of the day; (b) inside the regular class less than 40 percent of the day; and (c) in separate schools, residential facilities, or homebound/hospital placements.
Results
B6 – Preschool LRE Percent of children ages 3 through 5 with IEPs attending a (a) regular early childhood program and receiving the majority of special education and related services in the regular early childhood program; and (b) separate special education class, separate school, or residential facility.
Results
B7 – Preschool Outcomes
Percent of preschool children ages 3 through 5 with IEPs who demonstrated improved (a) positive social-emotional skills (including social relationships), (b) acquisition and use of knowledge and skills (including early language/communication and early literacy), and (c) use of appropriate behaviors to meet their needs.
Results
B8 – Parent Involvement
Percent of parents with a child receiving special education services who reported that schools facilitated parent involvement as a means of improving services and results for children with disabilities.
Results
B9 – Disproportionality (Child with a Disability)
Percent of districts with disproportionate representation of racial and ethnic groups in special education and related services that was the result of inappropriate identification.
Compliance
B10 – Disproportionality (Disability Category)
Percent of districts with disproportionate representation of racial and ethnic groups in specific disability categories that was the result of inappropriate identification.
Compliance
See notes at end of exhibit.
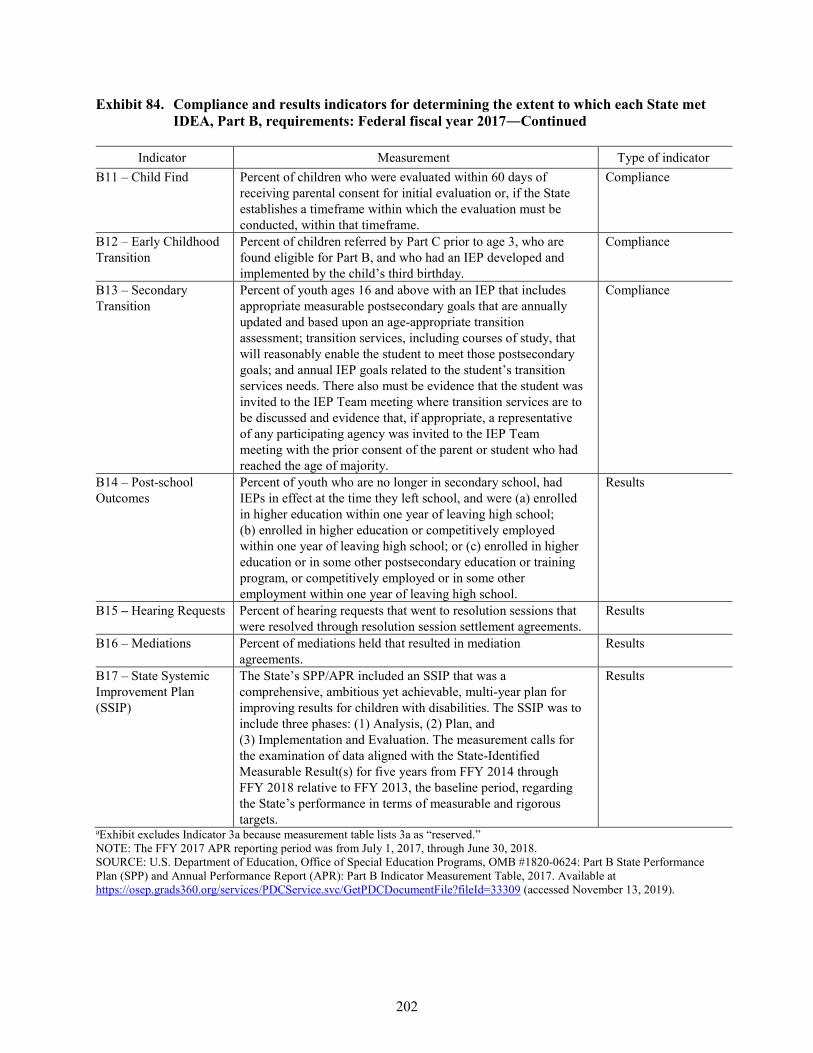
202
Exhibit 84. Compliance and results indicators for determining the extent to which each State met IDEA, Part B, requirements: Federal fiscal year 2017―Continued
Indicator Measurement Type of indicator B11 – Child Find Percent of children who were evaluated within 60 days of
receiving parental consent for initial evaluation or, if the State establishes a timeframe within which the evaluation must be conducted, within that timeframe.
Compliance
B12 – Early Childhood Transition
Percent of children referred by Part C prior to age 3, who are found eligible for Part B, and who had an IEP developed and implemented by the child’s third birthday.
Compliance
B13 – Secondary Transition
Percent of youth ages 16 and above with an IEP that includes appropriate measurable postsecondary goals that are annually updated and based upon an age-appropriate transition assessment; transition services, including courses of study, that will reasonably enable the student to meet those postsecondary goals; and annual IEP goals related to the student’s transition services needs. There also must be evidence that the student was invited to the IEP Team meeting where transition services are to be discussed and evidence that, if appropriate, a representative of any participating agency was invited to the IEP Team meeting with the prior consent of the parent or student who had reached the age of majority.
Compliance
B14 – Post-school Outcomes
Percent of youth who are no longer in secondary school, had IEPs in effect at the time they left school, and were (a) enrolled in higher education within one year of leaving high school; (b) enrolled in higher education or competitively employed within one year of leaving high school; or (c) enrolled in higher education or in some other postsecondary education or training program, or competitively employed or in some other employment within one year of leaving high school.
Results
B15 – Hearing Requests Percent of hearing requests that went to resolution sessions that were resolved through resolution session settlement agreements.
Results
B16 – Mediations Percent of mediations held that resulted in mediation agreements.
Results
B17 – State Systemic Improvement Plan (SSIP)
The State’s SPP/APR included an SSIP that was a comprehensive, ambitious yet achievable, multi-year plan for improving results for children with disabilities. The SSIP was to include three phases: (1) Analysis, (2) Plan, and (3) Implementation and Evaluation. The measurement calls for the examination of data aligned with the State-Identified Measurable Result(s) for five years from FFY 2014 through FFY 2018 relative to FFY 2013, the baseline period, regarding the State’s performance in terms of measurable and rigorous targets.
Results
aExhibit excludes Indicator 3a because measurement table lists 3a as “reserved.” NOTE: The FFY 2017 APR reporting period was from July 1, 2017, through June 30, 2018. SOURCE: U.S. Department of Education, Office of Special Education Programs, OMB #1820-0624: Part B State Performance Plan (SPP) and Annual Performance Report (APR): Part B Indicator Measurement Table, 2017. Available at https://osep.grads360.org/services/PDCService.svc/GetPDCDocumentFile?fileId=33309 (accessed November 13, 2019).
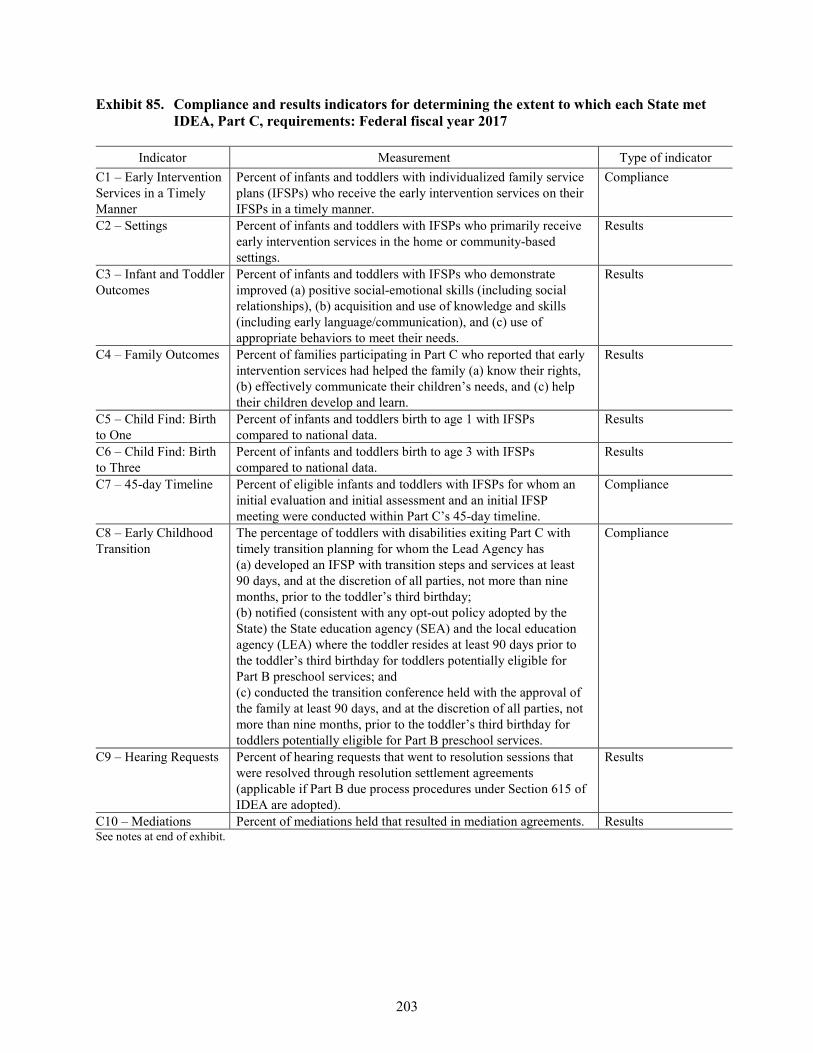
203
Exhibit 85. Compliance and results indicators for determining the extent to which each State met IDEA, Part C, requirements: Federal fiscal year 2017
Indicator Measurement Type of indicator C1 – Early Intervention Services in a Timely Manner
Percent of infants and toddlers with individualized family service plans (IFSPs) who receive the early intervention services on their IFSPs in a timely manner.
Compliance
C2 – Settings Percent of infants and toddlers with IFSPs who primarily receive early intervention services in the home or community-based settings.
Results
C3 – Infant and Toddler Outcomes
Percent of infants and toddlers with IFSPs who demonstrate improved (a) positive social-emotional skills (including social relationships), (b) acquisition and use of knowledge and skills (including early language/communication), and (c) use of appropriate behaviors to meet their needs.
Results
C4 – Family Outcomes Percent of families participating in Part C who reported that early intervention services had helped the family (a) know their rights, (b) effectively communicate their children’s needs, and (c) help their children develop and learn.
Results
C5 – Child Find: Birth to One
Percent of infants and toddlers birth to age 1 with IFSPs compared to national data.
Results
C6 – Child Find: Birth to Three
Percent of infants and toddlers birth to age 3 with IFSPs compared to national data.
Results
C7 – 45-day Timeline Percent of eligible infants and toddlers with IFSPs for whom an initial evaluation and initial assessment and an initial IFSP meeting were conducted within Part C’s 45-day timeline.
Compliance
C8 – Early Childhood Transition
The percentage of toddlers with disabilities exiting Part C with timely transition planning for whom the Lead Agency has (a) developed an IFSP with transition steps and services at least 90 days, and at the discretion of all parties, not more than nine months, prior to the toddler’s third birthday; (b) notified (consistent with any opt-out policy adopted by the State) the State education agency (SEA) and the local education agency (LEA) where the toddler resides at least 90 days prior to the toddler’s third birthday for toddlers potentially eligible for Part B preschool services; and (c) conducted the transition conference held with the approval of the family at least 90 days, and at the discretion of all parties, not more than nine months, prior to the toddler’s third birthday for toddlers potentially eligible for Part B preschool services.
Compliance
C9 – Hearing Requests Percent of hearing requests that went to resolution sessions that were resolved through resolution settlement agreements (applicable if Part B due process procedures under Section 615 of IDEA are adopted).
Results
C10 – Mediations Percent of mediations held that resulted in mediation agreements. Results See notes at end of exhibit.
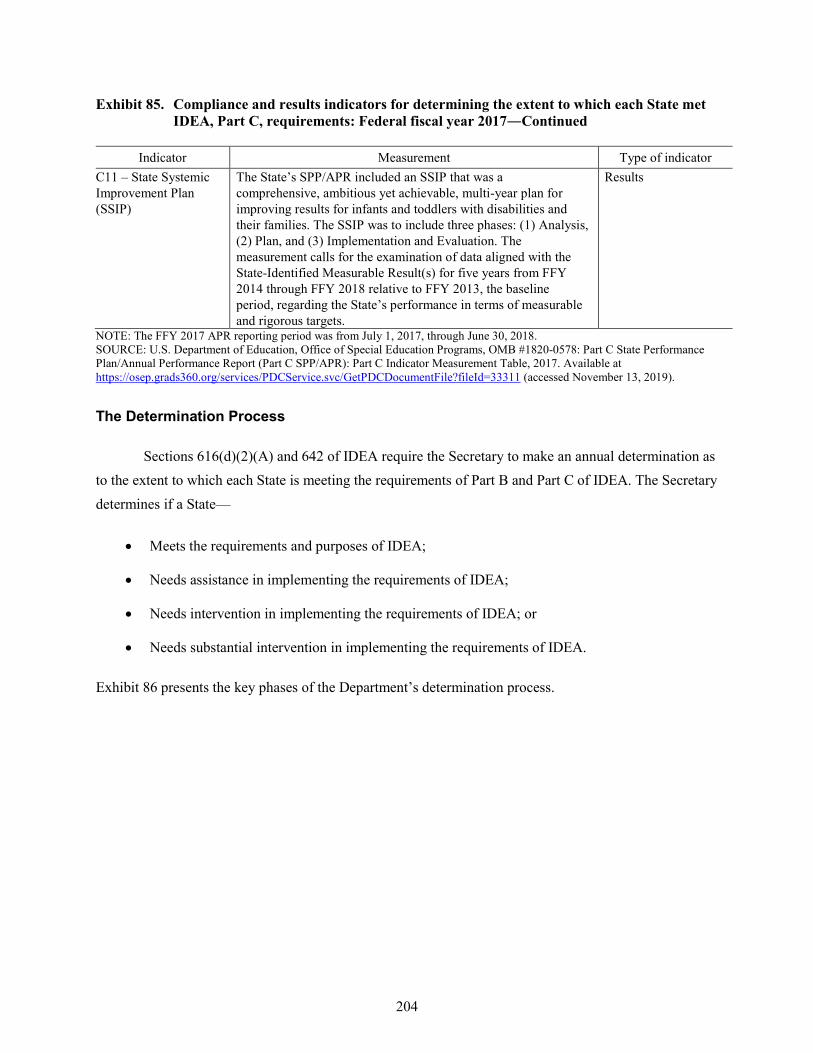
204
Exhibit 85. Compliance and results indicators for determining the extent to which each State met IDEA, Part C, requirements: Federal fiscal year 2017―Continued
Indicator Measurement Type of indicator C11 – State Systemic Improvement Plan (SSIP)
The State’s SPP/APR included an SSIP that was a comprehensive, ambitious yet achievable, multi-year plan for improving results for infants and toddlers with disabilities and their families. The SSIP was to include three phases: (1) Analysis, (2) Plan, and (3) Implementation and Evaluation. The measurement calls for the examination of data aligned with the State-Identified Measurable Result(s) for five years from FFY 2014 through FFY 2018 relative to FFY 2013, the baseline period, regarding the State’s performance in terms of measurable and rigorous targets.
Results
NOTE: The FFY 2017 APR reporting period was from July 1, 2017, through June 30, 2018. SOURCE: U.S. Department of Education, Office of Special Education Programs, OMB #1820-0578: Part C State Performance Plan/Annual Performance Report (Part C SPP/APR): Part C Indicator Measurement Table, 2017. Available at https://osep.grads360.org/services/PDCService.svc/GetPDCDocumentFile?fileId=33311 (accessed November 13, 2019).
The Determination Process
Sections 616(d)(2)(A) and 642 of IDEA require the Secretary to make an annual determination as to the extent to which each State is meeting the requirements of Part B and Part C of IDEA. The Secretary determines if a State—
• Meets the requirements and purposes of IDEA;
• Needs assistance in implementing the requirements of IDEA;
• Needs intervention in implementing the requirements of IDEA; or
• Needs substantial intervention in implementing the requirements of IDEA.
Exhibit 86 presents the key phases of the Department’s determination process.
205
Exhibit 86. Process for determining the extent to which each State met IDEA, Part B and Part C, requirements: Federal fiscal year 2017
December 2005: States submitted initial State performance plans (SPPs)a
February 2015: States required to submit a new SPP for FFYs 2013
through 2018
Secretary reviewed FFY 2017 SPPs/APRs and considered multiple
additional factors in making determinations
June 2019: Secretary released determinations based on data reported
in FFY 2017 SPPs/APRs and other available data
Special Conditions
State single-audit findings
Information obtained through monitoring visits
Other public information made
available
Secretary took specific enforcement actions
February 2019: States submitted FFY 2017 annual performance reports (APRs) and, if applicable, revised
SPPs
aIn December 2005, each State submitted its initial SPP that covered a period of six years for FFYs 2005 through 2010. Sections 616(b)(1)(C) and 642 require each State to review its SPP under Part B and Part C at least once every six years and submit any amendments to the Secretary. Each State is also required to post the most current SPP on its State website. Since December 2005, most States have revised their SPP at least once. The original SPP was extended for two years for FFYs 2011 and 2012. States were required to submit a new SPP for the six-year period FFYs 2013 through 2018 on February 2, 2015. NOTE: In June 2018, the Secretary issued determinations based on data reported in the FFY 2016 APR and other available data. A discussion of those determinations is found in the 41st Annual Report to Congress, 2019. SOURCE: Information taken from U.S. Department of Education, Office of Special Education Programs, OSEP Memo 15-06 to State Education Agency Directors of Special Education and State Data Managers, dated December 23, 2014. OSEP Memo 15-05 to Lead Agency Directors, Part C Coordinators and State Interagency Coordinating Council Chairpersons, dated December 23, 2014.
206
Determinations From 2007 Through 2013 – Use of Compliance Data
Over the years, the process for making the Part B and Part C determinations has evolved. Starting in 2007, the Department has made an annual determination for each State under Part B and Part C of IDEA and based each State’s determination on the totality of the State’s data in its SPP/APR and other publicly available information about the State, including any information about outstanding compliance issues. For the years 2007 through 2012, the Department used specific factors in making determinations, including considering (1) State data in any one compliance indicator if it reflected very low performance, (2) whether the State lacked valid and reliable data for that indicator, and (3) the State’s inability to correct longstanding noncompliance that had been the subject of continuing departmental enforcement actions such as Special Conditions on the State’s grant. In making each State’s determination under Part B and Part C in 2013, the Department used a Compliance Matrix that reflected the totality of the State’s compliance data instead of one particular factor. However, in making this transition to a matrix approach in 2013 to consider multiple factors, the Department also applied the prior single-factor approach such that no State would receive a lower determination under the 2013 Compliance Matrix approach than it would have had in the 2012 single-factor approach.
Results Driven Accountability in 2014 Through 2019
Beginning in 2014, the Department used both compliance and results data in making Part B determinations, giving each equal weight in making a State’s determination. Specifically, the Department considered the totality of information available about a State, including information related to the participation of children with disabilities on regular statewide assessments; the proficiency gap between children with disabilities and all children on regular statewide assessments; the participation and performance of children with disabilities on the National Assessment of Educational Progress (NAEP); the State’s FFY 2012 SPP/APR; information from monitoring and other public information, such as the Special Conditions on the State’s grant award under Part B; and other issues related to State compliance with IDEA.
From 2015 through 2019, the Department used both compliance and results data in making its annual Part B determinations, giving each equal weight in making a State’s determination. In making Part B determinations in 2015 through 2019, the Department continued to use results data related to the participation of children with disabilities on regular statewide assessments and the participation and performance of children with disabilities on the most recently administered NAEP. In addition, the Department used exiting data on children with disabilities who dropped out and children with disabilities who graduated with a regular high school diploma, as reported by States under Section 618 of IDEA.
207
The Department used a Compliance Matrix and a Results Matrix in making the Part B determinations for most States in 2014 through 2017. The exceptions were the three freely associated states, four outlying areas, and the Bureau of Indian Education, as the Department did not have sufficient results data to use when making the Part B determinations. Therefore, the Department used only compliance data when making Part B determinations for these entities in 2014 through 2017. However, for the first time in 2018, and again in 2019, the Department made Part B determinations for the three freely associated states, four outlying areas, and the Bureau of Indian Education, using both compliance and results data, with a 60% weight and 40% weight, respectively.
In making the 2014 Part C determination for each State, the Department used the prior compliance criteria it had used in 2013 Part C determinations, which considered the totality of the information available about the State. Specifically, the information included the State’s FFY 2012 SPP/APR; information from monitoring and other public information, such as Special Conditions on the State’s grant award under Part C; and other issues related to State compliance with IDEA. However, in making each State’s 2014 Part C determination, the Department used only a Compliance Matrix, as results data were not taken into consideration.
Beginning for the first time in 2015 and annually through 2019, the Department used both compliance and results data in making each State’s IDEA Part C determination under Sections 616(d) and 642 of IDEA for the State’s early intervention program. Specifically, the Department considered the totality of the information available about a State, including information related to the State’s FFY 2014 SPP/APR, Indicator C3 Child Outcomes data (Outcomes data), and other data reported in each State’s FFY 2014 SPP/APR; information from monitoring and other publicly available information, such as Special Conditions on the State’s grant award under Part C; and other issues related to State compliance with IDEA. The Department evaluated States’ data using the Results Driven Accountability (RDA) Matrix which was individualized for each State and included each State’s Compliance Score, Results Score, and RDA Percentage and Determination.
2019 Part B Determinations
As it did in 2014 through 2018, the Department used both a Compliance Matrix and a Results Matrix in the context of the RDA framework in making the Part B determinations in 2019 for the 50 States, the District of Columbia, and Puerto Rico. For the first time in 2018, and again in 2019, sufficient results data were available for the three freely associated states, four outlying areas, and the Bureau of Indian Education. However, different results standards were used for these jurisdictions; therefore, the Results Matrix is described separately for them.
208
Part B Compliance Matrix and Score
The Compliance Matrix used for each of the States considered the following data:
1. The State’s FFY 2017 data for Part B Compliance Indicators 4B, 9, 10, 11, 12, and 13 (including whether the State reported valid and reliable data for each indicator), and whether the State demonstrated correction of all findings of noncompliance that it had identified in FFY 2016 under such indicators;
2. The timeliness and accuracy of data reported by the State under Sections 616 and 618 of IDEA;
3. The State’s FFY 2017 data, reported under Section 618 of IDEA, for the timeliness of State complaint and due process hearing decisions; and
4. Longstanding Noncompliance, for which the Department considered—
a. Whether the Department imposed Specific Conditions on the State’s FFY 2018 IDEA Part B grant award and those Specific Conditions were in effect at the time of the 2019 determination, and the number of years for which the State’s Part B grant award had been subject to Specific or Special Conditions; and
b. Whether there were any findings of noncompliance identified in FFY 2015 or earlier by either the Department or the State that the State had not yet corrected.
Using the Compliance Matrix, a State was assigned a score of 0, 1, or 2 for each of the compliance indicators in item 1 above and for the additional factors listed in items 2 through 4 above. Using the cumulative possible number of points as the denominator and the actual points the State received in its scoring under these factors as the numerator, the Compliance Matrix reflected a Compliance Score.
Part B Results Matrix and Score for the 50 States, the District of Columbia, and Puerto Rico
The Results Matrix used for the 50 States, the District of Columbia, and Puerto Rico considered the following data:
1. The percentages of fourth-grade children with disabilities participating in regular statewide assessments in math and reading;
2. The percentages of eighth-grade children with disabilities participating in regular statewide assessments in math and reading;
3. The percentages of fourth-grade children with disabilities scoring at basic or above on the NAEP in math and reading;
4. The percentages of fourth-grade children with disabilities included in NAEP testing in math and reading;
209
5. The percentages of eighth-grade children with disabilities scoring at basic or above on the NAEP in math and reading;
6. The percentages of eighth-grade children with disabilities included in NAEP testing in math and reading;
7. The percentage of children with disabilities exiting school by dropping out; and
8. The percentage of children with disabilities exiting school by graduating with a regular high school diploma.
Using the Results Matrix, a State was assigned a score as follows for the results elements listed above.
• A State’s participation rate on regular statewide assessments was assigned a score of 2, 1, or 0 based on an analysis of the participation rates across all States (i.e., all 50 States, the District of Columbia, Puerto Rico, freely associated states, outlying areas, and the Bureau of Indian Education). A score of 2 was assigned if at least 90 percent of children with disabilities participated in the regular statewide assessment, a score of 1 was assigned if the participation rate for children with disabilities was 80 percent to 89 percent, and a score of 0 was assigned if the participation rate for children with disabilities was less than 80 percent.
• A State’s NAEP score (basic and above) was rank-ordered. The top third of States received a score of 2, the middle third of States received a score of 1, and the bottom third of States received a score of 0.
• A State’s NAEP inclusion rate was assigned a score of either 0 or 1 based on whether the State’s NAEP inclusion rate for children with disabilities was “higher than or not significantly different from the National Assessment Governing Board [NAGB] goal of 85 percent.” Standard error estimates were reported with the inclusion rates of children with disabilities and taken into account in determining if a State’s inclusion rate was higher than or not significantly different from the NAGB goal of 85 percent.
• A State’s data on the percentage of children with disabilities who exited school by dropping out were rank-ordered. The top third of States (i.e., those with the lowest percentage) received a score of 2, the middle third of States received a score of 1, and the bottom third of States (i.e., those with the highest percentage) received a score of 0.
• A State’s data on the percentage of children with disabilities who exited school by graduating with a regular high school diploma were rank-ordered. The top third of States (i.e., those with the highest percentage) received a score of 2, the middle third of States received a score of 1, and the bottom third of States (i.e., those with the lowest percentage) received a score of 0.
Using the cumulative possible number of points as the denominator and the actual points the State received in its scoring under the results elements as the numerator, the Results Matrix reflected a Results Score.
210
Part B Results Matrix and Score for the Three Freely Associated States, Four Outlying Areas, and the Bureau of Indian Education
The Results Matrix used for each of the three freely associated states, four outlying areas, and the Bureau of Indian Education considered the following data:
1. The percentages of children with disabilities participating in regular statewide assessments in math and reading across all available grade levels (3 through 8);
2. The percentage of children with disabilities exiting school by dropping out; and
3. The percentage of children with disabilities exiting school by graduating with a regular high school diploma.
Using the Results Matrix, a State was assigned a score as follows for the results elements listed above.
• A State’s participation rate on regular statewide assessments was assigned a score of 2, 1, or 0 based on an analysis of the participation rates across all States. A score of 2 was assigned if at least 90 percent of children with disabilities participated in the regular statewide assessment, a score of 1 was assigned if the participation rate for children with disabilities was 80 percent to 89 percent, and a score of 0 was assigned if the participation rate for children with disabilities was less than 80 percent.
• The States’ data on the percentage of children with disabilities who exited school by dropping out were rank-ordered. The top third of States (i.e., those with the lowest percentage) received a score of 2, the middle third of States received a score of 1, and the bottom third of States (i.e., those with the highest percentage) received a score of 0.
• The States’ data on the percentage of children with disabilities who exited school by graduating with a regular high school diploma were rank-ordered. The top third of States (i.e., those with the highest percentage) received a score of 2, the middle third of States received a score of 1, and the bottom third of States (i.e., those with the lowest percentage) received a score of 0.
Using the cumulative possible number of points as the denominator and the actual points the State received in its scoring under the results elements as the numerator, the Results Matrix reflected a Results Score.
Part B RDA Percentage
For each of the 50 States, the District of Columbia, and Puerto Rico, the RDA Percentage was calculated by adding 50 percent of the State’s Results Score and 50 percent of the State’s Compliance Score. For each of the three freely associated states, four outlying areas, and the Bureau of Indian Education, the RDA Percentage was calculated by adding 40 percent of the State’s Results Score and 60
211
percent of the State’s Compliance Score. Each State’s RDA Percentage was used to calculate the 2019 Part B determination, as follows:
1. Meets Requirements: A State’s 2019 RDA Determination was Meets Requirements if the RDA Percentage was at least 80 percent, unless the Department had imposed Special or Specific Conditions on the State’s last three IDEA Part B grant awards (i.e., for FFYs 2016, 2017, and 2018), and those Specific Conditions were in effect at the time of the 2019 determination.
2. Needs Assistance: A State’s 2019 RDA Determination was Needs Assistance if the RDA Percentage was at least 60 percent but less than 80 percent. A State also would be Needs Assistance if its RDA Percentage was 80 percent or above, but the Department had imposed Special or Specific Conditions on the State’s last three IDEA Part B grant awards (i.e., for FFYs 2016, 2017, and 2018), and those Specific Conditions were in effect at the time of the 2019 determination.
3. Needs Intervention: A State’s 2019 RDA Determination was Needs Intervention if the RDA Percentage was less than 60 percent.
4. Needs Substantial Intervention: The Department did not make a determination of Needs Substantial Intervention for any State in 2019.
2019 Part C Determinations
In 2019, as part of its RDA framework, the Department continued to use both compliance and results data in making each State’s Part C determination under Sections 616(d) and 642 of IDEA for the State’s early intervention program. Specifically, the Department considered the totality of the information available about a State, including information related to the State’s FFY 2017 SPP/APR, Indicator C3 Child Outcomes data (Outcomes data), and other data reported in each State’s FFY 2017 SPP/APR; information from monitoring and other publicly available information, such as Special Conditions on the State’s grant award under Part C; and other issues related to State compliance with IDEA. The RDA Matrix was individualized for each State and included each State’s Compliance Score, Results Score, and RDA Percentage and Determination.
Part C Compliance Matrix and Score
In making each State’s 2019 Part C determination, the Department used a Compliance Matrix that considered the following compliance data:
1. The State’s FFY 2017 data for Part C Compliance Indicators 1, 7, 8a, 8b, and 8c (including whether the State reported valid and reliable data for each indicator), and whether the State demonstrated correction of all findings of noncompliance it had identified in FFY 2015 under such indicators;
212
2. The timeliness and accuracy of data reported by the State under Sections 616, 618, and 642 of IDEA;
3. The State’s FFY 2017 data, reported under Section 618 of IDEA, for the timeliness of State complaint and due process hearing decisions; and
4. Longstanding Noncompliance, for which the Department considered—
a. Whether the Department imposed Special Conditions on the State’s FFY 2018 IDEA Part C grant award and those Special Conditions were in effect at the time of the 2019 determination, and the number of years for which the State’s Part C grant award had been subject to Special Conditions; and
b. Whether there were any findings of noncompliance identified in FFY 2015 or earlier by either the Department or the State that the State had not yet corrected.
Using the Compliance Matrix, a State was assigned a score of 0, 1, or 2 for each of the compliance indicators in item 1 above and for each of the additional factors listed in items 2 through 4 above. Using the cumulative possible number of points as the denominator and the actual points the State received in its scoring under these factors as the numerator, the Compliance Matrix reflected a Compliance Score.
Part C Results and Score
In making each State’s 2019 Part C determination, the Department used the FFY 2017 early childhood outcomes data that were reported under SPP/APR Indicator 3. Results elements related to data quality and child performance were considered in calculating the results scores in the manner described below.
Data quality was examined in terms of the completeness of the FFY 2016 Outcomes data and data anomalies identified within the State’s FFY 2017 Outcomes data compared to four years of historic data, as follows:
(a) Data Completeness: The data completeness score was calculated using the total number of Part C children who were included in the State’s FFY 2017 Outcomes data and the total number of children whom the State reported exiting during FFY 2017 in its FFY 2017 IDEA Section 618 Exiting data. Each State received a percentage that was computed by dividing the number of children reported in the State’s FFY 2017 Outcomes data by the number of children whom the State reported as exiting during FFY 2017 in the State’s FFY 2017 IDEA Section 618 Exiting data. This percentage was used to score data completeness, as follows: a State received a score of 2 if the percentage was at least 65 percent, a score of 1 if the percentage was between 34 percent and 64 percent, and a score of 0 if the percentage was less than 34 percent. The two States with approved sampling plans received a score of 2.
213
(b) Data Anomalies: The data anomalies score for each State represented a summary of the data anomalies in the State’s FFY 2017 Outcomes data. Previous publicly available data reported by and across all States for Indicator 3 (in the APRs for FFY 2013 through FFY 2016) were used to determine an expected range of responses for each progress category under the following three child outcome areas: 3a (positive social-emotional skills, including social relationships), 3b (acquisition and use of knowledge and skills, including early language/communication), and 3c (use of appropriate behaviors to meet their needs). The following five progress categories were used under SPP/APR Indicator 3 for each of the three outcomes:
a. Percentage of infants and toddlers who did not improve functioning;
b. Percentage of infants and toddlers who improved functioning but not sufficient to move nearer to functioning comparable to same-aged peers;
c. Percentage of infants and toddlers who improved functioning to a level nearer to same-aged peers but did not reach it;
d. Percentage of infants and toddlers who improved functioning to reach a level comparable to same-aged peers; and
e. Percentage of infants and toddlers who maintained functioning at a level comparable to same-aged peers.
For each of the five progress categories for each of the three outcomes, a mean was calculated using publicly available data. A lower and upper scoring percentage was set at one standard deviation above and below the mean for the first progress category and two standard deviations above and below the mean for the other four progress categories. In cases where a State’s FFY 2017 score for a progress category was below the calculated “low percentage” or above the “high percentage” for that progress category for all States, the data in that particular category were considered an anomaly for that progress category. If a State’s score in a particular progress category was identified as an anomaly, the State received a score of 0 for that category. A percentage that was equal to or between the low percentage and high percentage for each progress category received 1 point. Hence, a State could receive a total number of points between 0 and 15. Thus, a point total of 0 indicated that all 15 progress categories contained data anomalies, and a point total of 15 indicated that there were no data anomalies in all 15 progress categories. An overall data anomalies score of 0, 1, or 2 was based on the total points awarded. Each State received a data anomalies score of 2 if the total number of points received in all progress categories was 13 through 15, a data anomalies score of 1 if the point total was 10 through 12, and a data anomalies score of 0 if the point total was 0 through 9.
214
Child performance was measured by examining how each State’s FFY 2017 Outcomes data compared with all other States’ FFY 2017 Outcomes data and examining the State’s performance change over time, which involved comparing each State’s FFY 2017 Outcomes data with its own FFY 2016 Outcomes data. The calculation of each of these results elements and scoring is further described below.
Data Comparison: The data comparison overall performance score represented how a State’s FFY 2017 Outcomes data compared with other States’ FFY 2017 Outcomes data. Each State received two scores for each of the three child outcome areas (3a, 3b, and 3c). Specifically, States were scored for each outcome in terms of the following two summary statements: (1) Of those infants and toddlers who entered or exited early intervention below age expectations for the Outcome, the percentage who substantially increased their rate of growth by the time they turned 3 years of age or exited the program and (2) the percentage of infants and toddlers who were functioning within age expectations for the Outcome by the time they turned 3 years of age or exited the program. The State’s score on each of the resulting six summary statements was compared to the distribution of scores for the same summary statement for all States. The 10th and 90th percentiles for each of the six summary statements were identified and used to assign points to performance outcome data for each summary statement. Each summary statement outcome was assigned 0, 1, or 2 points, as follows. If a State’s summary statement value fell at or below the 10th percentile, that summary statement was assigned a 0 or no points. If a State’s summary statement value fell between the 10th and 90th percentiles, the summary statement was assigned 1 point. If a State’s summary statement value fell at or above the 90th percentile, the summary statement was assigned 2 points. The points were added across the six summary statements. A State could receive between 0 and 12 total points, with a point total of 0 indicating all six summary statement values were below the 10th percentile and a point total of 12 indicating all six summary statements were above the 90th percentile. An overall comparison summary statement score of 0, 1, or 2 was assigned based on the total points awarded, as follows. States receiving a total of 9 through 12 points were assigned a score of 2, States receiving a total of 5 through 8 points were assigned a score of 1, and States receiving a total of 4 points or less were assigned a score of 0.
Performance Change Over Time: The Overall Performance Change Score represented how each State’s FFY 2017 Outcomes data compared with its FFY 2016 Outcomes data and whether the State’s data demonstrated progress. The data in each Outcome Area were assigned a value of 0 if there was a statistically significant decrease from one year to the next, a value of 1 if there was no significant change, and a value of 2 if there was a statistically significant increase. The scores from all six Outcome Areas were totaled, resulting in a total number of points ranging from 0 to 12. The Overall Performance Change Score for this results element of 0, 1, or 2 for each State was based on the total points awarded. Each State
215
received an Overall Performance Change Score of 2 if the point total was 8 or above, a score of 1 if the point total was 4 through 7, and a score of 0 if the point total was 3 points or below.
Using the cumulative possible number of points as the denominator and the actual points the State received in its scoring under these factors as the numerator, the Results Score was calculated.
Part C RDA Percentage and Determination
Each State’s RDA Percentage was calculated by adding 50 percent of the State’s Results Score and 50 percent of the State’s Compliance Score. Based on the RDA Percentage, the State’s RDA Determination was defined as follows:
1. Meets Requirements: A State’s 2019 RDA Determination was Meets Requirements if the RDA Percentage was at least 80 percent, unless the Department had imposed Special Conditions on the State’s last three IDEA Part C grant awards (i.e., for FFYs 2016, 2017, and 2018), and those Special Conditions were in effect at the time of the 2019 determination.
2. Needs Assistance: A State’s 2019 RDA Determination was Needs Assistance if the RDA Percentage was at least 60 percent but less than 80 percent. A State was also Needs Assistance if its RDA Percentage was 80 percent or above, but the Department had imposed Special Conditions on the State’s last three IDEA Part C grant awards (i.e., for FFYs 2016, 2017, and 2018), and those Special Conditions were in effect at the time of the 2019 determination.
3. Needs Intervention: A State’s 2019 RDA Determination was Needs Intervention if the RDA Percentage was less than 60 percent.
4. Needs Substantial Intervention: The Department did not make a determination of Needs Substantial Intervention for any State in 2019.
Enforcement
Sections 616(e) and 642 of IDEA require, under certain circumstances, that the Secretary take an enforcement action(s) based on a State’s determination under Section 616(d)(2)(A). Specifically, the Secretary must take action (1) when the Department has determined that a State needs assistance for two or more consecutive years, (2) when the Department has determined that a State needs intervention for three or more consecutive years, or (3) at any time when the Secretary determines that a State needs substantial intervention in implementing the requirements of IDEA or that there is a substantial failure to comply with any condition of a State’s eligibility under IDEA. The Department has taken enforcement actions based on the first two categories mentioned, but to date, no State has received a determination that it needs substantial intervention in implementing the requirements of IDEA.
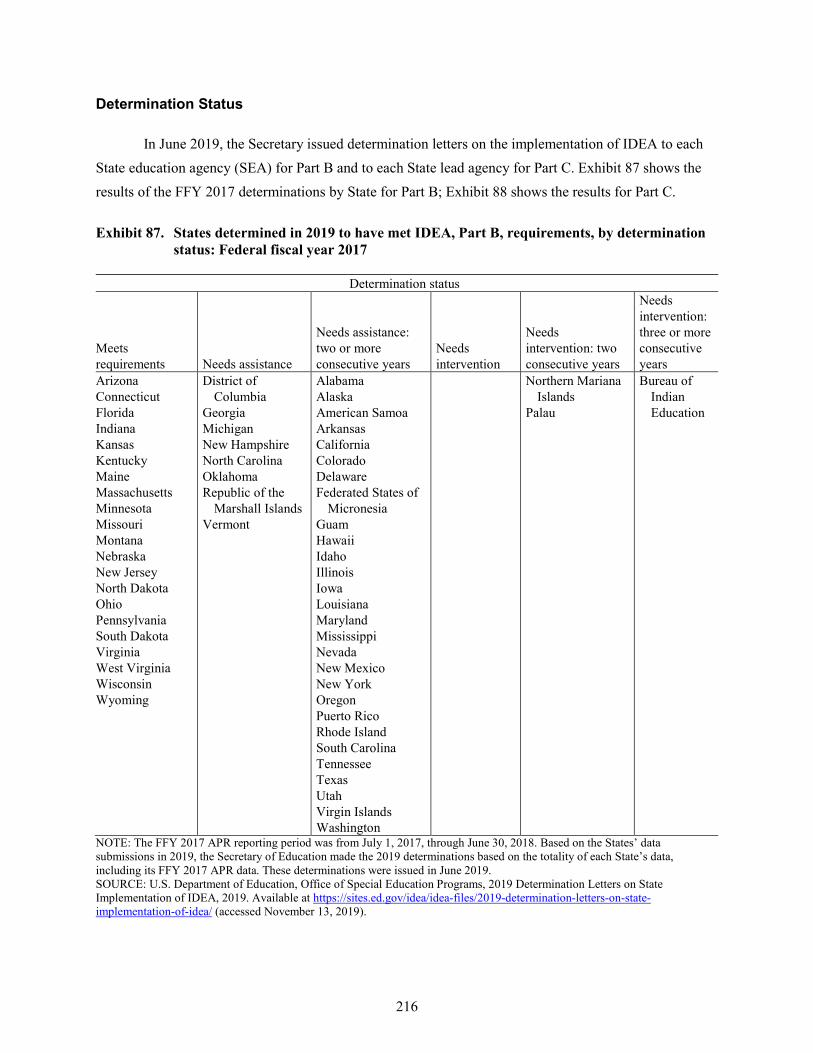
216
Determination Status
In June 2019, the Secretary issued determination letters on the implementation of IDEA to each State education agency (SEA) for Part B and to each State lead agency for Part C. Exhibit 87 shows the results of the FFY 2017 determinations by State for Part B; Exhibit 88 shows the results for Part C.
Exhibit 87. States determined in 2019 to have met IDEA, Part B, requirements, by determination status: Federal fiscal year 2017
Determination status
Meets requirements Needs assistance
Needs assistance: two or more consecutive years
Needs intervention
Needs intervention: two consecutive years
Needs intervention: three or more consecutive years
Arizona Connecticut Florida Indiana Kansas Kentucky Maine Massachusetts Minnesota Missouri Montana Nebraska New Jersey North Dakota Ohio Pennsylvania South Dakota Virginia West Virginia Wisconsin Wyoming
District of Columbia
Georgia Michigan New Hampshire North Carolina Oklahoma Republic of the
Marshall Islands Vermont
Alabama Alaska American Samoa Arkansas California Colorado Delaware Federated States of
Micronesia Guam Hawaii Idaho Illinois Iowa Louisiana Maryland Mississippi Nevada New Mexico New York Oregon Puerto Rico Rhode Island South Carolina Tennessee Texas Utah Virgin Islands Washington
Northern Mariana Islands
Palau
Bureau of Indian Education
NOTE: The FFY 2017 APR reporting period was from July 1, 2017, through June 30, 2018. Based on the States’ data submissions in 2019, the Secretary of Education made the 2019 determinations based on the totality of each State’s data, including its FFY 2017 APR data. These determinations were issued in June 2019. SOURCE: U.S. Department of Education, Office of Special Education Programs, 2019 Determination Letters on State Implementation of IDEA, 2019. Available at https://sites.ed.gov/idea/idea-files/2019-determination-letters-on-state-implementation-of-idea/ (accessed November 13, 2019).
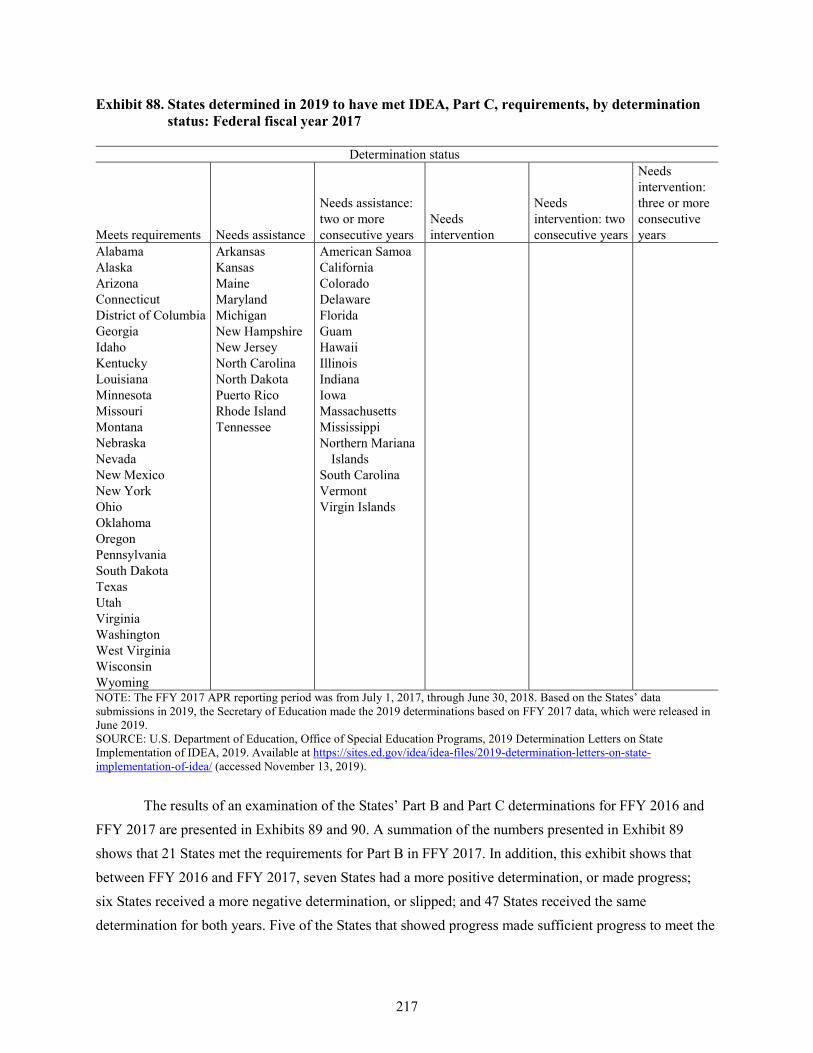
217
Exhibit 88. States determined in 2019 to have met IDEA, Part C, requirements, by determination status: Federal fiscal year 2017
Determination status
Meets requirements Needs assistance
Needs assistance: two or more consecutive years
Needs intervention
Needs intervention: two consecutive years
Needs intervention: three or more consecutive years
Alabama Alaska Arizona Connecticut District of Columbia Georgia Idaho Kentucky Louisiana Minnesota Missouri Montana Nebraska Nevada New Mexico New York Ohio Oklahoma Oregon Pennsylvania South Dakota Texas Utah Virginia Washington West Virginia Wisconsin Wyoming
Arkansas Kansas Maine Maryland Michigan New Hampshire New Jersey North Carolina North Dakota Puerto Rico Rhode Island Tennessee
American Samoa California Colorado Delaware Florida Guam Hawaii Illinois Indiana Iowa Massachusetts Mississippi Northern Mariana
Islands South Carolina Vermont Virgin Islands
NOTE: The FFY 2017 APR reporting period was from July 1, 2017, through June 30, 2018. Based on the States’ data submissions in 2019, the Secretary of Education made the 2019 determinations based on FFY 2017 data, which were released in June 2019. SOURCE: U.S. Department of Education, Office of Special Education Programs, 2019 Determination Letters on State Implementation of IDEA, 2019. Available at https://sites.ed.gov/idea/idea-files/2019-determination-letters-on-state-implementation-of-idea/ (accessed November 13, 2019).
The results of an examination of the States’ Part B and Part C determinations for FFY 2016 and FFY 2017 are presented in Exhibits 89 and 90. A summation of the numbers presented in Exhibit 89 shows that 21 States met the requirements for Part B in FFY 2017. In addition, this exhibit shows that between FFY 2016 and FFY 2017, seven States had a more positive determination, or made progress; six States received a more negative determination, or slipped; and 47 States received the same determination for both years. Five of the States that showed progress made sufficient progress to meet the

218
requirements in FFY 2017. Of the 47 States that received the same determination status in both years, 16 met the requirements in both years, 28 were found to be in need of assistance for another year, and two were determined to be in need of intervention for two consecutive years, and one was in need of intervention for three or more consecutive years.
Exhibit 89. Number of States determined in 2018 and 2019 to have met IDEA, Part B, requirements, by determination status and change in status: Federal fiscal years 2016 and 2017
Determination status FFY 2017 Change in determination status since
FFY 2016 Total Progress Slippage No change
Total 7 6 47 60
Meets requirements 5 0 16 21
Needs assistance 2 6 0 8
Needs assistance: two or more consecutive years 0 0 28 28
Needs intervention 0 0 0 0
Needs intervention: two consecutive years 0 0 2 2
Needs intervention: three or more consecutive years 0 0 1 1 NOTE: The FFY 2016 APR reporting period was from July 1, 2016, through June 30, 2017. Based on the States’ FFY 2016 data submissions in 2018, the Secretary of Education made the 2018 determinations, which were released in June 2018. The FFY 2017 APR reporting period was from July 1, 2017, through June 30, 2018. Based on the States’ FFY 2017 data submissions in 2019, the Secretary of Education made the 2019 determinations, which were released in June 2019. The 50 States, the District of Columbia, Puerto Rico, the Bureau of Indian Education, American Samoa, Guam, the Northern Mariana Islands, the Virgin Islands, the Federated States of Micronesia, the Republic of Palau, and the Republic of the Marshall Islands are included in this exhibit. SOURCE: U.S. Department of Education, Office of Special Education Programs, 2019 Determination Letters on State Implementation of IDEA, 2019. Available at https://sites.ed.gov/idea/idea-files/2019-determination-letters-on-state-implementation-of-idea/ (accessed November 13, 2019).
A summation of the numbers presented in Exhibit 90 shows that 28 States met the requirements for Part C in FFY 2017. In addition, this exhibit shows that between FFY 2016 and FFY 2017, nine States had a more positive determination, or made progress; 12 States received a more negative determination, or slipped; and 35 States received the same determination for both years. Of the 35 States that received the same determination status in both years, 19 met the requirements in both years, and 16 were found to be in need of assistance for another year.
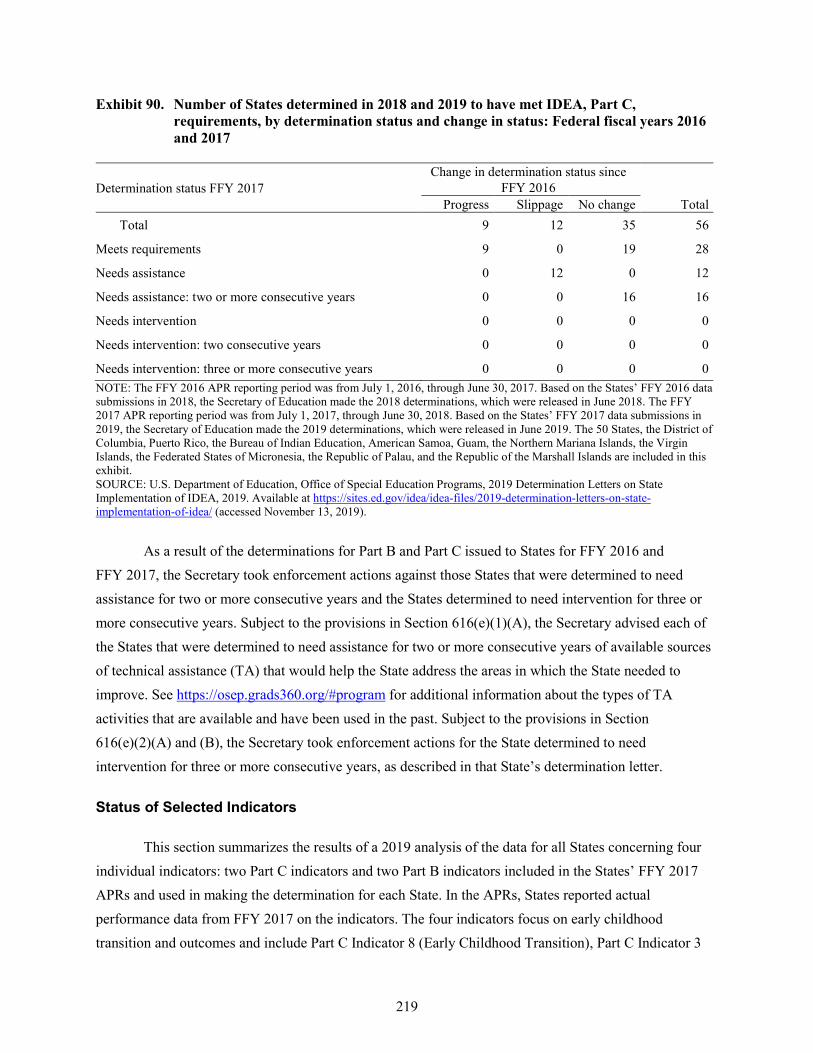
219
Exhibit 90. Number of States determined in 2018 and 2019 to have met IDEA, Part C, requirements, by determination status and change in status: Federal fiscal years 2016 and 2017
Determination status FFY 2017 Change in determination status since
FFY 2016 Total Progress Slippage No change
Total 9 12 35 56
Meets requirements 9 0 19 28
Needs assistance 0 12 0 12
Needs assistance: two or more consecutive years 0 0 16 16
Needs intervention 0 0 0 0
Needs intervention: two consecutive years 0 0 0 0
Needs intervention: three or more consecutive years 0 0 0 0 NOTE: The FFY 2016 APR reporting period was from July 1, 2016, through June 30, 2017. Based on the States’ FFY 2016 data submissions in 2018, the Secretary of Education made the 2018 determinations, which were released in June 2018. The FFY 2017 APR reporting period was from July 1, 2017, through June 30, 2018. Based on the States’ FFY 2017 data submissions in 2019, the Secretary of Education made the 2019 determinations, which were released in June 2019. The 50 States, the District of Columbia, Puerto Rico, the Bureau of Indian Education, American Samoa, Guam, the Northern Mariana Islands, the Virgin Islands, the Federated States of Micronesia, the Republic of Palau, and the Republic of the Marshall Islands are included in this exhibit. SOURCE: U.S. Department of Education, Office of Special Education Programs, 2019 Determination Letters on State Implementation of IDEA, 2019. Available at https://sites.ed.gov/idea/idea-files/2019-determination-letters-on-state-implementation-of-idea/ (accessed November 13, 2019).
As a result of the determinations for Part B and Part C issued to States for FFY 2016 and FFY 2017, the Secretary took enforcement actions against those States that were determined to need assistance for two or more consecutive years and the States determined to need intervention for three or more consecutive years. Subject to the provisions in Section 616(e)(1)(A), the Secretary advised each of the States that were determined to need assistance for two or more consecutive years of available sources of technical assistance (TA) that would help the State address the areas in which the State needed to improve. See https://osep.grads360.org/#program for additional information about the types of TA activities that are available and have been used in the past. Subject to the provisions in Section 616(e)(2)(A) and (B), the Secretary took enforcement actions for the State determined to need intervention for three or more consecutive years, as described in that State’s determination letter.
Status of Selected Indicators
This section summarizes the results of a 2019 analysis of the data for all States concerning four individual indicators: two Part C indicators and two Part B indicators included in the States’ FFY 2017 APRs and used in making the determination for each State. In the APRs, States reported actual performance data from FFY 2017 on the indicators. The four indicators focus on early childhood transition and outcomes and include Part C Indicator 8 (Early Childhood Transition), Part C Indicator 3
220
(Infant and Toddler Outcomes), Part B Indicator 12 (Early Childhood Transition), and Part B Indicator 7 (Preschool Outcomes). The two early childhood transition indicators and the two outcome indicators were chosen for examination in this section because their data and the results of the 2019 analyses were sufficiently complete to show how States performed on related Part C and Part B indicators, and they concern areas that are not addressed by data presented elsewhere in this report. This section summarizes States’ FFY 2017 actual performances on each indicator. Two documents, 2019 Part C FFY 2017 SPP/APR Indicator Analysis Booklet (available online at https://osep.grads360.org/#communities/pdc/documents/18280) and 2019 Part B FFY 2017 SPP/APR Indicator Analysis Booklet (available online at https://osep.grads360.org/#communities/pdc/documents/18278), were used as the sources for the summaries of the results of the analysis of these indicators. Both sources were accessed on October 10, 2019.
Early Childhood Transition: Part C Indicator 8
Part C Indicator 8, which is composed of three sub-indicators, measures the percentage of all children exiting Part C who received timely transition planning to support their transition from the IDEA, Part C early intervention program to preschool and other appropriate community services by the child’s third birthday. Timely transition planning is measured by the following three sub-indicators: (a) individualized family service plans (IFSPs) with transition steps and services; (b) notification to the local education agency (LEA) and State education agency (SEA), if the child is potentially eligible for Part B; and (c) transition conference, if the child is potentially eligible for Part B. Indicator 8 is a compliance indicator, and its three sub-indicators (8a, 8b, and 8c) have performance targets of 100 percent. These sub-indicators apply to the 50 States, the District of Columbia (DC), Puerto Rico (PR), American Samoa, Guam, the Northern Mariana Islands, and the Virgin Islands. Exhibit 91 displays the results of a 2019 analysis of FFY 2017 actual performance data on the three sub-indicators from the States for which Indicator 8 applies.
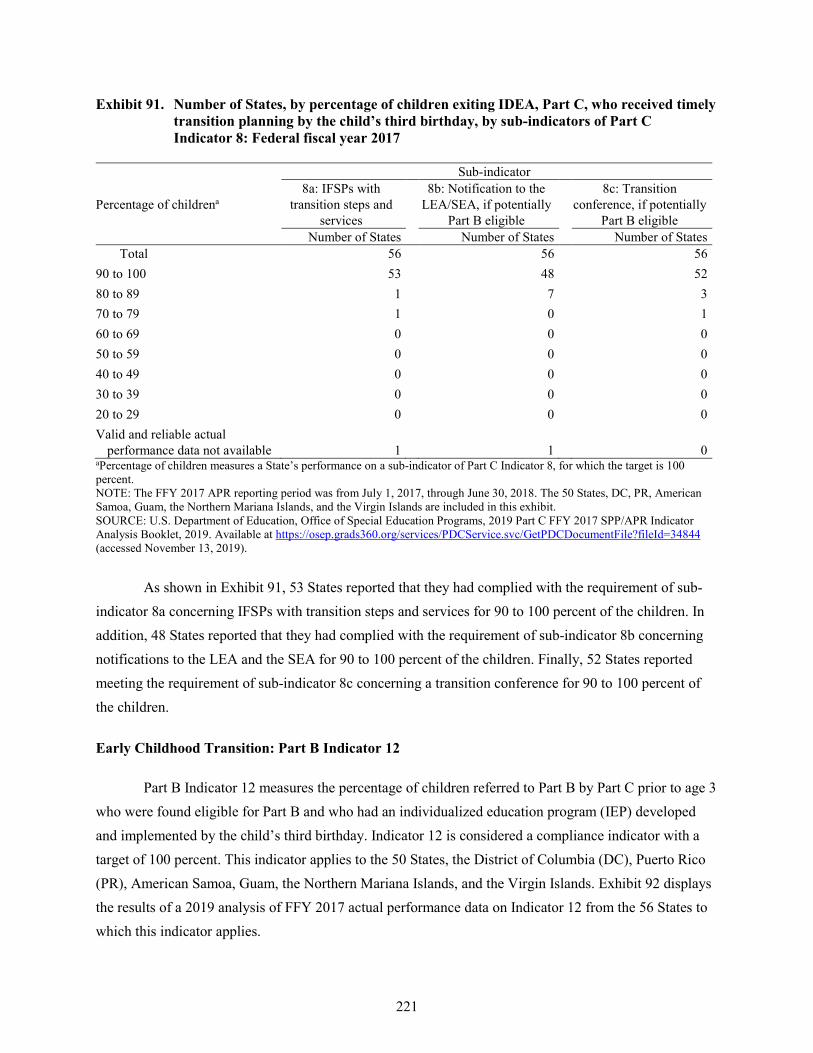
221
Exhibit 91. Number of States, by percentage of children exiting IDEA, Part C, who received timely transition planning by the child’s third birthday, by sub-indicators of Part C Indicator 8: Federal fiscal year 2017
Percentage of childrena
Sub-indicator 8a: IFSPs with
transition steps and services
8b: Notification to the LEA/SEA, if potentially
Part B eligible
8c: Transition conference, if potentially
Part B eligible Number of States Number of States Number of States
Total 56 56 56 90 to 100 53 48 52 80 to 89 1 7 3 70 to 79 1 0 1 60 to 69 0 0 0 50 to 59 0 0 0 40 to 49 0 0 0 30 to 39 0 0 0 20 to 29 0 0 0 Valid and reliable actual
performance data not available 1 1 0 aPercentage of children measures a State’s performance on a sub-indicator of Part C Indicator 8, for which the target is 100 percent. NOTE: The FFY 2017 APR reporting period was from July 1, 2017, through June 30, 2018. The 50 States, DC, PR, American Samoa, Guam, the Northern Mariana Islands, and the Virgin Islands are included in this exhibit. SOURCE: U.S. Department of Education, Office of Special Education Programs, 2019 Part C FFY 2017 SPP/APR Indicator Analysis Booklet, 2019. Available at https://osep.grads360.org/services/PDCService.svc/GetPDCDocumentFile?fileId=34844(accessed November 13, 2019).
As shown in Exhibit 91, 53 States reported that they had complied with the requirement of sub-indicator 8a concerning IFSPs with transition steps and services for 90 to 100 percent of the children. In addition, 48 States reported that they had complied with the requirement of sub-indicator 8b concerning notifications to the LEA and the SEA for 90 to 100 percent of the children. Finally, 52 States reported meeting the requirement of sub-indicator 8c concerning a transition conference for 90 to 100 percent of the children.
Early Childhood Transition: Part B Indicator 12
Part B Indicator 12 measures the percentage of children referred to Part B by Part C prior to age 3 who were found eligible for Part B and who had an individualized education program (IEP) developed and implemented by the child’s third birthday. Indicator 12 is considered a compliance indicator with a target of 100 percent. This indicator applies to the 50 States, the District of Columbia (DC), Puerto Rico (PR), American Samoa, Guam, the Northern Mariana Islands, and the Virgin Islands. Exhibit 92 displays the results of a 2019 analysis of FFY 2017 actual performance data on Indicator 12 from the 56 States to which this indicator applies.
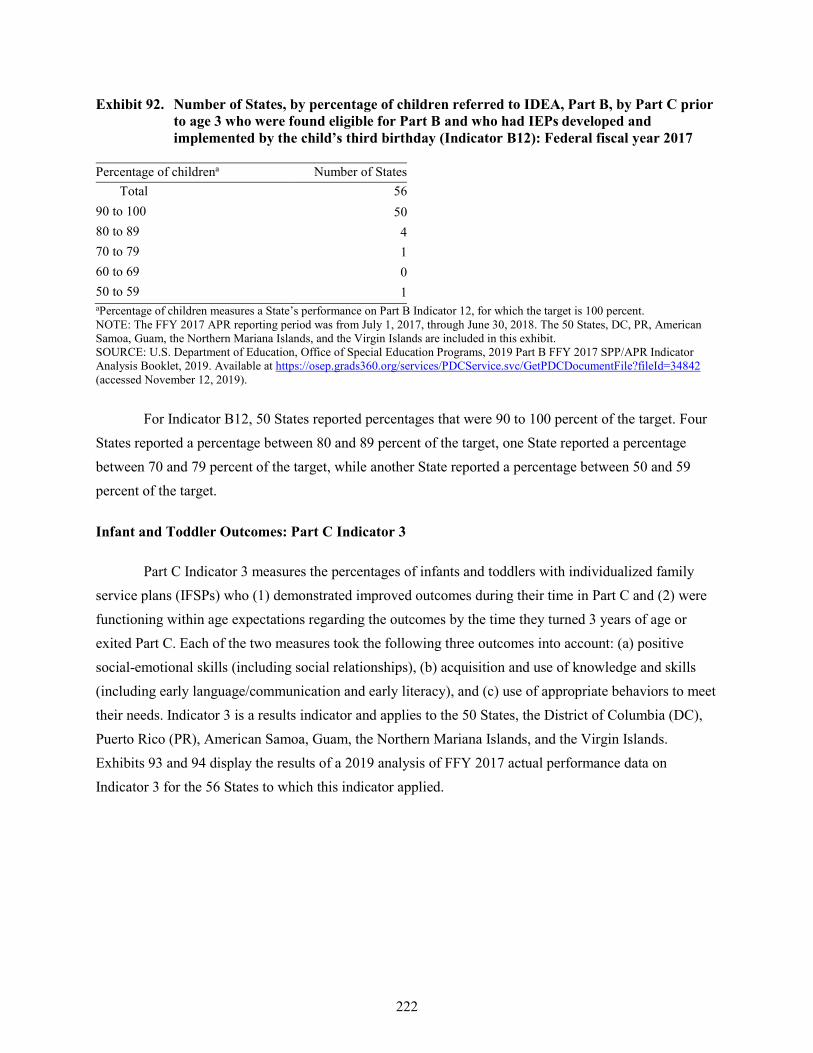
222
Exhibit 92. Number of States, by percentage of children referred to IDEA, Part B, by Part C prior to age 3 who were found eligible for Part B and who had IEPs developed and implemented by the child’s third birthday (Indicator B12): Federal fiscal year 2017
Percentage of childrena Number of States Total 56
90 to 100 50 80 to 89 4 70 to 79 1 60 to 69 0 50 to 59 1 aPercentage of children measures a State’s performance on Part B Indicator 12, for which the target is 100 percent. NOTE: The FFY 2017 APR reporting period was from July 1, 2017, through June 30, 2018. The 50 States, DC, PR, American Samoa, Guam, the Northern Mariana Islands, and the Virgin Islands are included in this exhibit. SOURCE: U.S. Department of Education, Office of Special Education Programs, 2019 Part B FFY 2017 SPP/APR Indicator Analysis Booklet, 2019. Available at https://osep.grads360.org/services/PDCService.svc/GetPDCDocumentFile?fileId=34842(accessed November 12, 2019).
For Indicator B12, 50 States reported percentages that were 90 to 100 percent of the target. Four States reported a percentage between 80 and 89 percent of the target, one State reported a percentage between 70 and 79 percent of the target, while another State reported a percentage between 50 and 59 percent of the target.
Infant and Toddler Outcomes: Part C Indicator 3
Part C Indicator 3 measures the percentages of infants and toddlers with individualized family service plans (IFSPs) who (1) demonstrated improved outcomes during their time in Part C and (2) were functioning within age expectations regarding the outcomes by the time they turned 3 years of age or exited Part C. Each of the two measures took the following three outcomes into account: (a) positive social-emotional skills (including social relationships), (b) acquisition and use of knowledge and skills (including early language/communication and early literacy), and (c) use of appropriate behaviors to meet their needs. Indicator 3 is a results indicator and applies to the 50 States, the District of Columbia (DC), Puerto Rico (PR), American Samoa, Guam, the Northern Mariana Islands, and the Virgin Islands. Exhibits 93 and 94 display the results of a 2019 analysis of FFY 2017 actual performance data on Indicator 3 for the 56 States to which this indicator applied.
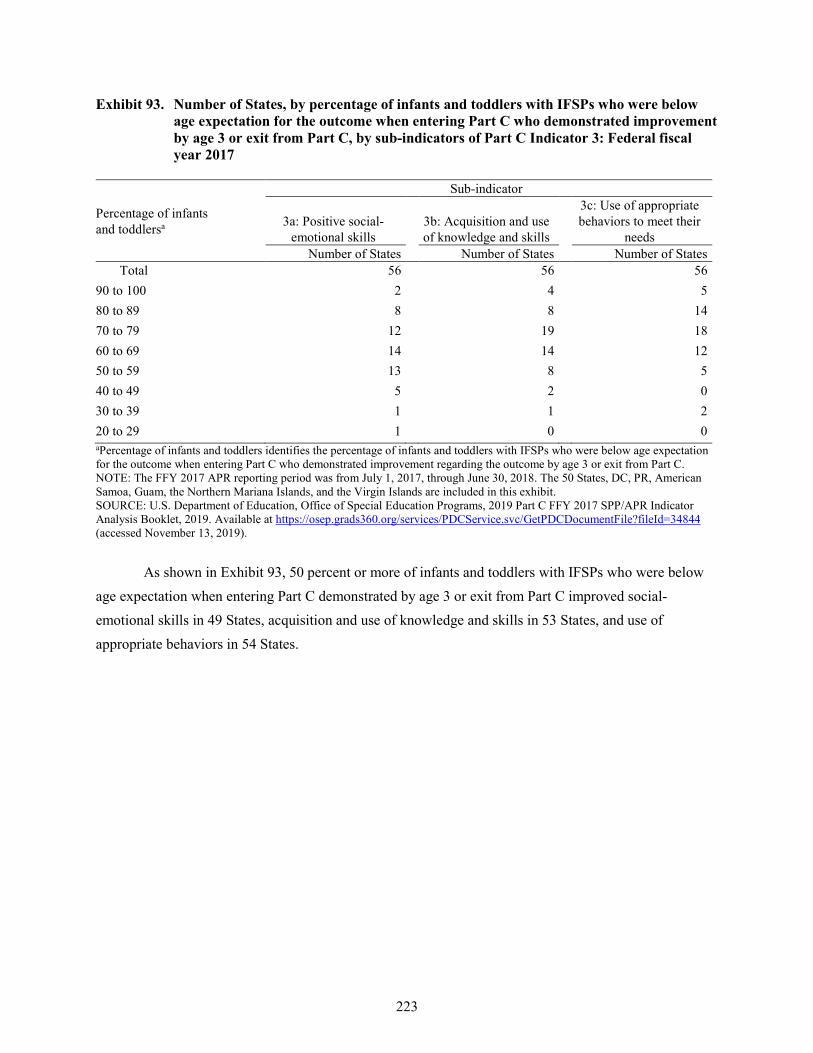
223
Exhibit 93. Number of States, by percentage of infants and toddlers with IFSPs who were below age expectation for the outcome when entering Part C who demonstrated improvement by age 3 or exit from Part C, by sub-indicators of Part C Indicator 3: Federal fiscal year 2017
Percentage of infants and toddlersa
Sub-indicator
3a: Positive social-emotional skills
3b: Acquisition and use of knowledge and skills
3c: Use of appropriate behaviors to meet their
needs Number of States Number of States Number of States
Total 56 56 56 90 to 100 2 4 5 80 to 89 8 8 14 70 to 79 12 19 18 60 to 69 14 14 12 50 to 59 13 8 5 40 to 49 5 2 0 30 to 39 1 1 2 20 to 29 1 0 0 aPercentage of infants and toddlers identifies the percentage of infants and toddlers with IFSPs who were below age expectation for the outcome when entering Part C who demonstrated improvement regarding the outcome by age 3 or exit from Part C. NOTE: The FFY 2017 APR reporting period was from July 1, 2017, through June 30, 2018. The 50 States, DC, PR, American Samoa, Guam, the Northern Mariana Islands, and the Virgin Islands are included in this exhibit. SOURCE: U.S. Department of Education, Office of Special Education Programs, 2019 Part C FFY 2017 SPP/APR Indicator Analysis Booklet, 2019. Available at https://osep.grads360.org/services/PDCService.svc/GetPDCDocumentFile?fileId=34844(accessed November 13, 2019).
As shown in Exhibit 93, 50 percent or more of infants and toddlers with IFSPs who were below age expectation when entering Part C demonstrated by age 3 or exit from Part C improved social-emotional skills in 49 States, acquisition and use of knowledge and skills in 53 States, and use of appropriate behaviors in 54 States.
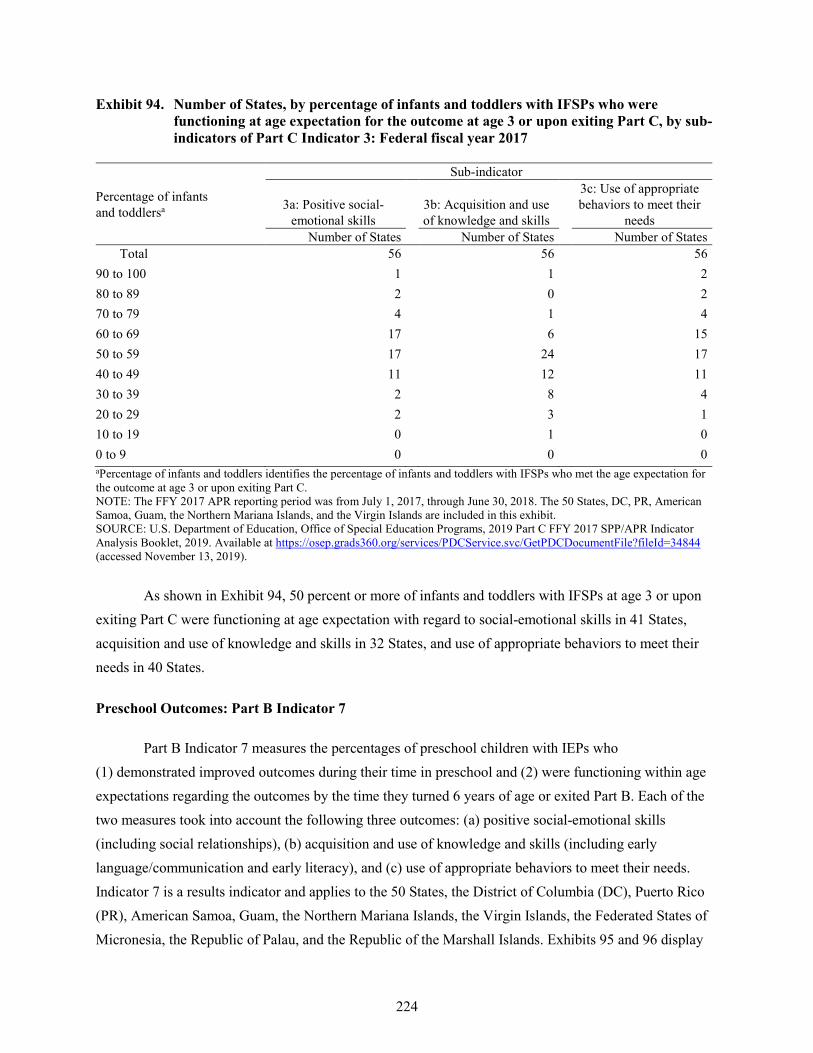
224
Exhibit 94. Number of States, by percentage of infants and toddlers with IFSPs who were functioning at age expectation for the outcome at age 3 or upon exiting Part C, by sub-indicators of Part C Indicator 3: Federal fiscal year 2017
Percentage of infants and toddlersa
Sub-indicator
3a: Positive social-emotional skills
3b: Acquisition and use of knowledge and skills
3c: Use of appropriate behaviors to meet their
needs Number of States Number of States Number of States
Total 56 56 56 90 to 100 1 1 2 80 to 89 2 0 2 70 to 79 4 1 4 60 to 69 17 6 15 50 to 59 17 24 17 40 to 49 11 12 11 30 to 39 2 8 4 20 to 29 2 3 1 10 to 19 0 1 0 0 to 9 0 0 0 aPercentage of infants and toddlers identifies the percentage of infants and toddlers with IFSPs who met the age expectation for the outcome at age 3 or upon exiting Part C. NOTE: The FFY 2017 APR reporting period was from July 1, 2017, through June 30, 2018. The 50 States, DC, PR, American Samoa, Guam, the Northern Mariana Islands, and the Virgin Islands are included in this exhibit. SOURCE: U.S. Department of Education, Office of Special Education Programs, 2019 Part C FFY 2017 SPP/APR Indicator Analysis Booklet, 2019. Available at https://osep.grads360.org/services/PDCService.svc/GetPDCDocumentFile?fileId=34844(accessed November 13, 2019).
As shown in Exhibit 94, 50 percent or more of infants and toddlers with IFSPs at age 3 or upon exiting Part C were functioning at age expectation with regard to social-emotional skills in 41 States, acquisition and use of knowledge and skills in 32 States, and use of appropriate behaviors to meet their needs in 40 States.
Preschool Outcomes: Part B Indicator 7
Part B Indicator 7 measures the percentages of preschool children with IEPs who (1) demonstrated improved outcomes during their time in preschool and (2) were functioning within age expectations regarding the outcomes by the time they turned 6 years of age or exited Part B. Each of the two measures took into account the following three outcomes: (a) positive social-emotional skills (including social relationships), (b) acquisition and use of knowledge and skills (including early language/communication and early literacy), and (c) use of appropriate behaviors to meet their needs. Indicator 7 is a results indicator and applies to the 50 States, the District of Columbia (DC), Puerto Rico (PR), American Samoa, Guam, the Northern Mariana Islands, the Virgin Islands, the Federated States of Micronesia, the Republic of Palau, and the Republic of the Marshall Islands. Exhibits 95 and 96 display
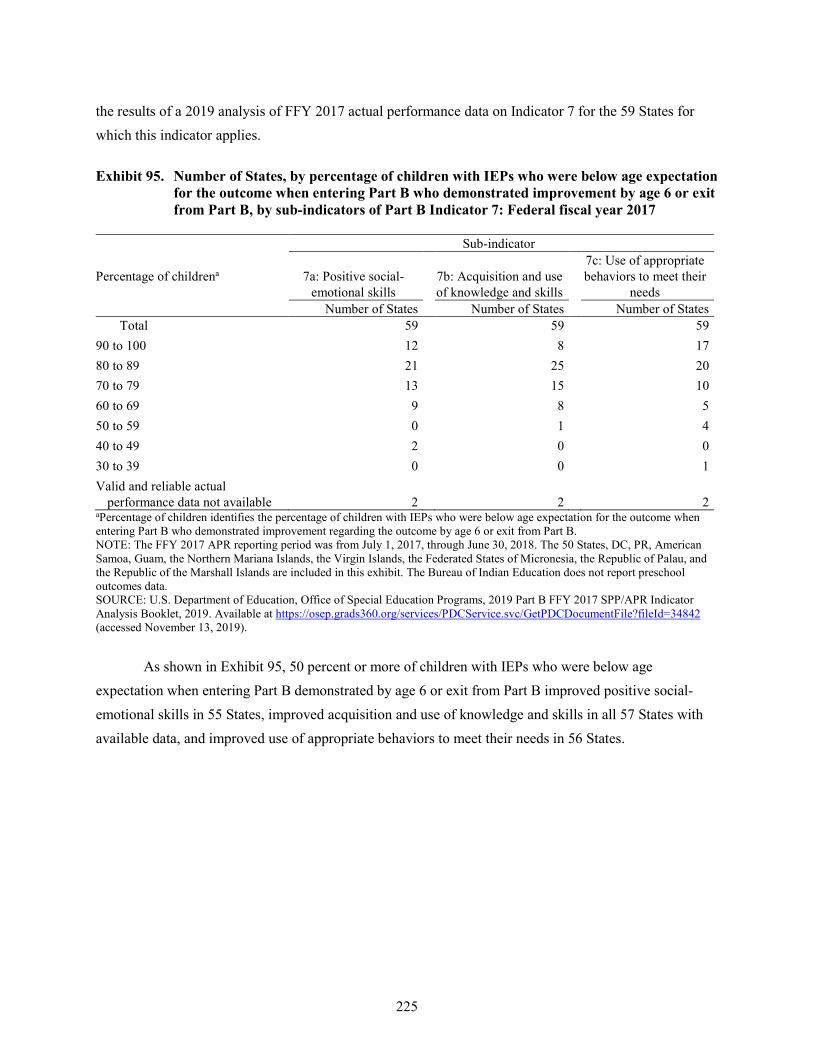
225
the results of a 2019 analysis of FFY 2017 actual performance data on Indicator 7 for the 59 States for which this indicator applies.
Exhibit 95. Number of States, by percentage of children with IEPs who were below age expectation for the outcome when entering Part B who demonstrated improvement by age 6 or exit from Part B, by sub-indicators of Part B Indicator 7: Federal fiscal year 2017
Percentage of childrena
Sub-indicator
7a: Positive social-emotional skills
7b: Acquisition and use of knowledge and skills
7c: Use of appropriate behaviors to meet their
needs Number of States Number of States Number of States
Total 59 59 59 90 to 100 12 8 17 80 to 89 21 25 20 70 to 79 13 15 10 60 to 69 9 8 5 50 to 59 0 1 4 40 to 49 2 0 0 30 to 39 0 0 1 Valid and reliable actual
performance data not available 2 2 2 aPercentage of children identifies the percentage of children with IEPs who were below age expectation for the outcome when entering Part B who demonstrated improvement regarding the outcome by age 6 or exit from Part B. NOTE: The FFY 2017 APR reporting period was from July 1, 2017, through June 30, 2018. The 50 States, DC, PR, American Samoa, Guam, the Northern Mariana Islands, the Virgin Islands, the Federated States of Micronesia, the Republic of Palau, and the Republic of the Marshall Islands are included in this exhibit. The Bureau of Indian Education does not report preschool outcomes data. SOURCE: U.S. Department of Education, Office of Special Education Programs, 2019 Part B FFY 2017 SPP/APR Indicator Analysis Booklet, 2019. Available at https://osep.grads360.org/services/PDCService.svc/GetPDCDocumentFile?fileId=34842(accessed November 13, 2019).
As shown in Exhibit 95, 50 percent or more of children with IEPs who were below age expectation when entering Part B demonstrated by age 6 or exit from Part B improved positive social-emotional skills in 55 States, improved acquisition and use of knowledge and skills in all 57 States with available data, and improved use of appropriate behaviors to meet their needs in 56 States.
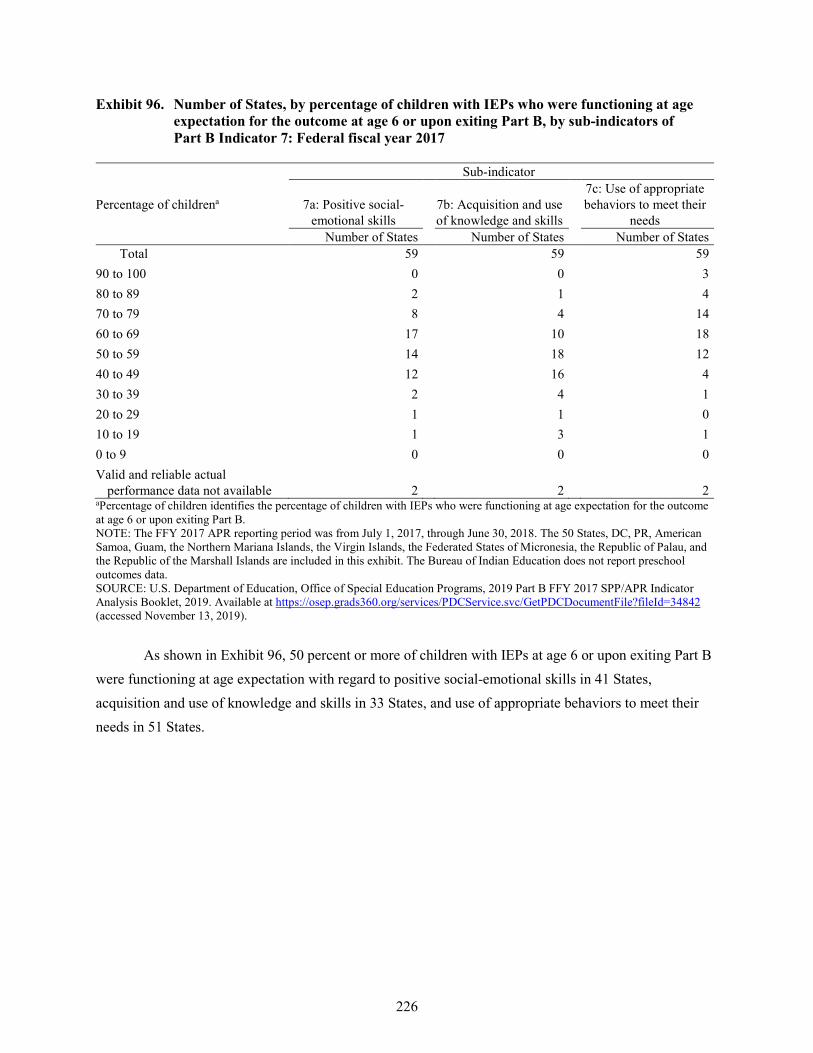
226
Exhibit 96. Number of States, by percentage of children with IEPs who were functioning at age expectation for the outcome at age 6 or upon exiting Part B, by sub-indicators of Part B Indicator 7: Federal fiscal year 2017
Percentage of childrena
Sub-indicator
7a: Positive social-emotional skills
7b: Acquisition and use of knowledge and skills
7c: Use of appropriate behaviors to meet their
needs Number of States Number of States Number of States
Total 59 59 59 90 to 100 0 0 3 80 to 89 2 1 4 70 to 79 8 4 14 60 to 69 17 10 18 50 to 59 14 18 12 40 to 49 12 16 4 30 to 39 2 4 1 20 to 29 1 1 0 10 to 19 1 3 1 0 to 9 0 0 0 Valid and reliable actual
performance data not available 2 2 2 aPercentage of children identifies the percentage of children with IEPs who were functioning at age expectation for the outcome at age 6 or upon exiting Part B. NOTE: The FFY 2017 APR reporting period was from July 1, 2017, through June 30, 2018. The 50 States, DC, PR, American Samoa, Guam, the Northern Mariana Islands, the Virgin Islands, the Federated States of Micronesia, the Republic of Palau, and the Republic of the Marshall Islands are included in this exhibit. The Bureau of Indian Education does not report preschool outcomes data. SOURCE: U.S. Department of Education, Office of Special Education Programs, 2019 Part B FFY 2017 SPP/APR Indicator Analysis Booklet, 2019. Available at https://osep.grads360.org/services/PDCService.svc/GetPDCDocumentFile?fileId=34842 (accessed November 13, 2019).
As shown in Exhibit 96, 50 percent or more of children with IEPs at age 6 or upon exiting Part B were functioning at age expectation with regard to positive social-emotional skills in 41 States, acquisition and use of knowledge and skills in 33 States, and use of appropriate behaviors to meet their needs in 51 States.
Section IV
Summary of Research Conducted Under Part E of the Education Sciences Reform Act of 2002

229
Summary of Research Conducted Under Part E of the Education Sciences Reform Act of 2002
In December 2004, Congress reauthorized the Individuals with Disabilities Education Act (IDEA) and, in doing so, amended the Education Sciences Reform Act of 2002 (ESRA), 20 United States Code (U.S.C.) 9501, et seq., by adding a new Part E. The new Part E established the National Center for Special Education Research (NCSER) as part of the Institute of Education Sciences (IES). Prior to the reauthorization of IDEA, the U.S. Department of Education’s Office of Special Education Programs (OSEP) was responsible for carrying out research related to special education. NCSER began operation on July 1, 2005. As specified in Section 175(b) ESRA, NCSER’s mission is to—
• Sponsor research to expand knowledge and understanding of the needs of infants, toddlers, and children with disabilities in order to improve the developmental, educational, and transitional results of such individuals;
• Sponsor research to improve services provided under, and support the implementation of, IDEA; and
• Evaluate the implementation and effectiveness of IDEA in coordination with the National Center for Education Evaluation and Regional Assistance.
In Federal fiscal year (FFY) 2019 (i.e., October 1, 2018, through September 30, 2019), NCSER conducted four grant competitions: the Special Education Research Competition; the Special Education Research Training Competition; the Low-Cost, Short-Duration Evaluation of Special Education Interventions Competition; and the Research Networks Focused on Critical Problems of Policy and Practice in Special Education Competition. Under these four competitions, 260 applications were peer reviewed, and NCSER awarded new research, research training, low-cost evaluation, and research network grants. In addition, NCSER funded two grants under the IES Unsolicited Grant Competition.
In FFY 2019, NCSER awarded 29 grants for its Special Education Research Competition across nine standing special education topics and two special topics. The nine standing topics are Early Intervention and Early Learning in Special Education; Families of Children With Disabilities; Professional Development for Educators and School-Based Service Providers; Reading, Writing, and Language Development; Science, Technology, Engineering, and Mathematics (STEM) Education; Social and Behavioral Outcomes to Support Learning; Special Education Policy, Finance, and Systems; Technology for Special Education; and Transition Outcomes for Secondary Students With Disabilities. The two special topic awards were in Career and Technical Education for Students With Disabilities and Systems-Involved Students With Disabilities. NCSER made no awards in FFY 2019 under the standing
230
topics of Autism Spectrum Disorder and Cognition and Student Learning in Special Education or the special topic of English Learners With Disabilities.
For FFY 2019, under the Special Education Research Training Competition, NCSER made six new awards under Early Career Development and Mentoring. NCSER did not compete the following programs in FFY 2019: Postdoctoral Research Training Program in Special Education and Early Intervention; Methods Training Using Sequential, Multiple Assignment, Randomized Trial (SMART) Designs for Adaptive Interventions in Education; and Methods Training Using Single-Case Designs. NCSER awarded one grant under the Low-Cost, Short-Duration Evaluation of Special Education Interventions Competition. In FFY 2019, NCSER also awarded one Network Lead and three Research Team grants under the Research Networks Focused on Critical Problems of Policy and Practice in Special Education Competition. With these four new awards, NCSER established the Multi-Tiered Systems of Support Research Network (MTSS-RN).
Descriptions of the new awards that NCSER made in FFY 2019 under Part E ESRA follow. The descriptions summarize the proposed purposes of the grants based on information taken from the research grants and contracts database on the IES website.
The descriptions of the awards under the Special Education Research Competition are organized and presented in terms of the nine topics, followed by the two special topic awards. Following them is a description of the six Early Career Development and Mentoring awards under the Special Education Research Training Competition; the one award under the Low-Cost, Short-Duration Evaluation of Special Education Interventions Competition; the four awards under the Research Networks Focused on Critical Problems of Policy and Practice in Special Education Competition; and the two awards under the Unsolicited Grant Competition.
Additional information on the grants funded in FFY 2019 and continuing projects can be found at http://ies.ed.gov/funding/grantsearch/ (accessed July 18, 2019).
Special Education Research Competition
Early Intervention and Early Learning in Special Education
Award Number: R324A190181 Institution: Arizona State University Principal Investigator: M. Jeanne Wilcox Description: A Conceptual Efficacy Replication of the TELL Preschool Curriculum With Web-Based Implementation Support and Professional Development Variations. The purpose of this project is to
231
investigate the efficacy of the Teaching Early Literacy and Language (TELL) curriculum when professional development (PD) support is delivered through a web-based platform with variations on the number of specific PD components. TELL addresses the needs of preschool-aged children with developmental speech and/or language impairment. It is a classwide curriculum with evidence-based oral language and early literacy teaching practices that teachers can embed into any type of preschool activity, such as small or large group instruction and outdoor play, or different content areas, including science, math, art, music, movement, and social-emotional development. The initial Institute of Education Sciences-funded efficacy trial showed improvements in a variety of language and early literacy skills. However, because all teachers participated in all PD activities, it was not possible to determine if every component was needed. To increase the efficiency and cost-effectiveness of the intervention, this study will transfer some in-person PD components to the web and examine whether there are significant differences in children’s language and literacy outcomes based on the number of PD components teachers receive. In addition to investigating the impact on teacher fidelity and classroom and child outcomes, the study will examine whether different types of implementation fidelity (adherence, dose quality) and child- and teacher-level factors affect the impact of the TELL PD on child outcomes, the cost-effectiveness of the intervention, and the implementation supports that teachers need and prefer. In this randomized controlled trial, the study team will compare three variations of PD for implementing TELL with fidelity. The standard PD group will receive face-to-face training during a workshop approximately two months prior to the start of the school year and an additional face-to-face training after the winter break. The ModPD condition will receive the standard training plus monthly participation in professional learning communities through videoconferencing. The MaxPD condition will receive the standard training, participate in the professional learning communities, and receive 12 individual coaching sessions from external coaches. For coaching, teachers will upload videos of their own implementation, the coaches will provide annotated feedback on the videos, and teachers and coaches will meet via videoconferencing to discuss the video. In Year 1, the research team will conduct activities to prepare the intervention for use and recruit and train the first cohort of teachers. In Years 2 through 4, each of the three cohorts will receive the assigned PD activities and implement TELL in their classrooms. In Year 5, the researchers will analyze the data and disseminate the results. The project will produce evidence of the comparative efficacy and cost-effectiveness of three versions of the TELL curriculum. The project also will result in a final, shareable dataset; peer-reviewed publications; presentations; and additional dissemination products. Amount: $3,599,825 Period of Performance: 8/1/2019–7/31/2024
Award Number: R324A190177 Institution: Vanderbilt University Principal Investigator: Ann Kaiser Description: EMT en Español: Comprehensive Early Intervention to Support School Readiness Skills for Spanish-Speaking Toddlers With Language Delays. The purpose of this project is to examine the efficacy of EMT en Español, a cultural and linguistic adaptation of Enhanced Milieu Teaching (EMT), to improve the language and related school readiness skills of young Spanish-speaking children with receptive and expressive language delays. Early language delays affect children’s later communicative, social, behavioral, and academic skills and put children at risk for persistent language impairment. Therefore, early language intervention, particularly intervention using caregivers to provide language development support for their children in the home, is crucial. Yet, there is limited research on such interventions for Spanish-speaking children with language delays, and applications of current evidence-based intervention are likely limited due to linguistic and cultural differences. This project aims to provide needed research on early language intervention with this population. EMT is a naturalistic language intervention that promotes the use of new language forms using environmental arrangement, responsive interaction strategies, language modeling and expansions, and systematic prompting procedures to teach functional spoken language. In a previous IES project, EMT has demonstrated efficacy with English-speaking toddlers. Pilot data suggest that EMT en Español leads to improvements
232
in caregiver-child communication during interactions, increases linguistic input to facilitate language learning, and improves the diversity and rate of child talk. The research team will examine the efficacy of EMT en Español using a randomized controlled trial, with child-caregiver dyads randomized into intervention and control groups. Both groups will continue to receive their usual services, but the intervention group will have services supplemented with the EMT en Español. The research team will assess children and caregivers before the intervention begins, immediately after the intervention ends, and at 6-month and 12-month follow-up time points. The team also will explore the effects of the intervention on children’s language and related school readiness skills, examine the long-term effects of the intervention on cross-linguistic (English and Spanish) outcomes, and calculate the cost-effectiveness of the intervention. The project will produce evidence of the efficacy of EMT en Español for young Spanish-speaking children with receptive and expressive language delays. The project also will result in a final, shareable dataset; peer-reviewed publications; presentations; and additional dissemination products. Amount: $3,285,441 Period of Performance: 7/1/2019–6/30/2024
Award Number: R324A190076 Institution: San Diego State University Principal Investigator: Sarah Rieth Description: Examining the Efficacy of Project ImPACT for Toddlers. The purpose of this project is to examine the efficacy of Project ImPACT for Toddlers (PIT). PIT is a naturalistic intervention that focuses on building parents’ capacity to support the social communication development of their children with or at risk for autism spectrum disorder (ASD) in community-based early intervention settings. Focusing on toddlers is important because ASD diagnoses are occurring earlier and there is evidence that intervening at the first signs of ASD risk, even before diagnosis, may help prevent the onset of symptoms for some children. Because services provided to toddlers at risk for ASD and their families vary based on geographic location, family demographics, and provider training, there is a need to test the efficacy of using sustainable methods of delivering high-quality services through existing early intervention systems. PIT, a community-based model of intervention, addresses this need. In a previous IES project, PIT demonstrated promise for improving children’s communication and social skills and positive parenting behaviors within parent-child interactions compared to usual care early intervention. PIT’s evidence-based practices blend developmental science and applied behavior analysis using a parent-coaching framework within Part C systems. Early interventionists participate in interactive, online, didactic instruction and in-person meetings with opportunities to practice and receive feedback from a coach until they reach fidelity. The early interventionists then provide 12 weeks of training to parents in developmental and behavioral techniques to use with their child during daily activities. The curriculum includes provider and parent manuals, provider strategy guides, activity planners, and assessment materials to guide the development of child goals. The research team will evaluate PIT using a randomized wait list controlled trial to determine whether it improves the fidelity of provider coaching of parents, fidelity of parent implementation of intervention techniques, and communication and social skills for children with or at risk for ASD. The research team also will examine potential moderating roles of family and child characteristics. In Year 1, the research team will enroll providers and families and collect pre-intervention data. In Year 2, providers will receive training, with timing based on condition, followed by implementation of PIT, enrollment and randomization of the second cohort, and data collection during usual services. In Year 3, the second cohort of providers will receive training and implement PIT with new families, continuing into Year 4. In Year 4, the final intervention phase will end, and the team will collect post-intervention data and analyze and disseminate the results. The project will produce evidence of the efficacy and cost-effectiveness of PIT for toddlers with or at risk for ASD. The project also will result in a final, shareable dataset; peer-reviewed publications; presentations; and additional dissemination products. Amount: $3,294,557 Period of Performance: 7/1/2019–6/30/2023
233
Award Number: R324A190066 Institution: University of South Carolina Principal Investigator: Christine DiStefano Description: Investigating Psychometric Properties of BASC-3 Flex Progress Monitoring Forms With Preschool Students. The purpose of this project is to evaluate the forms for a social-emotional progress monitoring system, Flex System for Progress Monitoring (Flex PM), as part of conducting Response to Intervention (RtI) in the preschool environment. The Flex PM is part of the existing Behavioral Assessment System for Children, 3rd Edition (BASC-3), a widely used social-emotional system of measurement that includes a screener, observation forms, and other rating scales. RtI is a systematic process of prevention and early intervention using multiple tiers of intervention to target children at different levels of risk. To use RtI efficiently and effectively, there must be a method to collect data on the impact of an intervention on individual children systematically in order to make decisions about maintaining or adjusting their interventions. At the Tier 2 level (classroom or small group intervention), educators need progress monitoring data to determine whether a child is responding appropriately to the intervention or if the child needs individualized intervention (Tier 3). The Flex PM addresses the need for progress monitoring of social-emotional development in preschoolers; however, there is currently limited data on its psychometric properties. The current project will investigate the measurement properties of the progress monitoring system, including the assessment forms’ sensitivity to change, reliability, and validity for preschoolers who are and are not at risk. This project will analyze an existing dataset, the national norming data used to develop the Flex PM, as well as collect prospective data from new teachers and preschoolers. In addition, the project will examine stakeholders’ perceptions of conducting progress monitoring of social-emotional risk in preschoolers, which has important implications for implementing RtI in a preschool program. The project will produce more in-depth knowledge of the characteristics of the Flex PM standard forms within the context of RtI and stakeholders’ perspectives and social validity of the assessment. The project also will result in peer-reviewed publications, presentations, and additional dissemination products. Amount: $1,399,325 Period of Performance: 7/1/2019–6/30/2023
Award Number: R324A190223 Institution: University of Kansas Center for Research, Inc. Principal Investigator: Kathryn Bigelow Description: Professional Development to Support Intervention Implementation of the Promoting Communication Tools for Advancing Language in Kids (PC TALK) for Infants and Toddlers at Risk for or With Disabilities. The purpose of this project is to design and test a professional development (PD) framework to support implementation of Promoting Communication Tools for Advancing Language in Kids (PC TALK), an existing intervention aimed at supporting parents in improving the language learning opportunities and outcomes of infants and toddlers with or at risk for disabilities. Research has documented the association between early opportunities to learn and practice language in daily interactions and later language/literacy development. Although there are evidence-based language strategies for caregivers to use with infants and toddlers, many children and families do not reap the benefits of these interventions due to low levels of implementation fidelity among early intervention providers. PD and coaching are key to ensuring effective implementation of intervention strategies. This project aims to improve provider implementation of PC TALK and, in turn, children’s language outcomes, through PD, coaching, and additional technology-based tools. Although PC Talk has demonstrated efficacy in community settings, this project expands upon prior findings by developing a PD framework to support implementation of the intervention in more naturalistic home settings. During this project, the research team will develop the overall PD framework and coaching and improve the technology-based resources to support implementation fidelity, including a new mobile app to enhance parent-child interaction measurement (for parent fidelity and child communication). In Year 1, the research team will develop the PD approach and related intervention components based on user and
234
expert feedback. In Year 2, the team will implement the suggested changes and field test the revised model. In Year 3, the team will use single-case design studies to identify the level of coaching needed to best support provider use of PC TALK. In Year 4, the team will use a randomized controlled trial to determine the promise of the refined PC TALK intervention—with the new PD model, coaching, and tools—for improving provider implementation fidelity, parent fidelity of language strategies, and children’s language outcomes. The project will produce a fully developed PD model for early interventionists and home visitors who implement PC TALK with families, as well as evidence of its promise for improving language outcomes in infants and toddlers with or at risk for disabilities. The project also will result in peer-reviewed publications, presentations, and additional dissemination products. Amount: $1,400,000 Period of Performance: 7/1/2019–6/30/2023
Families of Children With Disabilities
Award Number: R324A190055 Institution: University of Nebraska, Lincoln Principal Investigator: Kristin Duppong Hurley Description: Parental Involvement in Education: Comparing Academic Outcomes for High School Students in the General Population and Those At Risk for Emotional and Behavioral Issues. The purpose of this project is to better understand associations between parental involvement and education outcomes for high school students at risk for emotional and behavioral disorder (EBD). As a group, youths with EBD experience high rates of dropout and juvenile arrest and poorer academic performance when compared to youths without disabilities and those in other disability groups. While it has been widely documented that parental involvement plays an important role in the education outcomes of younger children, there is limited research on the types of parental involvement activities that are key to improving education outcomes among high school youths, including those with EBD. The current project will address this gap by using data from the High School Longitudinal Study of 2009 (HSLS:2009), a nationally representative dataset, to explore relationships between parental involvement and proximal and distal education outcomes for students with and without risk for EBD. Researchers also will explore the potential mediating or moderating role of students’ school engagement on relations between parental involvement and student outcomes. The project will produce preliminary evidence of associations between parental involvement and high school students’ education outcomes, as well as factors that mediate or moderate these associations. The project also will result in peer-reviewed publications, presentations, and additional dissemination products. Amount: $599,680 Period of Performance: 7/1/2019–6/30/2021
Professional Development for Educators and School-Based Service Providers
Award Number: R324A190103 Institution: University of Florida Principal Investigator: Dorothy Espelage Description: Development and Pilot Evaluation of Bully Prevention Training Modules for Special and General Education Teachers: Impact on Teacher Awareness, Self-Efficacy, and Student Outcomes. The purpose of this project is to build a professional development program to enhance elementary school educators’ knowledge and skills for identifying, mitigating, and preventing bullying among students with and without disabilities. A large portion of students in the United States report experiencing bullying, with the highest rates occurring among students with or at risk for disabilities. Despite current policies mandating schools to address bullying and research showing that most teachers report a need for training on how to respond to bullying, there are no effective, scalable professional development programs that
235
focus on how to address bullying among students at greatest risk for involvement. The current project will develop a training program that improves general and special education teachers’ knowledge and skills around identifying and responding to bullying, as well as students’ academic and behavioral outcomes. In the first two years, the research team will develop four professional development online modules with input from general and special education teachers and administrators and researchers with expertise in special education, teacher preparation and professional development, and online learning. In Year 3, the team will pilot test the modules in a small-scale randomized wait list controlled trial. In the final year, the research team will conduct focus groups with teachers who implemented the intervention in the pilot study in order to elicit additional feedback on the intervention, including how well the modules align with the teachers’ knowledge and expertise. The team will release the modules to the schools assigned to the control group, analyze the data, and disseminate the findings. The project will produce a fully developed online professional development program to improve teachers’ knowledge and skills around identifying and addressing bullying. The project also will result in peer-reviewed publications, presentations, and additional dissemination products. Amount: $1,397,129 Period of Performance: 7/1/2019–6/30/2023
Award Number: R324A190183 Institution: University of Nebraska, Lincoln Principal Investigator: Michael Hebert Description: Project VIEW (Visual Impairments Education in Writing). The purpose of this project is to examine how a set of malleable teacher-level factors is related to the writing instruction practices of teachers of students with visual impairment (TVIs) and the general education teachers with whom they work, as well as the writing outcomes of students with visual impairment (VI). The teacher-level factors include preparation to teach writing, preparation to teach students with VI, beliefs and expectations about writing among students with VI, and collaborative practices between TVIs and general educators. While there is some research on effective writing instruction practices for the general population of students, very little is known about the writing instruction TVIs and general education teachers provide to students with VI. There is also little known about the factors that influence the amount and quality of writing instruction and, in turn, student writing outcomes. Previous research on factors related to writing instruction, such as preparation to teach writing, self-efficacy for teaching writing, and beliefs and attitudes about writing informed the current study. The research team intends to extend this work by focusing on TVIs and the general education teachers with whom they work and examining malleable factors that may be particularly relevant for understanding writing instruction for students with VI. Prior to beginning data collection, the research team will develop survey, interview, and observation protocols and pilot them with teachers in a different state. In each of the four project years, the research team will recruit a cohort of TVIs, general education teachers, and students with VI and collect data from student writing assessments, teacher surveys, interviews, and observations. The project will produce preliminary evidence of associations between a set of malleable teacher-related factors, teachers’ writing instruction practices, and students’ writing outcomes, as well as factors that mediate or moderate these associations. The project also will result in peer-reviewed publications, presentations, and additional dissemination products. Amount: $1,399,158 Period of Performance: 7/1/2019–6/30/2023
236
Reading, Writing, and Language Development
Award Number: R324A190126 Institution: University of Texas, Austin Principal Investigator: Jessica Toste Description: Collaborative Teacher Expertise in Evidence-Based Decision Making for Reading Intervention: Development of the EXPERT Training Program. The purpose of this project is to develop the EXPERT intervention, a professional development model for improving teachers’ use of evidence-based decision making (EBDM) to effectively intensify interventions for students with reading disabilities (RD) in grades 3 through 5. Specific learning disabilities (SLD) are the most common disabilities in K-12 education, with RD being the most common form of SLD. Students with RD need intensive, individualized interventions in order to make measurable gains in reading achievement. Implementing intensive interventions requires a high level of expertise in assessing students and making evidence-based decisions. While teachers now have access to more data than ever, many lack the knowledge and skills to use the data to make decisions. The aim of this project is to develop a professional development program that addresses multiple factors associated with improving teachers’ use of EBDM, is manageable and meaningful to teachers, fosters collaboration between general and special education teachers, and recognizes the support that teachers need to develop complex skills in real-world settings. In Year 1, through focus groups, interviews, and direct observations, researchers will investigate current practices in EBDM among special education and general education teachers to inform development of the EXPERT intervention and a fidelity of implementation measure that will capture the intervention components and teachers’ adherence to EBDM practices. In Year 2, researchers will use a single-case design study to test changes in teachers’ behaviors while participating in specific components of the intervention. In Year 3, researchers will explore feasibility of the EXPERT intervention through a pre-post single group design study. In Year 4, they will conduct a randomized controlled trial pilot study to assess the costs of the intervention and its promise for improving teachers’ knowledge and skills in EBDM and students’ reading achievement. The project will produce a fully developed EXPERT intervention for improving teachers’ use of EBDM to intensify interventions for students with RD in grades 3 through 5. The project also will result in peer-reviewed publications, presentations, and additional dissemination products. Amount: $1,400,000 Period of Performance: 7/1/2019–6/30/2023
Award Number: R324A190072 Institution: University of Texas, Austin Principal Investigator: Sharon Vaughn Description: Examining the Efficacy of a Content Area Reading Comprehension Intervention for Students With Disabilities. The purpose of this project is to test the efficacy of the reading comprehension intervention, Promoting Adolescents’ Comprehension of Text (PACT), for middle school learners with disabilities. PACT has demonstrated efficacy for improving outcomes for students without disabilities but has not been rigorously evaluated for learners with disabilities. Data from the prior efficacy study do suggest the intervention is promising for learners with disabilities. Many adolescents with disabilities do not adequately understand complex texts, which can reduce their school success, access to postsecondary learning, and future career opportunities. Since most students with disabilities are educated in the general education classroom, there is a clear need for effective instructional practices for the teachers in these classrooms. To address this need, the researchers will conduct a multi-site randomized controlled trial to determine the efficacy of PACT for middle school students with disabilities in general education social studies classrooms. Researchers will randomize classes to either the PACT intervention or the business-as-usual condition. Teachers will receive professional development and coaching through workshops, booster sessions, and in-class coaching to implement the intervention. Researchers will examine the impact of PACT on students’ reading comprehension and social studies knowledge. In addition, the study will examine the mediating effects of implementation fidelity and teachers’ academic interactions with
237
students, the moderating effects of student characteristics, and the costs and cost-effectiveness of the intervention. The project will produce evidence of the efficacy of the PACT reading comprehension intervention for students with disabilities. The project also will result in a final, shareable dataset; peer-reviewed publications; presentations; and additional dissemination products. Amount: $3,284,468 Period of Performance: 7/1/2019–6/30/2024
Award Number: R324A190093 Institution: Rice University Principal Investigator: Simon Fischer-Baum Description: Exploring the Knowledge, Skills, and Strategies Teachers of Students With Visual Impairments Need to Effectively Teach Braille Reading and Writing. The purpose of this project is to explore factors related to the teaching of braille among teachers of students with visual impairments (TVIs) and how the factors relate to students’ learning of and proficiency in braille. Braille is the primary means of literacy for children and youths who are blind. It affords these learners the ability to read and write independently and at their own pace and to access computers and mobile devices. However, students who are blind typically demonstrate lower literacy rates than their peers without visual impairments. Early and effective braille instruction is critical to promote proficiency in school and after. TVIs are typically the primary link to braille literacy for learners who are blind, yet there has been limited research on factors that underlie TVIs’ teaching of braille, including their experience with and beliefs, attitudes, and assumptions about braille. For instance, the degree to which TVIs conceptualize braille as a code versus a writing system may play an important role in how they teach braille and how students learn it. The research team will conduct a series of studies to examine factors related to TVIs’ teaching of braille and subsequent student outcomes regarding braille learning and proficiency. In the first study, the researchers will administer a survey to TVIs to assess their experience with and attitudes and beliefs about braille, their self-efficacy for teaching braille, and their assumptions about whether braille is a code versus a writing system. In the second study, researchers will use extant data on students’ assumptions about braille and literacy skills from the Braille Challenge to investigate whether students’ assumptions affect their braille skills and how their assumptions and skills relate to those of their TVIs. In the third study, the researchers will compare braille reading and writing skills of TVIs to those of highly proficient adult braille readers. In the fourth study, researchers will collect eye-tracking and finger-tracking data from TVIs and braille-proficient adults to compare how they process braille (as a code or writing system) and determine whether there are differences in how individuals who are natural print versus braille readers process braille. The project will produce data on multiple factors related to the teaching of braille. The project also will result in peer-reviewed publications, presentations, and additional dissemination products. Amount: $1,400,000 Period of Performance: 9/1/2019–8/31/2023
Award Number: R324A190051 Institution: University of Washington Principal Investigator: Roxanne Hudson Description: Understanding Reading Development and Instructional Context of Students With Intellectual Disabilities. The purpose of this project is to examine the developmental trajectory of malleable reading factors (decoding, listening comprehension, and reading comprehension) among elementary school children with an intellectual disability (ID). Despite their specific areas of difficulty, students with ID can learn grade-level content and reading when provided systematic and explicit instruction; however, they continue to be behind their peers with other disabilities in academic growth and achievement. These gaps are especially noticeable in reading where the skills of students with ID are often lower than what is expected given their cognitive functioning. Most of the reading-related research conducted with this population is around intervention development and testing; there is limited
238
knowledge regarding how reading skills develop over time for students with ID. This project will explore profiles of reading skill development, longitudinal predictors of reading, and home and school contexts that support reading skill development. The overarching aim of the study is to identify malleable reading factors among elementary students with ID in order to develop a literacy intervention designed to help students with ID reach their maximal potential. To accomplish this aim, researchers will collect data on malleable reading factors from three cohorts of students with ID in grades 1 through 3 and follow the students for three years. Researchers will use these data to explore developmental trajectories of these reading factors and test predictors of growth in reading for students with ID. Researchers also will identify potential profiles of readers based on distinct clusters of trajectories and test predictors of reading profiles to inform how and when to intervene in reading. In Year 1, to better understand students’ home and school literacy environments, researchers will select a subgroup of the students to participate in the following qualitative data collection activities during each year of the study: classroom literacy observations, teacher interviews, and parent interviews. The project will produce preliminary evidence of the developmental trajectory of malleable reading factors in children with ID. The project also will result in peer-reviewed publications, presentations, and additional dissemination products. Amount: $1,400,000 Period of Performance: 8/1/2019–7/31/2023
Award Number: R324A190028 Institution: George Mason University Principal Investigator: Linda Mason Description: Writing in Middle School Science and Social Studies: Exploring Instruction and Support for Students With Disabilities (Project Explore). The purpose of this project is to explore relationships between teachers’ use of evidence-based practices, teachers’ experience with and attitudes about adapting instruction for students with disabilities, and students’ writing outcomes. Although research has emphasized the need for improving content-area writing for adolescents, particularly those with disabilities, most prior research has relied on surveys to establish knowledge on this topic. This project will involve direct observation of classroom instruction to determine the extent to which teachers use evidence-based responsive practices (setting the stage for instruction, modeling, providing scaffolded practice, and providing feedback) and whether these malleable practices are related to students’ writing outcomes. The project also will explore teachers’ experience with and attitudes toward adapting instruction and how their experience and attitudes relate to their practices and student outcomes. In addition to classroom observations, researchers will conduct surveys, focus groups, and semi-structured interviews with teachers and then follow up in a subsequent year to collect data to document consistency in teachers’ use of writing practices with a new class of students. The project will produce preliminary evidence of the relationship between teachers’ use of evidence-based responsive practices in inclusive content-area middle school classes, teachers’ experience and attitudes about adapting instruction for students with disabilities, and student writing outcomes. The project also will result in peer-reviewed publications, presentations, and additional dissemination products. Amount: $1,399,887 Period of Performance: 7/1/2019–6/30/2023
Science, Technology, Engineering, and Mathematics (STEM) Education
Award Number: R324A190101 Institution: University of California, Riverside Principal Investigator: Asha Jitendra Description: Multiplicative Reasoning: Developing an Intervention for Students With or At Risk for Mathematics Difficulties. The purpose of this project is to develop and pilot test a mathematics intervention focused on whole number multiplication and division for third-grade students with or at risk for mathematics difficulties (MD). Students with MD have a limited understanding of many concepts
239
taught in early school years, especially multiplicative reasoning that is essential to solve problems in challenging situations. Although the percentage of elementary school students reaching proficient levels in mathematics has increased over the past decade, the mathematical gains made in elementary school are often not maintained as children progress into secondary grades. Thus, it is critical for students with MD to develop a strong understanding of math concepts and math skills in elementary school. This project aims to address this by developing and pilot testing an intervention focused on whole number multiplication and division to improve mathematics achievement among students with MD. The project also will examine the costs of the intervention and the extent to which student characteristics, such as sex, race, and English learner status, and attention moderate the intervention’s effects on student math achievement. The research team will develop and test the intervention over three years. In Year 1, the team will develop the intervention, including professional development for teachers on how to implement the program, through interviews with district stakeholders and reviews of existing curricula. In the fall and spring, researchers will conduct brief learning trials with small groups of students using the initial version of the intervention. Through these trials, researchers will test the usability of the intervention and will engage in iterative refinement based on usability data. In Year 2, researchers will revise the intervention based on data from the brief learning trials and conduct a feasibility study to test how the revised intervention functions when implemented by classroom teachers who are trained to implement the program. In Year 3, the research team will revise the intervention based on the feasibility study, conduct a pilot randomized controlled trial to evaluate its promise for improving student math achievement, and collect data on the cost of implementing the intervention. The project will produce a fully developed mathematics intervention to improve math achievement for third-graders with MD and professional development for teachers to implement the intervention. The project also will result in peer-reviewed publications, presentations, and additional dissemination products. Amount: $1,399,997 Period of Performance: 7/1/2019–6/30/2022
Social and Behavioral Outcomes to Support Learning
Award Number: R324A190129 Institution: University of Wisconsin, Madison Principal Investigator: Stephen Kilgus Description: Building an Efficient Targeted Intervention for Students At Risk for Internalizing Problems: The Resilience Education Program (REP). The purpose of this project is to further develop and refine the Resilience Education Program (REP), a Tier 2 intervention for elementary school students at risk for internalizing problems. Research has documented a lack of high-quality, feasible, school-based Tier 2 internalizing interventions, even as many schools have adopted multi-tiered systems of support (MTSS) frameworks, such as Positive Behavior Interventions and Supports (PBIS), and are engaging in universal screening for behavior, which increases their identification of students with internalizing problems. In other words, schools are identifying concerns, but they lack the strategies to effectively address them. The research team has developed an initial prototype of the REP, but further development is needed. The purpose of this project is to iteratively refine and test the feasibility of REP implementation in schools and its promise to improve student behavior and academic functioning. In Year 1, researchers will develop and validate the REP Integrity Protocol, an implementation fidelity observation tool. This tool, which will measure each component of the intervention, will be developed and refined through focus groups with educators and content experts. Researchers will use the same procedures to refine the REP Intervention Protocol (which guides implementation of REP), soliciting perceptions from experts on the intervention components, usability, feasibility, contextual fit, understandability, and promise for improving student outcomes. In Year 2, the research team will evaluate the feasibility of REP procedures via small-scale trials. In Year 3, the team will use a series of single-case design studies to conduct component analyses of each of the three major REP components to determine their ability to generate positive student outcomes. Based on results of these trials, the team will make revisions to enhance REP’s fidelity, feasibility, and
240
usability. In Year 4, the team will use a randomized controlled trial pilot study to determine the promise of the refined REP for improving student skill use, internalizing behavior, and academic outcomes. The project will produce a fully developed REP model for students with internalizing disorders and evidence of its promise for improving student cognitive-behavioral skill use, internalizing behavior, and academic outcomes. The project also will result in peer-reviewed publications, presentations, and additional dissemination products. Amount: $1,382,223 Period of Performance: 7/1/2019–6/30/2023
Award Number: R324A190122 Institution: Oregon Social Learning Center Principal Investigator: Rohanna Buchanan Description: Efficacy of the Students With Involved Families and Teachers (SWIFT) Program for Students With Emotional and Behavioral Disorders. The purpose of this project is to evaluate the efficacy of the Students with Involved Families and Teachers (SWIFT) program for improving school adjustment for students with emotional and behavioral disorders (EBD) as well as parent involvement in schools. Transitions are commonplace for students with EBD who may move between special education classrooms and programs within schools as well as to and from various placements such as day-treatment centers and residential facilities. Such transitions can be a source of added stress and lead to increased behavioral problems, and little research is available on effective intervention programs to help students during these transitions. SWIFT is a multicomponent intervention designed to address the social and behavioral needs of students with EBD when they are transitioning between school placements or before a transition if they are at risk of placement in more restrictive and costly settings. SWIFT was developed with previous IES funding to promote successful student transitions from treatment settings to neighborhood middle schools. SWIFT demonstrated feasibility of implementation in middle school settings as well as promise for improving students’ school adjustment, school stability, home-school communication, and the use of positive parenting practices, but the efficacy of the intervention has not yet been tested. The study will examine the efficacy of SWIFT for improving school adjustment for students with EBD and parent involvement in school and whether or not the effects are mediated by improved student social-emotional skills and improved parenting behaviors. The research team will use a randomized controlled trial and collect data before the intervention starts (baseline) and at 6, 12, and 18 months post-baseline. Researchers will analyze data to determine the effects of SWIFT on student and family outcomes and mediators and moderators of these effects. The research team also will conduct analyses to help schools and districts understand the monetary costs of implementing SWIFT, including the costs relative to observed student outcomes. The project will provide evidence of the efficacy of SWIFT for improving social-emotional skills for students with EBD, school adjustment, home-school communication, and parenting behavior. The project also will result in a final, shareable dataset; peer-reviewed publications; presentations; and additional dissemination products. Amount: $3,298,313 Period of Performance: 7/1/2019–6/30/2024
Award Number: R324A190046 Institution: University of Missouri Principal Investigator: Timothy Lewis Description: Evaluating the Efficacy of a Daily Check-in/Check-out Intervention for Students At Risk for Emotional and Behavioral Disorders. The purpose of this project is to evaluate the efficacy of Check-in/Check-out (CICO) for improving the social, emotional, and academic behavior of elementary school students at risk for emotional and behavioral disorders (EBD). CICO is a manualized Tier 2 behavioral intervention commonly implemented within a multi-tiered framework and designed to improve the social and behavioral performance of students with emerging problem behavior. Research has indicated that CICO is a promising intervention for improving student outcomes, has high acceptability ratings from
241
participants, and has shown feasibility of implementation in elementary school settings. However, high-quality, group design studies of CICO are lacking. This study will examine the efficacy of CICO for improving teacher instructional practices; student social, emotional, and academic behaviors; and parent perceptions of school partnership. The study also will examine the potential mediators or moderators of those effects. The research team will evaluate the efficacy of CICO using a randomized controlled trial. The team will recruit schools and randomly assign them to CICO or a services-as-usual comparison condition. Within each school, the team will screen students in grades 1 through 5 to identify those at risk for EBD who are eligible to participate in CICO. The research team will collect data before, during, and after the intervention and analyze the data to determine the effects of CICO on teacher, student, and family outcomes as well as mediators and moderators. The research team also will conduct analyses to help schools and districts understand the monetary costs of implementing CICO, including the costs relative to observed student outcomes. The project will provide evidence of the efficacy of CICO for improving teacher instructional practices; student social, emotional, and academic behaviors; and parent perceptions of school partnership. This project also will result in a final, shareable dataset; peer-reviewed publications; presentations; and additional dissemination products. Amount: $3,267,793 Period of Performance: 8/1/2019–7/31/2024
Award Number: R324A190154 Institution: Ohio University Principal Investigator: Julie Owens Description: Examining Outcomes of a Multi-Component, Individually Tailored Consultation Process Focused on Classroom Management for Teachers (K-5). The purpose of this project is to evaluate the efficacy of the Classroom Behavior Support Program (CBS) in improving elementary school teachers’ classroom management and all students’ behavior and academic outcomes, including those at risk for emotional and behavioral disorders (EBD). CBS is a multicomponent, individually tailored consultation that was developed with previous IES funding to improve teachers’ use of universal classroom management practices and targeted interventions. Such practices and interventions can improve academic and behavioral functioning in elementary school students at risk for EBD. However, teachers often feel unprepared to implement these practices to address disruptive behavior. Consultation that includes problem-solving and performance feedback is one way to improve teacher implementation of universal and targeted strategies but can still lead to variable implementation without individual tailoring. The current study aims to address this by evaluating a consultation program that is individually tailored to match teachers’ strengths and weaknesses and addresses common barriers to integrity, including teachers’ knowledge about best practices, skills to implement those practices, and beliefs about their own skills or the practices. The research team will evaluate the efficacy of CBS using a randomized controlled trial. Researchers will screen and recruit three cohorts of teachers and block randomize them to the intervention or comparison condition. In addition, the researchers will identify and recruit one focal student at risk for EBD in each teacher’s class for the study. Teachers in both conditions will participate in a workshop and receive up to eight consultation sessions focused on universal classroom management strategies and the use of a targeted intervention with the focal student. Researchers will collect data on fidelity and teacher and student outcomes throughout the study and will analyze data to determine the effects of CBS on teachers’ classroom management practices and changes in proximal and distal student outcomes, mediators and moderators of these effects, and the costs and cost-effectiveness of the intervention. The project will provide evidence of the efficacy of CBS for improving the teachers’ classroom management and students’ behavioral and academic outcomes. The project also will result in a final, shareable dataset; peer-reviewed publications; presentations; and additional dissemination products. Amount: $3,297,119 Period of Performance: 9/1/2019–8/31/2024
242
Award Number: R324A190173 Institution: University of Louisville Principal Investigator: Terrance Scott Description: Motivational Interviewing Skills for Coaches (MISC). The purpose of this project is to develop the Motivational Interviewing Training and Assessment System (MITAS) for Coaches to equip instructional personnel who serve in coaching roles with the interpersonal skills they need to engage teachers in the coaching process more effectively, improve teacher implementation of evidence-based classroom behavior management strategies, and ultimately improve student education outcomes. Coaching has emerged as a promising professional development model to improve teacher implementation of effective classroom management strategies. In coaching, the quality of conversational skills used by coaches directly influences the coach-teacher relationship and subsequent teacher use of effective instructional strategies, yet the coaching literature does not clearly identify those skills that coaches need to effectively influence teacher behavior. Motivational Interviewing (MI) is an established counseling technique that uses critical conversational skills to promote behavior change, yet MI is rarely used in school-based coaching. Thus, there is a need for professional development models that incorporate MI and clearly and comprehensively specify (a) the conversational skills coaches need to successfully influence teacher practices, (b) the scope and sequence of professional development activities that will equip coaches with these conversational skills, and (c) skill-based proficiency standards for coaches that are shown to be associated with improvements in teacher management practices and student outcomes. To address this need, this research team will iteratively develop and pilot test the MITAS for Coaches to efficiently and effectively promote teacher behavior change that leads to improved student social, behavioral, and academic outcomes. The MITAS for Coaches has three components: workshops, simulated practice, and a learning community. In the first phase of the project, a research advisory committee will review and provide written feedback on initial MITAS for Coaches materials and procedures. In the next phase, coaches will receive training and then implement the revised MITAS for Coaches with teachers. The research team will conduct focus groups with coaches and teachers and collect data on the intervention’s social validity, usability, and feasibility and teacher and student outcomes. The research team will revise MITAS for Coaches based on this initial implementation and repeat the procedures with another cohort. In the final phase, the research team will use a small randomized controlled trial pilot study to determine the promise of the refined MITAS for Coaches for improving the quality of the coach-teacher relationship, teacher classroom management, and student academic engagement and behavioral outcomes. The project will produce a fully developed MITAS for Coaches program to improve the quality of the coach-teacher relationship, teacher implementation of evidence-based classroom behavior management strategies, and subsequent student academic engagement and behavioral outcomes. The project also will result in peer-reviewed presentations, publications, and additional dissemination products. Amount: $1,396,097 Period of Performance: 7/1/2019–6/30/2023
Award Number: R324A190013 Institution: University of Kansas Principal Investigator: Kathleen Lane Description: Project SCREEN: Validation of a Free-Access Screening Tool for K-12 Educators to Screen Students for Internalizing and Externalizing Behavior Patterns. The purpose of this project is to validate the Student Risk Screening Scale for Internalizing and Externalizing Behaviors (SRSS-IE) for identifying K-12 students who are at risk for internalizing and/or externalizing behavior patterns. To prevent students with or at risk for emotional and behavioral disorders (EBD) from experiencing long-term negative outcomes, such as school failure and dropout, it is essential that schools identify these students early to facilitate the identification, implementation, and evaluation of proper interventions. Although screening tools exist, schools need more options for low-cost, feasible screening tools to identify externalizing and internalizing behavior problems in schools. The research team has developed the initial version of the
243
SRSS-IE, a free-access screening tool, but additional research is needed to evaluate its psychometric properties. The research team will conduct a series of studies that involves collecting new data in the first year of the project and analyzing these and existing data from SRSS-IE studies conducted to date. Researchers will conduct five sets of analyses including (1) measurement invariance to ensure that the same internalizing and externalizing constructs are being measured across specified groups (gender, race/ethnicity, disability status, and grade level); (2) internal consistency to determine how well the SRSS-IE is measuring targeted behaviors across items, subscales, and student ability levels; (3) classification accuracy to compare the accuracy of SRSS-IE screening to results obtained using other established and well-researched screening tools; (4) convergent validity of the SRSS-IE with other validated screening measures and predictive validity of the tool with other year-end indicators of academic, behavioral, and social outcomes; and (5) existence of any bias with respect to gender, ethnicity/race, and disability status. The project will produce a fully developed and validated SRSS-IE as a screening tool to identify K-12 students who are at risk for internalizing and/or externalizing behavior patterns. The project also will result in peer-reviewed presentations, publications, and additional dissemination products. Amount: $1,399,959 Period of Performance: 7/1/2019–6/30/2022
Special Education Policy, Finance, and Systems
Award Number: R324A1901098 Institution: University of Wisconsin, Madison Principal Investigator: Jennifer Asmus Description: Addressing the Integrity of the Problem-Solving Process: An Empirical Analysis of Problem-Solving Teams to Improve Team Functioning and Student Outcomes. The purpose of this project is to adapt an existing problem-solving model, Outcomes: Planning, Monitoring, and Evaluating (Outcomes: PME), to support school problem-solving teams (PSTs) in their efforts to enhance team-based problem-solving and use of evidence-based practices (EBPs), teacher intervention integrity, and student behavior outcomes. PST members include administrators, school psychologists, general and special education teachers, and other school personnel. Within multi-tiered systems of supports, PSTs are integral to the selection and implementation of evidence-based interventions to address behavioral and academic challenges that students experience at school. Research has highlighted the extensive amount of instructional time lost to discipline and the considerable racial/ethnic disproportionality in disciplinary practices across U.S. schools. PSTs can play a critical role in promoting the use of evidence-based practices to address behavior problems and reduce disproportionality. However, additional research is needed on effective, acceptable, and cost-effective protocols for PSTs that meet infrequently. The current project intends to address this by adapting an existing protocol for individual consultation, Outcomes: PME, for teams and testing its promise for improving team-based problem-solving and selection of EBPs, teacher implementation of those EBPs, and students’ behavioral outcomes. Researchers will adapt and pilot test Outcomes: PME over the course of four years. They will begin with an initial adaptation of Outcomes: PME and measurement protocols based on expert feedback, observations, and focus groups. Then, they will implement the initial iteration to examine the team-based intervention’s fidelity, feasibility, and usability using AB single-case design studies, followed by a focus group of PST members to inform further revisions. Using the same process, the research team will test a second iteration of Outcomes: PME and assess the extent to which PSTs involved in the previous implementation continue to use the problem-solving protocol with fidelity. The research team will pilot test the final iteration of Outcomes: PME using a multiple-baseline single-case design study to determine its promise for improving team-based problem-solving and selection of EBPs, teacher fidelity of EBPs, and student behavioral outcomes. The team also will evaluate the extent to which PSTs participating in the earlier studies sustained the intervention. The project will produce an adapted version of Outcomes: PME to
244
improve PSTs’ problem-solving, teachers’ implementation of EBPs, and student outcomes. The project also will result in peer-reviewed publications, presentations, and additional dissemination products. Amount: $1,399,428 Period of Performance: 9/1/2019–8/31/2023
Technology for Special Education
Award Number: R324A190054 Institution: University of Kansas Center for Research, Inc. Principal Investigator: Wayne Sailor Description: Project DataWall: A Decision Support System for MTSS. The purpose of this project is to develop and pilot test a decision support system (DSS) that guides school teams in using data to implement an integrated multi-tiered system of support (MTSS) and improve outcomes for students with or at risk for a disability. Integrated MTSS is intended to provide both behavior and academic services; however, despite the theoretical advantages of integrating these services, many schools struggle to implement MTSS at a high level of fidelity. This project will develop and test a technology tool, the DSS, to support schools in attaining high fidelity of MTSS implementation. The DSS will include a digital system (DataWall) that integrates data from multiple sources and an evidence-based problem-solving approach, Team-Initiated Problem Solving (TIPS), that will enable school teams to effectively utilize the digital system to identify problems and intervention solutions. The research team will use an iterative process to develop and test the DSS. In Year 1, researchers will develop the DSS prototype and implementation plan in collaboration with their partner schools. In Year 2, they will conduct an initial field test of the DSS prototype and refine the system based on feedback to strengthen its usability, feasibility, and acceptability. In Years 3 and 4, the research team will conduct a pilot randomized controlled trial to analyze the costs of implementing DSS and test its promise for improving MTSS implementation and math, reading, and behavior outcomes for students with or at risk for disabilities. The project will produce a fully developed DSS for school teams to use in making decisions about services provided to students with or at risk for disabilities. The project also will result in peer-reviewed publications, presentations, and additional dissemination products. Amount: $1,388,621 Period of Performance: 7/1/2019–6/30/2023
Transition Outcomes for Secondary Students With Disabilities
Award Number: R324A190170 Institution: University of Connecticut Principal Investigator: Allison Lombardi Description: College and Career Readiness for Transition (CCR4T): Development and Validation of a Student Measure. The purpose of this project is to develop and validate the College and Career Readiness for Transition (CCR4T), a measure of high school students with disabilities’ perceptions of their own college and career readiness (CCR). CCR is critical for youths with and without disabilities. While many students lack the necessary academic preparation to enroll and succeed in credit-bearing postsecondary courses, students with disabilities are especially underprepared for enrollment in postsecondary educational settings and are less likely to attain and maintain employment or pursue postsecondary educational experiences that will prepare them for jobs and careers. The purpose of the current study is to design the CCR4T for educators to use in the process of setting annual goals in the individualized education programs of high school students with disabilities to better prepare them for the transition into postsecondary settings. The research team will conduct its research in five phases. Phase 1 will involve developing items based on previous empirical work, literature review, and focus group feedback. In Phase 2, the research team will use a systematic procedure to review and refine the items to ensure they are aligned with the assessment framework. In Phase 3, the researchers will field test the items and conduct
245
analyses to select the final items for the measure. In Phase 4, the researchers will conduct a large-sample administration of the measure to determine its psychometric properties. In the final phase, they will develop a scoring procedure and conduct validation studies. The project will produce a fully developed and validated assessment of CCR for students with disabilities, the CCR4T. The project also will result in peer-reviewed publications, presentations, and additional dissemination products. Amount: $1,398,298 Period of Performance: 7/1/2019–6/30/2023
Award Number: R324A190114 Institution: University of Massachusetts, Boston Principal Investigator: Allison Hall Description: Exploring How Transfer-of-Rights and Guardianship Discussions May Affect Transition Outcomes for Students With Intellectual Disabilities. The purpose of this project is to explore whether and how the information special educators provide to parents about transfer of rights and guardianship may either support or limit transition outcomes for students with intellectual and developmental disabilities (IDD). Special education regulations state that parental decision-making rights will transfer to students at the age of 18 unless parents of students with IDD obtain guardianship over their children. During transition planning, special educators routinely encourage parents to seek guardianship despite the growing array of available formal and informal alternatives to guardianship such as supported decision- making. Guardianship undermines a core aim of special education, namely, promoting the self-determination of students with IDD. The possible effects of guardianship discussions on the transition outcomes of students with IDD have not been well researched. This research team will therefore examine the factors that affect how special educators provide information on transfer of rights and guardianship to parents and transition-age students with IDD, and the ways in which this information affects known predictors of transition outcomes, including parent expectations and student self-determination. This project will begin with three initial research activities: (1) a scoping review of the literature in a variety of fields including youth social and emotional development, education and special education, and legal research; (2) a 50-state document review and analysis of state-level special education transfer-of-rights policies and guidance; and (3) interviews with experts in the field of transition for students with IDD. Findings from these initial activities will inform the next set of activities: (1) qualitative interviews with triads of transitioning students, their parents, and special educators on their IEP teams regarding their experiences participating in guardianship and transfer-of-rights discussions during the transition process; (2) the development of a research-based theoretical model that informs the development of a future intervention regarding the transfer-of-rights process; and (3) an expert panel that will review and recommend refinements to the model. The project will produce a description of current practice regarding transfer-of-rights and guardianship discussions and procedures; what influences those practices, including state and district policy; and the relationship between those practices and transition outcomes for students with IDD and their parents. The researchers will develop a theoretical model that can serve as a foundation for developing a future intervention that can systematically test how the transfer-of-rights process can be structured to best support positive transition outcomes. The project also will result in peer-reviewed publications, presentations, and additional dissemination products. Amount: $1,399,642 Period of Performance: 7/1/2019–6/30/2023
Award Number: R324A190085 Institution: University of Massachusetts, Boston Principal Investigator: Meg Grigal Description: Moving Transition Forward: Exploration of College-Based and Conventional Transition Practices for Students With Intellectual Disability and Autism. The purpose of this project is to explore and compare critical aspects of two transition approaches—a college-based transition experience and a conventional high school or community-based transition experience—and examine the associations
246
between involvement in those programs and student employment outcomes for students with intellectual disability and/or autism (ID/A). Historically, students with ID/A have had some of the poorest college access and employment outcomes of all disability groups. The lack of opportunity to prepare or plan for higher education or paid work leads to long-term inequality in education and employment outcomes, as most students with ID/A exit high school and enter a lifetime of sheltered employment (earning subminimum wage) or therapeutic day habilitation programs. Research is needed to better understand the transition services that are used in each approach and identify experiences that demonstrate promise for improving employment while in the program or at exit from the program. The current project will address this need by analyzing two datasets (the National Longitudinal Transition Study 2012 [NLTS 2012] and the Transition and Postsecondary Education Programs for Students With ID [TPSID]) to explore the composition of various transition services for students with ID/A and their associated employment outcomes. In Phase I, the researchers will use NLTS 2012 to explore data on transition services youths with ID/A receive and preparedness for college and career. In Phase II, the researchers will use TPSID to explore the transition experiences of youths with ID/A who attend college-based transition programs and preparation for employment activities. In Phase III, the researchers will use both datasets to compare the transition experiences of youths in college-based transition programs to those receiving conventional transition services. The project will produce a description and comparison of transition services offered through two transition approaches and evidence of associations between involvement in those programs and employment outcomes for students with ID/A. The project also will result in peer-reviewed publications, presentations, and additional dissemination products. Amount: $600,000 Period of Performance: 9/1/2019–8/31/2021
Award Number: R324A190104 Institution: University of Oregon Principal Investigator: John Lind Description: Paths to the Future for Young Men. The purpose of this project is to develop Paths to the Future for Young Men (P2F-Young Men), a career development intervention to address the needs of adolescent boys with high-incidence disabilities. Adolescent males lag behind their female peers on a number of important academic and behavioral outcomes, such as rates of high school graduation and college enrollment, and have greater risk for violence, suicide, and substance abuse. Males with disabilities also receive less support outside their families, are less likely to attend college, and have poorer social outcomes. Paths to the Future (P2F) is a gender-specific career development curriculum that was developed, pilot tested, and showed preliminary evidence of efficacy for high school girls with disabilities in a prior Institute of Education Sciences-funded project. This research team will adapt this existing curriculum for adolescent boys with high-incidence disabilities and pilot test it on a variety of student outcomes, including transition knowledge and skills, career goals, and educational outcomes. The research team also will calculate the costs of the intervention. In Phase I, the research team will conduct a series of activities designed to gather additional information needed to ensure the adapted curriculum will meet the transition needs of adolescent boys with disabilities. This phase will include a literature review; student, parent, and teacher focus groups; expert teacher review of revised materials; and feasibility and usability testing through a design experiment. A design team comprised of key researchers and practice stakeholders will provide feedback throughout Phase I of this project. In Phase II, the team will pilot test P2F-Young Men through a randomized controlled trial to determine its promise for improving a variety of student outcomes, including transition knowledge and skills, career goals, and educational outcomes. The research team also will calculate the costs of implementing the intervention. The project will produce a fully developed P2F-Young Men curriculum for high school boys with high-incidence disabilities and
247
evidence of its promise for improving student transition knowledge and skills, career goals, and educational outcomes. The project also will result in peer-reviewed presentations, publications, and additional dissemination products. Amount: $1,378,477 Period of Performance: 9/1/2019–8/31/2023
Award Number: R324A190011 Institution: University of Kansas Principal Investigator: Michael Hock Description: Possible Selves and Self-Determination: Improving Transition Outcomes for High School Students With Learning Disabilities. The purpose of this project is to evaluate the efficacy of Possible Selves: Nurturing Student Motivation (PS) plus the Self-Determined Learning Model of Instruction (SDLMI), or PS+SDLMI, for improving the academic and transition outcomes of high school students with learning disabilities (LD). Research has consistently shown that students with LD demonstrate less college and career readiness compared to students without disabilities. For example, although the number of high school graduates with LD entering college has increased slightly over the years, students with LD who complete college are less likely to be competitively employed three to five years after graduation, and when they are employed, they typically have careers in areas with lower average salaries. Self-determination has been shown to be related to positive school and transition outcomes for students with LD, yet students with LD are less self-determined than peers without disabilities and they have too few opportunities to learn and practice essential skills such as goal setting and attainment, problem-solving, and self-regulation. Motivation for learning is also important for school success and may play a role in student engagement in the transition process. PS+SDLMI is an intervention that infuses a goal setting and attainment process, SDLMI, into an intervention that focuses on identity development and motivation to engage in transition learning, PS. The project will test the efficacy of the combined intervention, PS+SDLMI, using a randomized controlled trial to determine if it improves the academic and transition outcomes of high school students with LD. The research team will randomize schools to one of the three groups (PS+SDLMI, PS, and control), and students will receive the interventions over a three-year period. The research team will collect data pre-intervention; at the end of Years 2, 3, and 4; and one year after students graduate (Year 5). Researchers will analyze data to determine the effects of PS+SDLMI on student academic and transition outcomes, and the costs and cost-effectiveness of the interventions. The project will produce evidence of the efficacy of PS+SDLMI for improving the academic and transition outcomes of students with LD. The project also will result in a final, shareable dataset; peer-reviewed publications; presentations; and additional dissemination products. Amount: $3,293,003 Period of Performance: 7/1/2019–6/30/2024
Special Topic: Career and Technical Education for Students With Disabilities
Award Number: R324A190202 Institution: University of California, Santa Barbara Principal Investigator: Michael Gottfried Description: Understanding the Antecedents of STEM Career and Technical Education Coursetaking for High School Students with Learning Disabilities. The purpose of this project is to investigate whether participating in applied STEM (science, technology, engineering, and math) career and technical education (AS-CTE) courses in high school is related to students with learning disabilities pursuing and persisting in STEM majors and/or careers. High school AS-CTE courses emphasize the practical applications of academic math and science concepts to job experiences by incorporating “hands on” quantitative reasoning, logic, and problem-solving skills. Although a significant number of students with learning disabilities participate in CTE courses, little is known about their AS-CTE course-taking patterns and the extent to which taking these courses is related to postsecondary and employment outcomes.
248
Researchers will code data from two nationally representative datasets to understand AS-CTE course-taking and conduct analyses to examine relationships between participation in these courses and the high school, college, and career outcomes for students with learning disabilities. These two datasets include the Education Longitudinal Study of 2002 (ELS:2002) and the High School Longitudinal Study of 2009 (HSLS:2009). The project will produce preliminary evidence of the relationship between AS-CTE course-taking and postsecondary and employment outcomes for students with learning disabilities. The project also will result in peer-reviewed publications, presentations, and additional dissemination products. Amount: $182,428 Period of Performance: 9/1/2019–8/31/2021
Special Topic: Systems-Involved Students With Disabilities
Award Number: R324A190145 Institution: Georgia State University Principal Investigator: David Houchins Description: Liberate. The purpose of this project is to test the efficacy of Read 180® with struggling adolescent readers in juvenile justice schools. Read 180® is a widely used literacy program for differentiating instruction in typical school settings. Research indicates that students with and without disabilities in juvenile justice schools often demonstrate serious literacy deficits. In addition, the prevalence of students with disabilities in juvenile justice schools is about three times greater than in typical schools, with the majority of those students having learning disabilities and emotional and behavioral disabilities. Juvenile justice schools need evidence-based programs in which to invest. This project seeks to address this need by building onto a previous Insitute of Education Sciences-funded study, Project LIBERATE (Literacy Instruction Based on Evidence through Research for Adjudicated Teens to Excel), to develop and pilot test an intervention package for students in juvenile justice settings that included Read 180® and an enhanced professional (PD) model to supplement Read 180®. In that study, the intervention package demonstrated feasibility and promise for improving the literacy outcomes of students in juvenile justice schools. However, the efficacy of Read 180® (with this enhanced PD supplement) has not yet been tested in this setting. Thus, the current study will use a randomized controlled trial to examine the efficacy of Read 180® for improving the literacy outcomes of struggling adolescent readers in juvenile justice schools, including students with disabilities. In each year of the project, eligible students will be recruited and randomly assigned to the intervention or comparison group as they enter the juvenile justice schools. Teachers will receive PD on how to implement Read 180® and then implement the intervention for the duration of the school year while researchers monitor fidelity and collect data. Teachers will have access to in-person PD as well as continuous PD online. Teachers also will have access to PD modules available through the publisher’s website, and the research team may assign individual teachers to particular modules based on needs identified in teachers’ videos. In addition, the research team will conduct virtual meetings and in-person PD and coaching during classroom visits on an as-needed basis. At the end of the school year, researchers will collect feedback on the program from teachers, administrators, and students. Data analyses will determine the effects of Read 180® on reading outcomes for all students, including those with disabilities; processes that mediate or moderate intervention impacts; conditions that support or hinder implementation; and the costs and cost-effectiveness of the intervention. The project will produce evidence of the efficacy of Read 180® for improving the reading outcomes of students in juvenile justice facilities. The project also will result in a final, shareable dataset; peer-reviewed publications; presentations; and additional dissemination products. Amount: $3,299,326 Period of Performance: 7/1/2019–6/30/2023
249
Special Education Research Training Competition
Early Career Development and Mentoring
Award Number: R324B190019 Institution: Florida State University Principal Investigator: Jenny Root Description: Building up Mathematical Problem Solving of Students With Extensive Support Needs. The principal investigator (PI) will conduct a program of research for improving math outcomes among secondary students with extensive support needs (students who require ongoing support, such as students with intellectual disability, autism, or multiple disabilities). At the same time, the PI will participate in mentoring and training activities to develop knowledge and skills related to math content and pedagogy, mixed methods research, and grant writing and grants management. Math skills are integral to students’ independence in postsecondary, daily living, vocational, and leisure settings. However, the scope of instruction for secondary students with extensive support needs is limited to a narrow set of skills, as teachers who work with these students often do not feel adequately prepared to teach more than just the very basics of math. As such, it is crucial to develop research-based interventions that build the mathematical competence of learners with extensive support needs and are feasible for teachers to implement. The PI intends to address this need by iteratively developing and testing the feasibility, usability, and promise of a math problem-solving program for middle and high school students with extensive support needs. During Phase 1 (Years 1 and 2), the PI will iteratively develop the intervention procedures and measurement systems, including the teaching scripts, word problems, instructional materials, and generalization measures. In Year 1, the team will develop the initial version based on the literature and observations of teachers and students with extensive support needs. The study team will conduct a single-case design (SCD) study to test whether students who participate in the intervention show improved math problem-solving skills and ability to generalize to other types of math problems. In Year 2, the team will revise the intervention based on data from Year 1 and testing in a second SCD study. In Phase 2 (Year 3), the PI will revise the intervention and conduct a third SCD study to test the intervention’s feasibility and usability. In Phase 3 (Year 4), the team will use data from the feasibility and usability study to modify and develop a final manualized intervention. The team will evaluate the promise of the final version for improving students’ math outcomes in a fourth and final SCD study. In addition, the PI will conduct a cost analysis to determine the cost of implementing the final version of the intervention. The project will produce a fully developed math problem-solving program for middle and high school students with extensive support needs. The project also will result in peer-reviewed presentations, publications, and additional dissemination products. Amount: $495,731 Period of Performance: 7/1/2019–6/30/2023
Award Number: R324B190024 Institution: Oregon Health & Science University Principal Investigator: Emily Quinn Description: Developing an Augmentative and Alternative Communication (AAC) Intervention for Preschool Children With Severe Disabilities. The principal investigator (PI) will conduct a program of research for improving communication skills among young children who require augmentative and alternative communication (AAC) systems. At the same time, the PI will participate in mentoring and training activities to develop knowledge and skills related to the measurement of preschoolers’ communication skills, single-case design, randomized controlled trials, and virtual coaching for teachers. Despite research showing the benefits of AAC for children with disabilities, teachers often lack the knowledge and skills to support communication development for children who use AAC. Additionally, teachers report difficulties integrating AAC into classroom activities since it requires adaptations to instructional methods and classroom materials. Consequently, there is a critical need to enhance the
250
capacity of teachers to use AAC in their classrooms to support the communication development of young children with significant language or communication impairment. The PI intends to address this need by iteratively developing and testing the feasibility, usability, and promise of the Classroom AAC Intervention (CAI) for improving the implementation of communication support strategies among teachers and communication skills of preschoolers who use AAC. During Year 1, the PI will develop and revise CAI through focus groups with early childhood teachers (Study 1) and observations of typical preschool instruction (Study 2). In Year 2, the PI will revise CAI based on findings from Study 1 and Study 2 and test the effect of CAI on teachers’ use of communication support strategies and students' communication skills in a single-case design study (Study 3). In Year 3, the PI will revise CAI based on the findings from Study 3 and use another single-case design study to determine the best frequency and method for providing coaching to teachers, such as bug-in-ear or annotated video performance feedback (Study 4). In Year 4, the PI will conduct a small randomized controlled trial to determine the promise of the final version of the intervention for improving teachers’ use of communication support strategies and students’ communication outcomes (Study 5). The PI also will conduct a cost analysis to determine the cost of implementing the final version of the intervention. The project will produce a fully developed intervention to improve the implementation of communication support strategies among teachers and communication skills of preschoolers who use AAC. The project also will result in peer-reviewed presentations, publications, and additional dissemination products. Amount: $499,999 Period of Performance: 9/1/2019–8/31/2023
Award Number: R324B190030 Institution: Florida International University Principal Investigator: Michelle Cumming Description: Examining the Executive Function-Stress Loop and Its Association With Student Outcomes: Implications for Middle Schoolers With or At Risk for Emotional and Behavioral Disorders. The principal investigator (PI) will conduct a program of research focused on improving the social, emotional, and academic outcomes of students with or at risk for emotional and behavioral disorders (EBD). In addition, the PI will participate in mentoring and training activities to develop knowledge and skills related to longitudinal research designs, the assessment of executive functions (EFs) and classroom quality, and grant writing. Understanding the mechanisms through which behavior and academic problems develop and escalate has significant implications for programming for students with EBD who, despite school-based services, experience persistent negative outcomes. Theory and research highlight the following potential mechanisms: (1) school-based stressors, (2) ineffective stress regulation, and (3) deficits in neurocognitive processes known as EFs. Despite the developmental significance and malleability of EF, few researchers have examined EF or associations among school-based stress, student EF, and stress regulation (EF-Stress Loop) for students with EBD, especially during middle school—a period of active EF maturation, high stress, and stress reactivity. The PI will address this gap by conducting a longitudinal study with two cohorts of students with EBD in self-contained settings, students with or at risk for EBD in general education settings, and students without disabilities. The PI will follow students from the beginning of 6th grade to the end of 7th grade to examine how the EF-Stress Loop and classroom quality relate over time to behavioral and academic outcomes of middle schoolers with or at risk for EBD. The project will produce data on the mechanisms through which behavior and academic problems develop. The project will also result in peer-reviewed publications, presentations, and additional dissemination products. Amount: $499,992 Period of Performance: 8/1/2019–7/31/2023
251
Award Number: R324B190018 Institution: Virginia Commonwealth University Principal Investigator: Kristen Granger Description: Friendships and the Academic Skills and Behaviors of Students With Emotional and Behavioral Disorders: The Importance of Classroom Social Contextual Factors. The principal investigator (PI) will conduct a program of research focused on improving outcomes of students with or at risk for emotional and behavioral disorders (EBD). At the same time, the PI will participate in mentoring and training activities to develop knowledge and skills related to the friendships and social experiences of socially vulnerable youths, longitudinal social network methods and analyses, and grant management. It is well documented that children with EBD experience difficulties with social skills in addition to other negative behavioral and academic outcomes. What is less understood is what friendships look like for these students, how friendships influence education outcomes, and what malleable classroom factors influence these friendships. This knowledge gap calls for descriptive studies of the peer relationships of students with and at risk for EBD. To address this gap, the PI will conduct a longitudinal study with three cohorts of students with or at risk for EBD in grades K through 3 to examine (1) friendship formation, stability, and quality; (2) behavioral and academic outcomes linked to these friendships; and (3) malleable peer and teacher factors that may influence these friendships. The PI will collect and assess data on students’ friendships, peer rejection, group norms, and social hierarchy, as well as teacher interactions with students, general instructional practices, and social attunement. The project will produce evidence of associations between friendships and education outcomes and factors that influence friendships. The project also will result in peer-reviewed publications, presentations, and additional dissemination products. Amount: $496,959 Period of Performance: 8/1/2019–7/31/2023
Award Number: R324B190025 Institution: Florida State University Principal Investigator: Laura Steacy Description: Instructional Supports for Children With Dyslexia Learning to Read Complex Words. The principal investigator (PI) will conduct a program of research focused on better understanding factors associated with complex word reading among students with dyslexia. At the same time, the PI will participate in mentoring and training activities to develop knowledge and skills related to dyslexia, reading interventions and theory, randomized controlled trials, item-level statistical analyses, and grant writing. Although there have been recent calls for schools to address the unique educational needs of students with dyslexia, there is limited research on how to meet the needs of these students, especially as it relates to complex word reading. Complex words are important because they account for a large portion of the content-specific information students need to comprehend expository text. Without the skills required to read complex words, students with dyslexia often skip or guess at these words, which can negatively impact their academic knowledge. Research and theory suggest that instruction that builds students’ morphological knowledge and set-for-variability (SFV)—i.e., the ability to problem solve when faced with words with inconsistent grapheme/phoneme relationships—may be associated with better complex word-reading outcomes. However, this has not been tested empirically among students with dyslexia. The current project aims to address this gap by exploring the effect of different approaches for teaching complex words on reading outcomes of students with dyslexia. The PI will conduct an experimental study to explore and compare the effects of three different approaches to teaching complex word reading (SFV training, morphological training, and SFV plus morphological training) on students’ proximal and distal word-reading outcomes. The PI will recruit students in grades 3 through 5 with dyslexia across the first three years of the project to participate in a short-duration design experiment and randomly assign students to receive one of the three types of instruction. SFV training will encourage students to engage with mispronunciations/decoded forms of complex words in a variety of ways. Morphological training will directly target the spelling and meaning of words and will be based on
252
morphological interventions that have demonstrated positive effects in the literature. The combined training will involve equal parts of the SFV and morphological trainings. Students will complete a battery of reading and cognitive measures prior to and after the instructional period. The PI will analyze the data to determine the strength of the response to instruction on the trained words and compare the effects of the three approaches on the untaught transfer words. In addition, the PI will examine differential effects based on student skills (such as general word-reading skill, morphological awareness, and phonological awareness) and word characteristics (such as frequency, length, and number of morphemes). The project will produce preliminary evidence of the effect of different approaches for teaching complex words on reading outcomes of students with dyslexia. The project will also result in peer-reviewed publications, presentations, and additional dissemination products. Amount: $500,000 Period of Performance: 7/1/2019–6/30/2023
Award Number: R324B190010 Institution: University of Denver Principal Investigator: Garrett Roberts Description: Small Group Reading Intervention to Support Children With Pervasive Learning and Attention Needs (RISC-PLAN) in the Upper Elementary Grades. The principal investigator (PI) will conduct a program of research for improving the reading outcomes of students with or at risk for co-occurring reading disabilities and attention problems. In addition, the PI will participate in mentoring and training activities to develop knowledge and skills related to this particular group of students, the use of single-case design to inform intervention development, and the analysis of group design data. A growing body of research indicates that a substantial portion of students with or at risk for reading disabilities also exhibit attention problems. Furthermore, students who demonstrate both reading and attention problems are at higher risk for reading failure than students with either reading difficulties or inattention alone. Despite the prevalence and negative consequences of co-occurring reading and attention problems, there is limited research on how to effectively remediate poor reading outcomes for these students. The PI intends to address this limitation by iteratively developing and testing the usability, feasibility, and promise of a small group Reading Intervention to Support Children with Pervasive Learning and Attention Needs (RISC-PLAN) for students with or at risk for co-occurring reading disabilities and attention problems in grades 4 and 5. During Phase 1 (Years 1 and 2), the PI will iteratively develop RISC-PLAN by adding research-based behavioral supports (such as opportunities to respond, praise, and daily report cards) to an existing reading intervention, Voyager Passport, and examining its feasibility and usability in a series of single-case design studies. In Phase 2 (Year 3), the PI will conduct a small-scale randomized controlled trial to test the promise of the revised intervention for improving students’ reading and behavior outcomes. In Phase 3, the PI will determine the main effect of the intervention on student outcomes and examine potential mediators, such as student engagement, and moderators, such as fidelity of implementation. In addition, the PI will conduct analyses to determine the costs and cost-effectiveness of the intervention. The project will produce a fully developed small group reading intervention, RISC-PLAN, for students with or at risk for reading disabilities and attention problems. The project will also result in peer-reviewed presentations, publications, and additional dissemination products. Amount: $499,311 Period of Performance: 7/1/2019–6/30/2023
253
Low-Cost, Short-Duration Evaluation of Special Education Interventions Competition
Award Number: R324L190002 Institution: Michigan State University, Michigan Department of Education, Michigan Rehabilitation Services, and Project SEARCH Principal Investigator: Marissa Fisher Description: Effect of a 9-Month Soft Skills and Work-Based Employment Training Program in Improving Transition Students’ Success: A Randomized Controlled Trial. The purpose of this project is to test the relative efficacy of Project SEARCH (a widely used transition program with internships) alone compared to Project SEARCH plus Assistive Soft Skills and Employment Training (ASSET) and Employment Preparation and Skills Support (EPASS) for improving work-related social skills, job readiness, and employment outcomes of transition-age high school students with intellectual and developmental disabilities (IDD). In Michigan, 81 percent of individuals with IDD (including autism spectrum disorder and intellectual disability) are unemployed compared to just 9 percent of the general population. Educational and vocational agencies across the state are working together to improve outcomes for transition-age students with IDD, including funding the implementation of a school-to-work transition program, Project SEARCH. Despite initial efforts, employment rates for graduates of Project SEARCH in Michigan are still well below the national levels. In consultation with Michigan State University (MSU), the Michigan Department of Education (MDE) and Michigan Rehabilitation Services (MRS) identified an existing intervention that addresses the work-related social skills and job readiness skills needed for successful employment—the combination of ASSET and EPASS (ASSET-EPASS). This project will conduct a multisite, clustered, randomized controlled trial to determine whether adding ASSET-EPASS to Project SEARCH leads to stronger work-related social skills, job readiness, and employment outcomes for students with IDD than Project SEARCH alone. The research will take place in Project SEARCH sites, which are internship programs that businesses host in which school districts across Michigan may place their students. The project will produce evidence of the efficacy of the Project SEARCH + ASSET-EPASS intervention compared to Project SEARCH alone for students with IDD. The project also will result in peer-reviewed publications, presentations, and additional dissemination products. Amount: $249,927 Period of Performance: 8/16/2019‒8/15/2021
Research Networks Focused on Critical Problems of Policy and Practice in Special Education Competition
Multi-Tiered Systems of Support Research Network (MTSS-RN)
Award Number: R324A180020 Institution: University of Connecticut Principal Investigator: Michael Coyne Description: Multi-Tiered Systems of Support Research Network (MTSS-RN) Leadership Team. A research network involves several teams of researchers working together to address a critical problem or issue in special education. The objective is to encourage information sharing, build new knowledge, and assist policymakers and practitioners to strengthen education policies and programs and improve student education outcomes. The purpose of this project is to provide leadership to support the Multi-Tiered Systems of Support Research Network (MTSS-RN) that NCSER established by awarding four MTSS research teams—three in FFY 2019 and one in FFY 2018. The FFY 2019 research teams are (1) Enhancing Ci3T: Building Professional Capacity for High Fidelity Implementation to Support Students’ Educational Outcomes (Project ENHANCE), (2) Evaluating the Impact of Integrated Behavior and Reading Multi-Tiered Systems of Support in Elementary Schools, and (3) Measuring Implementation of Multi-Tiered Systems of Support (MTSS): Integrated MTSS Fidelity Rubric (IMFR). The fourth
254
research team, established in FFY 2018, is Cohesive Integration of Behavior Support within a Process of Data-Based Intervention Intensification. The MTSS-RN is examining MTSS that integrates both academic and behavioral support systems within elementary schools. The research teams are conducting a variety of investigations that cover development, evaluation, and/or measurement activities. The MTSS-RN lead will provide the organizational structure needed to allow the network to run smoothly, foster collaborative efforts across the research teams, and ensure that the network achieves its research and leadership goals. The activities of the MTSS-RN lead have three overarching, primary functions: administration and coordination of the network; research synthesis and dissemination of network products; and early career training to prepare a new generation of MTSS scholars with expertise in the relevant content and methodology. Amount: $1,499,572 Period of Performance: 7/1/2019–6/30/2024
Award Number: R324N190002 Institution: University of Kansas Principal Investigator: Kathleen Lane Description: Enhancing Ci3T: Building Professional Capacity for High Fidelity Implementation to Support Students’ Educational Outcomes (Project ENHANCE). The purpose of this project is to conduct an efficacy trial of the Comprehensive, Integrated, Three-Tiered (Ci3T) model of prevention for elementary schools that integrates academic, behavioral, and social learning supports. In addition, the research team will further identify and develop systems-level professional learning modules necessary for wide-scale implementation of the Ci3T model. The learning modules will include (1) Leadership Skills and Structures Needed to Support Ci3T, (2) Capacity of Ci3T Leadership Teams to Support Implementation, and (3) Data Systems for Behavior Screening. Ci3T has demonstrated promise through a series of descriptive, experimental, and psychometric studies, but the full Ci3T model has not yet been rigorously evaluated. The research team will conduct activities across two major components. In Component 1, the research team will conduct a randomized controlled trial of the Ci3T model and evaluate its cost-effectiveness. In Component 2, the research team will use an iterative process to develop professional learning modules to enhance Ci3T in ways that improve the scalability of the model and pilot test the Enhanced Ci3T model, E-Ci3T. The project will produce evidence of efficacy of the Ci3T model for improving elementary school students’ academic, behavioral, and social outcomes, as well as a fully developed E-Ci3T model with evidence of promise for improving the treatment integrity and social validity of Tier 1 practices. The project also will result in peer-reviewed publications, presentations, reports, and other products. Amount: $3,999,320 Period of Performance: 7/1/2019–6/30/2024
Award Number: R324A190012 Institution: University of Connecticut Principal Investigator: Michael Coyne Description: Evaluating the Impact of Integrated Behavior and Reading Multi-Tiered Systems of Support in Elementary Schools. The purpose of this project is to rigorously evaluate the impact of integrated behavior and reading practices in kindergarten through grade 2 within a comprehensive, multi-tiered system of support (MTSS) framework. Research has identified effective but separate reading and behavior practices for students with or at risk for disabilities and has examined separate reading and behavior tiered systems of support. However, because of the potential to use resources more efficiently and align support to address the common co-occurrence of reading and behavior difficulties, there is a need to conduct rigorous research on truly integrated practices within an MTSS framework. To address this need, the current project will examine the impacts of integrating reading and behavior support at Tiers 1, 2, and 3 of an MTSS framework on reading and behavior outcomes of students in grades K through 2 as well as teachers’ practice. In Year 1, the research team will work with schools to build their
255
capacity to implement schoolwide MTSS. In Study 1 (Year 2), the research team will use a cluster randomized controlled trial to investigate the impact of integrated Tier 1 behavior and reading instruction compared to behavior or reading support only. In Study 2 (Year 3), the team will use a regression discontinuity design to investigate the impact of supplemental Tier 2 integrated support on students who were not responsive to Tier 1 (or were identified for Tier 2 based on reading and behavior assessments). In Study 3 (Year 4), the team will use single-case design studies to investigate the effects of individualized, integrated Tier 3 intervention for students who demonstrated a lack of adequate response to both Tiers 1 and 2 (or were identified for Tier 3 based on reading and behavior assessments). In Year 5, the team will examine if teacher and schoolwide practices and student impacts can be sustained over time. The team also will examine if there are school, teacher/classroom, or student factors that moderate the outcomes of Tiers 1 and 2; evaluate the impact of multiple years of MTSS; and determine the intervention’s cost-effectiveness. The project will produce evidence of the impact of integrated behavior and reading practices within an MTSS framework in early elementary school. The project also will result in peer-reviewed publications, presentations, reports, and other dissemination products. Amount: $3,999,589 Period of Performance: 7/1/2019–6/30/2024
Award Number: R324N190007 Institution: American Institutes for Research Principal Investigator: Allison Gandhi Description: Measuring Implementation of Multi-Tiered Systems of Support (MTSS): Integrated MTSS Fidelity Rubric (IMFR). The purpose of this project is to develop and validate the Integrated MTSS Fidelity Rubric (IMFR), a tool for measuring school-level implementation of integrated multi-tiered systems of support (MTSS). Integrated MTSS provides multiple levels of coordinated supports to meet the academic and behavioral needs of all learners. Although MTSS is being planned and implemented in schools around the country, there are several challenges related to the integration of academic and behavioral supports and limited research on what is needed to implement integrated MTSS in a way that leads to improved student outcomes. The combination of the widespread use of MTSS and the complexities and challenges of implementation (for instance, the difficulty assessing student progress and adapting instruction and the tendency for students with disabilities to be served outside of MTSS) highlights the need for a tool that reliably and validly measures implementation of integrated MTSS and can be used for multiple purposes, including by schools and districts to guide implementation and by researchers to advance our understanding of the impacts of MTSS on student outcomes. While tools for assessing MTSS implementation exist, they are either limited in terms of their content, usability, or psychometric evidence or the degree to which they address the integration of academic and behavioral supports. The current study will address these limitations by developing and validating a tool to assess the implementation fidelity of integrated MTSS, examining the relationship between the implementation of the essential components of MTSS (as measured by the tool) and student outcomes, and examining the cost and perceived utility of implementing and scoring the assessment. Researchers will conduct their research activities across three phases. In Phase 1, the research team will develop an initial version of the IMFR based on a review of existing measures and feedback from a group of MTSS experts and school personnel. In Phase 2, the measure will undergo iterative administrations, psychometric testing, and refinement. In Phase 3, researchers will conduct psychometric testing on the revised IMFR, including additional validity tests, and examine the cost for intended users. The project will produce a fully developed and validated measure of MTSS implementation, the IMFR, along with supporting materials to enhance its feasibility and use, such as instructions for administration and scoring and a description of requirements for raters. The project also will result in peer-reviewed publications, presentations, reports, and other dissemination products. Amount: $3,998,026 Period of Performance: 7/1/2019–6/30/2024
256
Unsolicited Grant Competition
Award Number: R324U190001 Institution: University of Virginia Principal Investigator: Bryan Cook Description: Developing Infrastructure and Procedures for the Special Education Research Accelerator. In this project, researchers will develop and pilot test the Special Education Research Accelerator (SERA), a platform for organizing many research teams to collaboratively conduct high-quality, large-scale replication studies with diverse samples of learners with disabilities. The goal of SERA is to accelerate the process of gathering evidence on educational interventions for these learners and address some of the limitations of the special education research base. These limitations include a lack of adequately powered randomized controlled trials, especially for low-incidence disability populations; a lack of transparency and openness; scarcity of independent, systematic replications; and limited diversity among researchers, study samples, settings, and contexts. To accomplish these goals, the research team will conduct a two-year project to (a) develop infrastructure supports for SERA, (b) conduct a pilot test of SERA and analyze the data, and (c) assess the feasibility and usability of SERA. During Year 1, the research team will develop resources for training and technical assistance for research partners; templates for formalizing partnership relationships (data sharing agreements and IRB protocols); and an online data portal to house resources, facilitate data collection efforts, and track communication among the research team and partners. In Years 1 and 2, the research team will conduct a pilot study of SERA. Specifically, they will recruit research partners from across the United States who have expressed interest in being involved in open science projects; work with partners to select an intervention, outcome measures, and sample eligibility criteria; and train research partners on the intervention and study procedures. Research partners will then recruit students and conduct random assignment, implement the intervention and collect data, and submit data to the research team. In Year 2, the research team will analyze data to determine whether certain assumptions required for replication of results were met, estimate site effects and the pooled effect across sites on learner outcomes, evaluate replication success, and describe the quality of the data from research partners and the technical assistance provided by the research team. Finally, the research team will solicit feedback from research partners and facilitate an external review of the SERA processes, procedures, materials, and data to evaluate the feasibility and usability of SERA and inform future iterations of the platform. The project will produce evidence of the efficacy of a platform for organizing many research teams to collaboratively conduct high-quality, large-scale replication studies. The project also will result in peer-reviewed publications, presentations, and additional dissemination products. Amount: $575,273 Period of Performance: 9/1/2019–8/31/2021
Award Number: R324U190002 Institution: University of Oregon Principal Investigator: Wendy Machalicek Description: Improving the Accessibility of Effect Size and Synthesis Methods for Single-Case Research. In this project, researchers will develop, refine, and disseminate guidance about the appropriate use of single-case design (SCD) effect size and synthesis (including meta-analysis) methods and best practices for summarizing results of individual studies and synthesizing findings across studies. This guidance is important given the expanded use of SCD research methods, the emergence of SCD effect size measures and synthesis methods, and the use of synthesis methods to identify and confirm evidence-based practices in education. The specific objectives are to (1) conduct a literature review of effect size and synthesis methods for SCD research, (2) develop and disseminate a methods guide with detailed illustrations of appropriate SCD effect size and synthesis methods for commonly encountered research synthesis contexts, and (3) develop and support a suite of software tools (R package, desktop and web apps) that any SCD researcher or meta-analyst could use to calculate various effect sizes for SCD studies. To
257
accomplish these objectives, the research team will conduct a 3-year project. During Year 1, the research team will conduct a literature review of SCD effect size and synthesis methods, obtain feedback on the review from an advisory board of SCD experts, and make suggested revisions. Across Years 1-3, the research team will develop, refine, and finalize a methods guide with input from their advisory panel. The methods guide will summarize technical developments in the use of effect size measures and synthesis methods for SCD and provide guidance on the underlying assumptions, advantages and disadvantages, and strategies for selecting and using each approach. During this same time period, the team will develop, refine, and finalize a suite of software tools to calculate SCD effect sizes. Specifically, they will build on and refine existing software tools (i.e., the scdhlm: Estimating Hierarchical Linear Models for Single-Case Designs and SingleCaseES packages and accompanying web applications) to develop a reliable and easy-to-use suite of software tools for calculating within-case, between-case/design-comparable, and other effect size measures for commonly used SCDs. Field tests with researchers with varying levels of SCD expertise and feedback from the advisory panel will inform refinement of the tools. Each component of their project will be interconnected. The literature review will guide the initial development of both the methods guide and the suite of software tools, and the methods guide will incorporate documentation and examples from the suite of software tools. Throughout the project, the research team will disseminate resources through a project website, fact sheets, webinars, publications, and conference presentations. Amount: $600,000 Period of Performance: 1/1/2020–12/31/2022

Section V
Summary of Studies and Evaluations Under Section 664 of IDEA

261
Summary of Studies and Evaluations Under Section 664 of IDEA
In the December 2004 reauthorization of the Individuals with Disabilities Education Act (IDEA), Congress required the Secretary to delegate to the Director of the Institute of Education Sciences (IES) the responsibility to conduct studies and evaluations under Section 664(a), (b), (c), and (e) of IDEA. Section 664(a) of IDEA delegates the responsibility of carrying out Section 664 to IES, with the exception of Section 664(d) and (f). As Section 664(a) specifies, IES assesses the progress in the implementation of IDEA either directly or through grants, contracts, or cooperative agreements it awards to eligible entities on a competitive basis. This assessment includes the effectiveness of State and local efforts to provide (1) a free appropriate public education to children with disabilities and (2) early intervention services to infants and toddlers with disabilities and infants and toddlers who would be at risk of having substantial developmental delays if they did not receive early intervention services.
Section V of the 42nd Annual Report to Congress, 2020 describes studies authorized by Section 664(a) and (e) of the law. As Section 664(e) of IDEA specifies, IES may support additional objective studies, evaluations, and assessments. This includes studies that (1) analyze the impacts and outcomes of State and local education agencies through their reform activities to improve educational and transitional services and results for children with disabilities; (2) analyze State and local needs for professional development, parent training, and other appropriate activities to reduce the need for disciplinary actions involving children with disabilities; (3) assess educational and transitional services and results for children with disabilities from minority backgrounds; (4) measure educational and transitional services and results for children with disabilities, including longitudinal studies; and (5) identify and report on the placement of children with disabilities by disability category.
The National Center for Special Education Research (NCSER) and the National Center for Education Evaluation and Regional Assistance (NCEE), which are part of IES, are responsible for and collaborate on studies and evaluations conducted under Section 664(a), (b), (c), and (e) of IDEA. Section VI of the annual report describes studies that contribute to the national assessment of IDEA that Section 664(b) requires. At this time, work on Section 664(c), with its focus on a study of alternate achievement standards, is complete, and IES made no awards related to studies of alternate achievement standards in Federal fiscal year (FFY) 2019. Therefore, unlike previous annual reports to Congress, the 42nd annual report does not address studies related to students with disabilities who take alternate assessments. Section 664(e) of IDEA authorized and IES supported the following studies during FFY 2019 (i.e., October 1, 2018, through September 30, 2019).
262
Contract Number: 91990019C0002 Contractor: Westat Project Director: Elizabeth Bissett Description: Design and Conduct of the Early Childhood Longitudinal Study, Kindergarten Class of 2022-23 (ECLS-K:2023). The Early Childhood Longitudinal Study, Kindergarten Class of 2022–23 (ECLS-K:2023) is the fourth in a series of longitudinal studies of young children by the National Center for Education Statistics. The study will provide important information on children’s early learning and development, preschool/early care and education experiences, transition into kindergarten, and progress through the elementary grades. The study planned data collection for the children’s preschool (spring 2022), kindergarten (fall 2022 and spring 2023), first-grade (spring 2024), third-grade (spring 2026), and fifth-grade (spring 2028) years. The study will collect data directly from the child (including direct assessments in reading and math as well as child questionnaires in the later rounds) and the child’s parents/guardians, teachers, and school administrators. The current contract includes design work for all study rounds and data collection work through the third-grade round. IDEA studies and evaluations funding ($350,473) will support data collection from special education teachers on study children with an individualized education program. Information about the ECLS program studies is available at https://nces.ed.gov/ecls (accessed September 9, 2019). Amount: $92,964,566 Period of Performance: 1/4/2019–1/3/2029
Contract Number: ED-IES-14-C-0119 Contractor: Westat Project Director: Elizabeth Bissett Description: Early Childhood Longitudinal Study, Kindergarten Class of 2010–11 (ECLS-K:2011), Fifth-Grade Data Collections. The Early Childhood Longitudinal Study, Kindergarten Class of 2010–11 (ECLS-K:2011) is the third in a series of longitudinal studies by the National Center for Education Statistics to examine children’s early learning and development, transitions into kindergarten and beyond, and progress through school. The study followed a cohort of children from their kindergarten year (the 2010–11 school year) through the 2015–16 school year, when most of the children were in fifth grade. Approximately 18,000 children participated in the first year of the study, which included data collections in fall 2010 and spring 2011. The study also included data collections in fall 2011 and spring 2012, when most of the children were in first grade; fall 2012 and spring 2013, when most of the children were in second grade; spring 2014, when most of the children were in third grade; spring 2015, when most of the children were in fourth grade; and spring 2016, when most of the children were in fifth grade. This particular contract covered national data collection in spring 2016. The data collection included one-on-one direct child assessments (measuring knowledge and skills in reading, mathematics, and science, as well as executive function, height, and weight); a child questionnaire; computer-assisted parent interviews; and surveys for general classroom teachers, special education teachers of children receiving special education services, and school administrators. In addition, the study conducted an evaluation of children’s hearing. Individuals with Disabilities Education Act (IDEA) studies and evaluations funding ($109,196) supported data collection from special education teachers on study children with an individualized education program and from classroom teachers and school administrators on Response to Intervention practices in study schools. A report from the study, Findings From the Fifth-Grade Round of the Early Childhood Longitudinal Study, Kindergarten Class of 2010-11 (ECLS-K:2011), was released on February 9, 2019, and is available at https://nces.ed.gov/pubsearch/pubsinfo.asp?pubid=2019130(accessed September 9, 2019). Amount: $19,633,031 Period of Performance: 9/23/2014–3/23/2019
263
Contract Number: ED-IES-15-O-5016 Contractor: RTI International Project Director: Daniel Pratt Description: Middle Grades Longitudinal Study of 2017-18 (MGLS:2017). The Middle Grades Longitudinal Study of 2017-18 (MGLS:2017) is a study to gather information about U.S. public and private school students’ developmental and learning trajectories during their middle-grade years, or grades 6 through 8. This study also will identify factors in their school, classroom, home, and out-of-home experiences that may help explain differences in achievement and development that can contribute to academic success and other outcomes both during the middle-grade years and beyond. The study will include information on a subpopulation of students with disabilities; however, the population will not necessarily be a representative sample of students with disabilities. The sixth-grade data collection for the Main Study took place from January through August 2018. A sample of about 14,000 students in sixth grade from about 570 schools participated along with their parents, math teachers, special education teachers, and school administrators. One follow-up data collection occurred in January through July 2020, when most students were in the eighth grade, regardless of whether they changed schools. To the extent possible, the team included all students with disabilities whom the team selected for the study in the assessments. Students who were not able to take the assessments or survey remained in the study sample, and the study team asked their parents and teachers to provide information on the students’ educational experiences and proficiencies. The team field tested the instruments the team used in this study several times over the years preceding the Base Year data collection in order to improve their validity and reliability. Survey instruments include parent, mathematics teacher, special education teacher, and school administrator surveys along with a Facility Observation Checklist that helps describe the physical aspects of the school. Assessments include mathematics, reading, and executive function, as well as a survey component that asks students about such things as their peer relations, activities outside of school, technology use, aspirations, and socioemotional functioning. The study team took student height and weight measurements. IDEA studies and evaluations funding ($3,661,467) supported a portion of the design work and is partly supporting MGLS:2017 data collection. Reports from this study will be available at https://surveys.nces.ed.gov/MGLS/Home/About (accessed October 7, 2019). Amount: $39,801,746 Period of Performance: 8/14/2015–8/13/2025
Contract Number: ED-IES-15-C-0046 Contractor: RTI International, SRI International, Social Dynamics Project Director: Michael Bryan Description: National Longitudinal Transition Study 2012 (NLTS 2012) Phase II (also referred to as Post-High School Outcomes for Youth with Disabilities Study). Helping students, particularly those with disabilities, to complete high school prepared to pursue postsecondary education, jobs, and independent living is a national priority. The Individuals with Disabilities Education Act (IDEA) provides funds to school districts to serve students with an individualized education program (IEP) and emphasizes transition services to help youths with disabilities complete high school prepared to achieve these important post-school outcomes. Phase II of the National Longitudinal Transition Study 2012 (NLTS 2012) is examining how these transitions are taking place, building on an earlier survey of a nationally representative set of students with and without IEPs (NLTS 2012 Phase I). The study will address questions such as the following: To what extent do youths with disabilities who receive special education services under IDEA make progress through high school compared with other youths, including those identified for services under Section 504 of the Rehabilitation Act of 1973? Are youths with disabilities achieving the post-high school outcomes envisioned by IDEA, and how do their college, training, and employment rates compare with those of other youths? How do these high school and postsecondary experiences and outcomes vary by student characteristics, including their disability category, age, sex, race/ethnicity, English learner status, income status, and type of high school attended (including regular public school, charter school, career/technical school, special education school, or other State- or
264
federally operated institution)? Study plans include collecting (1) school district administrative data, including transcripts, from districts that participated in NLTS 2012; (2) postsecondary enrollment information through the National Student Clearinghouse; (3) information about vocational rehabilitative services and supports youths received from the Department’s Rehabilitative Services Administration; and (4) disability program, employment, and earnings data from the Social Security Administration. The study team will link the administrative data with the 2012–2013 survey data to examine key steps in high school coursetaking and completion as well as youths’ experiences with college, training, and employment. The final study reports will be announced on https://ies.ed.gov/ncee/ (accessed November 13, 2019). Amount: $9,757,437 Period of Performance: 9/25/2015–3/24/2023
Section VI
Extent and Progress of the Assessment of National Activities

267
Extent and Progress of the Assessment of National Activities
As specified in Section 664(b) of the Individuals with Disabilities Education Act (IDEA), as reauthorized in 2004, the Secretary has the responsibility to conduct a “national assessment” of activities carried out with Federal funds under IDEA. The Secretary has delegated to the Institute of Education Sciences (IES) the responsibility for performing this national assessment of the implementation and effectiveness of IDEA and of the Federal, State, and local programs and services supported under the law, as Section 664(b) requires. IES is carrying out this national assessment to (1) determine the effectiveness of IDEA in achieving its purposes; (2) provide timely information to the President, Congress, the States, local agencies, and the public on how to implement IDEA more effectively; and (3) provide the President and Congress with information that will be useful in developing legislation to achieve IDEA’s purposes more effectively.
The national assessment scope includes examining the implementation and impact of programs assisted under IDEA, the types of programs and services that have demonstrated the greatest likelihood of success, and the implementation and impact of professional development activities assisted under IDEA. The scope also includes examining the effectiveness of State and local agencies assisted under IDEA in achieving IDEA’s purpose by improving the achievement of students with disabilities relative to their peers, improving participation in the general education curriculum, improving transitions, placing and serving children with disabilities in the least restrictive environment appropriate, preventing school dropout, reducing inappropriate identification, improving parent participation, and resolving disagreements through alternative methods.
The National Center for Education Evaluation and Regional Assistance (NCEE), which is part of IES, is responsible for the national assessment of IDEA, in coordination with the National Center for Special Education Research (NCSER) at IES. NCEE supported the following studies and evaluations related to the national assessment during Federal fiscal year (FFY) 2019 (i.e., October 1, 2018, through September 30, 2019).
Contract Number: ED-IES-14-C-0001 Contractor: Mathematica Policy Research, University of North Carolina at Chapel Hill, University of Florida, Vanderbilt University, University of Denver, University of South Florida Project Director: Cheri Vogel Description: Evaluation of Preschool Special Education Practices, Phase I. Experiences in early childhood programs can help young children, including those with disabilities, develop skills important for classroom learning. However, many children need help to strengthen their social-emotional skills and facilitate their engagement in classroom activities. Currently, there is limited evidence on how to effectively integrate these kinds of supports into the general curriculum, particularly in classrooms where
268
children with disabilities are served alongside their peers as promoted by the Individuals with Disabilities Education Act (IDEA). This study will test the efficacy of a coordinated set of evidence-based strategies, with multiple levels of intensity depending on student needs. The approach includes programs for classroom-wide instruction of social and emotional skills and supports targeting children who demonstrate risk for social-emotional delays or persistent behavior challenges with the general preschool curriculum. The study will address questions such as the following: Are teachers able to successfully implement a new approach that integrates targeted instructional supports for children who demonstrate risk for social-emotional delays or persistent behavior challenges with instruction for all children? What are the impacts of this approach on the classroom environment and the social-emotional, behavioral, and language skills of children with and without disabilities in inclusive preschool classrooms? The study team randomly assigned 34 inclusive preschool classrooms in 29 schools from three districts to either receive training and coaching support to implement the study’s program integration approach or continue with the teachers’ regular programs and practices. The addition and integration of the programs began in 2019, and the study team will collect data on participating preschool students for two school years. These data include documentation of training provided to teachers, classroom observations to assess how teachers are implementing program components, teacher surveys, and measures of children’s social skills. If the efficacy study shows promise, a large-scale impact evaluation may be conducted in the future. The report from this study will be announced on https://ies.ed.gov/ncee/ (accessed November 12, 2019). Amount: $11,399,904 Period of Performance: 11/22/2013–11/21/2022
Contract Number: 91990019C0078 Contractor: American Institutes for Research, University of North Carolina at Charlotte, Social Policy Research Associates, Quality Information Partners Project Director: Jessica Heppen Description: Evaluation of Transition Supports for Youth With Disabilities. More than a decade after the 2004 reauthorization of the Individuals with Disabilities Education Act (IDEA), students with disabilities continue to lag behind their peers in high school graduation, enrollment in postsecondary education, and employment. A central goal of IDEA is to help students with disabilities prepare for their transition from secondary school to further education, work, and independent living. To achieve this goal, IDEA requires the provision of transition services focused on improving students’ academic and functional achievement in accordance with their individualized education program. Although studies suggest the importance of certain types of preparations for students with disabilities, there is limited evidence about the effectiveness of those types of preparations or other strategies to promote post-high school outcomes. This study will address several questions: What is known about the effectiveness of transition strategies? And for whom? What transition strategies are feasible to examine with an impact study? What are possible parameters for designing rigorous impact studies? The study will summarize available evidence on the effectiveness of transition supports and interview transition stakeholders to identify promising transition strategies and methods for studying them. The Department will make a decision in 2021 about conducting an impact study based on this work. The report from the systematic evidence review is expected in 2021 and will be announced on https://ies.ed.gov/ncee/ (accessed September 9, 2019). Amount: $1,180,475 Period of Performance: 9/24/2019–5/15/2022
Contract Number: ED-IES-14-C-0003 Contractor: MDRC, American Institutes for Research, Decision Information Resources, Harvard University Project Director: Fred Doolittle Description: Impact Evaluation of Training in Multi-Tiered Systems of Support for Behavior (MTSS-B). Training school staff in supporting the behavior of all students is becoming increasingly attractive to districts and schools as a vehicle for school improvement. Implementation of multi-tiered systems of
269
support for behavior (MTSS-B) is an approach to improving school and classroom climate as well as student outcomes. MTSS-B is a multi-tiered, systematic framework for teaching and reinforcing behavior for all students as well as for providing additional support to those who need it. The Office of Special Education Programs has supported the study and implementation of tiered systems of behavior support since the 1990s, and over a third of U.S. districts report implementing these systems at the elementary school level. Recent small-scale studies have shown the promise of MTSS-B. This evaluation occurs under the National Assessment of IDEA, which permits districts to use a portion of their IDEA funds to provide services to students whom they have not identified as needing special education, but who need additional support, such as MTSS-B, to succeed in a general education environment. This study will address several questions: What is the impact on school staff practices, school climate, and student outcomes of providing training in the MTSS-B framework plus universal positive behavior supports (Tier I) and a targeted (Tier II) intervention? What are the impacts for relevant subgroups (e.g., at-risk students)? What MTSS-B trainings and supports did districts provide? What MTSS-B activities occurred in the schools receiving MTSS-B training? How do these MTSS-B activities differ from those in schools that do not receive the training? The contractor, with assistance and input from the U.S. Department of Education and in consultation with a panel of experts, competitively selected an MTSS-B training provider. The study team randomly assigned approximately 90 elementary schools to either (1) training in MTSS-B that includes universal supports (Tier I) plus a targeted (Tier II) intervention or (2) a business-as-usual control group. Treatment schools received training in MTSS-B prior to and across two school years, 2015–16 (Tier I) and 2016–17 (Tiers I and II), and implemented MTSS-B across these two years. Data collection included a staff survey, teacher ratings of student behavior, classroom observations, site visits, and student records data. Data collection took place across the 2015–16 through 2018–19 school years. The impact report will be announced on https://ies.ed.gov/ncee/ (accessed September 9, 2019). Amount: $23,796,966 Period of Performance: 11/26/2013–8/25/2021
Contract Number: 91990018C0046 Contractor: American Institutes for Research, Instructional Research Group, School Readiness Consulting Project Director: Anja Kurki Description: Impact Evaluation of Training in Multi-Tiered Systems of Support for Reading in Early Elementary School. A third of U.S. students fail to develop foundational reading skills by 4th grade that are necessary to succeed academically. In addition, the achievement gap is growing, as demonstrated by The Nation’s Report Card. To address these concerns, the Every Student Succeeds Act (ESSA) promotes the use of evidence-based literacy interventions. Also, the Department of Education (Department) has made supporting educators with the knowledge, skills, professional development, or materials necessary to improve reading instruction a key priority. The Individuals with Disabilities Education Act (IDEA) similarly encourages high-quality instruction along with better identification of students needing extra support to prevent or mitigate student reading issues. This study will provide much-needed evidence by evaluating two professional development strategies for bolstering core reading instruction and supplemental supports, guided by data, within a multi-tiered system of support for reading (MTSS-R) framework. These strategies were competitively selected based on prior evidence of effectiveness. MTSS-R is a widely used framework for providing high-quality reading instruction for all students, identifying students needing supplemental or more intensive supports, and providing these additional supports for those who need it. The first strategy builds teachers’ knowledge in the science of reading development and provides resources and materials with support on when to use them. For struggling students, staff are provided and trained to use a supplemental reading curriculum. The second strategy trains teachers to use scripted lessons that complement the core reading curriculum. For struggling students, staff are trained to pre-teach the core reading curriculum lessons for struggling students. The study will address the following key research questions for each professional development strategy: What are the impacts on classroom practice in core reading instruction for all students and supplemental
270
instruction for struggling students? What are the impacts on student literacy for all students? What are the impacts for struggling students? This study includes two professional development strategies implemented in grades 1 and 2. The study team will randomly assign approximately 150 schools to one of the professional development strategies or to a business-as-usual control group. The study’s professional development will be provided across three school years, 2020–21, 2021–22, and 2022–23. Data collection includes documentation of training delivery, a teacher survey, a reading specialist survey, site visits, training provider logs and fidelity data, coach logs and team minutes, classroom and supplemental support observations, student records data through grade 5, and individual student testing. The study team will analyze these data to answer the study’s primary research questions. In addition, the study will include supplemental products that focus on practical information learned from implementing the strategies and on special topics to help practitioners understand and address students’ reading needs. The first report for the study is expected in 2024 and will be announced on https://ies.ed.gov/ncee/ (accessed September 9, 2019). Amount: $36,087,814 Period of Performance: 9/27/2018–11/30/2027
Contract Number: ED-IES-17-C-0069 Contractor: Mathematica Policy Research, National Center for Special Education in Charter Schools, Walsh Taylor Inc. Project Director: Amy Johnson Description: State and Local Implementation of the Individuals with Disabilities Education Improvement Act. The Individuals with Disabilities Education Improvement Act of 2004 (IDEA) is the most recent reauthorization of the law passed in 1975 to promote a free appropriate public education for children with disabilities. The most recent national IDEA implementation study provided a picture of State agency and school district implementation of IDEA in 2009. Since then, although IDEA has not been reauthorized, developments in key areas may have influenced the context and implementation of special education and early intervention. This study will address several questions: How do States and districts identify infants, toddlers, children, and youths for early intervention and special education services? How do they measure disproportionate identification, and what policies and practices have States and districts implemented with the goal of addressing disproportionate identification? What policies and programs do States and districts have in place to support infants, toddlers, children, and youths identified for early intervention or special education services? How have these policies and programs changed over time? To what extent do States and districts rely on evidence on the effectiveness of policies, programs, and supports for infants, toddlers, children, and youths with disabilities? How do States and districts allocate resources—including funding and personnel—to support infants, toddlers, children, and youths with disabilities? What types of supports do schools provide to children and youths with disabilities to support their academic and behavioral learning, both within and outside of general education classrooms? Data collection will include surveys of State administrators from all States, the District of Columbia, and territories receiving IDEA funding, as well as surveys of a nationally representative sample of school districts and schools during the 2019–20 and, potentially, the 2022–23 school years. The study team will analyze data from these surveys descriptively to answer the study’s research questions. The first report for the study is expected in 2021 and will be announced on https://ies.ed.gov/ncee/ (accessed September 9, 2019). Amount: $6,411,519 Period of Performance: 9/28/2017–3/29/2024
Appendix A
Infants, Toddlers, Children, and Students Served Under IDEA, by Age Group and State

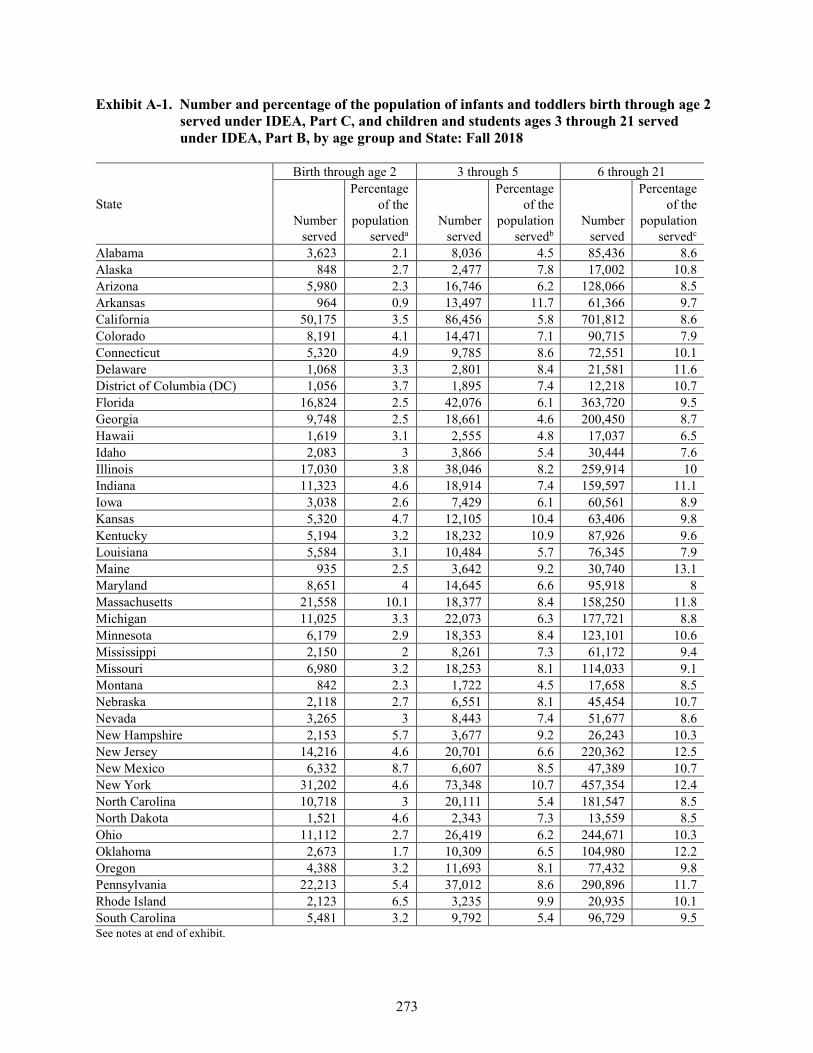
273
Exhibit A-1. Number and percentage of the population of infants and toddlers birth through age 2 served under IDEA, Part C, and children and students ages 3 through 21 served under IDEA, Part B, by age group and State: Fall 2018
State
Birth through age 2 3 through 5 6 through 21
Number served
Percentage of the
population serveda
Number served
Percentage of the
population servedb
Number served
Percentage of the
population servedc
Alabama 3,623 2.1 8,036 4.5 85,436 8.6 Alaska 848 2.7 2,477 7.8 17,002 10.8 Arizona 5,980 2.3 16,746 6.2 128,066 8.5 Arkansas 964 0.9 13,497 11.7 61,366 9.7 California 50,175 3.5 86,456 5.8 701,812 8.6 Colorado 8,191 4.1 14,471 7.1 90,715 7.9 Connecticut 5,320 4.9 9,785 8.6 72,551 10.1 Delaware 1,068 3.3 2,801 8.4 21,581 11.6 District of Columbia (DC) 1,056 3.7 1,895 7.4 12,218 10.7 Florida 16,824 2.5 42,076 6.1 363,720 9.5 Georgia 9,748 2.5 18,661 4.6 200,450 8.7 Hawaii 1,619 3.1 2,555 4.8 17,037 6.5 Idaho 2,083 3 3,866 5.4 30,444 7.6 Illinois 17,030 3.8 38,046 8.2 259,914 10 Indiana 11,323 4.6 18,914 7.4 159,597 11.1 Iowa 3,038 2.6 7,429 6.1 60,561 8.9 Kansas 5,320 4.7 12,105 10.4 63,406 9.8 Kentucky 5,194 3.2 18,232 10.9 87,926 9.6 Louisiana 5,584 3.1 10,484 5.7 76,345 7.9 Maine 935 2.5 3,642 9.2 30,740 13.1 Maryland 8,651 4 14,645 6.6 95,918 8 Massachusetts 21,558 10.1 18,377 8.4 158,250 11.8 Michigan 11,025 3.3 22,073 6.3 177,721 8.8 Minnesota 6,179 2.9 18,353 8.4 123,101 10.6 Mississippi 2,150 2 8,261 7.3 61,172 9.4 Missouri 6,980 3.2 18,253 8.1 114,033 9.1 Montana 842 2.3 1,722 4.5 17,658 8.5 Nebraska 2,118 2.7 6,551 8.1 45,454 10.7 Nevada 3,265 3 8,443 7.4 51,677 8.6 New Hampshire 2,153 5.7 3,677 9.2 26,243 10.3 New Jersey 14,216 4.6 20,701 6.6 220,362 12.5 New Mexico 6,332 8.7 6,607 8.5 47,389 10.7 New York 31,202 4.6 73,348 10.7 457,354 12.4 North Carolina 10,718 3 20,111 5.4 181,547 8.5 North Dakota 1,521 4.6 2,343 7.3 13,559 8.5 Ohio 11,112 2.7 26,419 6.2 244,671 10.3 Oklahoma 2,673 1.7 10,309 6.5 104,980 12.2 Oregon 4,388 3.2 11,693 8.1 77,432 9.8 Pennsylvania 22,213 5.4 37,012 8.6 290,896 11.7 Rhode Island 2,123 6.5 3,235 9.9 20,935 10.1 South Carolina 5,481 3.2 9,792 5.4 96,729 9.5 See notes at end of exhibit.
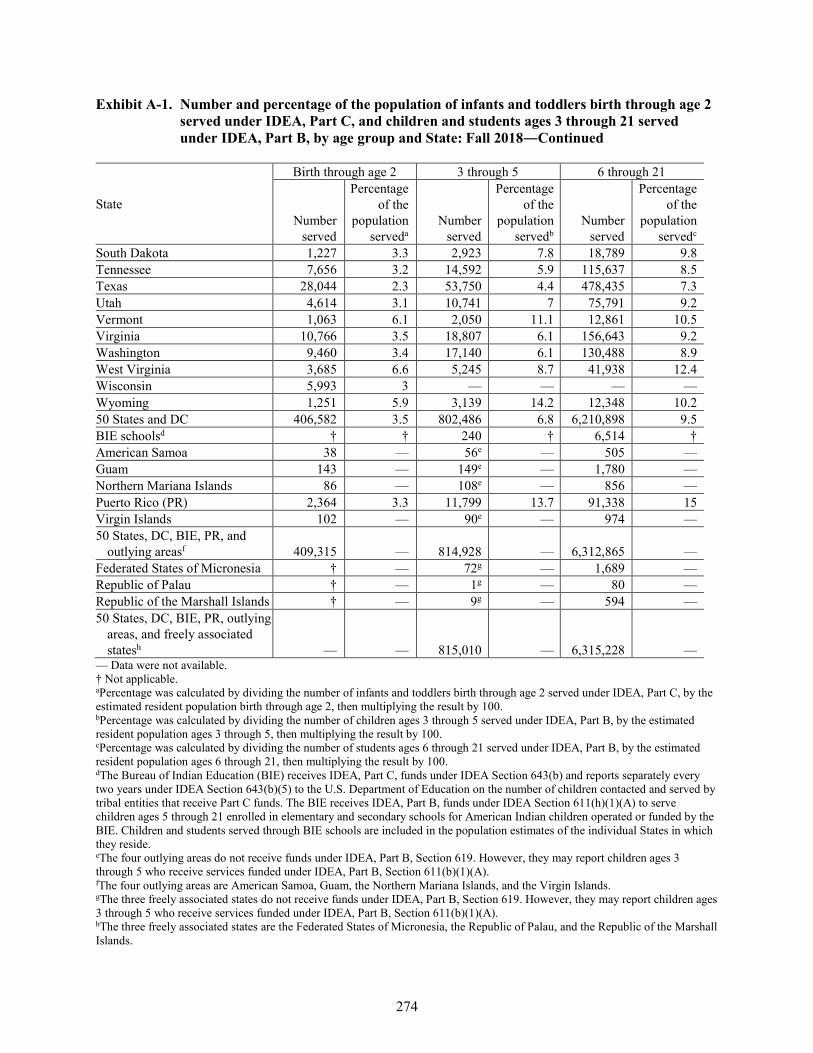
274
Exhibit A-1. Number and percentage of the population of infants and toddlers birth through age 2 served under IDEA, Part C, and children and students ages 3 through 21 served under IDEA, Part B, by age group and State: Fall 2018―Continued
State
Birth through age 2 3 through 5 6 through 21
Number served
Percentage of the
population serveda
Number served
Percentage of the
population servedb
Number served
Percentage of the
population servedc
South Dakota 1,227 3.3 2,923 7.8 18,789 9.8 Tennessee 7,656 3.2 14,592 5.9 115,637 8.5 Texas 28,044 2.3 53,750 4.4 478,435 7.3 Utah 4,614 3.1 10,741 7 75,791 9.2 Vermont 1,063 6.1 2,050 11.1 12,861 10.5 Virginia 10,766 3.5 18,807 6.1 156,643 9.2 Washington 9,460 3.4 17,140 6.1 130,488 8.9 West Virginia 3,685 6.6 5,245 8.7 41,938 12.4 Wisconsin 5,993 3 — — — — Wyoming 1,251 5.9 3,139 14.2 12,348 10.2 50 States and DC 406,582 3.5 802,486 6.8 6,210,898 9.5 BIE schoolsd † † 240 † 6,514 † American Samoa 38 — 56e — 505 — Guam 143 — 149e — 1,780 — Northern Mariana Islands 86 — 108e — 856 — Puerto Rico (PR) 2,364 3.3 11,799 13.7 91,338 15 Virgin Islands 102 — 90e — 974 — 50 States, DC, BIE, PR, and
outlying areasf 409,315 — 814,928 — 6,312,865 — Federated States of Micronesia † — 72g — 1,689 — Republic of Palau † — 1g — 80 — Republic of the Marshall Islands † — 9g — 594 — 50 States, DC, BIE, PR, outlying
areas, and freely associated statesh — — 815,010 — 6,315,228 —
— Data were not available. † Not applicable. aPercentage was calculated by dividing the number of infants and toddlers birth through age 2 served under IDEA, Part C, by the estimated resident population birth through age 2, then multiplying the result by 100. bPercentage was calculated by dividing the number of children ages 3 through 5 served under IDEA, Part B, by the estimated resident population ages 3 through 5, then multiplying the result by 100. cPercentage was calculated by dividing the number of students ages 6 through 21 served under IDEA, Part B, by the estimated resident population ages 6 through 21, then multiplying the result by 100. dThe Bureau of Indian Education (BIE) receives IDEA, Part C, funds under IDEA Section 643(b) and reports separately every two years under IDEA Section 643(b)(5) to the U.S. Department of Education on the number of children contacted and served by tribal entities that receive Part C funds. The BIE receives IDEA, Part B, funds under IDEA Section 611(h)(1)(A) to serve children ages 5 through 21 enrolled in elementary and secondary schools for American Indian children operated or funded by the BIE. Children and students served through BIE schools are included in the population estimates of the individual States in which they reside. eThe four outlying areas do not receive funds under IDEA, Part B, Section 619. However, they may report children ages 3 through 5 who receive services funded under IDEA, Part B, Section 611(b)(1)(A). fThe four outlying areas are American Samoa, Guam, the Northern Mariana Islands, and the Virgin Islands. gThe three freely associated states do not receive funds under IDEA, Part B, Section 619. However, they may report children ages 3 through 5 who receive services funded under IDEA, Part B, Section 611(b)(1)(A). hThe three freely associated states are the Federated States of Micronesia, the Republic of Palau, and the Republic of the Marshall Islands.
275
SOURCE: U.S. Department of Education, EDFacts Metadata and Process System (EMAPS), OMB #1820-0557: IDEA Part C Child Count and Settings Collection, 2018. U.S. Department of Education, EDFacts Data Warehouse (EDW), OMB #1850-0925: IDEA Part B Child Count and Educational Environments Collection, 2018. U.S. Department of Commerce, U.S. Census Bureau. Intercensal Estimates of the Resident Population by Single Year of Age and Sex for States and the United States: April 1, 2010 to July 1, 2018, 2018. Data were accessed fall 2019. For actual IDEA data used, go to https://www2.ed.gov/programs/osepidea/618-data/state-level-data-files/index.html.
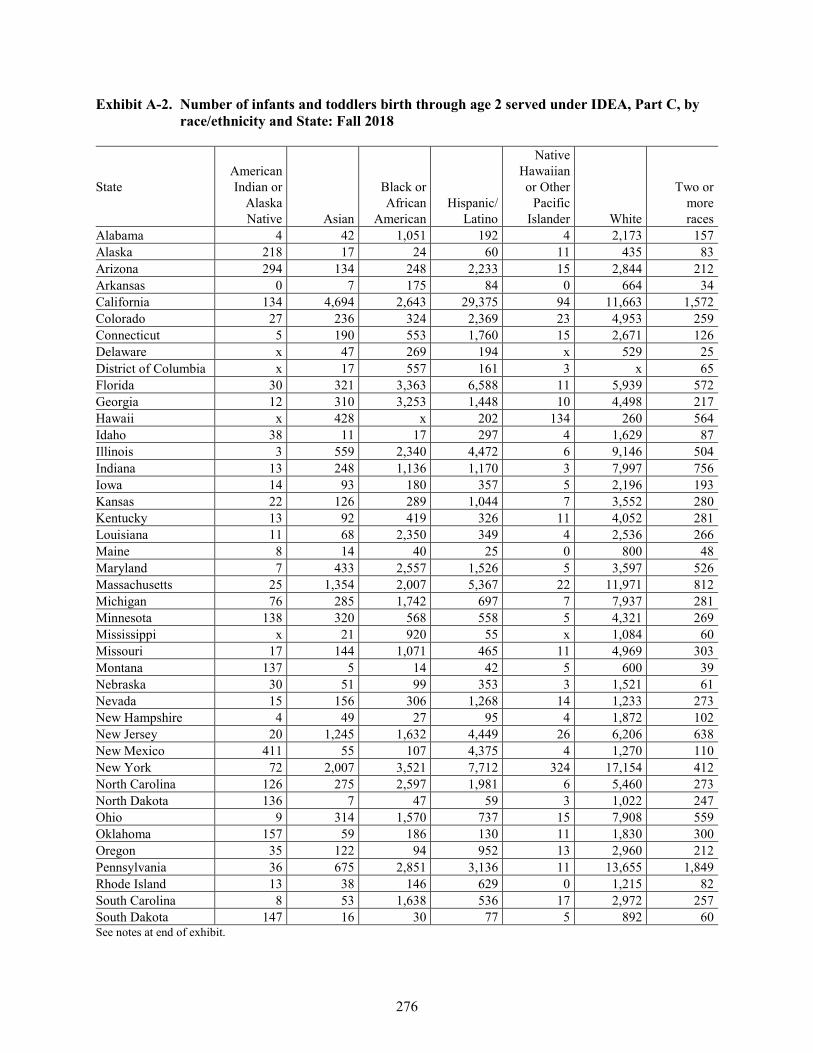
276
Exhibit A-2. Number of infants and toddlers birth through age 2 served under IDEA, Part C, by race/ethnicity and State: Fall 2018
State American Indian or
Alaska Native Asian
Black or African
American Hispanic/
Latino
Native Hawaiian or Other
Pacific Islander White
Two or more races
Alabama 4 42 1,051 192 4 2,173 157 Alaska 218 17 24 60 11 435 83 Arizona 294 134 248 2,233 15 2,844 212 Arkansas 0 7 175 84 0 664 34 California 134 4,694 2,643 29,375 94 11,663 1,572 Colorado 27 236 324 2,369 23 4,953 259 Connecticut 5 190 553 1,760 15 2,671 126 Delaware x 47 269 194 x 529 25 District of Columbia x 17 557 161 3 x 65 Florida 30 321 3,363 6,588 11 5,939 572 Georgia 12 310 3,253 1,448 10 4,498 217 Hawaii x 428 x 202 134 260 564 Idaho 38 11 17 297 4 1,629 87 Illinois 3 559 2,340 4,472 6 9,146 504 Indiana 13 248 1,136 1,170 3 7,997 756 Iowa 14 93 180 357 5 2,196 193 Kansas 22 126 289 1,044 7 3,552 280 Kentucky 13 92 419 326 11 4,052 281 Louisiana 11 68 2,350 349 4 2,536 266 Maine 8 14 40 25 0 800 48 Maryland 7 433 2,557 1,526 5 3,597 526 Massachusetts 25 1,354 2,007 5,367 22 11,971 812 Michigan 76 285 1,742 697 7 7,937 281 Minnesota 138 320 568 558 5 4,321 269 Mississippi x 21 920 55 x 1,084 60 Missouri 17 144 1,071 465 11 4,969 303 Montana 137 5 14 42 5 600 39 Nebraska 30 51 99 353 3 1,521 61 Nevada 15 156 306 1,268 14 1,233 273 New Hampshire 4 49 27 95 4 1,872 102 New Jersey 20 1,245 1,632 4,449 26 6,206 638 New Mexico 411 55 107 4,375 4 1,270 110 New York 72 2,007 3,521 7,712 324 17,154 412 North Carolina 126 275 2,597 1,981 6 5,460 273 North Dakota 136 7 47 59 3 1,022 247 Ohio 9 314 1,570 737 15 7,908 559 Oklahoma 157 59 186 130 11 1,830 300 Oregon 35 122 94 952 13 2,960 212 Pennsylvania 36 675 2,851 3,136 11 13,655 1,849 Rhode Island 13 38 146 629 0 1,215 82 South Carolina 8 53 1,638 536 17 2,972 257 South Dakota 147 16 30 77 5 892 60 See notes at end of exhibit.
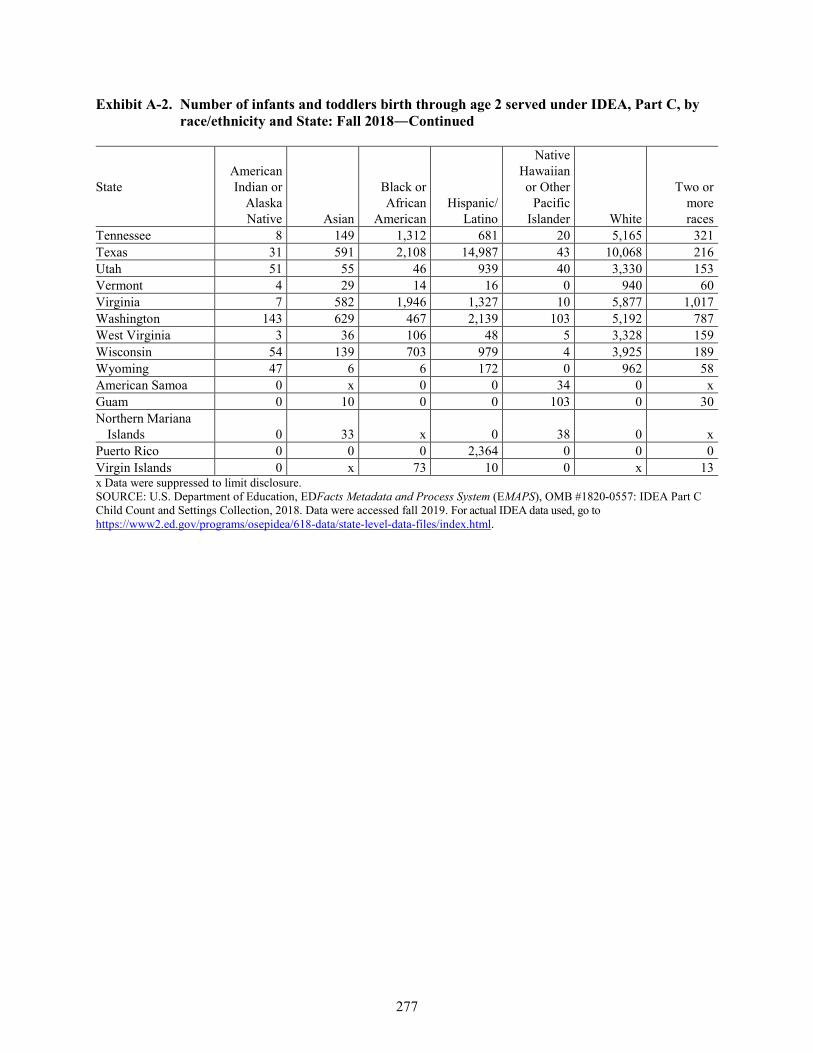
277
Exhibit A-2. Number of infants and toddlers birth through age 2 served under IDEA, Part C, by race/ethnicity and State: Fall 2018―Continued
State American Indian or
Alaska Native Asian
Black or African
American Hispanic/
Latino
Native Hawaiian or Other
Pacific Islander White
Two or more races
Tennessee 8 149 1,312 681 20 5,165 321 Texas 31 591 2,108 14,987 43 10,068 216 Utah 51 55 46 939 40 3,330 153 Vermont 4 29 14 16 0 940 60 Virginia 7 582 1,946 1,327 10 5,877 1,017 Washington 143 629 467 2,139 103 5,192 787 West Virginia 3 36 106 48 5 3,328 159 Wisconsin 54 139 703 979 4 3,925 189 Wyoming 47 6 6 172 0 962 58 American Samoa 0 x 0 0 34 0 x Guam 0 10 0 0 103 0 30 Northern Mariana
Islands 0 33 x 0 38 0 x Puerto Rico 0 0 0 2,364 0 0 0 Virgin Islands 0 x 73 10 0 x 13 x Data were suppressed to limit disclosure. SOURCE: U.S. Department of Education, EDFacts Metadata and Process System (EMAPS), OMB #1820-0557: IDEA Part C Child Count and Settings Collection, 2018. Data were accessed fall 2019. For actual IDEA data used, go to https://www2.ed.gov/programs/osepidea/618-data/state-level-data-files/index.html.
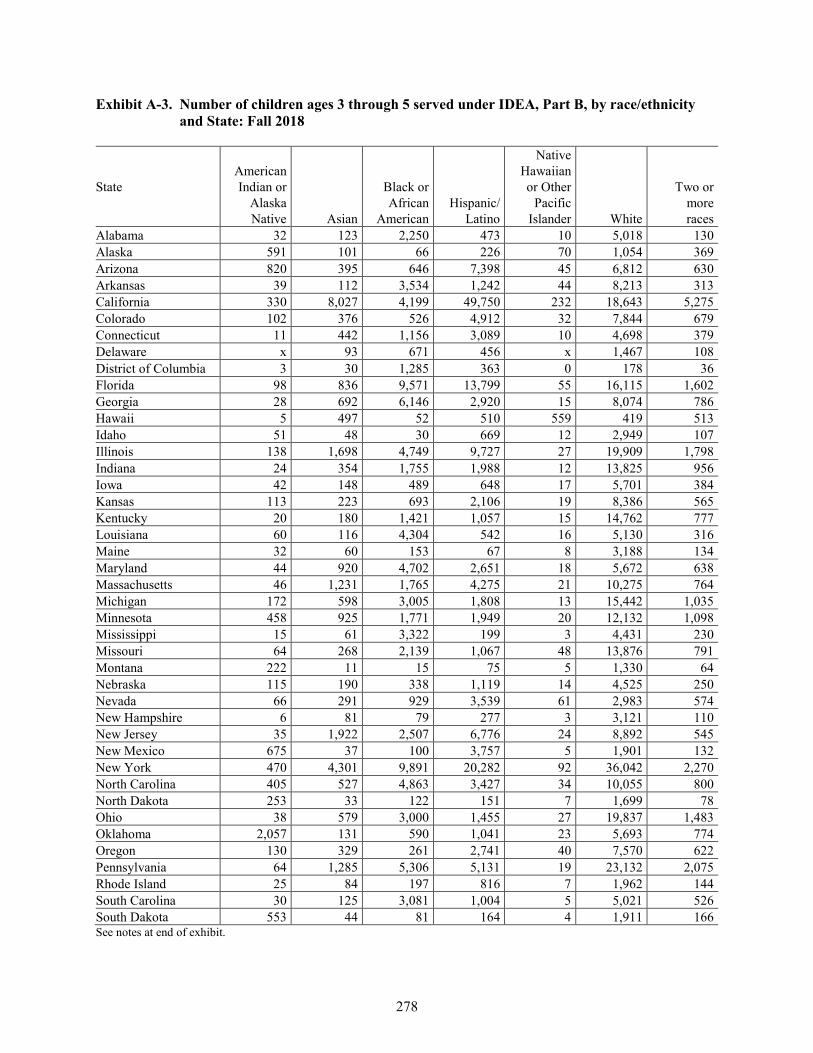
278
Exhibit A-3. Number of children ages 3 through 5 served under IDEA, Part B, by race/ethnicity and State: Fall 2018
State American Indian or
Alaska Native Asian
Black or African
American Hispanic/
Latino
Native Hawaiian or Other
Pacific Islander White
Two or more races
Alabama 32 123 2,250 473 10 5,018 130 Alaska 591 101 66 226 70 1,054 369 Arizona 820 395 646 7,398 45 6,812 630 Arkansas 39 112 3,534 1,242 44 8,213 313 California 330 8,027 4,199 49,750 232 18,643 5,275 Colorado 102 376 526 4,912 32 7,844 679 Connecticut 11 442 1,156 3,089 10 4,698 379 Delaware x 93 671 456 x 1,467 108 District of Columbia 3 30 1,285 363 0 178 36 Florida 98 836 9,571 13,799 55 16,115 1,602 Georgia 28 692 6,146 2,920 15 8,074 786 Hawaii 5 497 52 510 559 419 513 Idaho 51 48 30 669 12 2,949 107 Illinois 138 1,698 4,749 9,727 27 19,909 1,798 Indiana 24 354 1,755 1,988 12 13,825 956 Iowa 42 148 489 648 17 5,701 384 Kansas 113 223 693 2,106 19 8,386 565 Kentucky 20 180 1,421 1,057 15 14,762 777 Louisiana 60 116 4,304 542 16 5,130 316 Maine 32 60 153 67 8 3,188 134 Maryland 44 920 4,702 2,651 18 5,672 638 Massachusetts 46 1,231 1,765 4,275 21 10,275 764 Michigan 172 598 3,005 1,808 13 15,442 1,035 Minnesota 458 925 1,771 1,949 20 12,132 1,098 Mississippi 15 61 3,322 199 3 4,431 230 Missouri 64 268 2,139 1,067 48 13,876 791 Montana 222 11 15 75 5 1,330 64 Nebraska 115 190 338 1,119 14 4,525 250 Nevada 66 291 929 3,539 61 2,983 574 New Hampshire 6 81 79 277 3 3,121 110 New Jersey 35 1,922 2,507 6,776 24 8,892 545 New Mexico 675 37 100 3,757 5 1,901 132 New York 470 4,301 9,891 20,282 92 36,042 2,270 North Carolina 405 527 4,863 3,427 34 10,055 800 North Dakota 253 33 122 151 7 1,699 78 Ohio 38 579 3,000 1,455 27 19,837 1,483 Oklahoma 2,057 131 590 1,041 23 5,693 774 Oregon 130 329 261 2,741 40 7,570 622 Pennsylvania 64 1,285 5,306 5,131 19 23,132 2,075 Rhode Island 25 84 197 816 7 1,962 144 South Carolina 30 125 3,081 1,004 5 5,021 526 South Dakota 553 44 81 164 4 1,911 166 See notes at end of exhibit.
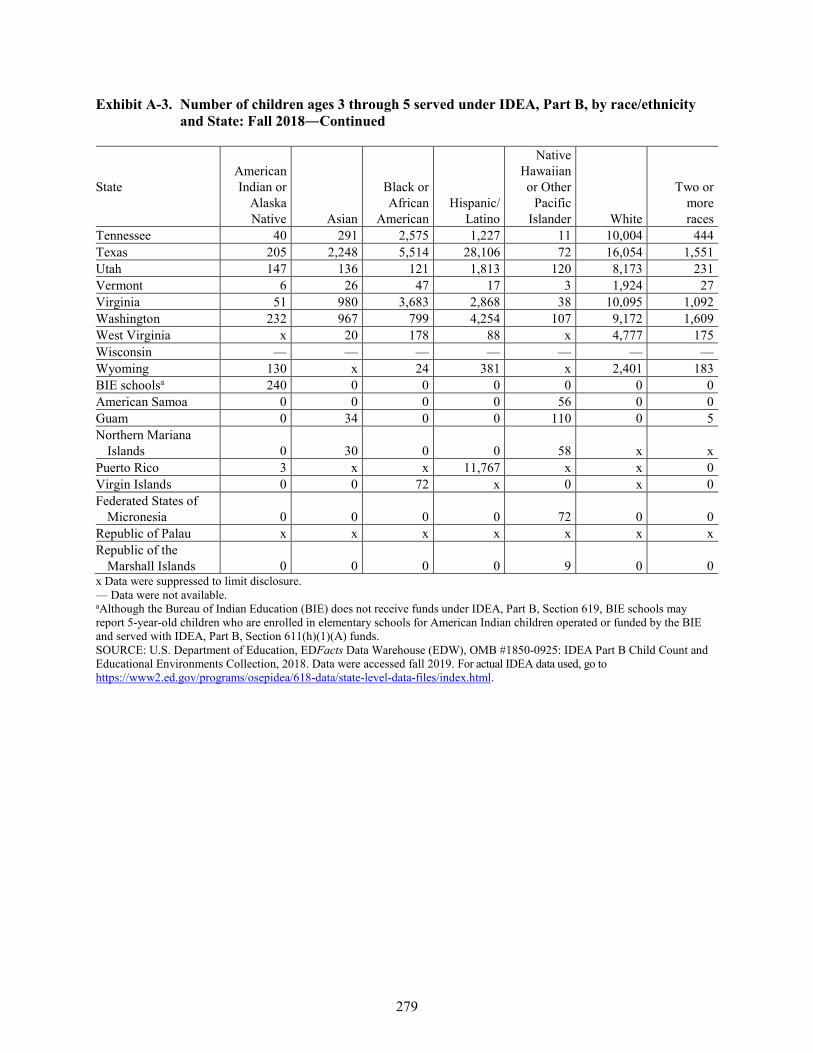
279
Exhibit A-3. Number of children ages 3 through 5 served under IDEA, Part B, by race/ethnicity and State: Fall 2018―Continued
State American Indian or
Alaska Native Asian
Black or African
American Hispanic/
Latino
Native Hawaiian or Other
Pacific Islander White
Two or more races
Tennessee 40 291 2,575 1,227 11 10,004 444 Texas 205 2,248 5,514 28,106 72 16,054 1,551 Utah 147 136 121 1,813 120 8,173 231 Vermont 6 26 47 17 3 1,924 27 Virginia 51 980 3,683 2,868 38 10,095 1,092 Washington 232 967 799 4,254 107 9,172 1,609 West Virginia x 20 178 88 x 4,777 175 Wisconsin — — — — — — — Wyoming 130 x 24 381 x 2,401 183 BIE schoolsa 240 0 0 0 0 0 0 American Samoa 0 0 0 0 56 0 0 Guam 0 34 0 0 110 0 5 Northern Mariana
Islands 0 30 0 0 58 x x Puerto Rico 3 x x 11,767 x x 0 Virgin Islands 0 0 72 x 0 x 0 Federated States of
Micronesia 0 0 0 0 72 0 0 Republic of Palau x x x x x x x Republic of the
Marshall Islands 0 0 0 0 9 0 0 x Data were suppressed to limit disclosure. — Data were not available. aAlthough the Bureau of Indian Education (BIE) does not receive funds under IDEA, Part B, Section 619, BIE schools may report 5-year-old children who are enrolled in elementary schools for American Indian children operated or funded by the BIE and served with IDEA, Part B, Section 611(h)(1)(A) funds. SOURCE: U.S. Department of Education, EDFacts Data Warehouse (EDW), OMB #1850-0925: IDEA Part B Child Count and Educational Environments Collection, 2018. Data were accessed fall 2019. For actual IDEA data used, go to https://www2.ed.gov/programs/osepidea/618-data/state-level-data-files/index.html.
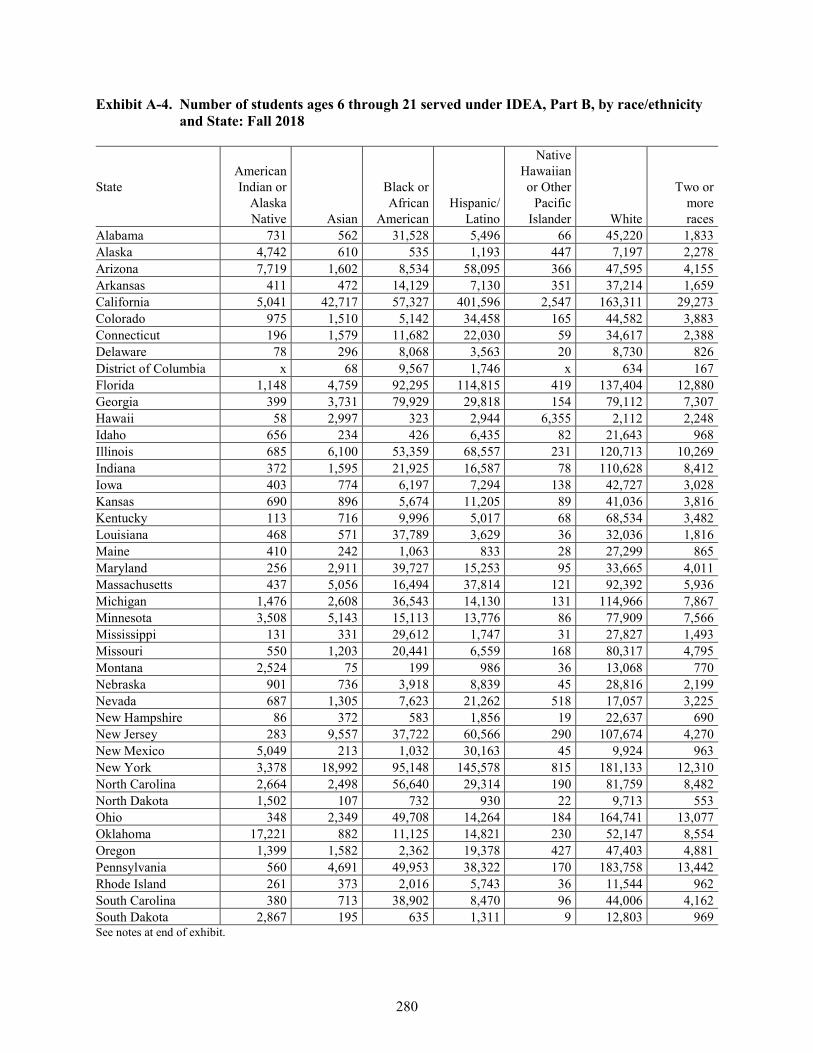
280
Exhibit A-4. Number of students ages 6 through 21 served under IDEA, Part B, by race/ethnicity and State: Fall 2018
State American Indian or
Alaska Native Asian
Black or African
American Hispanic/
Latino
Native Hawaiian or Other
Pacific Islander White
Two or more races
Alabama 731 562 31,528 5,496 66 45,220 1,833 Alaska 4,742 610 535 1,193 447 7,197 2,278 Arizona 7,719 1,602 8,534 58,095 366 47,595 4,155 Arkansas 411 472 14,129 7,130 351 37,214 1,659 California 5,041 42,717 57,327 401,596 2,547 163,311 29,273 Colorado 975 1,510 5,142 34,458 165 44,582 3,883 Connecticut 196 1,579 11,682 22,030 59 34,617 2,388 Delaware 78 296 8,068 3,563 20 8,730 826 District of Columbia x 68 9,567 1,746 x 634 167 Florida 1,148 4,759 92,295 114,815 419 137,404 12,880 Georgia 399 3,731 79,929 29,818 154 79,112 7,307 Hawaii 58 2,997 323 2,944 6,355 2,112 2,248 Idaho 656 234 426 6,435 82 21,643 968 Illinois 685 6,100 53,359 68,557 231 120,713 10,269 Indiana 372 1,595 21,925 16,587 78 110,628 8,412 Iowa 403 774 6,197 7,294 138 42,727 3,028 Kansas 690 896 5,674 11,205 89 41,036 3,816 Kentucky 113 716 9,996 5,017 68 68,534 3,482 Louisiana 468 571 37,789 3,629 36 32,036 1,816 Maine 410 242 1,063 833 28 27,299 865 Maryland 256 2,911 39,727 15,253 95 33,665 4,011 Massachusetts 437 5,056 16,494 37,814 121 92,392 5,936 Michigan 1,476 2,608 36,543 14,130 131 114,966 7,867 Minnesota 3,508 5,143 15,113 13,776 86 77,909 7,566 Mississippi 131 331 29,612 1,747 31 27,827 1,493 Missouri 550 1,203 20,441 6,559 168 80,317 4,795 Montana 2,524 75 199 986 36 13,068 770 Nebraska 901 736 3,918 8,839 45 28,816 2,199 Nevada 687 1,305 7,623 21,262 518 17,057 3,225 New Hampshire 86 372 583 1,856 19 22,637 690 New Jersey 283 9,557 37,722 60,566 290 107,674 4,270 New Mexico 5,049 213 1,032 30,163 45 9,924 963 New York 3,378 18,992 95,148 145,578 815 181,133 12,310 North Carolina 2,664 2,498 56,640 29,314 190 81,759 8,482 North Dakota 1,502 107 732 930 22 9,713 553 Ohio 348 2,349 49,708 14,264 184 164,741 13,077 Oklahoma 17,221 882 11,125 14,821 230 52,147 8,554 Oregon 1,399 1,582 2,362 19,378 427 47,403 4,881 Pennsylvania 560 4,691 49,953 38,322 170 183,758 13,442 Rhode Island 261 373 2,016 5,743 36 11,544 962 South Carolina 380 713 38,902 8,470 96 44,006 4,162 South Dakota 2,867 195 635 1,311 9 12,803 969 See notes at end of exhibit.
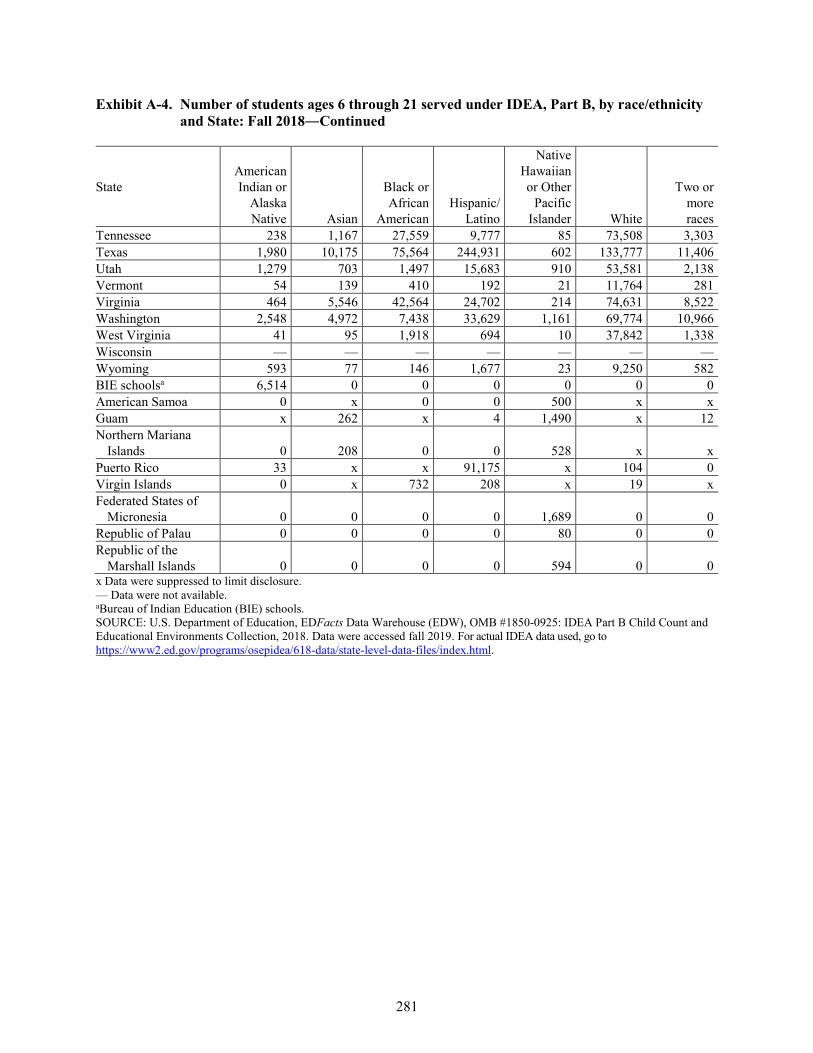
281
Exhibit A-4. Number of students ages 6 through 21 served under IDEA, Part B, by race/ethnicity and State: Fall 2018―Continued
State American Indian or
Alaska Native Asian
Black or African
American Hispanic/
Latino
Native Hawaiian or Other
Pacific Islander White
Two or more races
Tennessee 238 1,167 27,559 9,777 85 73,508 3,303 Texas 1,980 10,175 75,564 244,931 602 133,777 11,406 Utah 1,279 703 1,497 15,683 910 53,581 2,138 Vermont 54 139 410 192 21 11,764 281 Virginia 464 5,546 42,564 24,702 214 74,631 8,522 Washington 2,548 4,972 7,438 33,629 1,161 69,774 10,966 West Virginia 41 95 1,918 694 10 37,842 1,338 Wisconsin — — — — — — — Wyoming 593 77 146 1,677 23 9,250 582 BIE schoolsa 6,514 0 0 0 0 0 0 American Samoa 0 x 0 0 500 x x Guam x 262 x 4 1,490 x 12 Northern Mariana
Islands 0 208 0 0 528 x x Puerto Rico 33 x x 91,175 x 104 0 Virgin Islands 0 x 732 208 x 19 x Federated States of
Micronesia 0 0 0 0 1,689 0 0 Republic of Palau 0 0 0 0 80 0 0 Republic of the
Marshall Islands 0 0 0 0 594 0 0 x Data were suppressed to limit disclosure. — Data were not available. aBureau of Indian Education (BIE) schools. SOURCE: U.S. Department of Education, EDFacts Data Warehouse (EDW), OMB #1850-0925: IDEA Part B Child Count and Educational Environments Collection, 2018. Data were accessed fall 2019. For actual IDEA data used, go to https://www2.ed.gov/programs/osepidea/618-data/state-level-data-files/index.html.

Appendix B
Developmental Delay Data for Children Ages 3 Through 5 and Students Ages 6 Through 9 Served Under IDEA, Part B

285
Developmental Delay Data for Children Ages 3 Through 5 and Students Ages 6 Through 9 Served Under IDEA, Part B
The Individuals with Disabilities Education Act (IDEA) allows States flexibility in the use of the developmental delay category. Per the statute, use of this category is optional. Only children and students ages 3 through 9 may be reported in the developmental delay disability category and then only in States with the diagnostic instruments and procedures to measure delays in physical, cognitive, communication, social or emotional, or adaptive development. States must have defined and established eligibility criteria for developmental delay in order to report children in this category. Although IDEA does not require that States and local education agencies categorize children according to developmental delay, if this category is required by State law, States are expected to report these children in the developmental delay category.
Appendix B presents information about the children ages 3 through 5 and students ages 6 through 9 reported in the developmental delay category. In particular, Exhibits B-1 and B-2 provide data on the percentages of resident populations in the 50 States, the District of Columbia (DC), and Puerto Rico (PR) represented by the children ages 3 through 5 and students ages 6 through 9 served under IDEA, Part B, who were reported under the category of developmental delay, respectively, in each year, 2009 through 2018. Exhibit B-3 identifies whether each State, the District of Columbia, Bureau of Indian Education (BIE) schools, Puerto Rico, the four outlying areas (American Samoa, Guam, the Northern Mariana Islands, and the Virgin Islands), and the three freely associated states (the Federated States of Micronesia, the Republic of Palau, and the Republic of the Marshall Islands) reported any children ages 3 through 5 and any students ages 6 through 9 under the developmental delay category in 2018.
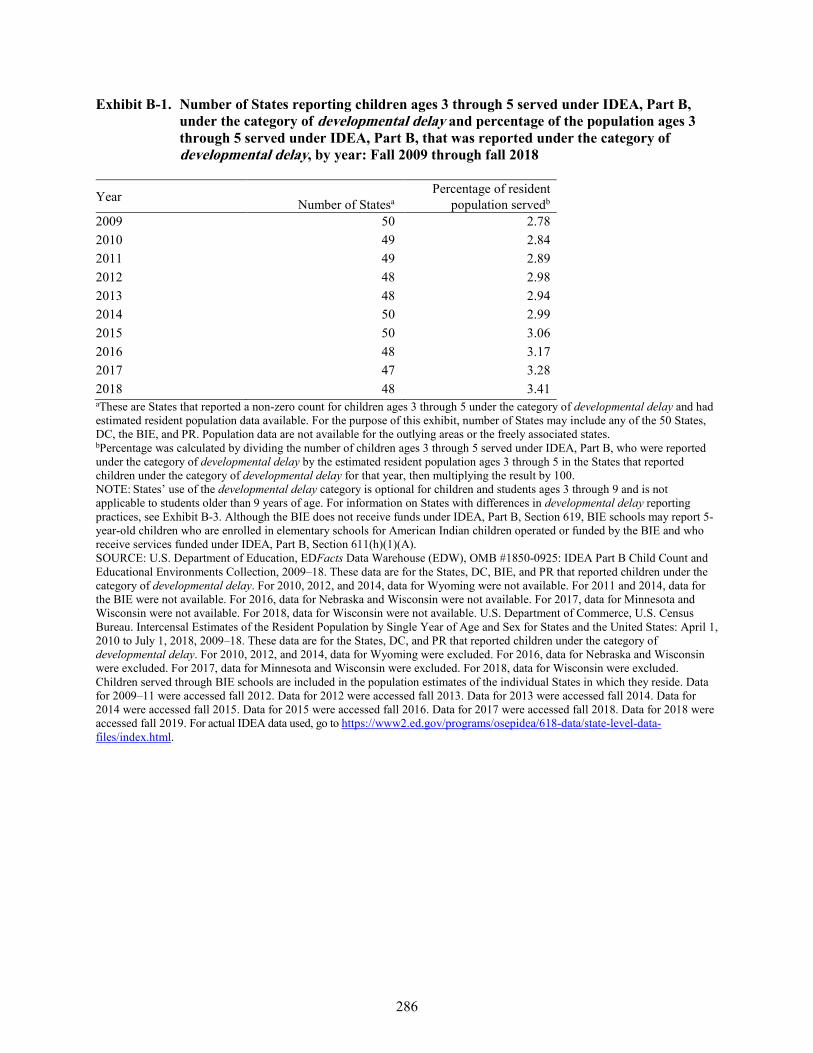
286
Exhibit B-1. Number of States reporting children ages 3 through 5 served under IDEA, Part B, under the category of developmental delay and percentage of the population ages 3 through 5 served under IDEA, Part B, that was reported under the category of developmental delay, by year: Fall 2009 through fall 2018
Year Number of Statesa Percentage of resident
population servedb 2009 50 2.78 2010 49 2.84 2011 49 2.89 2012 48 2.98 2013 48 2.94 2014 50 2.99 2015 50 3.06 2016 48 3.17 2017 47 3.28 2018 48 3.41 aThese are States that reported a non-zero count for children ages 3 through 5 under the category of developmental delay and had estimated resident population data available. For the purpose of this exhibit, number of States may include any of the 50 States, DC, the BIE, and PR. Population data are not available for the outlying areas or the freely associated states. bPercentage was calculated by dividing the number of children ages 3 through 5 served under IDEA, Part B, who were reported under the category of developmental delay by the estimated resident population ages 3 through 5 in the States that reported children under the category of developmental delay for that year, then multiplying the result by 100. NOTE: States’ use of the developmental delay category is optional for children and students ages 3 through 9 and is not applicable to students older than 9 years of age. For information on States with differences in developmental delay reporting practices, see Exhibit B-3. Although the BIE does not receive funds under IDEA, Part B, Section 619, BIE schools may report 5-year-old children who are enrolled in elementary schools for American Indian children operated or funded by the BIE and who receive services funded under IDEA, Part B, Section 611(h)(1)(A). SOURCE: U.S. Department of Education, EDFacts Data Warehouse (EDW), OMB #1850-0925: IDEA Part B Child Count and Educational Environments Collection, 2009–18. These data are for the States, DC, BIE, and PR that reported children under the category of developmental delay. For 2010, 2012, and 2014, data for Wyoming were not available. For 2011 and 2014, data for the BIE were not available. For 2016, data for Nebraska and Wisconsin were not available. For 2017, data for Minnesota and Wisconsin were not available. For 2018, data for Wisconsin were not available. U.S. Department of Commerce, U.S. Census Bureau. Intercensal Estimates of the Resident Population by Single Year of Age and Sex for States and the United States: April 1, 2010 to July 1, 2018, 2009–18. These data are for the States, DC, and PR that reported children under the category of developmental delay. For 2010, 2012, and 2014, data for Wyoming were excluded. For 2016, data for Nebraska and Wisconsin were excluded. For 2017, data for Minnesota and Wisconsin were excluded. For 2018, data for Wisconsin were excluded. Children served through BIE schools are included in the population estimates of the individual States in which they reside. Data for 2009–11 were accessed fall 2012. Data for 2012 were accessed fall 2013. Data for 2013 were accessed fall 2014. Data for 2014 were accessed fall 2015. Data for 2015 were accessed fall 2016. Data for 2017 were accessed fall 2018. Data for 2018 were accessed fall 2019. For actual IDEA data used, go to https://www2.ed.gov/programs/osepidea/618-data/state-level-data-files/index.html.
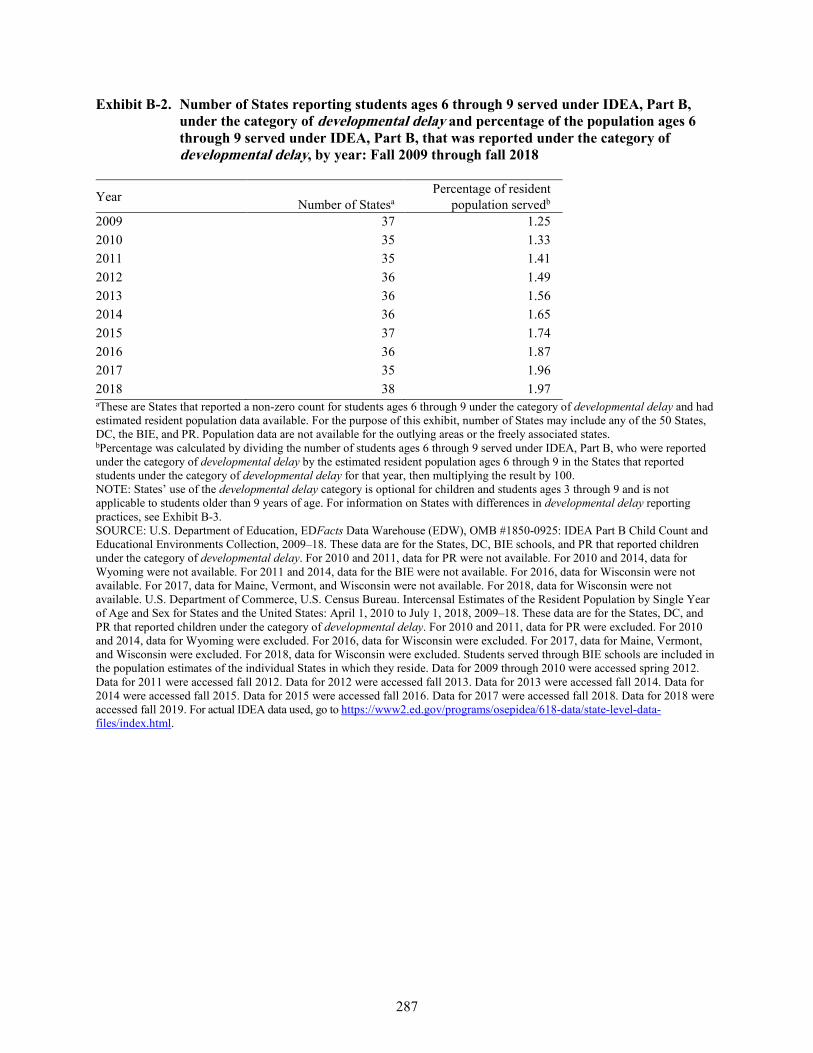
287
Exhibit B-2. Number of States reporting students ages 6 through 9 served under IDEA, Part B, under the category of developmental delay and percentage of the population ages 6 through 9 served under IDEA, Part B, that was reported under the category of developmental delay, by year: Fall 2009 through fall 2018
Year Number of Statesa Percentage of resident
population servedb 2009 37 1.25 2010 35 1.33 2011 35 1.41 2012 36 1.49 2013 36 1.56 2014 36 1.65 2015 37 1.74 2016 36 1.87 2017 35 1.96 2018 38 1.97 aThese are States that reported a non-zero count for students ages 6 through 9 under the category of developmental delay and had estimated resident population data available. For the purpose of this exhibit, number of States may include any of the 50 States, DC, the BIE, and PR. Population data are not available for the outlying areas or the freely associated states. bPercentage was calculated by dividing the number of students ages 6 through 9 served under IDEA, Part B, who were reported under the category of developmental delay by the estimated resident population ages 6 through 9 in the States that reported students under the category of developmental delay for that year, then multiplying the result by 100. NOTE: States’ use of the developmental delay category is optional for children and students ages 3 through 9 and is not applicable to students older than 9 years of age. For information on States with differences in developmental delay reporting practices, see Exhibit B-3. SOURCE: U.S. Department of Education, EDFacts Data Warehouse (EDW), OMB #1850-0925: IDEA Part B Child Count and Educational Environments Collection, 2009–18. These data are for the States, DC, BIE schools, and PR that reported children under the category of developmental delay. For 2010 and 2011, data for PR were not available. For 2010 and 2014, data for Wyoming were not available. For 2011 and 2014, data for the BIE were not available. For 2016, data for Wisconsin were not available. For 2017, data for Maine, Vermont, and Wisconsin were not available. For 2018, data for Wisconsin were not available. U.S. Department of Commerce, U.S. Census Bureau. Intercensal Estimates of the Resident Population by Single Year of Age and Sex for States and the United States: April 1, 2010 to July 1, 2018, 2009–18. These data are for the States, DC, and PR that reported children under the category of developmental delay. For 2010 and 2011, data for PR were excluded. For 2010 and 2014, data for Wyoming were excluded. For 2016, data for Wisconsin were excluded. For 2017, data for Maine, Vermont, and Wisconsin were excluded. For 2018, data for Wisconsin were excluded. Students served through BIE schools are included in the population estimates of the individual States in which they reside. Data for 2009 through 2010 were accessed spring 2012. Data for 2011 were accessed fall 2012. Data for 2012 were accessed fall 2013. Data for 2013 were accessed fall 2014. Data for 2014 were accessed fall 2015. Data for 2015 were accessed fall 2016. Data for 2017 were accessed fall 2018. Data for 2018 were accessed fall 2019. For actual IDEA data used, go to https://www2.ed.gov/programs/osepidea/618-data/state-level-data-files/index.html.
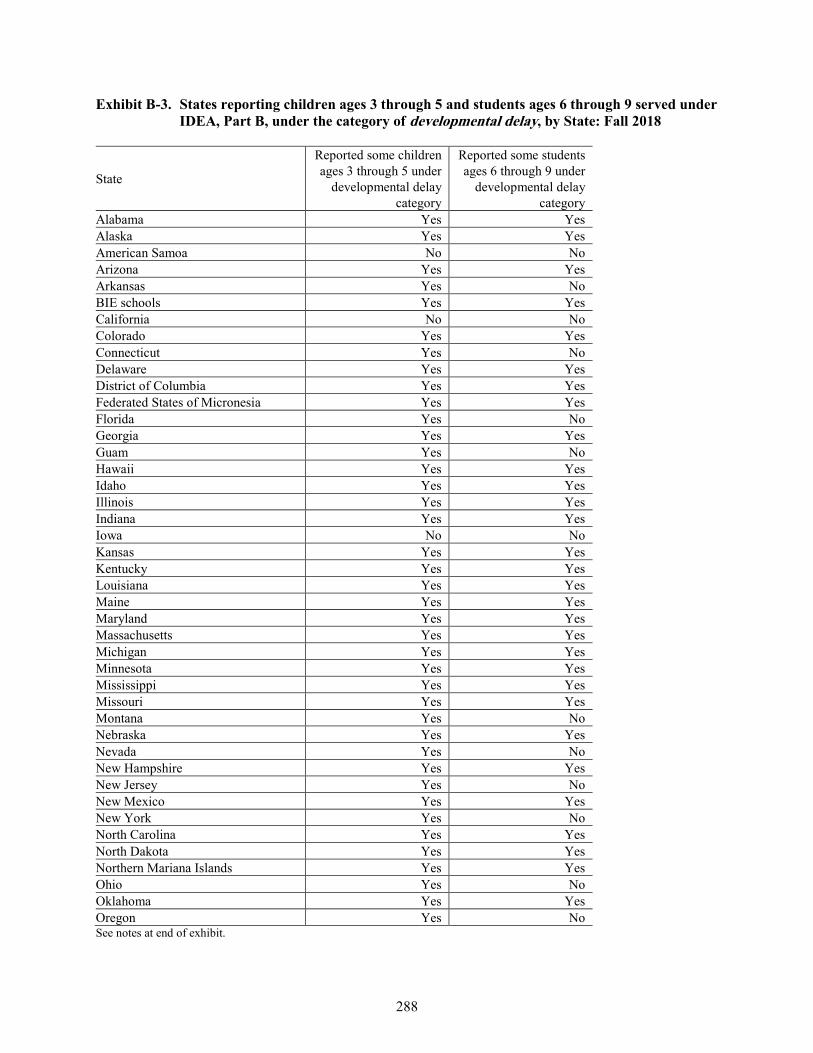
288
Exhibit B-3. States reporting children ages 3 through 5 and students ages 6 through 9 served under IDEA, Part B, under the category of developmental delay, by State: Fall 2018
State
Reported some children ages 3 through 5 under
developmental delay category
Reported some students ages 6 through 9 under
developmental delay category
Alabama Yes Yes Alaska Yes Yes American Samoa No No Arizona Yes Yes Arkansas Yes No BIE schools Yes Yes California No No Colorado Yes Yes Connecticut Yes No Delaware Yes Yes District of Columbia Yes Yes Federated States of Micronesia Yes Yes Florida Yes No Georgia Yes Yes Guam Yes No Hawaii Yes Yes Idaho Yes Yes Illinois Yes Yes Indiana Yes Yes Iowa No No Kansas Yes Yes Kentucky Yes Yes Louisiana Yes Yes Maine Yes Yes Maryland Yes Yes Massachusetts Yes Yes Michigan Yes Yes Minnesota Yes Yes Mississippi Yes Yes Missouri Yes Yes Montana Yes No Nebraska Yes Yes Nevada Yes No New Hampshire Yes Yes New Jersey Yes No New Mexico Yes Yes New York Yes No North Carolina Yes Yes North Dakota Yes Yes Northern Mariana Islands Yes Yes Ohio Yes No Oklahoma Yes Yes Oregon Yes No See notes at end of exhibit.
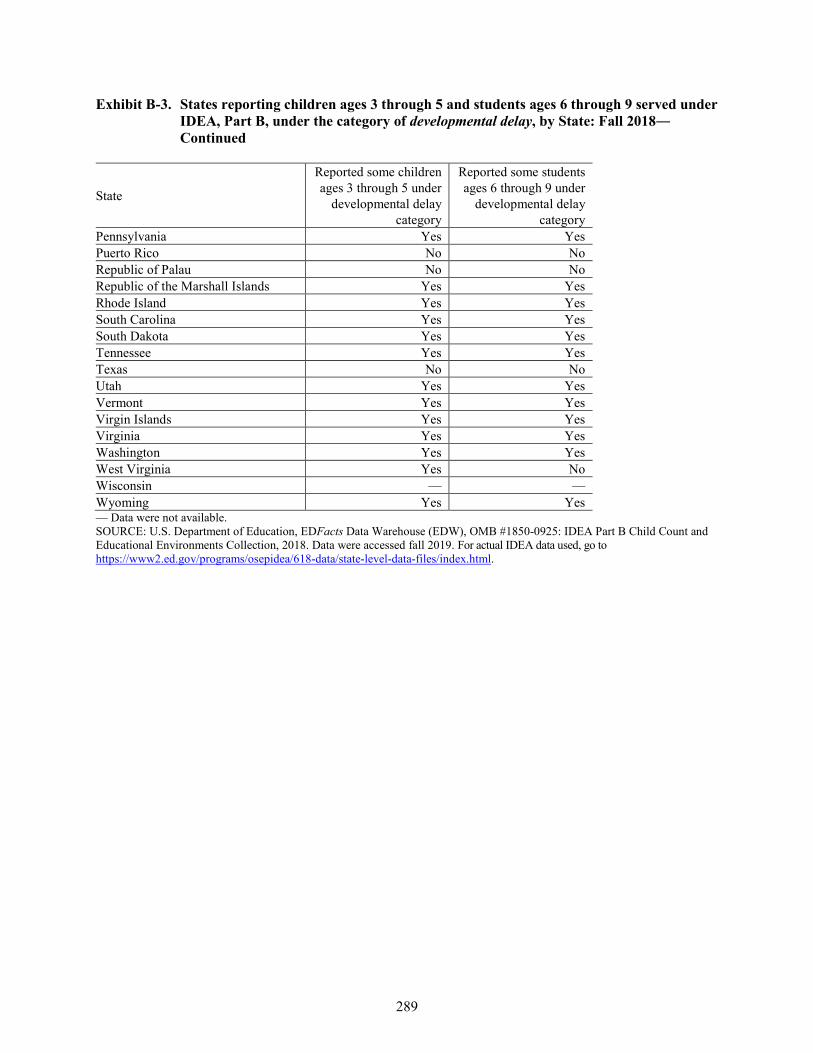
289
Exhibit B-3. States reporting children ages 3 through 5 and students ages 6 through 9 served under IDEA, Part B, under the category of developmental delay, by State: Fall 2018― Continued
State
Reported some children ages 3 through 5 under
developmental delay category
Reported some students ages 6 through 9 under
developmental delay category
Pennsylvania Yes Yes Puerto Rico No No Republic of Palau No No Republic of the Marshall Islands Yes Yes Rhode Island Yes Yes South Carolina Yes Yes South Dakota Yes Yes Tennessee Yes Yes Texas No No Utah Yes Yes Vermont Yes Yes Virgin Islands Yes Yes Virginia Yes Yes Washington Yes Yes West Virginia Yes No Wisconsin — — Wyoming Yes Yes — Data were not available. SOURCE: U.S. Department of Education, EDFacts Data Warehouse (EDW), OMB #1850-0925: IDEA Part B Child Count and Educational Environments Collection, 2018. Data were accessed fall 2019. For actual IDEA data used, go to https://www2.ed.gov/programs/osepidea/618-data/state-level-data-files/index.html.

Appendix C
IDEA, Part B Maintenance of Effort (MOE) Reduction and Coordinated Early Intervening Services

293
IDEA, Part B Maintenance of Effort (MOE) Reduction and Coordinated Early Intervening Services
Appendix C presents State-level information on maintenance of effort (MOE) reduction and coordinated early intervening services (CEIS). In particular, Exhibit C-1 presents the number of students who received CEIS and number and percentage of local education agencies (LEAs) and educational service agencies (ESAs) in the 50 States, the District of Columbia (DC), Bureau of Indian Education (BIE) schools, Puerto Rico (PR), the four outlying areas (American Samoa, Guam, the Northern Mariana Islands, and the Virgin Islands), and the three freely associated states (the Federated States of Micronesia, the Republic of Palau, and the Republic of the Marshall Islands) that were required to reserve 15 percent of IDEA Sections 611 and 619 funds for comprehensive CEIS due to significant disproportionality or that voluntarily reserved up to 15 percent of funds for CEIS. Exhibit C-2 presents State-level data on the number and percentage of LEAs and ESAs that met the Individuals with Disabilities Education Act (IDEA), Part B, requirements under 34 Code of Federal Regulations (C.F.R.) § 300.600(a)(2); had an increase in Section 611 allocations; and took the MOE reduction pursuant to IDEA Section 613(a)(2)(C) in school year 2017–18.
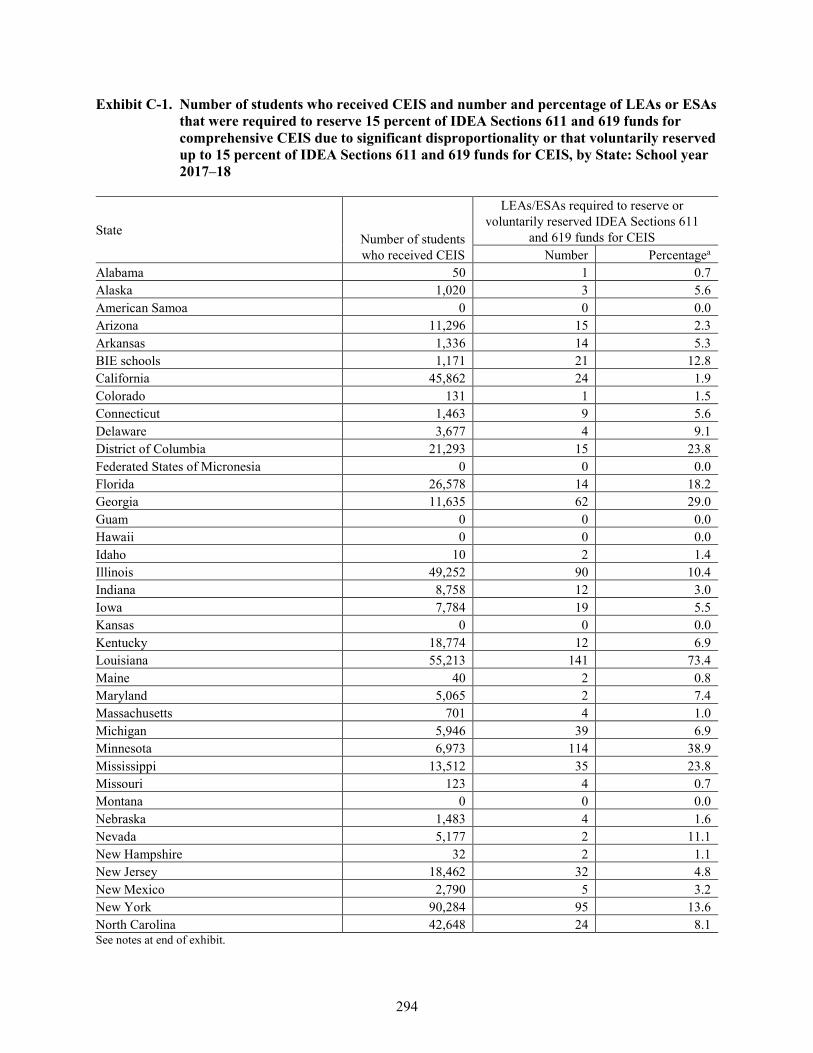
294
Exhibit C-1. Number of students who received CEIS and number and percentage of LEAs or ESAs that were required to reserve 15 percent of IDEA Sections 611 and 619 funds for comprehensive CEIS due to significant disproportionality or that voluntarily reserved up to 15 percent of IDEA Sections 611 and 619 funds for CEIS, by State: School year 2017–18
State Number of students who received CEIS
LEAs/ESAs required to reserve or voluntarily reserved IDEA Sections 611
and 619 funds for CEIS Number Percentagea
Alabama 50 1 0.7 Alaska 1,020 3 5.6 American Samoa 0 0 0.0 Arizona 11,296 15 2.3 Arkansas 1,336 14 5.3 BIE schools 1,171 21 12.8 California 45,862 24 1.9 Colorado 131 1 1.5 Connecticut 1,463 9 5.6 Delaware 3,677 4 9.1 District of Columbia 21,293 15 23.8 Federated States of Micronesia 0 0 0.0 Florida 26,578 14 18.2 Georgia 11,635 62 29.0 Guam 0 0 0.0 Hawaii 0 0 0.0 Idaho 10 2 1.4 Illinois 49,252 90 10.4 Indiana 8,758 12 3.0 Iowa 7,784 19 5.5 Kansas 0 0 0.0 Kentucky 18,774 12 6.9 Louisiana 55,213 141 73.4 Maine 40 2 0.8 Maryland 5,065 2 7.4 Massachusetts 701 4 1.0 Michigan 5,946 39 6.9 Minnesota 6,973 114 38.9 Mississippi 13,512 35 23.8 Missouri 123 4 0.7 Montana 0 0 0.0 Nebraska 1,483 4 1.6 Nevada 5,177 2 11.1 New Hampshire 32 2 1.1 New Jersey 18,462 32 4.8 New Mexico 2,790 5 3.2 New York 90,284 95 13.6 North Carolina 42,648 24 8.1 See notes at end of exhibit.
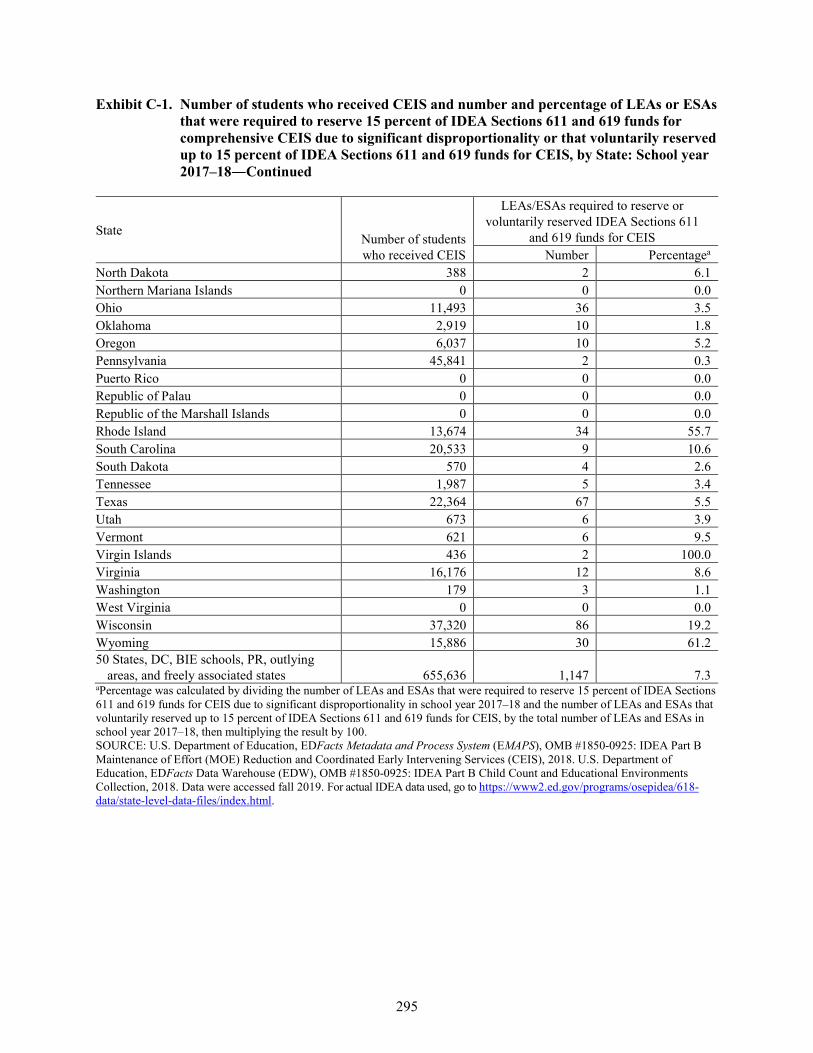
295
Exhibit C-1. Number of students who received CEIS and number and percentage of LEAs or ESAs that were required to reserve 15 percent of IDEA Sections 611 and 619 funds for comprehensive CEIS due to significant disproportionality or that voluntarily reserved up to 15 percent of IDEA Sections 611 and 619 funds for CEIS, by State: School year 2017–18―Continued
State Number of students who received CEIS
LEAs/ESAs required to reserve or voluntarily reserved IDEA Sections 611
and 619 funds for CEIS Number Percentagea
North Dakota 388 2 6.1 Northern Mariana Islands 0 0 0.0 Ohio 11,493 36 3.5 Oklahoma 2,919 10 1.8 Oregon 6,037 10 5.2 Pennsylvania 45,841 2 0.3 Puerto Rico 0 0 0.0 Republic of Palau 0 0 0.0 Republic of the Marshall Islands 0 0 0.0 Rhode Island 13,674 34 55.7 South Carolina 20,533 9 10.6 South Dakota 570 4 2.6 Tennessee 1,987 5 3.4 Texas 22,364 67 5.5 Utah 673 6 3.9 Vermont 621 6 9.5 Virgin Islands 436 2 100.0 Virginia 16,176 12 8.6 Washington 179 3 1.1 West Virginia 0 0 0.0 Wisconsin 37,320 86 19.2 Wyoming 15,886 30 61.2 50 States, DC, BIE schools, PR, outlying
areas, and freely associated states 655,636 1,147 7.3 aPercentage was calculated by dividing the number of LEAs and ESAs that were required to reserve 15 percent of IDEA Sections 611 and 619 funds for CEIS due to significant disproportionality in school year 2017–18 and the number of LEAs and ESAs that voluntarily reserved up to 15 percent of IDEA Sections 611 and 619 funds for CEIS, by the total number of LEAs and ESAs in school year 2017–18, then multiplying the result by 100. SOURCE: U.S. Department of Education, EDFacts Metadata and Process System (EMAPS), OMB #1850-0925: IDEA Part B Maintenance of Effort (MOE) Reduction and Coordinated Early Intervening Services (CEIS), 2018. U.S. Department of Education, EDFacts Data Warehouse (EDW), OMB #1850-0925: IDEA Part B Child Count and Educational Environments Collection, 2018. Data were accessed fall 2019. For actual IDEA data used, go to https://www2.ed.gov/programs/osepidea/618-data/state-level-data-files/index.html.
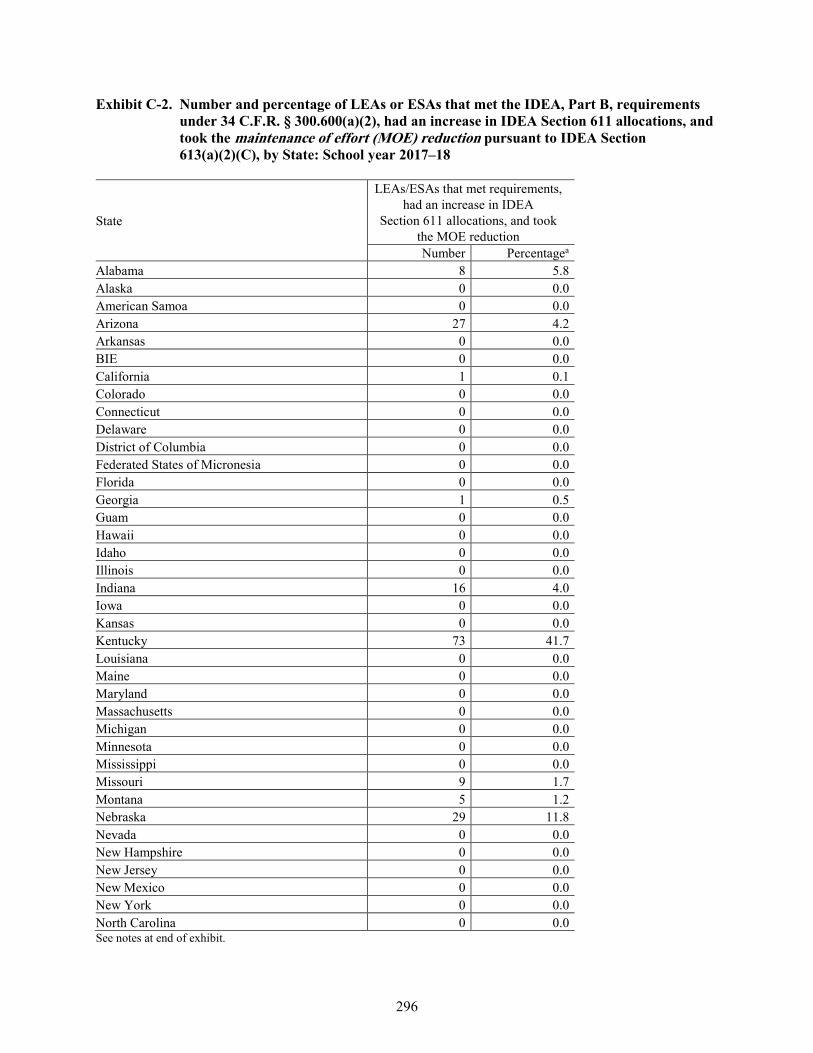
296
Exhibit C-2. Number and percentage of LEAs or ESAs that met the IDEA, Part B, requirements under 34 C.F.R. § 300.600(a)(2), had an increase in IDEA Section 611 allocations, and took the maintenance of effort (MOE) reduction pursuant to IDEA Section 613(a)(2)(C), by State: School year 2017–18
State
LEAs/ESAs that met requirements, had an increase in IDEA
Section 611 allocations, and took the MOE reduction Number Percentagea
Alabama 8 5.8 Alaska 0 0.0 American Samoa 0 0.0 Arizona 27 4.2 Arkansas 0 0.0 BIE 0 0.0 California 1 0.1 Colorado 0 0.0 Connecticut 0 0.0 Delaware 0 0.0 District of Columbia 0 0.0 Federated States of Micronesia 0 0.0 Florida 0 0.0 Georgia 1 0.5 Guam 0 0.0 Hawaii 0 0.0 Idaho 0 0.0 Illinois 0 0.0 Indiana 16 4.0 Iowa 0 0.0 Kansas 0 0.0 Kentucky 73 41.7 Louisiana 0 0.0 Maine 0 0.0 Maryland 0 0.0 Massachusetts 0 0.0 Michigan 0 0.0 Minnesota 0 0.0 Mississippi 0 0.0 Missouri 9 1.7 Montana 5 1.2 Nebraska 29 11.8 Nevada 0 0.0 New Hampshire 0 0.0 New Jersey 0 0.0 New Mexico 0 0.0 New York 0 0.0 North Carolina 0 0.0 See notes at end of exhibit.
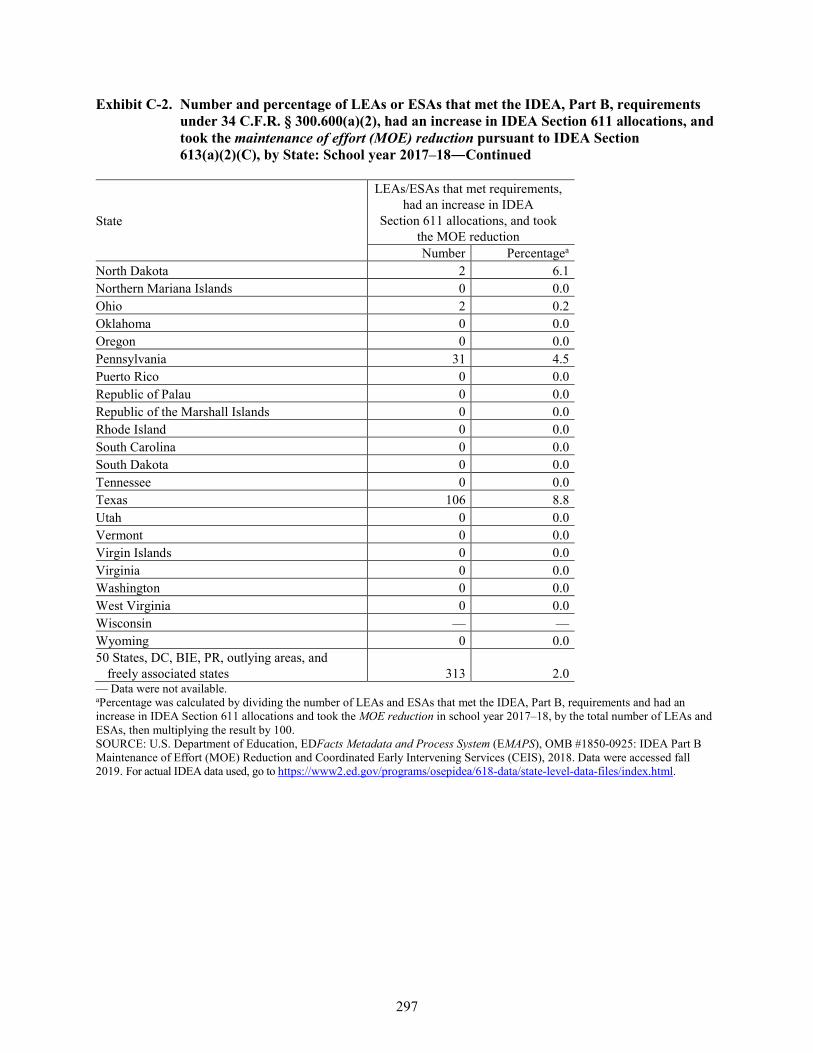
297
Exhibit C-2. Number and percentage of LEAs or ESAs that met the IDEA, Part B, requirements under 34 C.F.R. § 300.600(a)(2), had an increase in IDEA Section 611 allocations, and took the maintenance of effort (MOE) reduction pursuant to IDEA Section 613(a)(2)(C), by State: School year 2017–18―Continued
State
LEAs/ESAs that met requirements, had an increase in IDEA
Section 611 allocations, and took the MOE reduction Number Percentagea
North Dakota 2 6.1 Northern Mariana Islands 0 0.0 Ohio 2 0.2 Oklahoma 0 0.0 Oregon 0 0.0 Pennsylvania 31 4.5 Puerto Rico 0 0.0 Republic of Palau 0 0.0 Republic of the Marshall Islands 0 0.0 Rhode Island 0 0.0 South Carolina 0 0.0 South Dakota 0 0.0 Tennessee 0 0.0 Texas 106 8.8 Utah 0 0.0 Vermont 0 0.0 Virgin Islands 0 0.0 Virginia 0 0.0 Washington 0 0.0 West Virginia 0 0.0 Wisconsin — — Wyoming 0 0.0 50 States, DC, BIE, PR, outlying areas, and
freely associated states 313 2.0 — Data were not available. aPercentage was calculated by dividing the number of LEAs and ESAs that met the IDEA, Part B, requirements and had an increase in IDEA Section 611 allocations and took the MOE reduction in school year 2017–18, by the total number of LEAs and ESAs, then multiplying the result by 100. SOURCE: U.S. Department of Education, EDFacts Metadata and Process System (EMAPS), OMB #1850-0925: IDEA Part B Maintenance of Effort (MOE) Reduction and Coordinated Early Intervening Services (CEIS), 2018. Data were accessed fall 2019. For actual IDEA data used, go to https://www2.ed.gov/programs/osepidea/618-data/state-level-data-files/index.html.


The Department of Education’s mission is to promote
student achievement and preparation for global competitiveness by fostering educational excellence and ensuring equal access.
www.ed.gov


