The project is co-funded by the European Union, Instrument for Pre-Accession Assistance 4.3. Water quality trends on test areas (water resources) Faculty of Civil Engineering University of Rijeka (FB8) Rijeka, 2016 Compiled by FB8: Ivana Radman, Barbara Karleuša Lead Authors Coordinator Barbara Karleuša Contributor/s LP,FB2,FB3,FB5,FB8,FB9,FB10,FB11,FB12,FB14,FB16 Date last release July 2016 State of document APPROVED
Transcript
The project is co-funded by the European Union,Instrument for Pre-Accession Assistance
4.3. Water quality trends on test areas (water resources)
FB12: Hydro-Engineering Institute of Sarajevo Faculty of Civil Engineering
Mira Papovic FB14: Public Utility "Vodovod i kanalizacija" Niksic
Vasilis Kanakoudis, S. Tsitsifli, A. Papadopoulou, I. Argyriadou, A. Rouva, I. Hitiri
FB16: Civil Engineering Department, University of Thessaly, Greece
“This document has been produced with the financial assistance of the IPA Adriatic Cross-Border Cooperation Programme. The contents of this document are the sole responsibility of involved DRINKADRIA project partners and can under no circumstances be regarded as reflecting the position of the IPA Adriatic Cross-Border Cooperation Programme Authorities”.
2. OVERVIEW OF WATER QUALITY PROBLEMS AND TRENDS ON TEST AREAS ....... 3
2.1. Test area Isonzo plain, Italy (LP) ............................................................................... 3
2.2. ATO3 test area in Marche region, Italy (FB2) ............................................................ 7
2.3. Test area Ostuni in Apulia region, Italy (FB3) .......................................................... 11
2.4. Test area Kobariški stol, Mia and Matajur aquifers, in NW Slovenia (FB5) ............. 13
2.5. Test area in Northern Istria, Croatia (FB8) .............................................................. 18
2.6. Test area Prud spring catchment and Blatsko polje on the Korčula island, Croatia (FB9) ....................................................................................................................... 21
2.7. Veliki Rzav river and its tributaries, Serbia (FB10) .................................................. 23
2.8. Test area Drini river basin, Albania (FB11) ............................................................. 25
2.8.1. Water quality of river Drini i Bardhë (White Drin) and branch - river Rahovec .. 26
2.9. Trebižat river, BiH (FB12) ........................................................................................ 28
2.10. Test area of the city of Nikšić in Montenegro (FB14) ............................................. 30
2.11. Test area island of Corfu in Greece (FB16) ........................................................... 31
1. INTRODUCTION Project partners have prepared reports about water resources quality analysis and trends on test areas. Eleven reports were collected and analyzed:
- report for test area Isonzo Plain (Italy), prepared by LP;
- report for ATO 3 test area in Marche region (Italy), prepared by FB2;
- report for test area Ostuni in Apulia region (Italy), prepared by FB3;
- report for test areas Kobariški stol, Mia and Matajur aquifers (NW Slovenia), prepared by FB5;
- report for test area in northern Istria (Croatia) which includes springs Sv. Ivan, Bulaž and Gradole, prepared by FB8;
- report for test areas in southern Dalmatia, Croatia (Prud spring catchment and Blatsko polje on the Korčula island), prepared by FB9;
- report for Veliki Rzav river and its tributaries - rivers Ljubišnica, Katušnica, Prištevica, Mali Rzav (Serbia), prepared by FB10 (not a test area);
- report for test area Drini river basin (Albania), prepared by FB11;
- report for Trebižat river (BiH) which drains into Prud spring, prepared by FB12;
- report for test area of the city of Nikšić in Montenegro (with reference to the springs Gornji Vidrovan, Donji Vidrovan and Poklonci), prepared by FB14;
- report for test area Corfu island (Greece), prepared by FB16.
In this report, following data is shown for each test area: description of a test area, problems with water quality and a table with trends for various parameters.
2
Water quality trends on test areas – Rijeka 2016
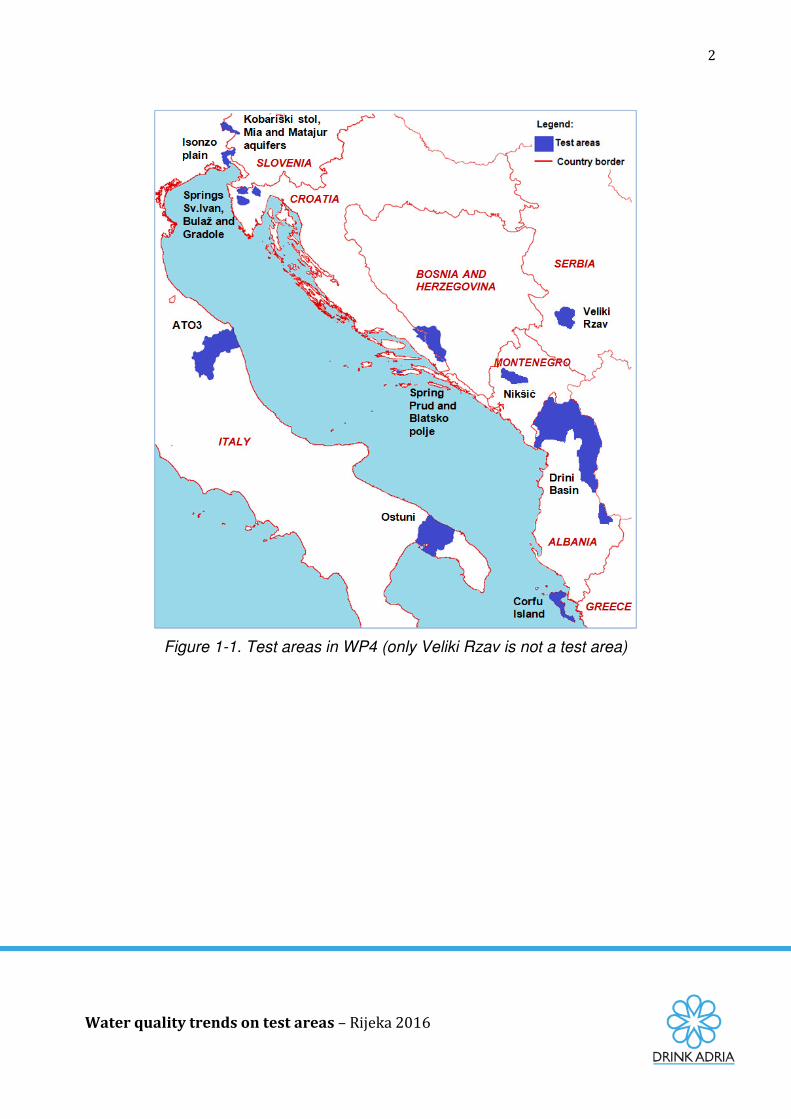
Figure 1-1. Test areas in WP4 (only Veliki Rzav is not a test area)
3
Water quality trends on test areas – Rijeka 2016
2. OVERVIEW OF WATER QUALITY PROBLEMS AND TRENDS ON TEST AREAS
In this section, an overview of problems with water quality is presented, together with tables for water quality trends for each test area. The meaning of symbols which are used in the mentioned tables is given in the Table 2-1. Table 2-1. Legend
Symbols
increasing trend
decreasing trend
slightly increasing trend
slightly decreasing trend
constant trend
BDL below detection limit
2.1. Test area Isonzo plain, Italy (LP) The source of data to describe the water quality of test area Isonzo plain (Italy) is report prepared by the project partner within the DRINKADRIA project, which is presented in Annex 1 of this report (Calligaris and Cucchi, 2014). Test area:
The analyzed test area is Isonzo river alluvial plain. The Isonzo Plain, about 170 km2, is located in the eastern side of the Friuli Venezia Giulia Region (NE Italy). It holds a significant phreatic aquifer and many rich artesian aquifers that represent an important natural wealth. The aquifers are used for different purposes: drinking, household, industrial, agricultural and farming. The Isonzo-Soča Plain is divided in two areas: the High Plain to the North and the Low Plain to the South.
4
Water quality trends on test areas – Rijeka 2016
Figure 2.1-1: DRINKADRIA test area (in red), the Isonzo/Soča River plain
In all the considered wells, the concentrations of the analyzed elements always remained well below the legal limit of acceptance defined by the Italian laws. For this reason, most of the elements have no data allowing to realize a trend. What is known is that the values constantly remained and remain below the limit. For some parameters instead, as ion concentrations, values were defined within the years and trends are here calculated.
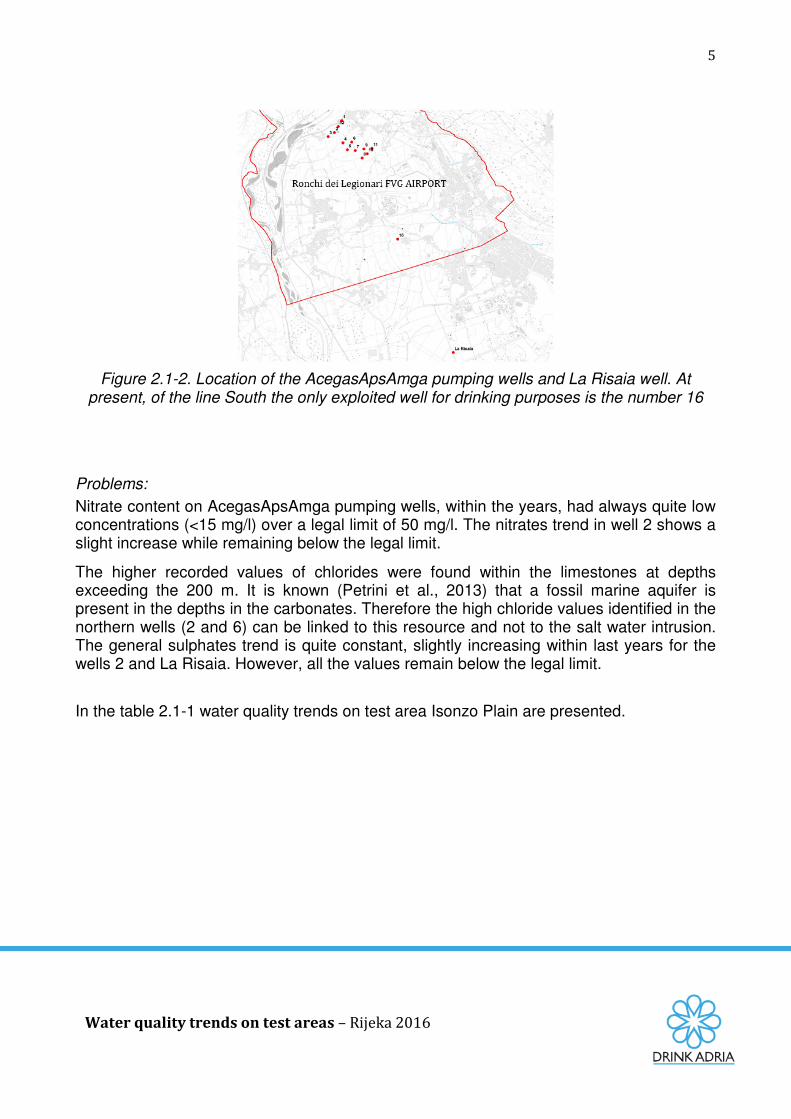
On the pumping wells present in the southern part of the test site area, exploited by AcegasApsAmga company, the monitoring occur on 13 wells (12 Linea Nord + P16 Dobbia) once a year. To realize the trends, the data collected from the 13 pumping wells exploited by AcegasApsAmga were evaluated (Figure 2.1-2). Analysis were available since 1973, drilling date, but good quality data are available since 2000.
The waters are analyzed once a year with a complete analysis according to D.Lgs. 31/01 in collaboration with the ASS n°1 Triestina. Good quality means waters having chemical and microbiological data that never exceed the legal limits fixed by the Italian legislations (D.Lgs 31/01 - National standard reference for water devoted to human consumption). The public water supply water quality standards for drinking water are regulated by D.Lgs 31/01 and D.Lgs 152/06, implemented of the European directive 98/83/CE and 2000/60/CEE.
5
Water quality trends on test areas – Rijeka 2016
Figure 2.1-2. Location of the AcegasApsAmga pumping wells and La Risaia well. At present, of the line South the only exploited well for drinking purposes is the number 16
Problems:
Nitrate content on AcegasApsAmga pumping wells, within the years, had always quite low concentrations (<15 mg/l) over a legal limit of 50 mg/l. The nitrates trend in well 2 shows a slight increase while remaining below the legal limit.
The higher recorded values of chlorides were found within the limestones at depths exceeding the 200 m. It is known (Petrini et al., 2013) that a fossil marine aquifer is present in the depths in the carbonates. Therefore the high chloride values identified in the northern wells (2 and 6) can be linked to this resource and not to the salt water intrusion. The general sulphates trend is quite constant, slightly increasing within last years for the wells 2 and La Risaia. However, all the values remain below the legal limit.
In the table 2.1-1 water quality trends on test area Isonzo Plain are presented.
6
Water quality trends on test areas – Rijeka 2016
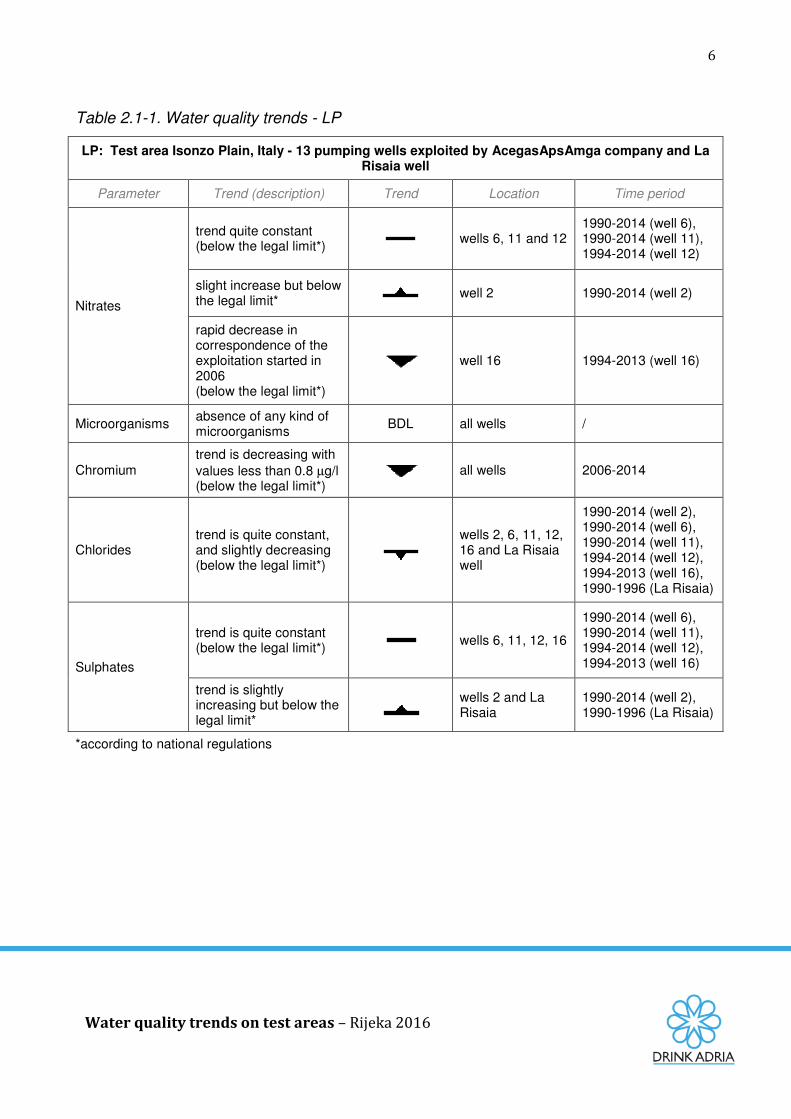
Table 2.1-1. Water quality trends - LP
LP: Test area Isonzo Plain, Italy - 13 pumping wells exploited by AcegasApsAmga company and La Risaia well
Parameter Trend (description) Trend Location Time period
trend is slightly increasing but below the legal limit*
wells 2 and La Risaia
1990-2014 (well 2), 1990-1996 (La Risaia)
*according to national regulations
7
Water quality trends on test areas – Rijeka 2016
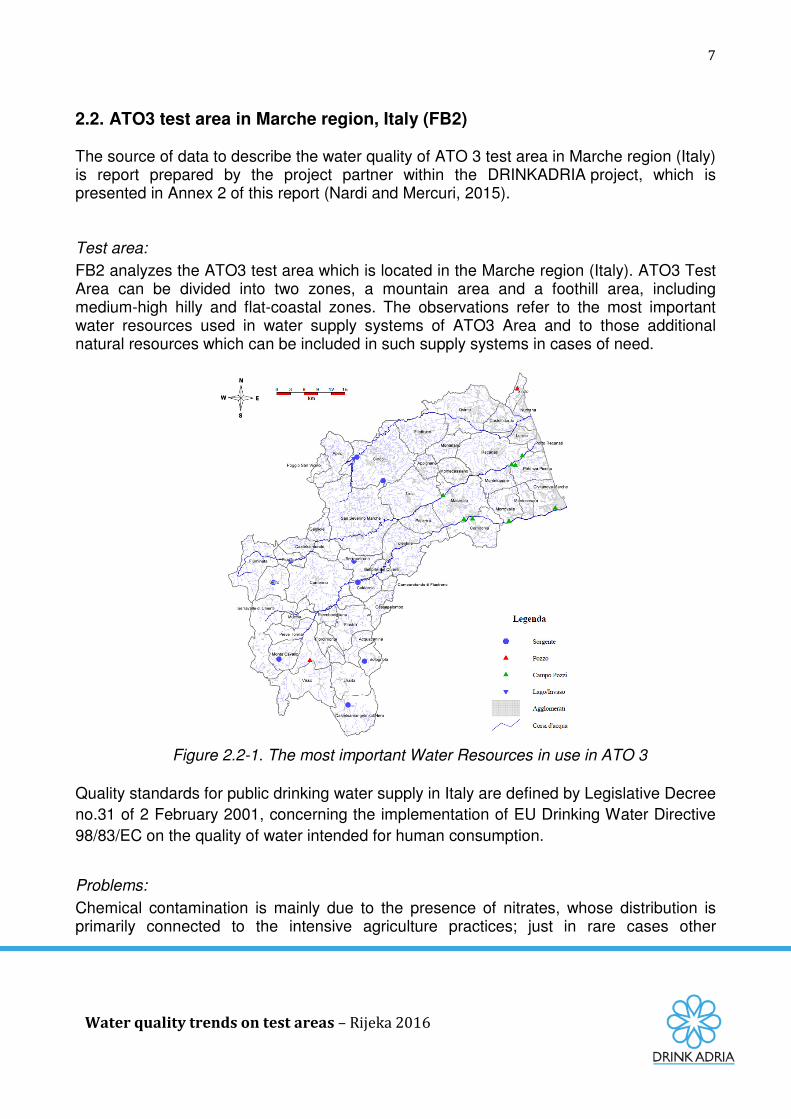
2.2. ATO3 test area in Marche region, Italy (FB2) The source of data to describe the water quality of ATO 3 test area in Marche region (Italy) is report prepared by the project partner within the DRINKADRIA project, which is presented in Annex 2 of this report (Nardi and Mercuri, 2015). Test area: FB2 analyzes the ATO3 test area which is located in the Marche region (Italy). ATO3 Test Area can be divided into two zones, a mountain area and a foothill area, including medium-high hilly and flat-coastal zones. The observations refer to the most important water resources used in water supply systems of ATO3 Area and to those additional natural resources which can be included in such supply systems in cases of need.
Figure 2.2-1. The most important Water Resources in use in ATO 3
Quality standards for public drinking water supply in Italy are defined by Legislative Decree no.31 of 2 February 2001, concerning the implementation of EU Drinking Water Directive 98/83/EC on the quality of water intended for human consumption.
Problems:
Chemical contamination is mainly due to the presence of nitrates, whose distribution is primarily connected to the intensive agriculture practices; just in rare cases other
8
Water quality trends on test areas – Rijeka 2016
parameters exceed the concentration limits and don’t match law requirements, mostly because of chemicals (magnesium sulfate, iron, ...) having a natural origin.
In spring water, mostly available in the mountain area, chemical contamination can be considered actually non-existent, with nitrate concentration below 5 mg/l NO3, which would make this water suitable to be bottled. Bacteriological contamination, on the other hand, is frequent in the small water sources that are in many cases obsolete and not well maintained.
Moving from the mountain area to the valleys (medium-high hilly area and flat-coastal zone), a progressive worsening of water quality features can be detected: electric conductivity is between 600 and 1400 µS/cm, dry residue is generally between 0,3 and 0,8 g/l, with an increase of the hardness, reaching values higher than those recommended.
In the central, medium-low hill area, most of the water supplied for drinking purposes comes from springs or drainage systems. Nitrates concentration is comprised between 5 and 40 mg/l NO3 and chemical contamination is mostly caused by greater agricultural activity, sometimes even resulting in exceeding the limit of 50 mg/l NO3 required for drinking water. Bacteriological situation is similar to that of mountain springs.
In the valley areas water intended for human consumption is drawn from wells dug into the alluvial mattress of major rivers. Nitrates concentration often exceeds the limit of 50 mg/l NO3, and in areas characterized by high human activity and intense agricultural activity, it can be greater than 100 mg/l. Bacteriological contamination is much less frequent.
Water drawn from wells dug in the alluvial mattress in the coastal area shows chemical characteristics similar to the one abstracted in the valleys. In some cases, intense exploitation of wells located next to the sea and their overuse has produced saline ingression phenomena. High nitrate concentrations and bacterial contamination are less frequent, but a progressive deterioration of groundwater quality has been registered since 1980’s because of contamination caused by industrial activity (Tetrachloroethylene, Trichloroethane).
Cases of non-compliance with bacteriological requirements and limits are very rare in the largest water supply systems, while they are common in the small distribution networks of mountain areas. Safeguard measure are very important as the extensive and, often, unplanned land use could represent a serious danger. Pollution by organohalogen compounds (Trichloroethane and, later, tetrachloroethylene, used as solvents in the industrial cycle of footwear production - polyurethane soles - by local factories) in the lower Chienti River Valley aquifer, affecting Montecosaro and Civitanova Marche drinking water supply, since 1992, is a clear example of that. Another problem, also connected with human pressure on natural resources, are the eutrophic phenomena, with the presence of toxic Planktothrix rubescens cells in Castreccioni lake, an artificial reservoir used for drinking water production, detected starting from January 2011, with increasing concentration of algae in the lake water.
9
Water quality trends on test areas – Rijeka 2016
Most of the cases of non-compliance to the parametric values set by Legislative Decree no.31/2001 is connected to microbiological contamination, present on many of the water sources in use in the mountain area. The determining factor of the non-compliance is generally due to the presence of bacteria, related to poor maintenance of pipelines, not yet existing Drinking Water Protected Areas (DWPAs) and disinfection treatment carried out just occasionally.
Regarding metals, just few cases of non-compliance to parametric values have been detected in the last 10 years, due to the high concentrations of iron and aluminium. In the spring waters are not detected measurable concentrations of organic compounds. In very rare cases trihalomethanes and pesticides have been detected in groundwater abstracted by wells in the ATO3 Area valleys.
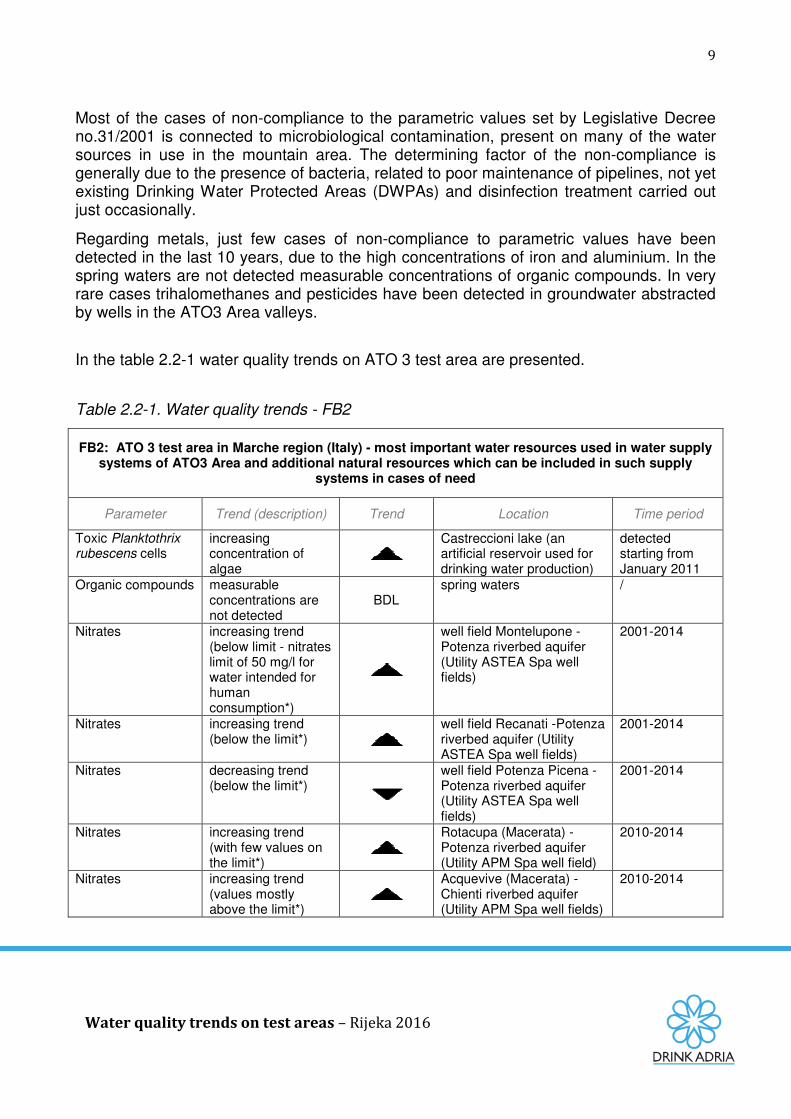
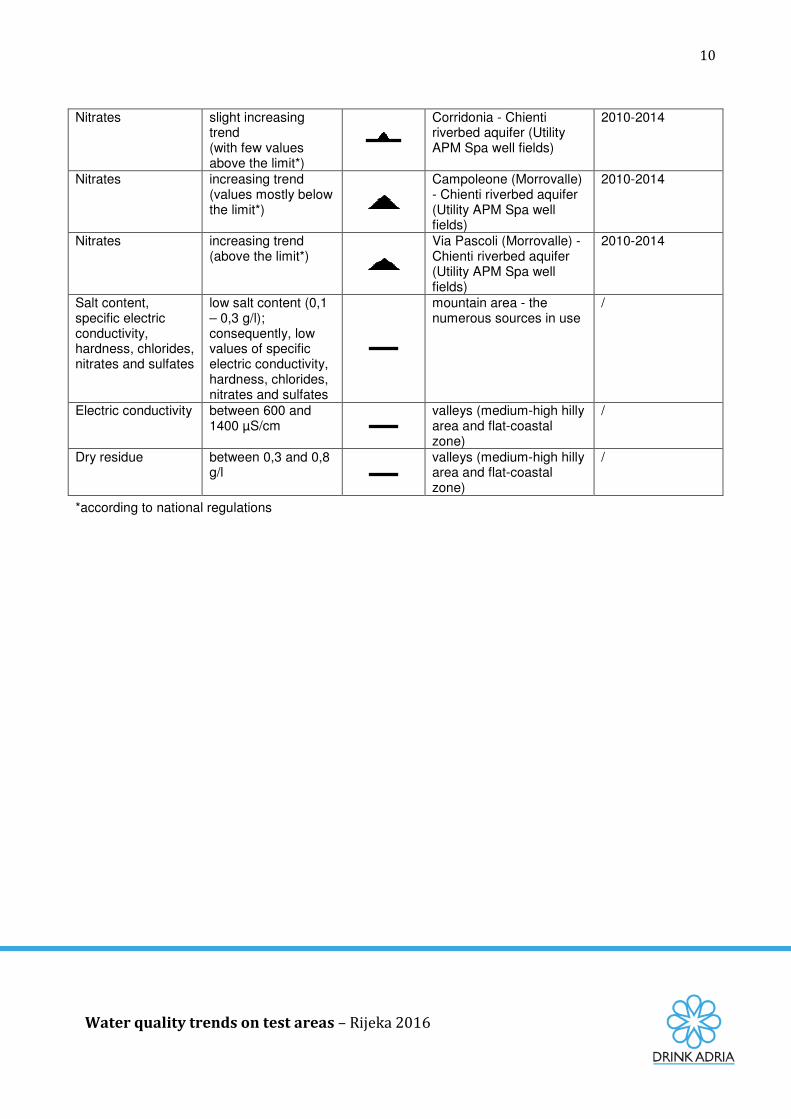
In the table 2.2-1 water quality trends on ATO 3 test area are presented.
Table 2.2-1. Water quality trends - FB2
FB2: ATO 3 test area in Marche region (Italy) - most important water resources used in water supply systems of ATO3 Area and additional natural resources which can be included in such supply
systems in cases of need
Parameter Trend (description) Trend Location Time period
Toxic Planktothrix rubescens cells
increasing concentration of algae
Castreccioni lake (an artificial reservoir used for drinking water production)
detected starting from January 2011
Organic compounds measurable concentrations are not detected
BDL spring waters /
Nitrates
increasing trend (below limit - nitrates limit of 50 mg/l for water intended for human consumption*)
well field Montelupone - Potenza riverbed aquifer (Utility ASTEA Spa well fields)
2001-2014
Nitrates increasing trend (below the limit*)
well field Recanati -Potenza riverbed aquifer (Utility ASTEA Spa well fields)
2001-2014
Nitrates decreasing trend (below the limit*)
well field Potenza Picena - Potenza riverbed aquifer (Utility ASTEA Spa well fields)
2001-2014
Nitrates increasing trend (with few values on the limit*)
Via Pascoli (Morrovalle) - Chienti riverbed aquifer (Utility APM Spa well fields)
2010-2014
Salt content, specific electric conductivity, hardness, chlorides, nitrates and sulfates
low salt content (0,1 – 0,3 g/l); consequently, low values of specific electric conductivity, hardness, chlorides, nitrates and sulfates
mountain area - the numerous sources in use
/
Electric conductivity between 600 and 1400 µS/cm
valleys (medium-high hilly area and flat-coastal zone)
/
Dry residue between 0,3 and 0,8 g/l
valleys (medium-high hilly area and flat-coastal zone)
/
*according to national regulations
11
Water quality trends on test areas – Rijeka 2016
2.3. Test area Ostuni in Apulia region, Italy (FB3) The source of data to describe the water quality of test area Ostuni in Apulia region (Italy) is report prepared by the project partner within the DRINKADRIA project, which is presented in Annex 3 of this report (Masciopinto et al., 2015). Test area:
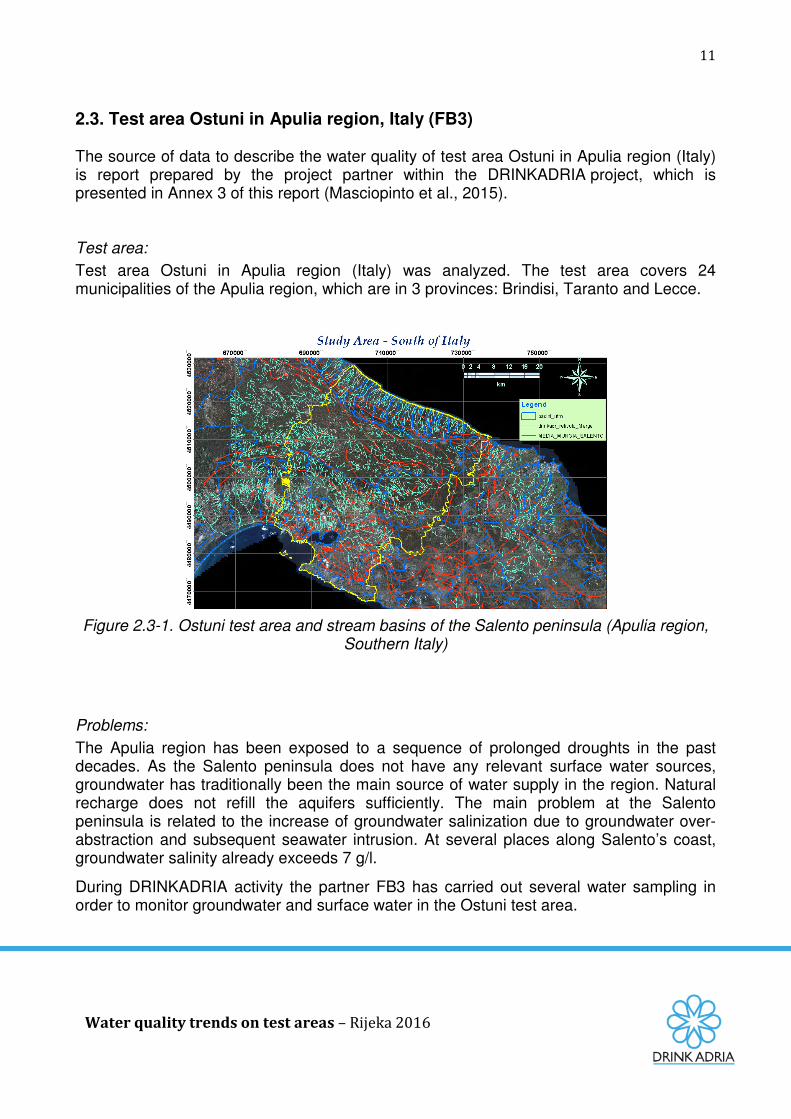
Test area Ostuni in Apulia region (Italy) was analyzed. The test area covers 24 municipalities of the Apulia region, which are in 3 provinces: Brindisi, Taranto and Lecce.
Figure 2.3-1. Ostuni test area and stream basins of the Salento peninsula (Apulia region,
Southern Italy) Problems: The Apulia region has been exposed to a sequence of prolonged droughts in the past decades. As the Salento peninsula does not have any relevant surface water sources, groundwater has traditionally been the main source of water supply in the region. Natural recharge does not refill the aquifers sufficiently. The main problem at the Salento peninsula is related to the increase of groundwater salinization due to groundwater over-abstraction and subsequent seawater intrusion. At several places along Salento’s coast, groundwater salinity already exceeds 7 g/l.
During DRINKADRIA activity the partner FB3 has carried out several water sampling in order to monitor groundwater and surface water in the Ostuni test area.
12
Water quality trends on test areas – Rijeka 2016
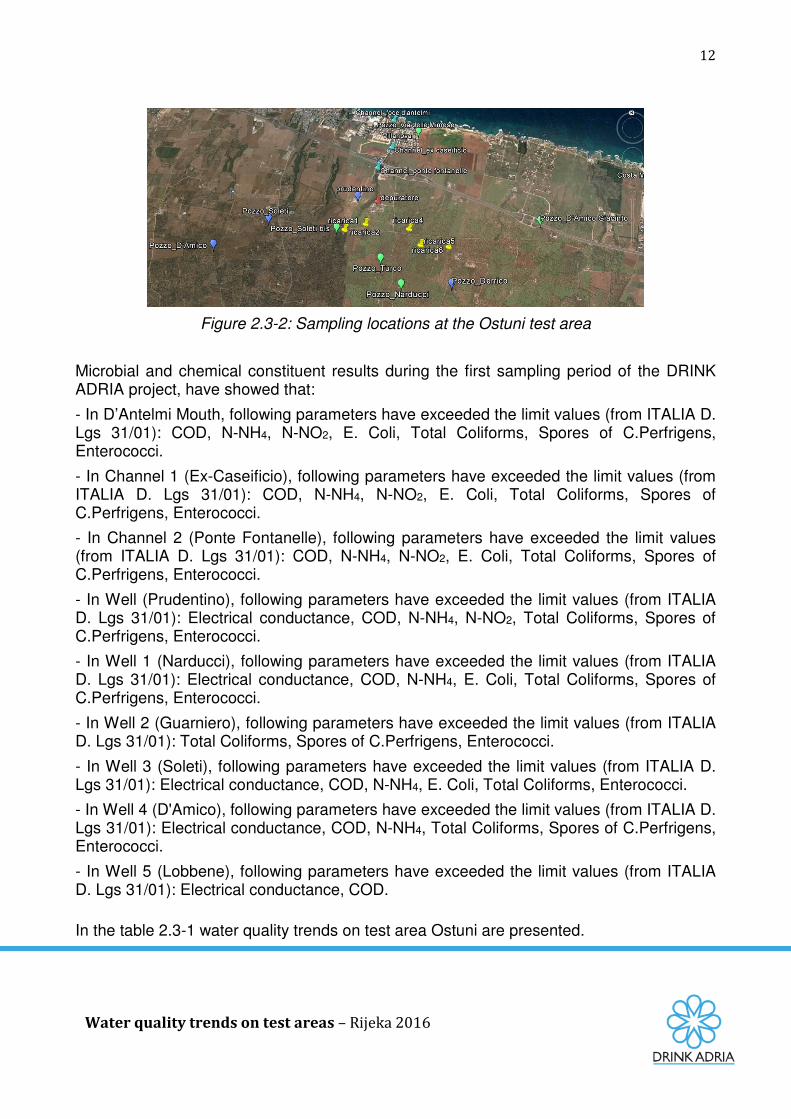
Figure 2.3-2: Sampling locations at the Ostuni test area
Microbial and chemical constituent results during the first sampling period of the DRINK ADRIA project, have showed that:
- In D’Antelmi Mouth, following parameters have exceeded the limit values (from ITALIA D. Lgs 31/01): COD, N-NH4, N-NO2, E. Coli, Total Coliforms, Spores of C.Perfrigens, Enterococci.
- In Channel 1 (Ex-Caseificio), following parameters have exceeded the limit values (from ITALIA D. Lgs 31/01): COD, N-NH4, N-NO2, E. Coli, Total Coliforms, Spores of C.Perfrigens, Enterococci.
- In Channel 2 (Ponte Fontanelle), following parameters have exceeded the limit values (from ITALIA D. Lgs 31/01): COD, N-NH4, N-NO2, E. Coli, Total Coliforms, Spores of C.Perfrigens, Enterococci.
- In Well (Prudentino), following parameters have exceeded the limit values (from ITALIA D. Lgs 31/01): Electrical conductance, COD, N-NH4, N-NO2, Total Coliforms, Spores of C.Perfrigens, Enterococci.
- In Well 1 (Narducci), following parameters have exceeded the limit values (from ITALIA D. Lgs 31/01): Electrical conductance, COD, N-NH4, E. Coli, Total Coliforms, Spores of C.Perfrigens, Enterococci.
- In Well 2 (Guarniero), following parameters have exceeded the limit values (from ITALIA D. Lgs 31/01): Total Coliforms, Spores of C.Perfrigens, Enterococci.
- In Well 3 (Soleti), following parameters have exceeded the limit values (from ITALIA D. Lgs 31/01): Electrical conductance, COD, N-NH4, E. Coli, Total Coliforms, Enterococci.
- In Well 4 (D'Amico), following parameters have exceeded the limit values (from ITALIA D. Lgs 31/01): Electrical conductance, COD, N-NH4, Total Coliforms, Spores of C.Perfrigens, Enterococci.
- In Well 5 (Lobbene), following parameters have exceeded the limit values (from ITALIA D. Lgs 31/01): Electrical conductance, COD. In the table 2.3-1 water quality trends on test area Ostuni are presented.
13
Water quality trends on test areas – Rijeka 2016
Table 2.3-1. Water quality trends - FB3
FB3: Test area Ostuni in Apulia region (Italy)
Parameter Trend (description) Trend Location Time period
Salinization
increase of groundwater salinization due to groundwater over-abstraction and subsequent seawater intrusion
Salento peninsula (groundwater) 1998/2015
2.4. Test area Kobariški stol, Mia and Matajur aquifers, in NW Slovenia (FB5) The source of data to describe the water quality of test area Kobariški stol, Mia and Matajur aquifers in NW Slovenia is report prepared by the project partner within the DRINKADRIA project, which is presented in Annex 4 of this report (Žvab Rožič et al., 2014). Test area:
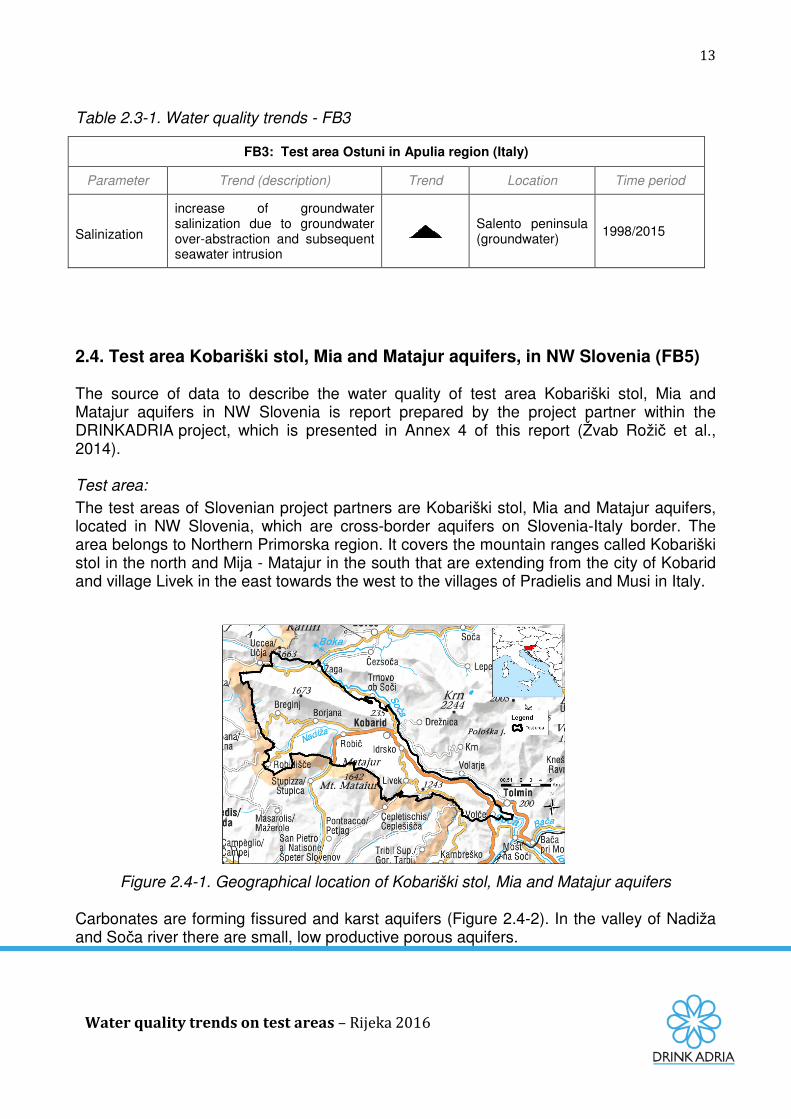
The test areas of Slovenian project partners are Kobariški stol, Mia and Matajur aquifers, located in NW Slovenia, which are cross-border aquifers on Slovenia-Italy border. The area belongs to Northern Primorska region. It covers the mountain ranges called Kobariški stol in the north and Mija - Matajur in the south that are extending from the city of Kobarid and village Livek in the east towards the west to the villages of Pradielis and Musi in Italy.
Figure 2.4-1. Geographical location of Kobariški stol, Mia and Matajur aquifers
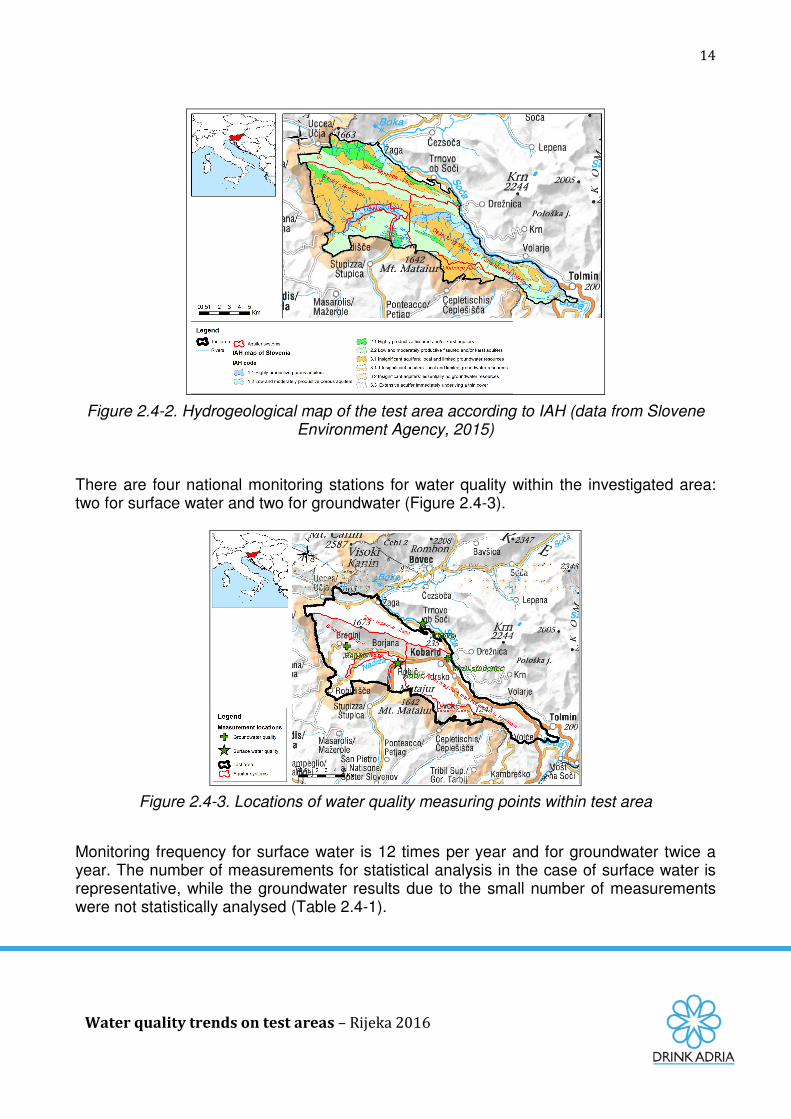
Carbonates are forming fissured and karst aquifers (Figure 2.4-2). In the valley of Nadiža and Soča river there are small, low productive porous aquifers.
14
Water quality trends on test areas – Rijeka 2016
Figure 2.4-2. Hydrogeological map of the test area according to IAH (data from Slovene
Environment Agency, 2015) There are four national monitoring stations for water quality within the investigated area: two for surface water and two for groundwater (Figure 2.4-3).
Figure 2.4-3. Locations of water quality measuring points within test area
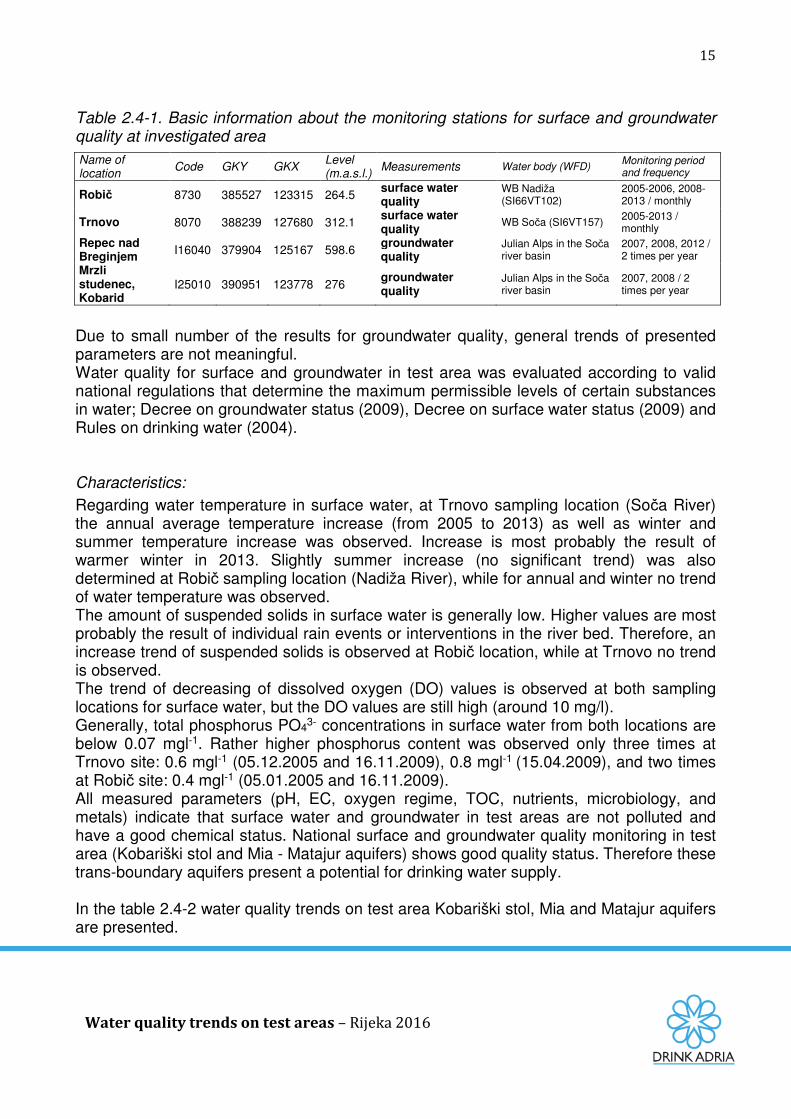
Monitoring frequency for surface water is 12 times per year and for groundwater twice a year. The number of measurements for statistical analysis in the case of surface water is representative, while the groundwater results due to the small number of measurements were not statistically analysed (Table 2.4-1).
15
Water quality trends on test areas – Rijeka 2016
Table 2.4-1. Basic information about the monitoring stations for surface and groundwater quality at investigated area
Name of location
Code GKY GKX Level (m.a.s.l.)
Measurements Water body (WFD) Monitoring period and frequency
Robič 8730 385527 123315 264.5 surface water quality
WB Nadiža (SI66VT102)
2005-2006, 2008-2013 / monthly
Trnovo 8070 388239 127680 312.1 surface water quality
WB Soča (SI6VT157) 2005-2013 / monthly
Repec nad Breginjem
I16040 379904 125167 598.6 groundwater quality
Julian Alps in the Soča river basin
2007, 2008, 2012 / 2 times per year
Mrzli studenec, Kobarid
I25010 390951 123778 276 groundwater quality
Julian Alps in the Soča river basin
2007, 2008 / 2 times per year
Due to small number of the results for groundwater quality, general trends of presented parameters are not meaningful. Water quality for surface and groundwater in test area was evaluated according to valid national regulations that determine the maximum permissible levels of certain substances in water; Decree on groundwater status (2009), Decree on surface water status (2009) and Rules on drinking water (2004). Characteristics:
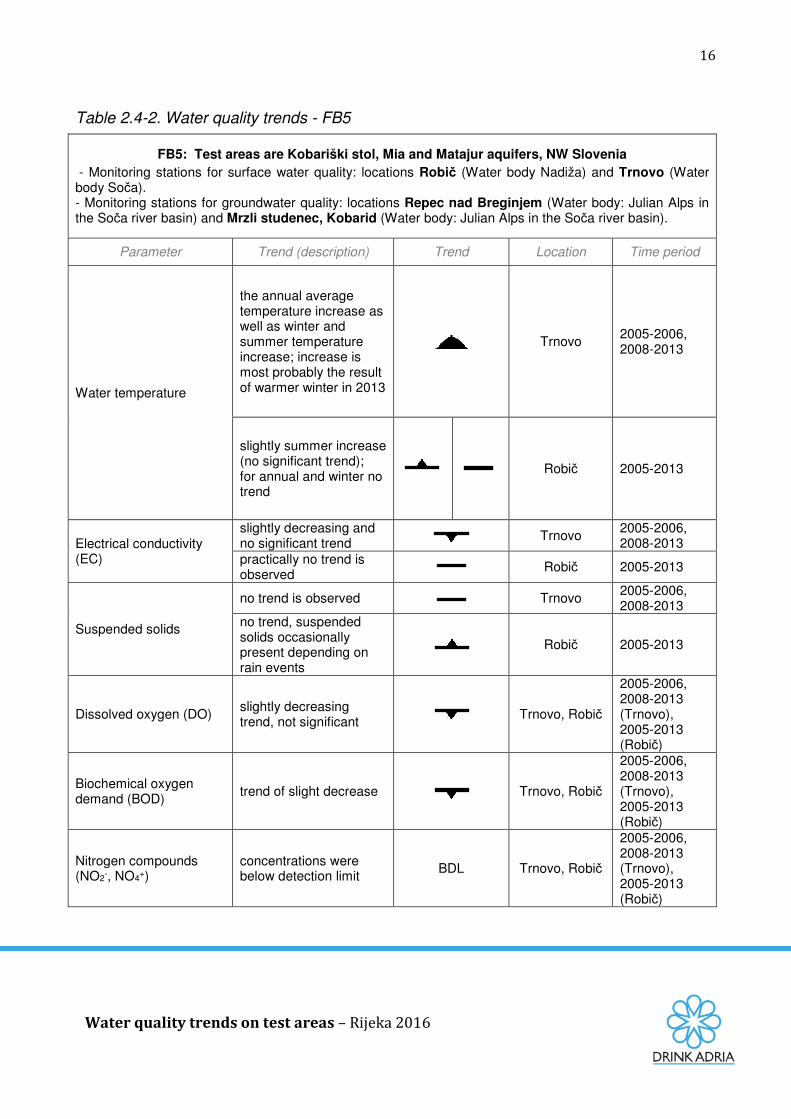
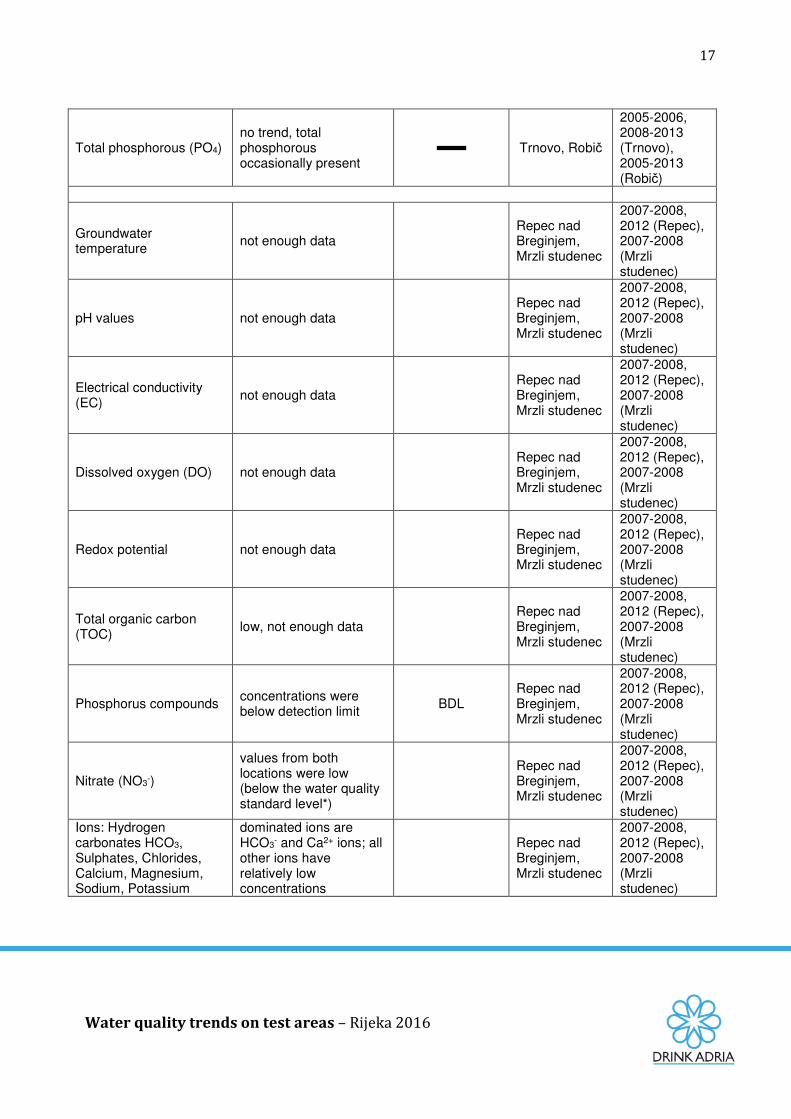
Regarding water temperature in surface water, at Trnovo sampling location (Soča River) the annual average temperature increase (from 2005 to 2013) as well as winter and summer temperature increase was observed. Increase is most probably the result of warmer winter in 2013. Slightly summer increase (no significant trend) was also determined at Robič sampling location (Nadiža River), while for annual and winter no trend of water temperature was observed. The amount of suspended solids in surface water is generally low. Higher values are most probably the result of individual rain events or interventions in the river bed. Therefore, an increase trend of suspended solids is observed at Robič location, while at Trnovo no trend is observed. The trend of decreasing of dissolved oxygen (DO) values is observed at both sampling locations for surface water, but the DO values are still high (around 10 mg/l). Generally, total phosphorus PO43- concentrations in surface water from both locations are below 0.07 mgl-1. Rather higher phosphorus content was observed only three times at Trnovo site: 0.6 mgl-1 (05.12.2005 and 16.11.2009), 0.8 mgl-1 (15.04.2009), and two times at Robič site: 0.4 mgl-1 (05.01.2005 and 16.11.2009). All measured parameters (pH, EC, oxygen regime, TOC, nutrients, microbiology, and metals) indicate that surface water and groundwater in test areas are not polluted and have a good chemical status. National surface and groundwater quality monitoring in test area (Kobariški stol and Mia - Matajur aquifers) shows good quality status. Therefore these trans-boundary aquifers present a potential for drinking water supply. In the table 2.4-2 water quality trends on test area Kobariški stol, Mia and Matajur aquifers are presented.
16
Water quality trends on test areas – Rijeka 2016
Table 2.4-2. Water quality trends - FB5
FB5: Test areas are Kobariški stol, Mia and Matajur aquifers, NW Slovenia
- Monitoring stations for surface water quality: locations Robič (Water body Nadiža) and Trnovo (Water body Soča). - Monitoring stations for groundwater quality: locations Repec nad Breginjem (Water body: Julian Alps in the Soča river basin) and Mrzli studenec, Kobarid (Water body: Julian Alps in the Soča river basin).
Parameter Trend (description) Trend Location Time period
Water temperature
the annual average temperature increase as well as winter and summer temperature increase; increase is most probably the result of warmer winter in 2013
Trnovo 2005-2006, 2008-2013
slightly summer increase (no significant trend); for annual and winter no trend
Robič 2005-2013
Electrical conductivity (EC)
slightly decreasing and no significant trend
Trnovo 2005-2006, 2008-2013
practically no trend is observed
Robič 2005-2013
Suspended solids
no trend is observed Trnovo 2005-2006, 2008-2013
no trend, suspended solids occasionally present depending on rain events
Robič 2005-2013
Dissolved oxygen (DO) slightly decreasing trend, not significant
Trnovo, Robič
2005-2006, 2008-2013 (Trnovo), 2005-2013 (Robič)
Biochemical oxygen demand (BOD) trend of slight decrease
Trnovo, Robič
2005-2006, 2008-2013 (Trnovo), 2005-2013 (Robič)
Nitrogen compounds (NO2-, NO4+)
concentrations were below detection limit BDL Trnovo, Robič
2005-2006, 2008-2013 (Trnovo), 2005-2013 (Robič)
17
Water quality trends on test areas – Rijeka 2016
Total phosphorous (PO4) no trend, total phosphorous occasionally present
Trnovo, Robič
2005-2006, 2008-2013 (Trnovo), 2005-2013 (Robič)
Groundwater temperature
not enough data Repec nad Breginjem, Mrzli studenec
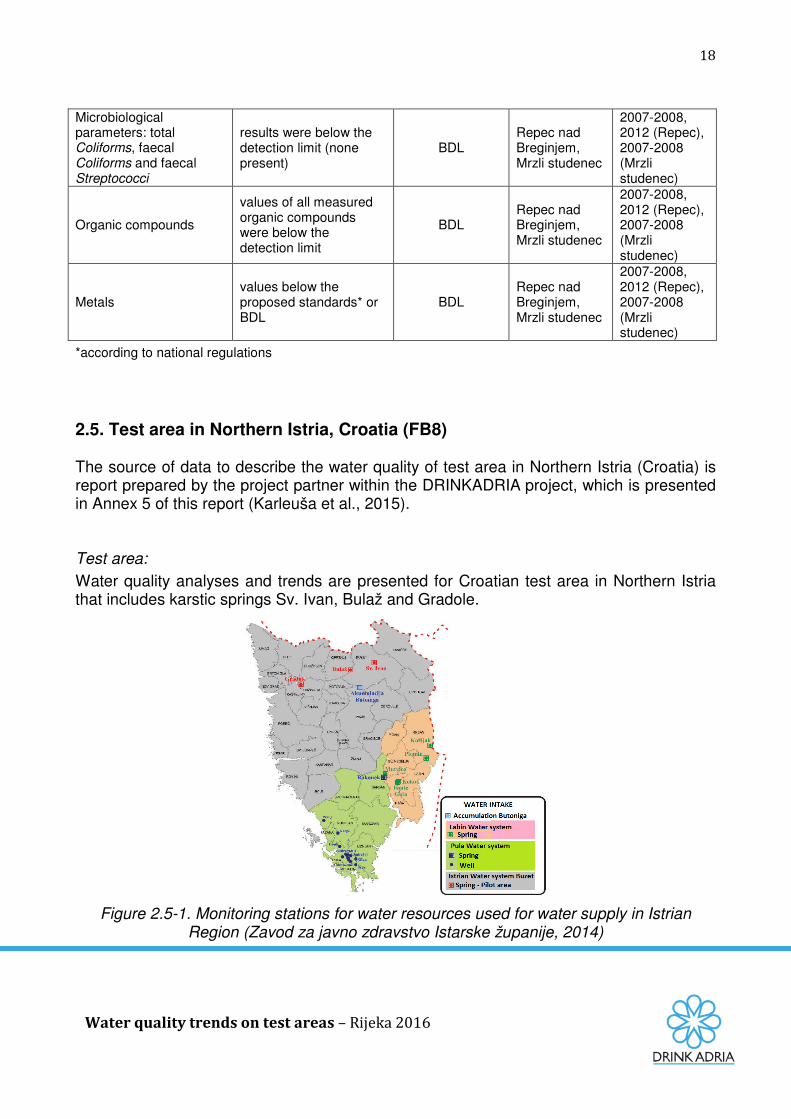
2.5. Test area in Northern Istria, Croatia (FB8) The source of data to describe the water quality of test area in Northern Istria (Croatia) is report prepared by the project partner within the DRINKADRIA project, which is presented in Annex 5 of this report (Karleuša et al., 2015). Test area:
Water quality analyses and trends are presented for Croatian test area in Northern Istria that includes karstic springs Sv. Ivan, Bulaž and Gradole.
Figure 2.5-1. Monitoring stations for water resources used for water supply in Istrian Region (Zavod za javno zdravstvo Istarske županije, 2014)
19
Water quality trends on test areas – Rijeka 2016
The monitoring frequency (number of samples per year) depends on tested water quality parameter, usually from 2 to 13 times per year. But for most of the parameters is 12 times per year according to the program of Croatian Waters.
Problems:
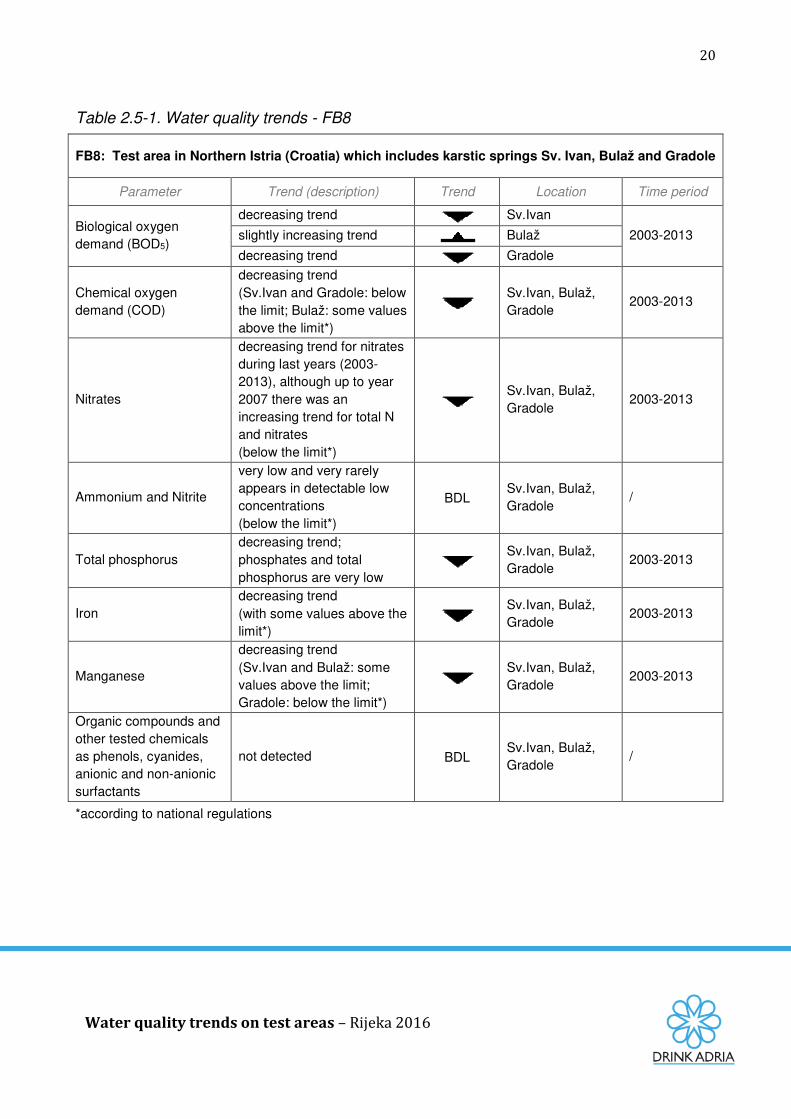
In case of karst springs like Sv. Ivan, Bulaž and Gradole, it has to be taken in consideration one limitation of the monitoring program that can bring different (usually better) picture on ground water quality. The karst springs are very sensitive to sudden changes in the hydrological regime. In case of intensive rainfall in the catchment area of each spring, high water turbidity, large amounts of suspended solids and a very strong microbiological contamination occurs. Such events occur at intervals from few times a month to several times a year and their impact on water quality is significant though short-lived (a few hours to several days). These phenomena are not detected during regular monitoring (as in the days of such occurrence there is no sampling), but can be detected by frequent analyses that can be done by the Water Utility laboratory. There is an increasing trend of mean annual values of total suspended solids (TSS) on all analysed springs. However, the content of TSS depends primarily on hydrological conditions in the basin, on the amount and intensity of rainfall, so this should not be considered as an indicator of pollution. On the spring Bulaž there are slightly increasing values of BOD5. Nitrate content on springs Sv. Ivan and Bulaž is low. Due to the more developed agricultural activities in the catchment of spring Gradole the content of nitrate is higher. But on all springs during last years (2003-2013) there is a decreasing trend for nitrates, although up to year 2007 there was an increasing trend for total N and nitrates (Zavod za javno zdravstvo Istarske županije, 2008). All values are below maximum allowable concentration (MAC) for drinking water. Microbiological contamination is present at all springs and is associated to the hydrological conditions in the watersheds. High values are associated with the occurrence of torrential waters and increased amounts of silt which is entering in the aquifers. Higher concentrations of total number of microorganisms and microorganisms of fecal origin were observed also at all springs, but occasionally. The source of these organisms can be wild animals or livestock in the watershed areas of springs, but mostly the main sources are untreated urban waste waters from settlements. Due to occurrence of extreme turbidity increased concentrations of iron and manganese occur in natural waters which are above the MAC for drinking water (Zavod za javno zdravstvo Istarske županije, 2005). The assesment for springs Sv. Ivan, Gradole and Bulaž according to new Decree on water quality standards (based only on chemical parameters) after 2011 is good status. From the analysis of the water quality for springs Sv. Ivan, Bulaž and Gradole can be concluded that the values of nearly all indicators are decreasing, respectively as the quality of the water on springs improves. In the table 2.5-1 water quality trends on test area in Northern Istria are presented.
20
Water quality trends on test areas – Rijeka 2016
Table 2.5-1. Water quality trends - FB8
FB8: Test area in Northern Istria (Croatia) which includes karstic springs Sv. Ivan, Bulaž and Gradole
Parameter Trend (description) Trend Location Time period
Biological oxygen demand (BOD5)
decreasing trend Sv.Ivan
2003-2013 slightly increasing trend Bulaž
decreasing trend Gradole
Chemical oxygen demand (COD)
decreasing trend (Sv.Ivan and Gradole: below the limit; Bulaž: some values above the limit*)
Sv.Ivan, Bulaž, Gradole
2003-2013
Nitrates
decreasing trend for nitrates during last years (2003-2013), although up to year 2007 there was an increasing trend for total N and nitrates (below the limit*)
Sv.Ivan, Bulaž, Gradole
2003-2013
Ammonium and Nitrite
very low and very rarely appears in detectable low concentrations (below the limit*)
BDL Sv.Ivan, Bulaž, Gradole
/
Total phosphorus decreasing trend; phosphates and total phosphorus are very low
Sv.Ivan, Bulaž, Gradole
2003-2013
Iron decreasing trend (with some values above the limit*)
Sv.Ivan, Bulaž, Gradole
2003-2013
Manganese
decreasing trend (Sv.Ivan and Bulaž: some values above the limit; Gradole: below the limit*)
Sv.Ivan, Bulaž, Gradole
2003-2013
Organic compounds and other tested chemicals as phenols, cyanides, anionic and non-anionic surfactants
not detected BDL Sv.Ivan, Bulaž, Gradole
/
*according to national regulations
21
Water quality trends on test areas – Rijeka 2016
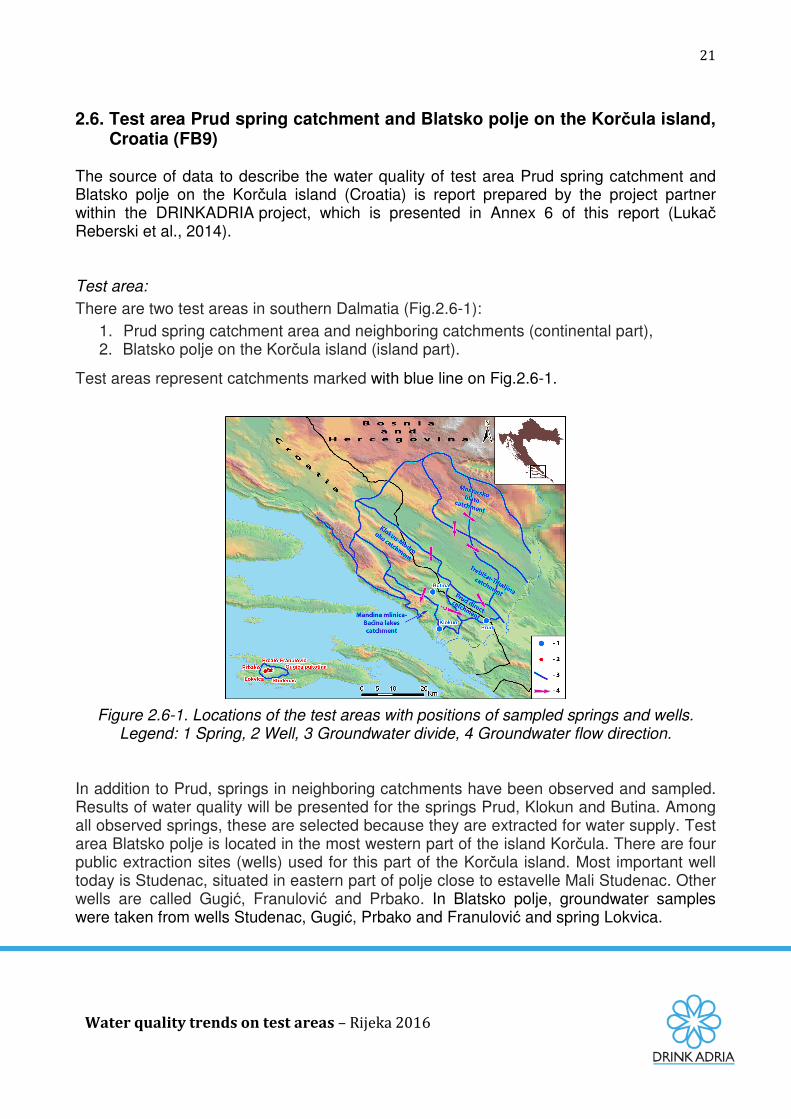
2.6. Test area Prud spring catchment and Blatsko polje on the Korčula island, Croatia (FB9)
The source of data to describe the water quality of test area Prud spring catchment and Blatsko polje on the Korčula island (Croatia) is report prepared by the project partner within the DRINKADRIA project, which is presented in Annex 6 of this report (Lukač Reberski et al., 2014). Test area: There are two test areas in southern Dalmatia (Fig.2.6-1):
1. Prud spring catchment area and neighboring catchments (continental part), 2. Blatsko polje on the Korčula island (island part).
Test areas represent catchments marked with blue line on Fig.2.6-1.
Figure 2.6-1. Locations of the test areas with positions of sampled springs and wells. Legend: 1 Spring, 2 Well, 3 Groundwater divide, 4 Groundwater flow direction.
In addition to Prud, springs in neighboring catchments have been observed and sampled. Results of water quality will be presented for the springs Prud, Klokun and Butina. Among all observed springs, these are selected because they are extracted for water supply. Test area Blatsko polje is located in the most western part of the island Korčula. There are four public extraction sites (wells) used for this part of the Korčula island. Most important well today is Studenac, situated in eastern part of polje close to estavelle Mali Studenac. Other wells are called Gugić, Franulović and Prbako. In Blatsko polje, groundwater samples were taken from wells Studenac, Gugić, Prbako and Franulović and spring Lokvica.
22
Water quality trends on test areas – Rijeka 2016
Problems:
Investigated areas are located in the karst terrain which is known for its unpredictability. Groundwater in karst terrains can dramatically and rapidly fluctuate in response to surface events, even from very distant areas. Very fast infiltration and water transport mechanisms typical for karst water systems makes karst groundwater particularly sensitive to contamination. Sometimes water from Prud has slightly higher Cl concentration because mixing with sea water. Sampled waters from island test area range from calcium - hydrogencarbonate to sodium-chloride hydrochemical facies which indicates strong influence of the sea water intrusions. The highest influence of sea water on water type is observed on spring Lokvica, where on June 2010, water belongs to Na-Cl type. Lowering of the groundwater level allows entry of sea water into the aquifer and thus salinized water causing degradation in the quality of the water. In Blatsko polje, chloride concentration varies in all the wells. Such wide variations with extremely high values in summer 2002 are the consequence of lack of precipitation and higher pumping rates of wells. Nitrate concentrations in groundwater in Blatsko polje are low during the dry season (from 5 to 20 mg/l), but in the wet season the contribution of unused NO3– from the soil zone (unsaturated zone) increases the concentration of NO3– in groundwater (from 35 to 43 mg/l near the maximal permitted concentration, which is 50 mg/l in Croatia). In the table 2.6-1 water quality trends on test areas in southern Dalmatia are presented.
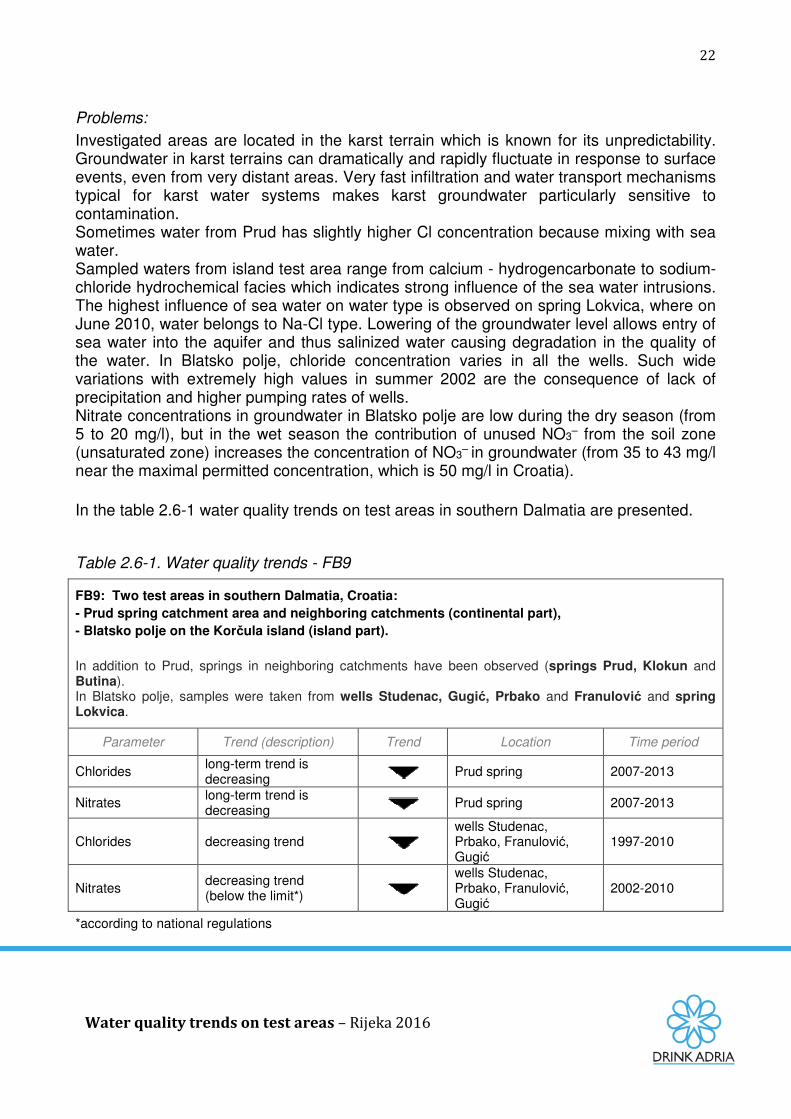
Table 2.6-1. Water quality trends - FB9
FB9: Two test areas in southern Dalmatia, Croatia:
- Prud spring catchment area and neighboring catchments (continental part),
- Blatsko polje on the Korčula island (island part).
In addition to Prud, springs in neighboring catchments have been observed (springs Prud, Klokun and Butina). In Blatsko polje, samples were taken from wells Studenac, Gugić, Prbako and Franulović and spring Lokvica.
Parameter Trend (description) Trend Location Time period
Chlorides long-term trend is decreasing Prud spring 2007-2013
Nitrates long-term trend is decreasing Prud spring 2007-2013
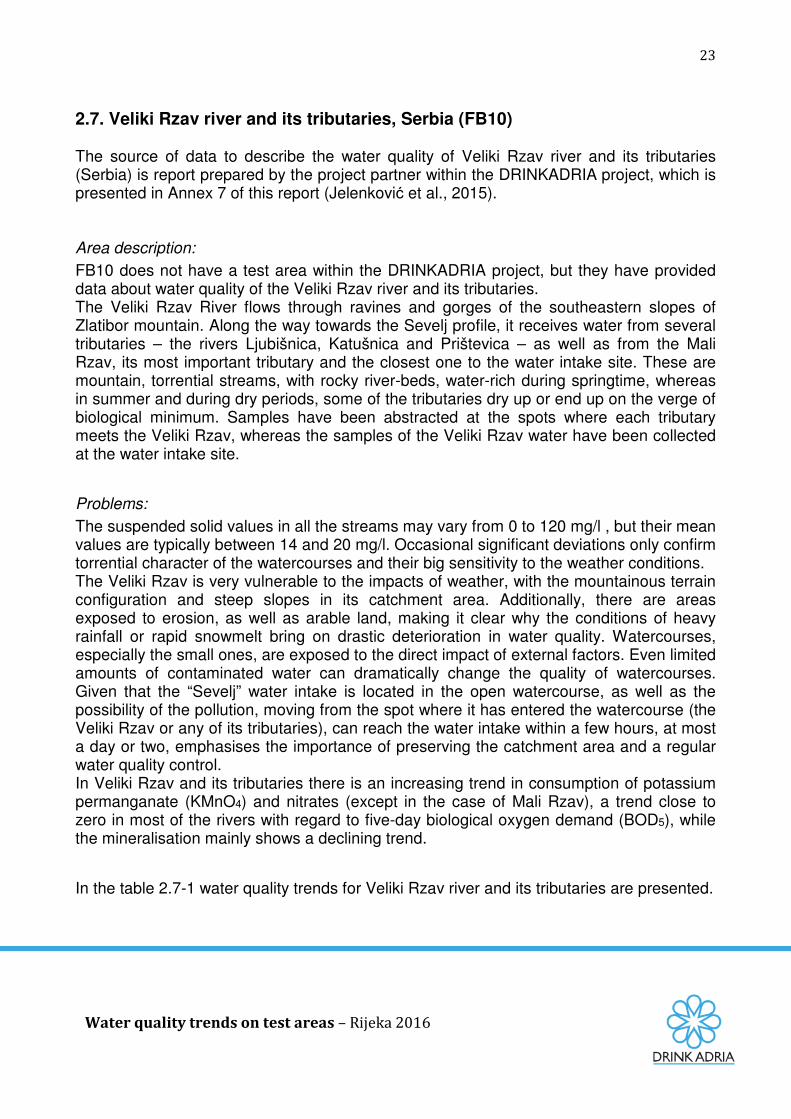
2.7. Veliki Rzav river and its tributaries, Serbia (FB10) The source of data to describe the water quality of Veliki Rzav river and its tributaries (Serbia) is report prepared by the project partner within the DRINKADRIA project, which is presented in Annex 7 of this report (Jelenković et al., 2015). Area description:
FB10 does not have a test area within the DRINKADRIA project, but they have provided data about water quality of the Veliki Rzav river and its tributaries. The Veliki Rzav River flows through ravines and gorges of the southeastern slopes of Zlatibor mountain. Along the way towards the Sevelj profile, it receives water from several tributaries – the rivers Ljubišnica, Katušnica and Prištevica – as well as from the Mali Rzav, its most important tributary and the closest one to the water intake site. These are mountain, torrential streams, with rocky river-beds, water-rich during springtime, whereas in summer and during dry periods, some of the tributaries dry up or end up on the verge of biological minimum. Samples have been abstracted at the spots where each tributary meets the Veliki Rzav, whereas the samples of the Veliki Rzav water have been collected at the water intake site.
Problems:
The suspended solid values in all the streams may vary from 0 to 120 mg/l , but their mean values are typically between 14 and 20 mg/l. Occasional significant deviations only confirm torrential character of the watercourses and their big sensitivity to the weather conditions. The Veliki Rzav is very vulnerable to the impacts of weather, with the mountainous terrain configuration and steep slopes in its catchment area. Additionally, there are areas exposed to erosion, as well as arable land, making it clear why the conditions of heavy rainfall or rapid snowmelt bring on drastic deterioration in water quality. Watercourses, especially the small ones, are exposed to the direct impact of external factors. Even limited amounts of contaminated water can dramatically change the quality of watercourses. Given that the “Sevelj” water intake is located in the open watercourse, as well as the possibility of the pollution, moving from the spot where it has entered the watercourse (the Veliki Rzav or any of its tributaries), can reach the water intake within a few hours, at most a day or two, emphasises the importance of preserving the catchment area and a regular water quality control. In Veliki Rzav and its tributaries there is an increasing trend in consumption of potassium permanganate (KMnO4) and nitrates (except in the case of Mali Rzav), a trend close to zero in most of the rivers with regard to five-day biological oxygen demand (BOD5), while the mineralisation mainly shows a declining trend.
In the table 2.7-1 water quality trends for Veliki Rzav river and its tributaries are presented.
24
Water quality trends on test areas – Rijeka 2016
Table 2.7-1. Water quality trends - FB10
FB10: Veliki Rzav river and its tributaries (rivers Ljubišnica, Katušnica, Prištevica, Mali Rzav)
in Serbia - not a test area.
Samples have been abstracted at the spots where each tributary meets the Veliki Rzav, whereas the samples of the Veliki Rzav water have been collected at the water intake site.
Parameter Trend (description) Trend Location Time period
Consumption of KMnO4
slight decreasing trend Mali Rzav river
1997-2014 slight increasing trend
Veliki Rzav river Ljubišnica river
increasing trend Katušnica river Prištevica river
Nitrates NO3-N
slight decreasing trend (below the limit*: allowed N content in drinking water is 10 mg/l)
Mali Rzav river
1997-2014
slight increasing trend (below the limit*)
Veliki Rzav river Ljubišnica river Katušnica river Prištevica river
BOD5 slight increasing trend
Veliki Rzav river
1997-2014 Mali Rzav river Ljubišnica river Katušnica river
slight decreasing trend Prištevica river
The rest of unfiltered water vapours (mineralization change)
slight decreasing trend Veliki Rzav river
1997-2014 decreasing trend
Mali Rzav river Ljubišnica river Katušnica river
increasing trend Prištevica river
*according to national regulations
25
Water quality trends on test areas – Rijeka 2016
2.8. Test area Drini river basin, Albania (FB11) The source of data to describe the water quality of test area Drini river basin (Albania) is report prepared by the project partner within the DRINKADRIA project, which is presented in Annex 8 of this report (Peci et al., 2015). Test area:
Analyzed test area is Drini river basin. Drini River watershed comprises a considerable area of 14173 km2 (within Albania), continuing also beyond Albanian borders, covering very important aquatic ecosystems. Beside the river course, its related tributaries and closely related artificial lakes of Drini cascade (Fierza, Komani and Vau-deja) in Drini watershed are situated the big trans-boundary lakes of Ohrid, Prespa and Shkodra, three groups of mountainous glacial lakes of Lura, Ballgjaj and Dhoksi. Close to Drini delta an important lagoon system is situated, with three main lagoons: Merxhani, Ceka and Kenalla (Shumka and Miho, 2008).
Problems:
Pollution from diffuse (e.g. agriculture) or point sources (e.g. industrial and urban wastewaters etc.) is a matter of concern throughout the “extended” Drin River basin. While in the lower parts of the drainage system, in the Buna/Bojana River, most of the phosphorus load derives from agriculture, sewage is more important in the upper parts of the Black Drin (Beck, 1904). Inadequate wastewater collection and lack of treatment is an issue in the Albanian part of Micro Prespa; wastewater is discharged in surface waters or underground. Observations suggest that the Lake is currently heading towards eutrophication. Nutrients input is mainly from the FYROM side. This input comes as a result of insufficient wastewater management and unsustainable agricultural activities (e.g. improper use of fertilizers and irrigation techniques); in addition, erosion may also contribute to nutrient inputs due to the poor land management (agriculture). Organic pollution leads to depleted dissolved oxygen concentrations. Lake Ohrid is being “fertilized” from the FYROM side by sewage and use of fertilizers. Urban wastewater discharge has been the main input of nutrients from the Albanian side leading also to organic and bacterial pollution at the littoral zone. Mining activities at the Albanian shoreline have been sources of heavy metals pollution (e.g., chromium, copper, cobalt, nickel as well as iron, etc.). The main sources of pollution in the Black Drin River in FYROM are considered to be: domestic sewage and solid waste; agriculture; mining activities throughout the watershed. There is no adequate information with regard to water quality in the part of the Drin River watershed extending to the Albanian side. The following are among the potential sources of pollution: disposal of solid waste; domestic sewage that is discharged untreated along the river; waste from mining and industrial activities. Inappropriate wastewater management results in pollutants entering the Shkoder/Skadar Lake and Buna/Bojana River system (Kozarov, 1960). Compared to the Shkoder/Skadar
26
Water quality trends on test areas – Rijeka 2016
Lake the nutrient levels in the Buna/Bojana River are elevated. Localized bacteriological contamination is also an issue. Wastes are dumped in a large number of uncontrolled disposal sites or even in the vicinity of watercourses that frequently wash the litter into larger streams and/or the Buna/Bojana river and the sea, and the situation is exacerbated by floods. The sources of toxic substances pollution lie mainly at the Montenegrin side: the Aluminum Plant in Podgorica. Pollutants associated with the operation of the plant include fluoride, phenols, SO2, NOx (emitted in the atmosphere), PCBs that had been stored under poor conditions, phenolic compounds, PAHs and mercury-containing wastes.
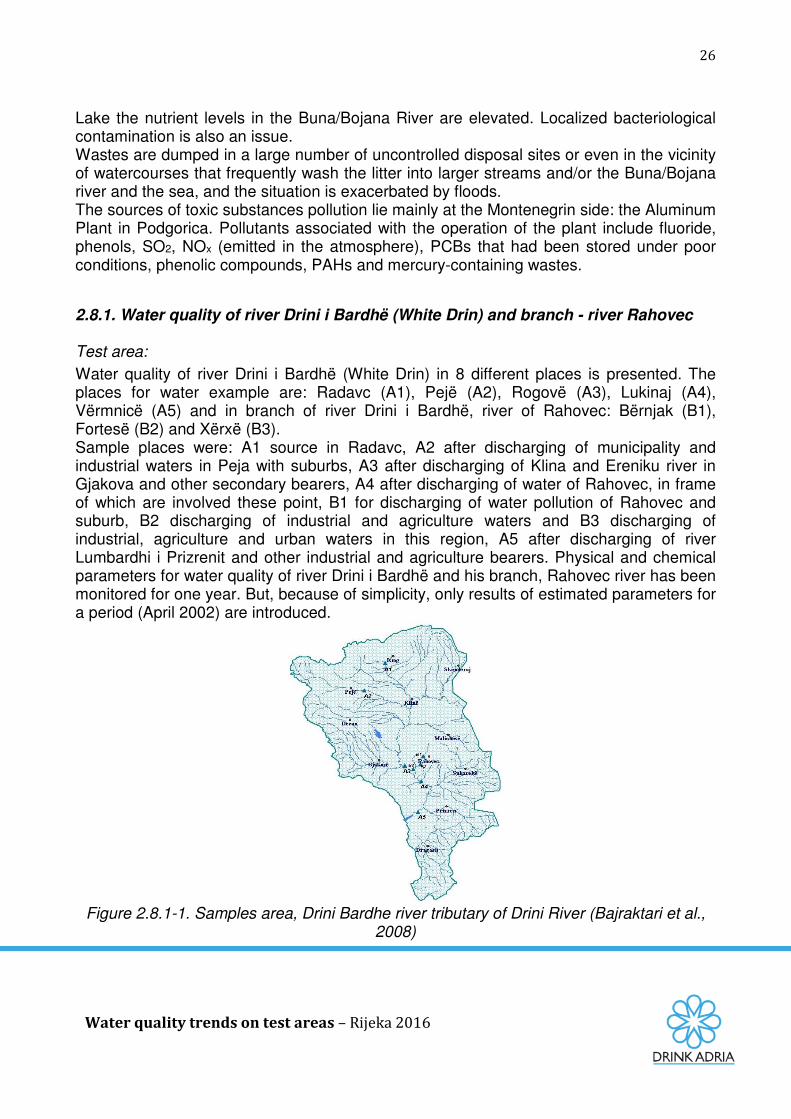
2.8.1. Water quality of river Drini i Bardhë (White Drin) and branch - river Rahovec Test area:
Water quality of river Drini i Bardhë (White Drin) in 8 different places is presented. The places for water example are: Radavc (A1), Pejë (A2), Rogovë (A3), Lukinaj (A4), Vërmnicë (A5) and in branch of river Drini i Bardhë, river of Rahovec: Bërnjak (B1), Fortesë (B2) and Xërxë (B3). Sample places were: A1 source in Radavc, A2 after discharging of municipality and industrial waters in Peja with suburbs, A3 after discharging of Klina and Ereniku river in Gjakova and other secondary bearers, A4 after discharging of water of Rahovec, in frame of which are involved these point, B1 for discharging of water pollution of Rahovec and suburb, B2 discharging of industrial and agriculture waters and B3 discharging of industrial, agriculture and urban waters in this region, A5 after discharging of river Lumbardhi i Prizrenit and other industrial and agriculture bearers. Physical and chemical parameters for water quality of river Drini i Bardhë and his branch, Rahovec river has been monitored for one year. But, because of simplicity, only results of estimated parameters for a period (April 2002) are introduced.
Figure 2.8.1-1. Samples area, Drini Bardhe river tributary of Drini River (Bajraktari et al.,
2008)
27
Water quality trends on test areas – Rijeka 2016
Problems:
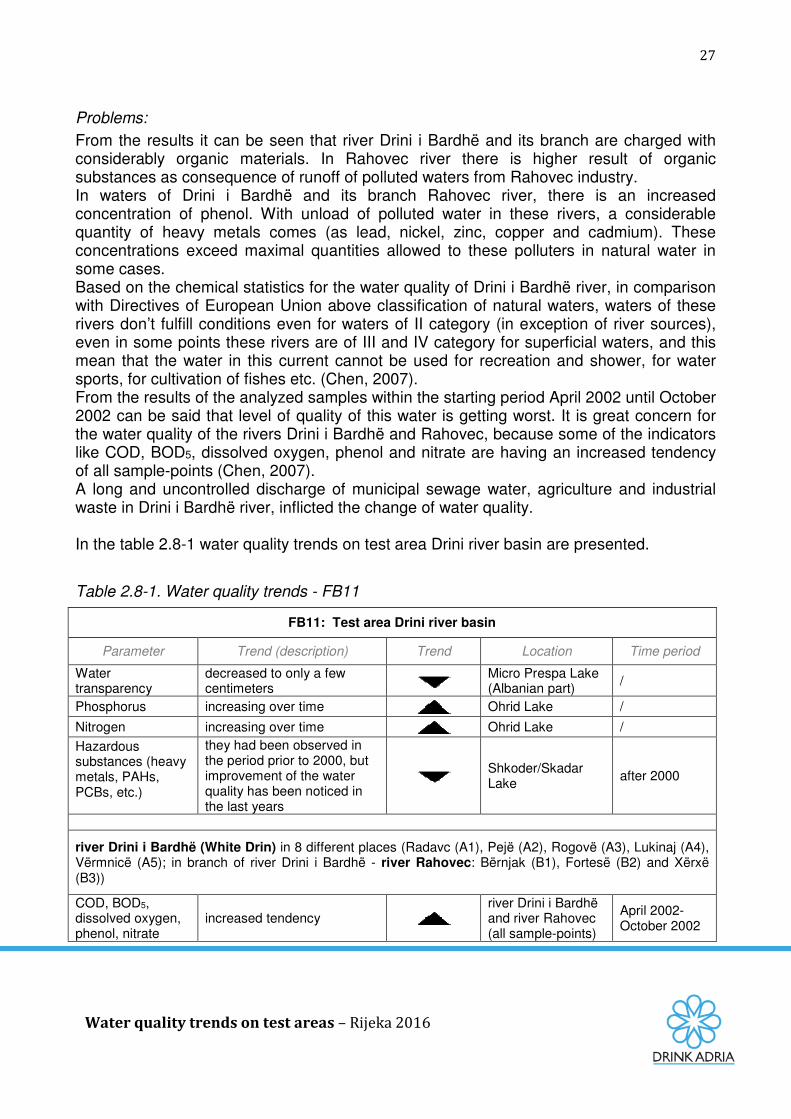
From the results it can be seen that river Drini i Bardhë and its branch are charged with considerably organic materials. In Rahovec river there is higher result of organic substances as consequence of runoff of polluted waters from Rahovec industry. In waters of Drini i Bardhë and its branch Rahovec river, there is an increased concentration of phenol. With unload of polluted water in these rivers, a considerable quantity of heavy metals comes (as lead, nickel, zinc, copper and cadmium). These concentrations exceed maximal quantities allowed to these polluters in natural water in some cases. Based on the chemical statistics for the water quality of Drini i Bardhë river, in comparison with Directives of European Union above classification of natural waters, waters of these rivers don’t fulfill conditions even for waters of II category (in exception of river sources), even in some points these rivers are of III and IV category for superficial waters, and this mean that the water in this current cannot be used for recreation and shower, for water sports, for cultivation of fishes etc. (Chen, 2007). From the results of the analyzed samples within the starting period April 2002 until October 2002 can be said that level of quality of this water is getting worst. It is great concern for the water quality of the rivers Drini i Bardhë and Rahovec, because some of the indicators like COD, BOD5, dissolved oxygen, phenol and nitrate are having an increased tendency of all sample-points (Chen, 2007). A long and uncontrolled discharge of municipal sewage water, agriculture and industrial waste in Drini i Bardhë river, inflicted the change of water quality. In the table 2.8-1 water quality trends on test area Drini river basin are presented.
Table 2.8-1. Water quality trends - FB11
FB11: Test area Drini river basin
Parameter Trend (description) Trend Location Time period
they had been observed in the period prior to 2000, but improvement of the water quality has been noticed in the last years
Shkoder/Skadar Lake
after 2000
river Drini i Bardhë (White Drin) in 8 different places (Radavc (A1), Pejë (A2), Rogovë (A3), Lukinaj (A4), Vërmnicë (A5); in branch of river Drini i Bardhë - river Rahovec: Bërnjak (B1), Fortesë (B2) and Xërxë (B3))
COD, BOD5, dissolved oxygen, phenol, nitrate
increased tendency river Drini i Bardhë and river Rahovec (all sample-points)
April 2002-October 2002
28
Water quality trends on test areas – Rijeka 2016
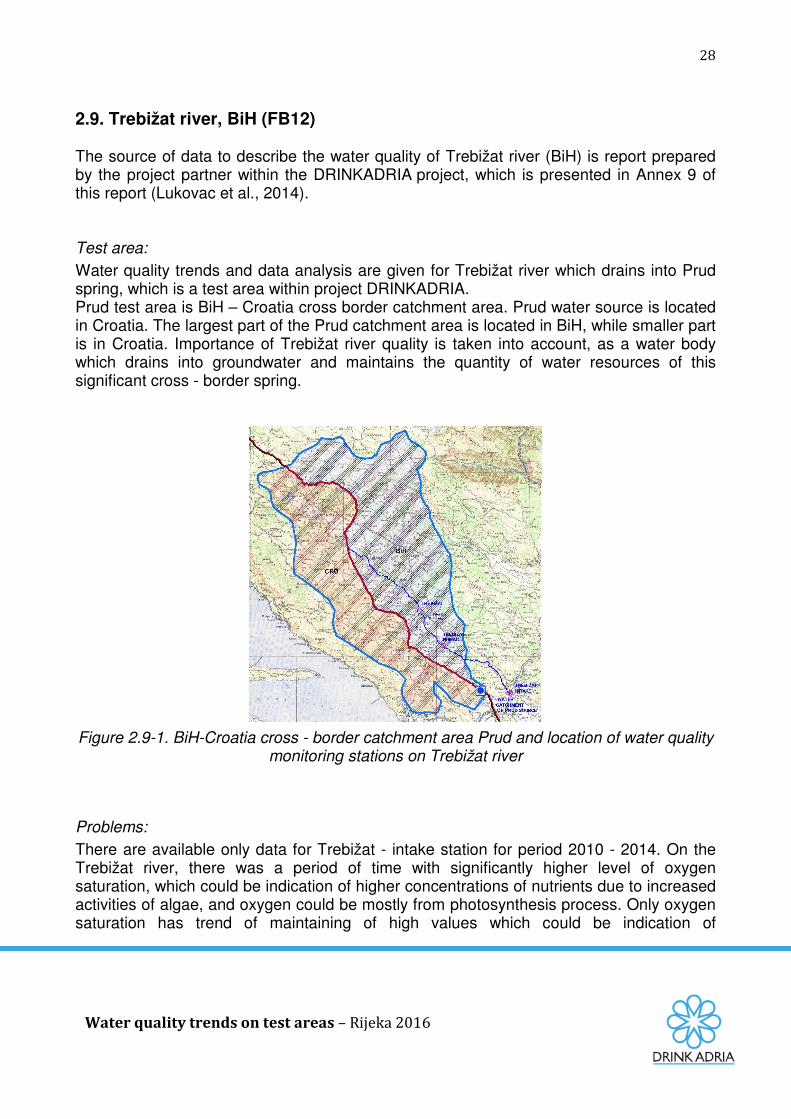
2.9. Trebižat river, BiH (FB12) The source of data to describe the water quality of Trebižat river (BiH) is report prepared by the project partner within the DRINKADRIA project, which is presented in Annex 9 of this report (Lukovac et al., 2014). Test area:
Water quality trends and data analysis are given for Trebižat river which drains into Prud spring, which is a test area within project DRINKADRIA. Prud test area is BiH – Croatia cross border catchment area. Prud water source is located in Croatia. The largest part of the Prud catchment area is located in BiH, while smaller part is in Croatia. Importance of Trebižat river quality is taken into account, as a water body which drains into groundwater and maintains the quantity of water resources of this significant cross - border spring.
Figure 2.9-1. BiH-Croatia cross - border catchment area Prud and location of water quality monitoring stations on Trebižat river
Problems:
There are available only data for Trebižat - intake station for period 2010 - 2014. On the Trebižat river, there was a period of time with significantly higher level of oxygen saturation, which could be indication of higher concentrations of nutrients due to increased activities of algae, and oxygen could be mostly from photosynthesis process. Only oxygen saturation has trend of maintaining of high values which could be indication of
29
Water quality trends on test areas – Rijeka 2016
eutrophication of water body. Nitrate content on the Trebižat river varies over time. Because this river is not deep, during the summer period it is expected to have quite higher conductivity, and according to that more nitrates as well. Microbiological contamination is present in Trebižat river down the whole stream, and a large range is between minimum and maximum values which is associated to the hydrological conditions in the river basin. High values could be associated with the occurrence of torrential waters and increased amounts of silt which is common in this area during periods of high waters or occasional flooding of the river basin area. Higher concentrations of total number of microorganisms and microorganisms of fecal origin including Escherichia Coli were detected almost constantly on intake monitoring station. The main source of these organisms can be untreated urban waste waters from settlements in the observed river basin area. In the period from 2010 – 2014 increased concentrations of copper and total chromium are measured which were above the Maximum Allowable Concentration (MAC) for surface water.
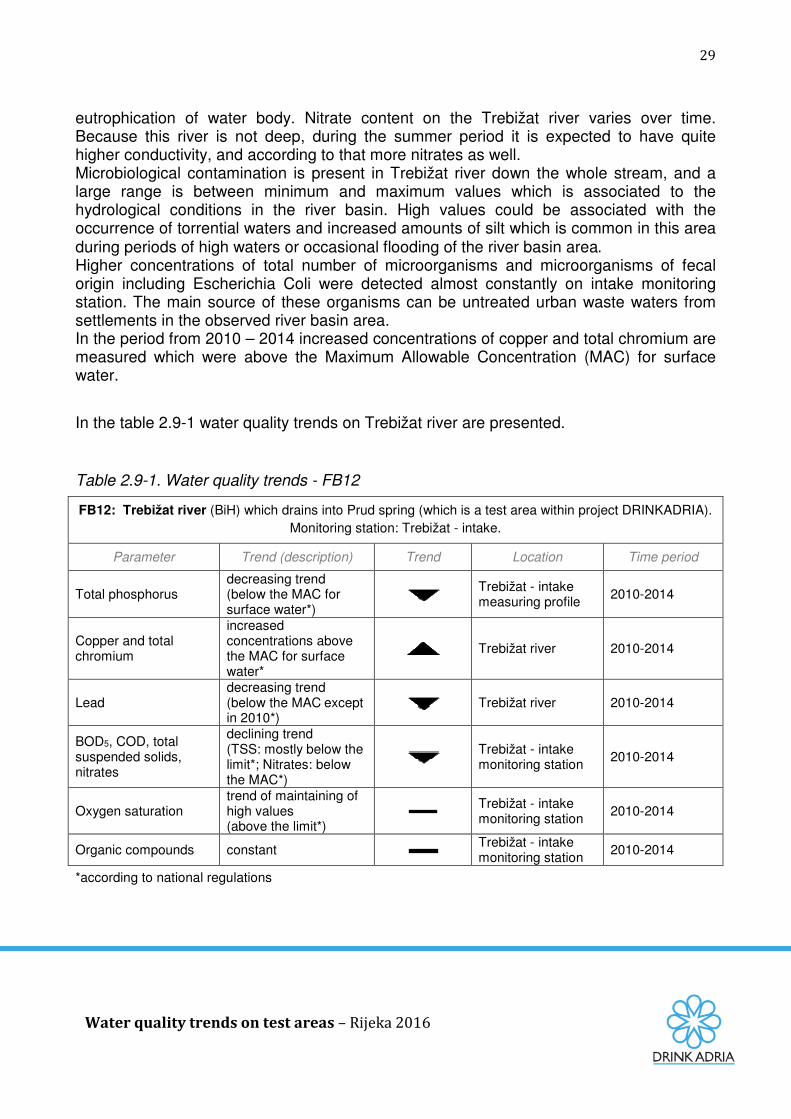
In the table 2.9-1 water quality trends on Trebižat river are presented. Table 2.9-1. Water quality trends - FB12
FB12: Trebižat river (BiH) which drains into Prud spring (which is a test area within project DRINKADRIA). Monitoring station: Trebižat - intake.
Parameter Trend (description) Trend Location Time period
Total phosphorus decreasing trend (below the MAC for surface water*)
Trebižat - intake measuring profile
2010-2014
Copper and total chromium
increased concentrations above the MAC for surface water*
Trebižat river 2010-2014
Lead decreasing trend (below the MAC except in 2010*)
Trebižat river 2010-2014
BOD5, COD, total suspended solids, nitrates
declining trend (TSS: mostly below the limit*; Nitrates: below the MAC*)
Trebižat - intake monitoring station
2010-2014
Oxygen saturation trend of maintaining of high values (above the limit*)
Trebižat - intake monitoring station 2010-2014
Organic compounds constant Trebižat - intake monitoring station 2010-2014
*according to national regulations
30
Water quality trends on test areas – Rijeka 2016
2.10. Test area of the city of Nikšić in Montenegro (FB14) The source of data to describe the water quality on test area of the city of Nikšić (Montenegro) is report prepared by the project partner within the DRINKADRIA project, which is presented in Annex 10 of this report (Papovic, 2015). Test area:
Water quality analysis regarding the test area of the city of Nikšić in Montenegro is given. It was prepared with reference to the springs Gornji Vidrovan, Donji Vidrovan and Poklonci, which are included in the water supply system of the city. Problems:
The water sources Gornji Vidrovan and Donji Vidrovan are capped karst springs very sensitive to changes in the hydrological regime. These two sources are connected to the water supply system throughout the whole year. In spring and autumn during high intensity rainfalls there is an increased turbidity and mild microbiological contamination. The spring Poklonci is an underground water source that is connected to the water supply system by the system of well bores, and it is included in the water supply system only during the dry season. Based on the current analysis, it can be concluded that water used for water supply in the test area in Nikšić has a good quality. Deviations of quality parameters (turbidity and mild microbiological contamination) from MAC occur only during heavy precipitation.
In the table 2.10-1 water quality trends on test area of the city of Nikšić are presented. Table 2.10-1. Water quality trends - FB14
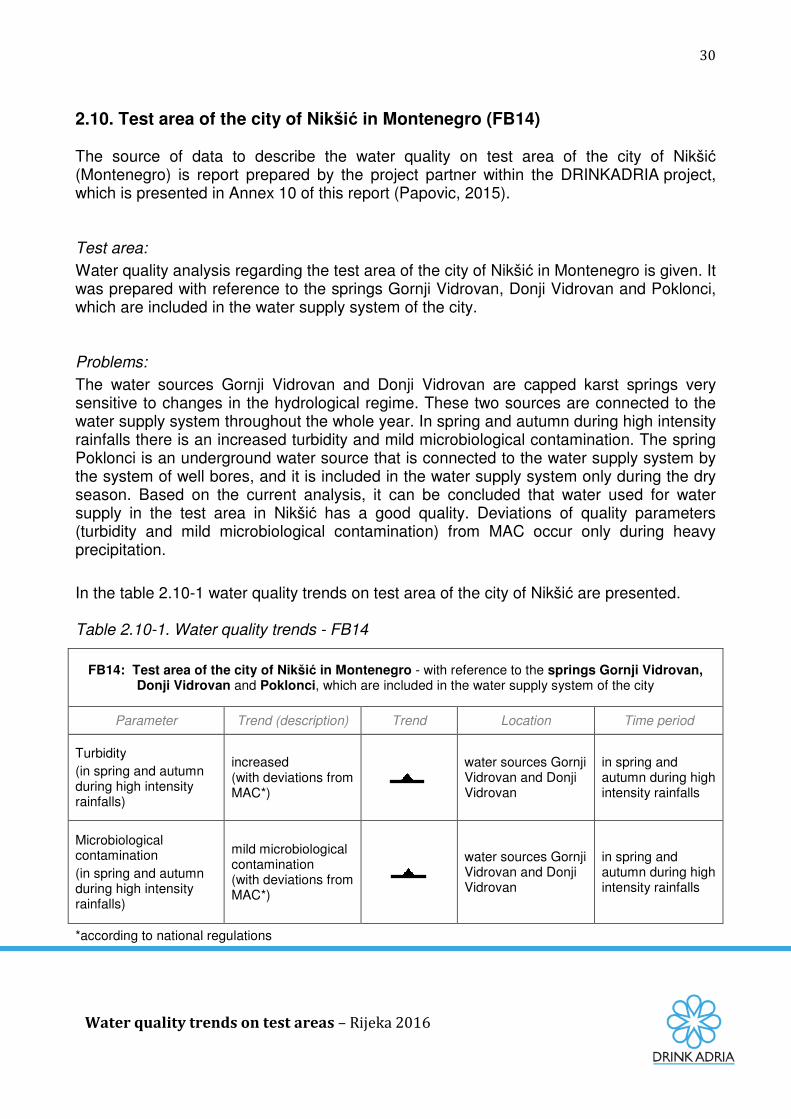
FB14: Test area of the city of Nikšić in Montenegro - with reference to the springs Gornji Vidrovan, Donji Vidrovan and Poklonci, which are included in the water supply system of the city
Parameter Trend (description) Trend Location Time period
Turbidity (in spring and autumn during high intensity rainfalls)
increased (with deviations from MAC*)
water sources Gornji Vidrovan and Donji Vidrovan
in spring and autumn during high intensity rainfalls
Microbiological contamination (in spring and autumn during high intensity rainfalls)
mild microbiological contamination (with deviations from MAC*)
water sources Gornji Vidrovan and Donji Vidrovan
in spring and autumn during high intensity rainfalls
*according to national regulations
31
Water quality trends on test areas – Rijeka 2016
2.11. Test area island of Corfu in Greece (FB16) The source of data to describe the water quality of test area island of Corfu (Greece) is report prepared by the project partner within the DRINKADRIA project, which is presented in Annex 11 of this report (Kanakoudis et al., 2015). Test area:
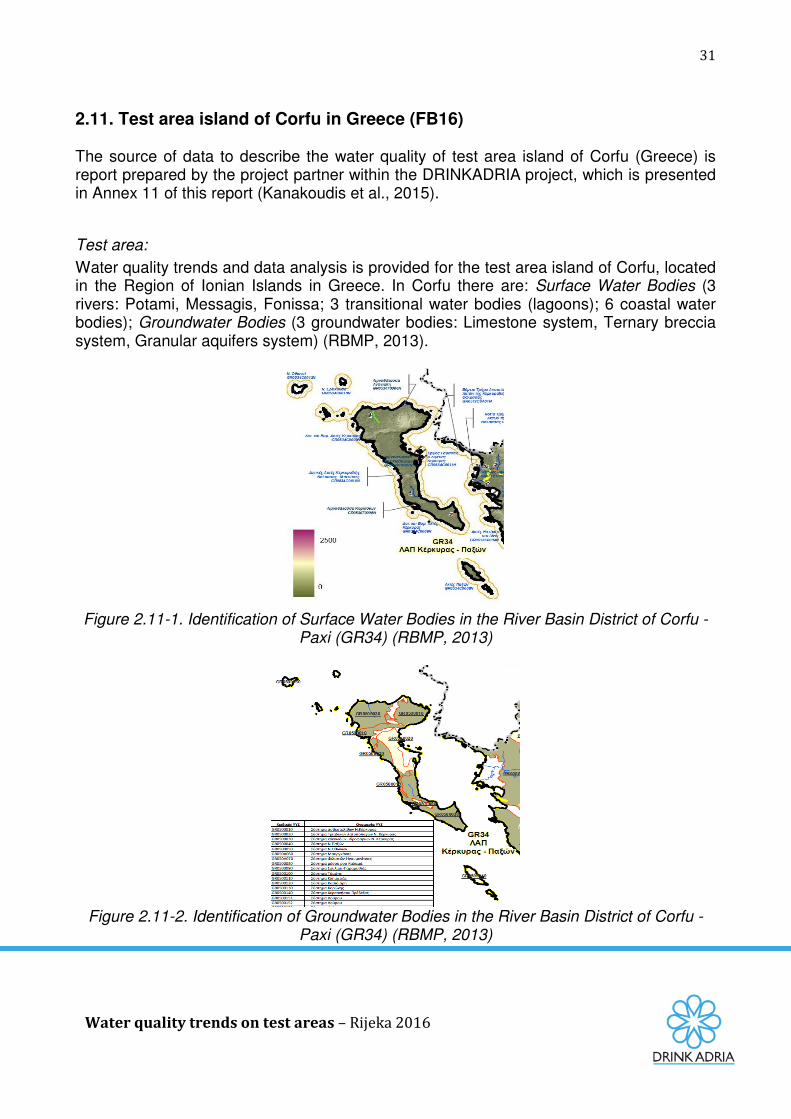
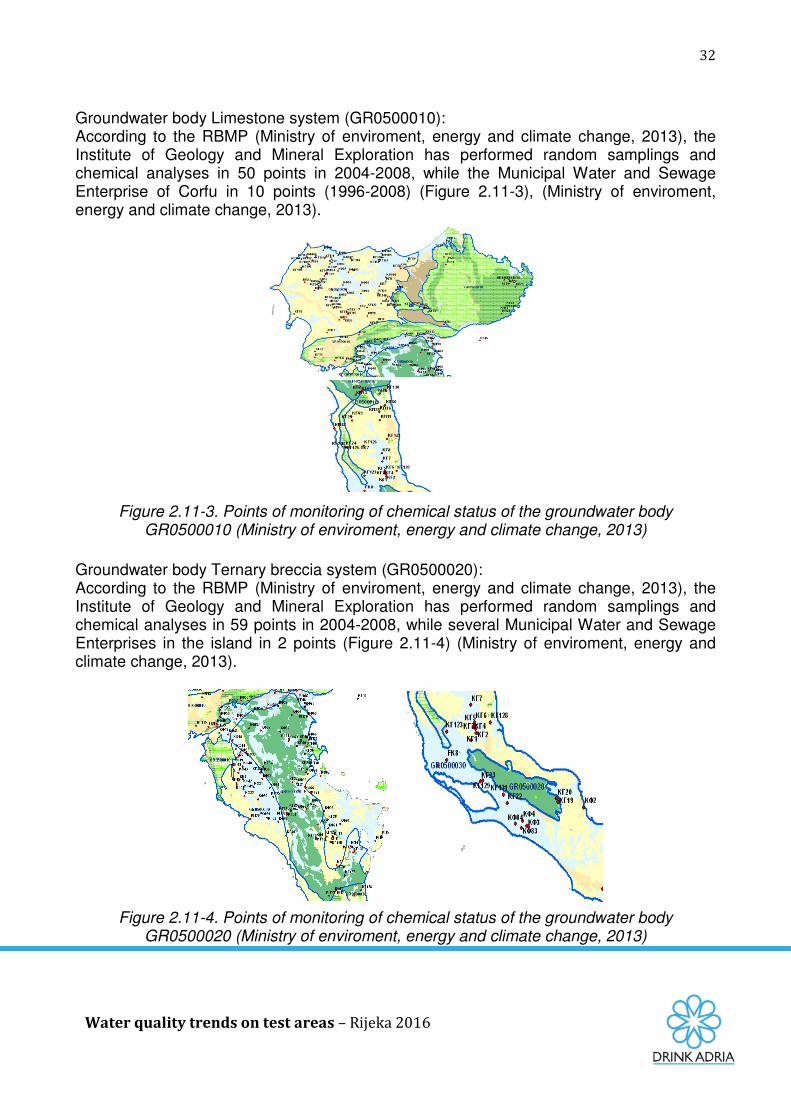
Water quality trends and data analysis is provided for the test area island of Corfu, located in the Region of Ionian Islands in Greece. In Corfu there are: Surface Water Bodies (3 rivers: Potami, Messagis, Fonissa; 3 transitional water bodies (lagoons); 6 coastal water bodies); Groundwater Bodies (3 groundwater bodies: Limestone system, Ternary breccia system, Granular aquifers system) (RBMP, 2013).
Figure 2.11-1. Identification of Surface Water Bodies in the River Basin District of Corfu -
Paxi (GR34) (RBMP, 2013)
Figure 2.11-2. Identification of Groundwater Bodies in the River Basin District of Corfu -
Paxi (GR34) (RBMP, 2013)
32
Water quality trends on test areas – Rijeka 2016
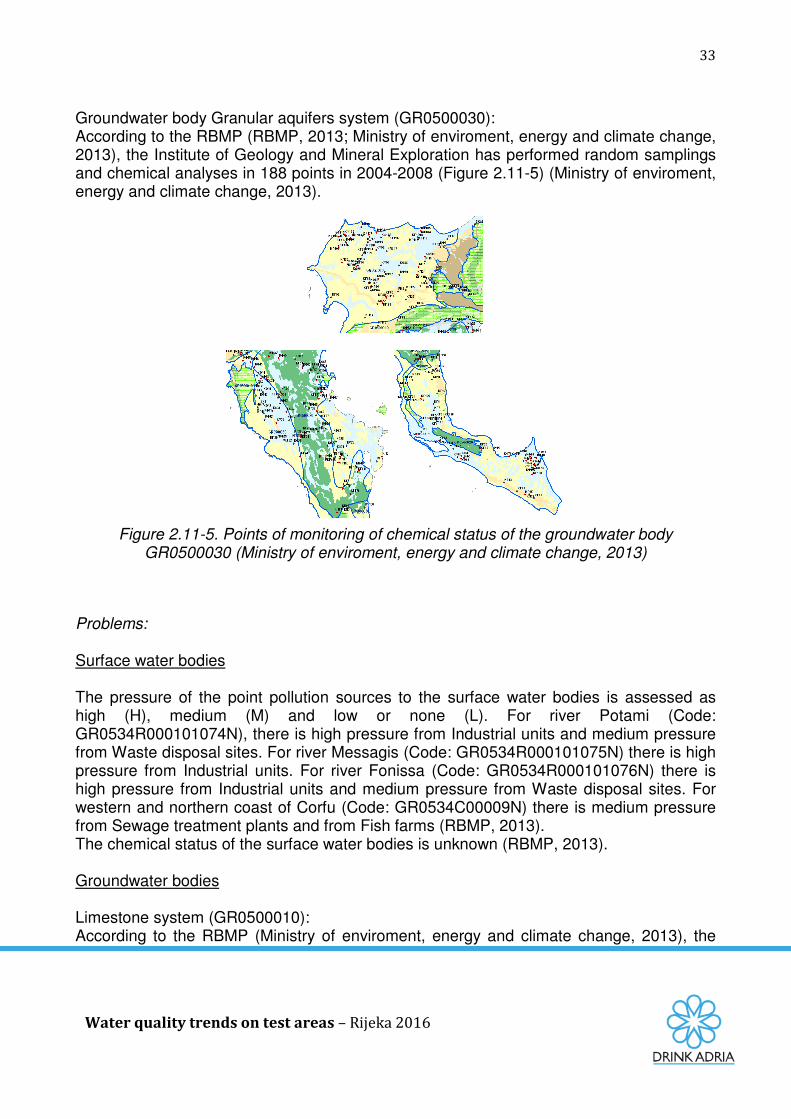
Groundwater body Limestone system (GR0500010): According to the RBMP (Ministry of enviroment, energy and climate change, 2013), the Institute of Geology and Mineral Exploration has performed random samplings and chemical analyses in 50 points in 2004-2008, while the Municipal Water and Sewage Enterprise of Corfu in 10 points (1996-2008) (Figure 2.11-3), (Ministry of enviroment, energy and climate change, 2013).
Figure 2.11-3. Points of monitoring of chemical status of the groundwater body GR0500010 (Ministry of enviroment, energy and climate change, 2013)
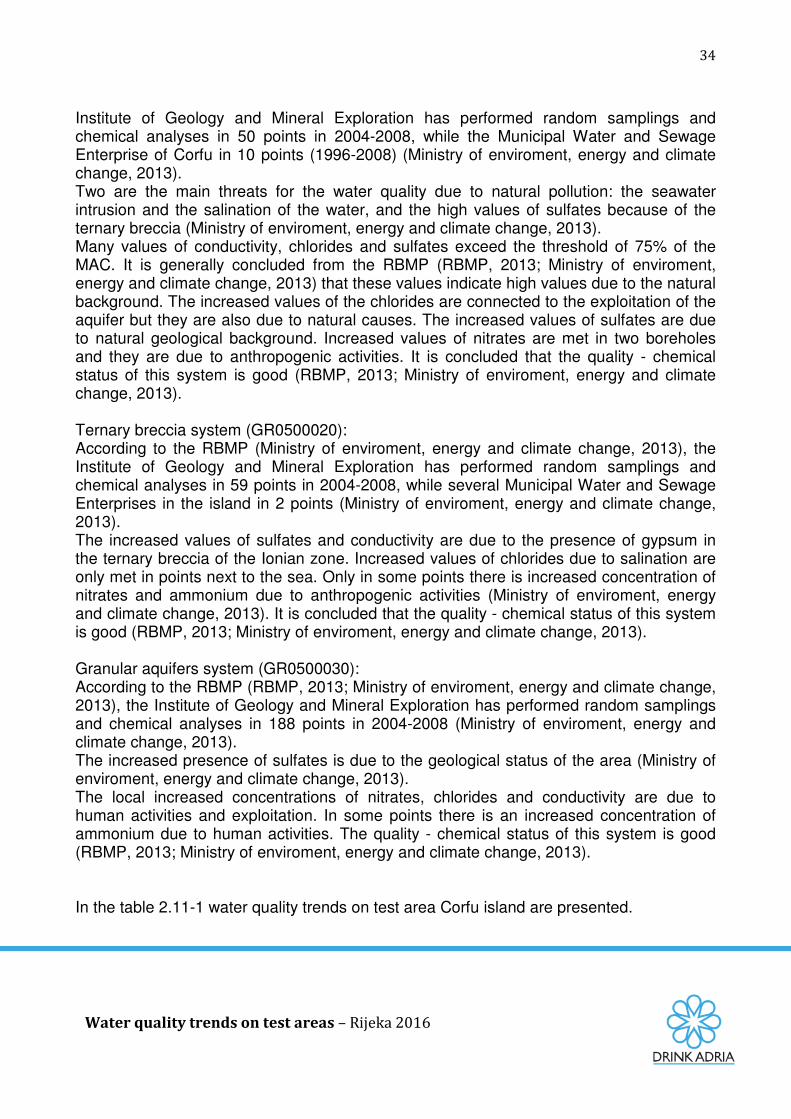
Groundwater body Ternary breccia system (GR0500020): According to the RBMP (Ministry of enviroment, energy and climate change, 2013), the Institute of Geology and Mineral Exploration has performed random samplings and chemical analyses in 59 points in 2004-2008, while several Municipal Water and Sewage Enterprises in the island in 2 points (Figure 2.11-4) (Ministry of enviroment, energy and climate change, 2013).
Figure 2.11-4. Points of monitoring of chemical status of the groundwater body
GR0500020 (Ministry of enviroment, energy and climate change, 2013)
33
Water quality trends on test areas – Rijeka 2016
Groundwater body Granular aquifers system (GR0500030): According to the RBMP (RBMP, 2013; Ministry of enviroment, energy and climate change, 2013), the Institute of Geology and Mineral Exploration has performed random samplings and chemical analyses in 188 points in 2004-2008 (Figure 2.11-5) (Ministry of enviroment, energy and climate change, 2013).
Figure 2.11-5. Points of monitoring of chemical status of the groundwater body
GR0500030 (Ministry of enviroment, energy and climate change, 2013)
Problems: Surface water bodies The pressure of the point pollution sources to the surface water bodies is assessed as high (H), medium (M) and low or none (L). For river Potami (Code: GR0534R000101074N), there is high pressure from Industrial units and medium pressure from Waste disposal sites. For river Messagis (Code: GR0534R000101075N) there is high pressure from Industrial units. For river Fonissa (Code: GR0534R000101076N) there is high pressure from Industrial units and medium pressure from Waste disposal sites. For western and northern coast of Corfu (Code: GR0534C00009N) there is medium pressure from Sewage treatment plants and from Fish farms (RBMP, 2013). The chemical status of the surface water bodies is unknown (RBMP, 2013). Groundwater bodies Limestone system (GR0500010): According to the RBMP (Ministry of enviroment, energy and climate change, 2013), the
34
Water quality trends on test areas – Rijeka 2016
Institute of Geology and Mineral Exploration has performed random samplings and chemical analyses in 50 points in 2004-2008, while the Municipal Water and Sewage Enterprise of Corfu in 10 points (1996-2008) (Ministry of enviroment, energy and climate change, 2013). Two are the main threats for the water quality due to natural pollution: the seawater intrusion and the salination of the water, and the high values of sulfates because of the ternary breccia (Ministry of enviroment, energy and climate change, 2013). Many values of conductivity, chlorides and sulfates exceed the threshold of 75% of the MAC. It is generally concluded from the RBMP (RBMP, 2013; Ministry of enviroment, energy and climate change, 2013) that these values indicate high values due to the natural background. The increased values of the chlorides are connected to the exploitation of the aquifer but they are also due to natural causes. The increased values of sulfates are due to natural geological background. Increased values of nitrates are met in two boreholes and they are due to anthropogenic activities. It is concluded that the quality - chemical status of this system is good (RBMP, 2013; Ministry of enviroment, energy and climate change, 2013). Ternary breccia system (GR0500020): According to the RBMP (Ministry of enviroment, energy and climate change, 2013), the Institute of Geology and Mineral Exploration has performed random samplings and chemical analyses in 59 points in 2004-2008, while several Municipal Water and Sewage Enterprises in the island in 2 points (Ministry of enviroment, energy and climate change, 2013). The increased values of sulfates and conductivity are due to the presence of gypsum in the ternary breccia of the Ionian zone. Increased values of chlorides due to salination are only met in points next to the sea. Only in some points there is increased concentration of nitrates and ammonium due to anthropogenic activities (Ministry of enviroment, energy and climate change, 2013). It is concluded that the quality - chemical status of this system is good (RBMP, 2013; Ministry of enviroment, energy and climate change, 2013). Granular aquifers system (GR0500030): According to the RBMP (RBMP, 2013; Ministry of enviroment, energy and climate change, 2013), the Institute of Geology and Mineral Exploration has performed random samplings and chemical analyses in 188 points in 2004-2008 (Ministry of enviroment, energy and climate change, 2013). The increased presence of sulfates is due to the geological status of the area (Ministry of enviroment, energy and climate change, 2013). The local increased concentrations of nitrates, chlorides and conductivity are due to human activities and exploitation. In some points there is an increased concentration of ammonium due to human activities. The quality - chemical status of this system is good (RBMP, 2013; Ministry of enviroment, energy and climate change, 2013). In the table 2.11-1 water quality trends on test area Corfu island are presented.
35
Water quality trends on test areas – Rijeka 2016
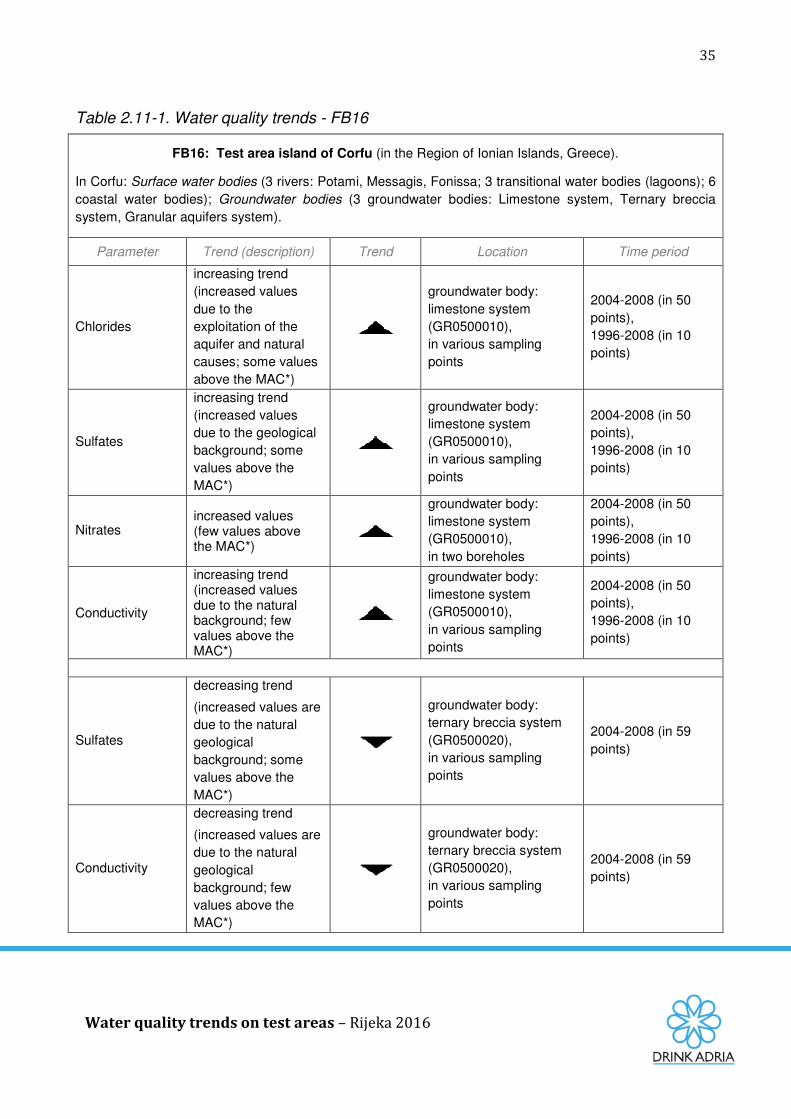
Table 2.11-1. Water quality trends - FB16
FB16: Test area island of Corfu (in the Region of Ionian Islands, Greece).
In Corfu: Surface water bodies (3 rivers: Potami, Messagis, Fonissa; 3 transitional water bodies (lagoons); 6 coastal water bodies); Groundwater bodies (3 groundwater bodies: Limestone system, Ternary breccia system, Granular aquifers system).
Parameter Trend (description) Trend Location Time period
Chlorides
increasing trend (increased values due to the exploitation of the aquifer and natural causes; some values above the MAC*)
groundwater body: limestone system (GR0500010), in various sampling points
2004-2008 (in 50 points), 1996-2008 (in 10 points)
Sulfates
increasing trend (increased values due to the geological background; some values above the MAC*)
groundwater body: limestone system (GR0500010), in various sampling points
2004-2008 (in 50 points), 1996-2008 (in 10 points)
Nitrates increased values (few values above the MAC*)
groundwater body: limestone system (GR0500010), in two boreholes
2004-2008 (in 50 points), 1996-2008 (in 10 points)
Conductivity
increasing trend (increased values due to the natural background; few values above the MAC*)
groundwater body: limestone system (GR0500010), in various sampling points
2004-2008 (in 50 points), 1996-2008 (in 10 points)
Sulfates
decreasing trend
(increased values are due to the natural geological background; some values above the MAC*)
groundwater body: ternary breccia system (GR0500020), in various sampling points
2004-2008 (in 59 points)
Conductivity
decreasing trend
(increased values are due to the natural geological background; few values above the MAC*)
groundwater body: ternary breccia system (GR0500020), in various sampling points
2004-2008 (in 59 points)
36
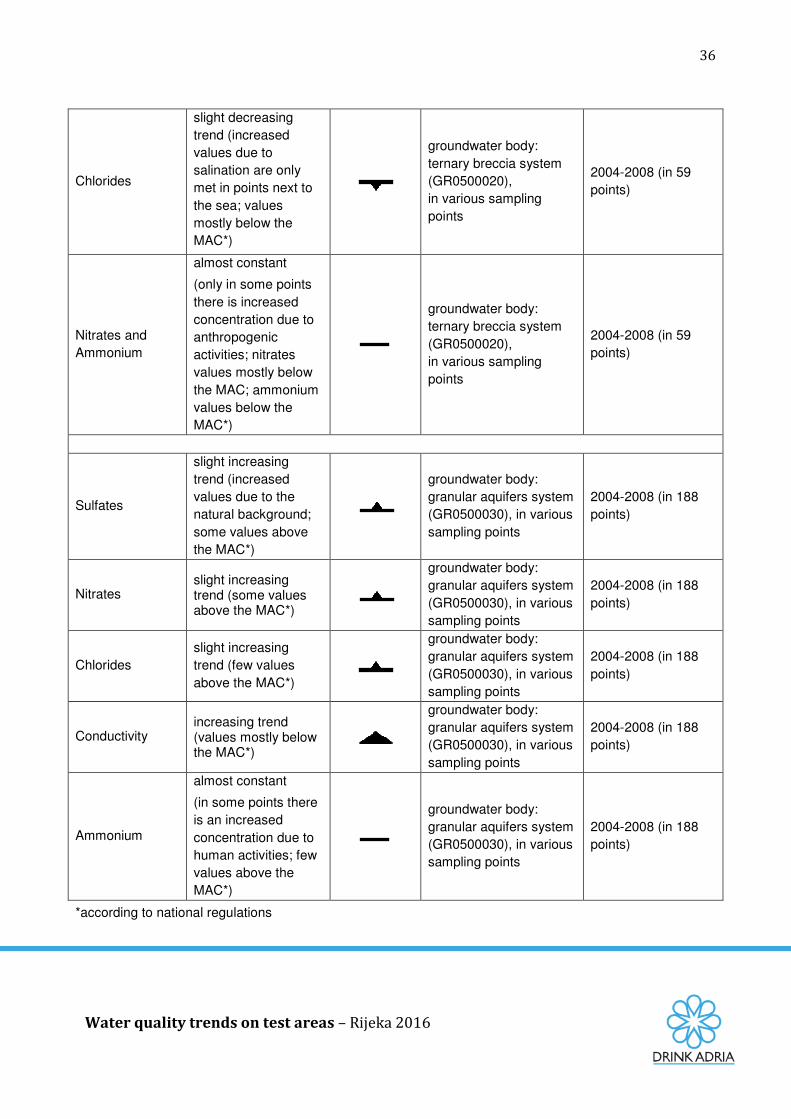
Water quality trends on test areas – Rijeka 2016
Chlorides
slight decreasing trend (increased values due to salination are only met in points next to the sea; values mostly below the MAC*)
groundwater body: ternary breccia system (GR0500020), in various sampling points
2004-2008 (in 59 points)
Nitrates and Ammonium
almost constant
(only in some points there is increased concentration due to anthropogenic activities; nitrates values mostly below the MAC; ammonium values below the MAC*)
groundwater body: ternary breccia system (GR0500020), in various sampling points
2004-2008 (in 59 points)
Sulfates
slight increasing trend (increased values due to the natural background; some values above the MAC*)
groundwater body: granular aquifers system (GR0500030), in various sampling points
2004-2008 (in 188 points)
Nitrates slight increasing trend (some values above the MAC*)
groundwater body: granular aquifers system (GR0500030), in various sampling points
2004-2008 (in 188 points)
Chlorides slight increasing trend (few values above the MAC*)
groundwater body: granular aquifers system (GR0500030), in various sampling points
2004-2008 (in 188 points)
Conductivity increasing trend (values mostly below the MAC*)
groundwater body: granular aquifers system (GR0500030), in various sampling points
2004-2008 (in 188 points)
Ammonium
almost constant
(in some points there is an increased concentration due to human activities; few values above the MAC*)
groundwater body: granular aquifers system (GR0500030), in various sampling points
2004-2008 (in 188 points)
*according to national regulations
37
Water quality trends on test areas – Rijeka 2016
3. CONCLUSION
Based on collected reports about water quality trends on test areas it can be concluded that six partners (LP, FB2, FB3, FB5, FB9, FB16) have prepared the trends for groundwater quality, five partners (FB2, FB5, FB10, FB11, FB12) have prepared the trends for quality of surface waters (lakes, rivers), and four partners (FB2, FB8, FB9, FB14) have prepared the trends for quality of spring waters. Different parameters have been analyzed on each test area. If the trends for certain parameters are compared for test areas where groundwater quality was analyzed, following results are obtained. In three test areas (Isonzo Plain, ATO 3 test area, Corfu island) increasing trend of nitrates was observed in certain points, and in ATO 3 test area and Corfu some values were above the limit. In two test areas (Isonzo Plain, ATO 3 test area) there is both increase and decrease of nitrates, depending on analyzed wells. Decreasing trend of nitrates was observed in test area Blatsko polje, and in Slovenian test area observed values were low. Regarding the chlorides, trends are mostly slightly decreasing (Isonzo Plain, Blatsko polje, one groundwater body in Corfu) or the concentrations are relatively low (Slovenian test area), although there is an increasing trend in two groundwater bodies in Corfu with some values above the limit. It is important to note that in Ostuni test area in Italy there is an increase of groundwater salinization due to groundwater over-abstraction and seawater intrusion. There was a slight increasing trend of sulphates observed in two test areas in certain points (Isonzo Plain and Corfu island), while in Corfu some values were above the limit. In Slovenian test area sulphates concentrations were relatively low. Only for two test areas data about microorganisms trends was given, showing that none of them were present (in Isonzo Plain and Slovenian test area). If the trends for certain parameters are compared for test areas where surface water quality was analyzed, following results are obtained. Slight increasing trends of biochemical oxygen demand (BOD) were observed in two areas (in Serbian rivers Veliki Rzav, Mali Rzav, Ljubišnica and Katušnica, and Albanian rivers White Drin and Rahovec). On the other hand, trend of slight decrease was observed in three areas (in Slovenian rivers Nadiža and Soča, Serbian river Prištevica and river Trebižat in BiH). Nitrogen has been increasing over time in Ohrid Lake. Nitrates had slight increasing trend in two areas (in Serbian rivers Veliki Rzav, Ljubišnica, Katušnica and Prištevica, and Albanian rivers White Drin and Rahovec). There is also a decreasing trend of nitrates in Trebižat river, and a slight decreasing trend in Mali Rzav river, both below the limit. In rivers Nadiža and Soča (Slovenian test area), concentrations of nitrogen compounds (NO2-, NO4+) were below detection limit. In Trebižat river, there was a trend of maintaining of high values of oxygen saturation above the limit, and also in rivers White Drin and Rahovec there was an increased tendency of dissolved oxygen.
38
Water quality trends on test areas – Rijeka 2016
In some test areas specific trends occur, eg. in Trebižat river, increased concentrations of copper and total chromium (above the MAC for surface water) were observed. In Ohrid lake increasing phosphorus was observed. In Micro Prespa Lake (Albanian part) water transparency is decreased to only a few centimeters, and in Castreccioni lake in Italy there is an increasing concentration of algae. If the trends for certain parameters are compared for test areas where water quality of springs was analyzed, following results are obtained. Nitrates have a decreasing trend in two test areas (in Northern Istria and Prud spring), and in ATO 3 test area low values of nitrates were observed. Information about organic compounds trends was given for two test areas, showing that they were not detected (in ATO 3 test area and in Northern Istria). On certain test areas specific trends occur - on water sources Gornji Vidrovan and Donji Vidrovan (Montenegro) there is increased turbidity and mild microbiological contamination in spring and autumn during high intensity rainfalls, with deviations from MAC. On test area in Northern Istria (Croatia) increasing trend of mean annual values of total suspended solids (TSS) was observed on all analyzed springs, although the content of TSS depends on the amount of rainfall. Also slightly increasing trend of BOD5 was observed on spring Bulaž.
Some data about problems with water quality was not given in the form of trends. Therefore, an overview of the problems on each test area is given in the table 3-1. Table 3-1. Problems related to water quality on test areas
Project partner and test area Problems
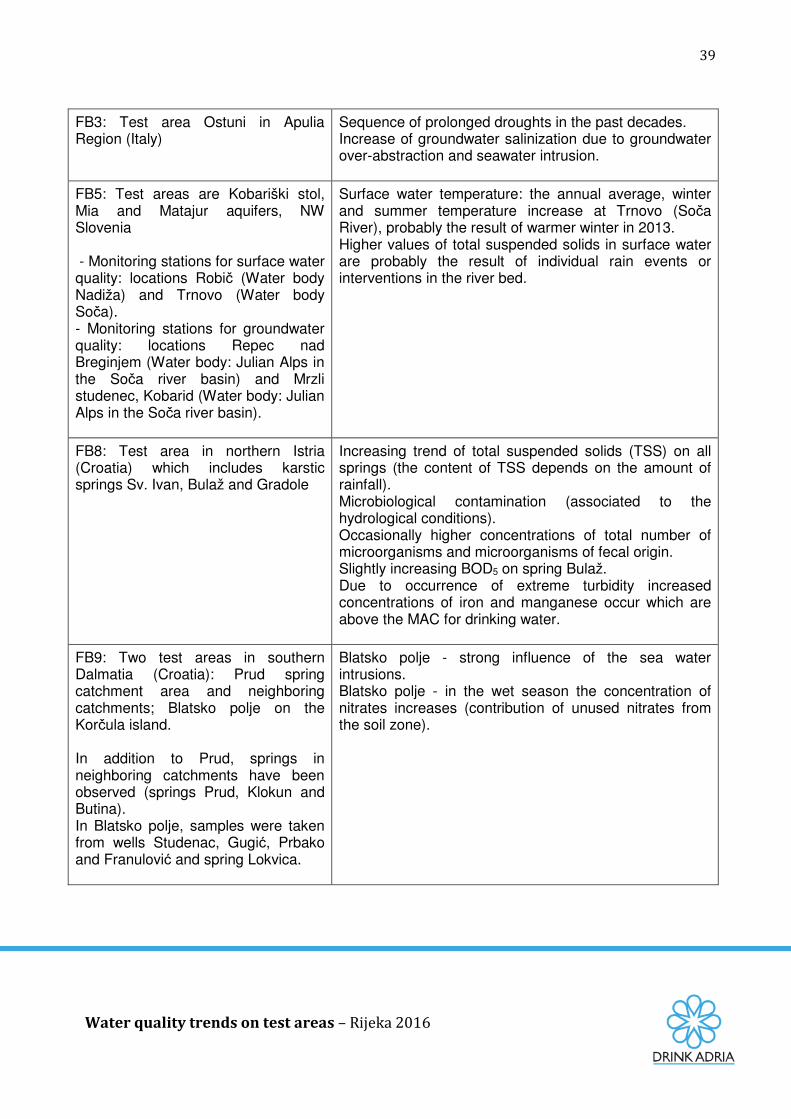
LP: Test area Isonzo Plain (Italy) - 13 pumping wells exploited by AcegasApsAmga company and La Risaia well
Nitrates slightly increasing (well 2) but below the legal limit. Sulphates slightly increasing (wells 2 and La Risaia) but below the legal limit. High chloride values (wells 2 and 6) but below the legal limit.
FB2: ATO 3 test area in Marche Region (Italy) - most important water resources used in water supply systems of ATO3 Area and additional natural resources which can be included in such supply systems in cases of need
Contamination mainly due to nitrates (agriculture). Increasing trend of nitrates in several well fields in Potenza and Chienti riverbed aquifers. In the valley areas (wells) nitrates often exceed the limit of 50 mg/l. Spring water (mostly in the mountains) - frequent bacteriological contamination. Intense exploitation of wells next to the sea has produced saline ingression. Contamination from industrial activity (Tetrachloroethylene, Trichloroethane). Eutrophic phenomena (toxic Planktothrix rubescens cells) in Castreccioni lake.
39
Water quality trends on test areas – Rijeka 2016
FB3: Test area Ostuni in Apulia Region (Italy)
Sequence of prolonged droughts in the past decades. Increase of groundwater salinization due to groundwater over-abstraction and seawater intrusion.
FB5: Test areas are Kobariški stol, Mia and Matajur aquifers, NW Slovenia - Monitoring stations for surface water quality: locations Robič (Water body Nadiža) and Trnovo (Water body Soča). - Monitoring stations for groundwater quality: locations Repec nad Breginjem (Water body: Julian Alps in the Soča river basin) and Mrzli studenec, Kobarid (Water body: Julian Alps in the Soča river basin).
Surface water temperature: the annual average, winter and summer temperature increase at Trnovo (Soča River), probably the result of warmer winter in 2013. Higher values of total suspended solids in surface water are probably the result of individual rain events or interventions in the river bed.
FB8: Test area in northern Istria (Croatia) which includes karstic springs Sv. Ivan, Bulaž and Gradole
Increasing trend of total suspended solids (TSS) on all springs (the content of TSS depends on the amount of rainfall). Microbiological contamination (associated to the hydrological conditions). Occasionally higher concentrations of total number of microorganisms and microorganisms of fecal origin. Slightly increasing BOD5 on spring Bulaž. Due to occurrence of extreme turbidity increased concentrations of iron and manganese occur which are above the MAC for drinking water.
FB9: Two test areas in southern Dalmatia (Croatia): Prud spring catchment area and neighboring catchments; Blatsko polje on the Korčula island. In addition to Prud, springs in neighboring catchments have been observed (springs Prud, Klokun and Butina). In Blatsko polje, samples were taken from wells Studenac, Gugić, Prbako and Franulović and spring Lokvica.
Blatsko polje - strong influence of the sea water intrusions. Blatsko polje - in the wet season the concentration of nitrates increases (contribution of unused nitrates from the soil zone).
40
Water quality trends on test areas – Rijeka 2016
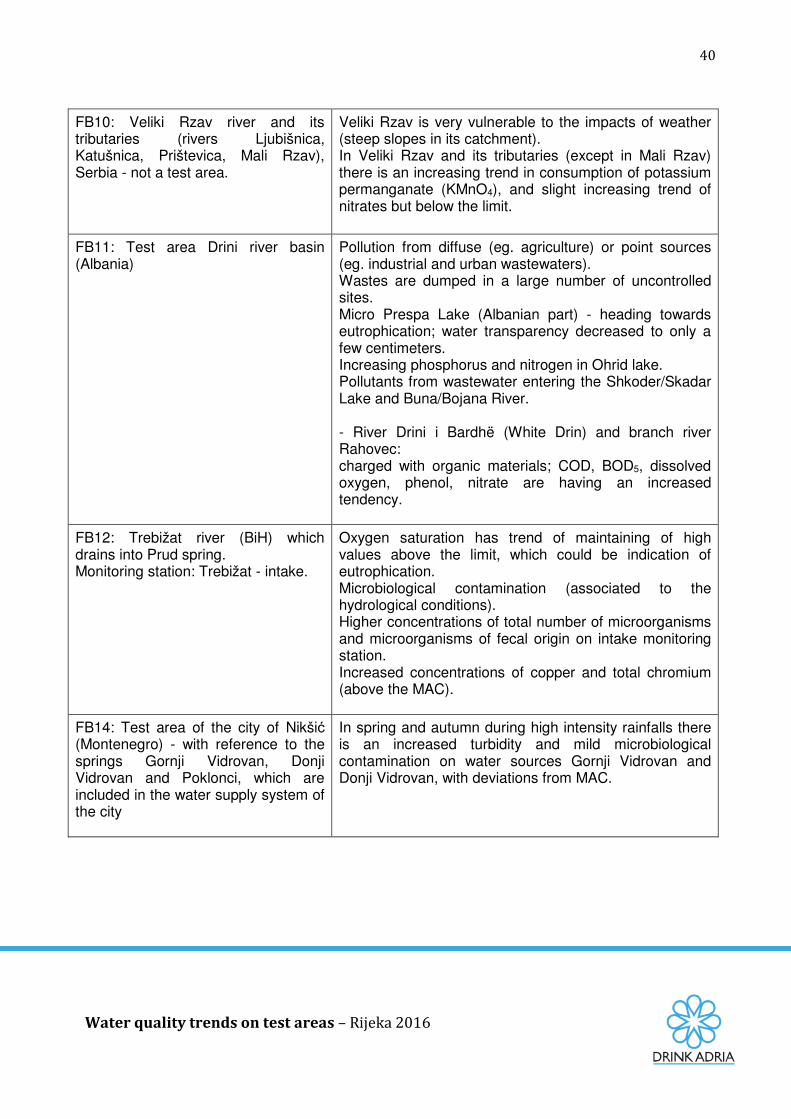
FB10: Veliki Rzav river and its tributaries (rivers Ljubišnica, Katušnica, Prištevica, Mali Rzav), Serbia - not a test area.
Veliki Rzav is very vulnerable to the impacts of weather (steep slopes in its catchment). In Veliki Rzav and its tributaries (except in Mali Rzav) there is an increasing trend in consumption of potassium permanganate (KMnO4), and slight increasing trend of nitrates but below the limit.
FB11: Test area Drini river basin (Albania)
Pollution from diffuse (eg. agriculture) or point sources (eg. industrial and urban wastewaters). Wastes are dumped in a large number of uncontrolled sites. Micro Prespa Lake (Albanian part) - heading towards eutrophication; water transparency decreased to only a few centimeters. Increasing phosphorus and nitrogen in Ohrid lake. Pollutants from wastewater entering the Shkoder/Skadar Lake and Buna/Bojana River. - River Drini i Bardhë (White Drin) and branch river Rahovec: charged with organic materials; COD, BOD5, dissolved oxygen, phenol, nitrate are having an increased tendency.
FB12: Trebižat river (BiH) which drains into Prud spring. Monitoring station: Trebižat - intake.
Oxygen saturation has trend of maintaining of high values above the limit, which could be indication of eutrophication. Microbiological contamination (associated to the hydrological conditions). Higher concentrations of total number of microorganisms and microorganisms of fecal origin on intake monitoring station. Increased concentrations of copper and total chromium (above the MAC).
FB14: Test area of the city of Nikšić (Montenegro) - with reference to the springs Gornji Vidrovan, Donji Vidrovan and Poklonci, which are included in the water supply system of the city
In spring and autumn during high intensity rainfalls there is an increased turbidity and mild microbiological contamination on water sources Gornji Vidrovan and Donji Vidrovan, with deviations from MAC.
41
Water quality trends on test areas – Rijeka 2016
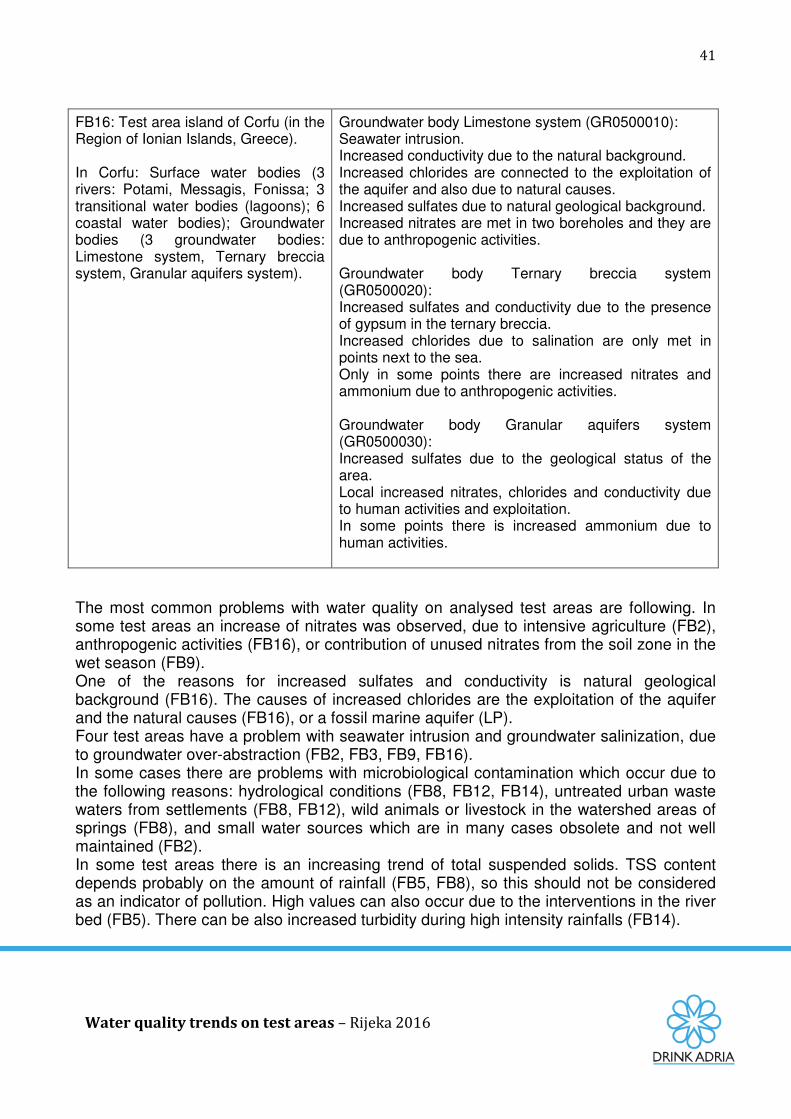
FB16: Test area island of Corfu (in the Region of Ionian Islands, Greece). In Corfu: Surface water bodies (3 rivers: Potami, Messagis, Fonissa; 3 transitional water bodies (lagoons); 6 coastal water bodies); Groundwater bodies (3 groundwater bodies: Limestone system, Ternary breccia system, Granular aquifers system).
Groundwater body Limestone system (GR0500010): Seawater intrusion. Increased conductivity due to the natural background. Increased chlorides are connected to the exploitation of the aquifer and also due to natural causes. Increased sulfates due to natural geological background. Increased nitrates are met in two boreholes and they are due to anthropogenic activities. Groundwater body Ternary breccia system (GR0500020): Increased sulfates and conductivity due to the presence of gypsum in the ternary breccia. Increased chlorides due to salination are only met in points next to the sea. Only in some points there are increased nitrates and ammonium due to anthropogenic activities. Groundwater body Granular aquifers system (GR0500030): Increased sulfates due to the geological status of the area. Local increased nitrates, chlorides and conductivity due to human activities and exploitation. In some points there is increased ammonium due to human activities.
The most common problems with water quality on analysed test areas are following. In some test areas an increase of nitrates was observed, due to intensive agriculture (FB2), anthropogenic activities (FB16), or contribution of unused nitrates from the soil zone in the wet season (FB9). One of the reasons for increased sulfates and conductivity is natural geological background (FB16). The causes of increased chlorides are the exploitation of the aquifer and the natural causes (FB16), or a fossil marine aquifer (LP). Four test areas have a problem with seawater intrusion and groundwater salinization, due to groundwater over-abstraction (FB2, FB3, FB9, FB16). In some cases there are problems with microbiological contamination which occur due to the following reasons: hydrological conditions (FB8, FB12, FB14), untreated urban waste waters from settlements (FB8, FB12), wild animals or livestock in the watershed areas of springs (FB8), and small water sources which are in many cases obsolete and not well maintained (FB2). In some test areas there is an increasing trend of total suspended solids. TSS content depends probably on the amount of rainfall (FB5, FB8), so this should not be considered as an indicator of pollution. High values can also occur due to the interventions in the river bed (FB5). There can be also increased turbidity during high intensity rainfalls (FB14).
42
Water quality trends on test areas – Rijeka 2016
If oxygen saturation is maintaining high values (FB12), that can be a sign of eutrophication (increased activity of algae, where oxygen comes mostly from photosynthesis). Given that there are a lot of different test areas within the DRINKADRIA project, consequently there are also diverse problems related to water quality. In this report, an overview of problems with water quality on each test area was given, with emphasis on water quality trends.
43
Water quality trends on test areas – Rijeka 2016
REFERENCES
Bajraktari, Naser, et al. (2008): "Water Quality of River Drini i Bardhë." J. Int. Environmental Application & Science 3.2: 74-79.
Beck G. (1904): Beitrag zur Flora des östlichen Albanian. Annal. Naturhist. Hofmuseum, Wien, 78.
Calligaris, C., Cucchi, F. (2014): Water quality analysis and trends on Isonzo river alluvial plain test area - Friuli Venezia Giulia Region, Italy (LP Drinkadria Report)
Chen C. C. (2007): A Framework for Graywater Recycling of Household Wastewater. Pol. J. Environ. Stud., 16, (1), 23.
Decree on groundwater status (Uredba o stanju podzemnih voda), 2009. Official gazette of Republic of Slovenia No. 25/09, 68/12. Online available: http://www.pisrs.si/Pis.web/pregledPredpisa?id=URED5121 (8.9.2014)
Decree on surface water status (Uredba o stanju površinskih voda), 2009. Official gazette of Republic of Slovenia No. 14/09, 98/10, 96/13. Online available: http://www.pisrs.si/Pis.web/pregledPredpisa?id=URED5010 (8.9.2014)
Jelenković, V., Dimkić, D., Djačić, A. (2015): Water quality of the Veliki Rzav river and its tributaries (FB10 Drinkadria Report)
Kanakoudis, V., Tsitsifli, S., Papadopoulou, A., Argyriadou, I., Rouva, A., Hitiri, I. (2015): Water quality analysis and trends on Corfu test area in Greece (FB16 Drinkadria Report)
Karleuša, B., Volf, G., Radman, I. (2015): Water quality analysis and trends on test area Northern Istria - springs Gradole, Sv. Ivan and Bulaž (Croatia), (FB8 Drinkadria Report)
Kozarov G. (1960): The phytoplankton investigations in Lake Prespa during the course of three years. Station hidrobiologique-Ohrid. Annee VIII, nr 4. f.10-13.
Lukač Reberski, J., Terzić, J., Frangen, T. (2014): Water quality analysis and trends on test areas in Southern Dalmatia - Croatia (FB9 Drinkadria Report)
Lukovac, N., Hadžiahmetović, S., Džajić-Valjevac, M. (2014): Water quality analysis and trends on Prud test area in BiH (FB12 Drinkadria Report)
Masciopinto, C., Liso, S., Visino, F. (2015): Present and future water safety and risk for drinking supply at Ostuni test area (Apulia, Italy), (FB3 Drinkadria Report)
Ministry of enviroment, energy and climate change (2013): Assessment and Classification of the qualitative (chemical) and quantitative status of the groundwater bodies – Water District of Epirus, https://dl.dropboxusercontent.com/u/50953375/KeimenaTekmiriosis/10o_Paradoteo.pdf
44
Water quality trends on test areas – Rijeka 2016
Nardi, D., Mercuri, S. (2015): Water quality analysis and trends on ATO 3 Test Area, Italy (FB2 Drinkadria Report)
Papovic, M. (2015): Water quality analysis and trends on test areas in Niksic (FB14 Drinkadria Report)
Peci, S., Ibrahimllari, A., Aliaj, A., Kuriqi, A. (2015): Water quality analysis and trends on test areas in East-Northern of Albania Drini Basin (FB11 Drinkadria Report)
Petrini R., Italiano M., Ponton M., Slejko F.F., Aviani U., Zini L. (2013): Geochemistry and isotope geochemistry of the Monfalcone thermal waters (northern Italy): inference on the deep geothermal reservoir. Hydrogeology Journal, Volume 21, 6, pp 1275-1287. DOI: 10.1007/s10040-013-1007-y
River Basin Management Plan of the Water District of Epirus, https://dl.dropboxusercontent.com/u/50953375/RBMP_GR05.pdf
Rules on drinking water (Pravilnik o pitni vodi), 2004. Official gazette of Republic of Slovenia No. 19/04, 35/04, 26/06, 92/06, 25/09. Online available: http://www.uradni-list.si/1/objava.jsp?urlid=200419&stevilka=865 (8.9.2014)
Shumka S., Miho A. (2008): "Assessment of the water quality and trends at the Drini cascade system based on plankton data."
Slovene Environment Agency 2015. Geoplatform with digital environmental data.
Zavod za javno zdravstvo Istarske županije (2005): The quality of the natural resources of water involved in water supply in the County of Istria in 2004 (orig: Kakvoća prirodnih resursa voda uključenih u vodoopskrbu u Istarskoj županiji u 2004. godini).
Zavod za javno zdravstvo Istarske županije (2008): The quality of the natural resources of water involved in water supply in the County of Istria in 2007 (orig: Kakvoća prirodnih resursa voda uključenih u vodoopskrbu u Istarskoj županiji u 2007. godini).
Zavod za javno zdravstvo Istarske županije (2014): The quality of the natural resources of water involved in water supply in the County of Istria in 2013 (orig: Kakvoća prirodnih resursa voda uključenih u vodoopskrbu u Istarskoj županiji u 2013. godini).
Žvab Rožič, P., Rožič, B., Verbovšek, T., Čenčur Curk, B., Brenčič, M., Popit, T., Šmuc, A., Vrhovnik, P., Zupančič, N. (2014): Water quality analysis and trends on test area in northwestern Slovenia (FB5 Drinkadria Report)
45
Water quality trends on test areas – Rijeka 2016
ANNEXES:
1. Report: Water quality analysis and trends on Isonzo river alluvial plain test area - Friuli Venezia Giulia Region, Italy (LP)
2. Report: Water quality analysis and trends on ATO 3 Test Area, Italy (FB2)
3. Report: Present and future water safety and risk for drinking supply at Ostuni test area (Apulia, Italy), (FB3)
4. Report: Water quality analysis and trends on test area in northwestern Slovenia (FB5)
5. Report: Water quality analysis and trends on test area Northern Istria - springs Gradole, Sv. Ivan and Bulaž (Croatia), (FB8)
6. Report: Water quality analysis and trends on test areas in Southern Dalmatia - Croatia (FB9)
7. Report: Water quality of the Veliki Rzav river and its tributaries (FB10)
8. Report: Water quality analysis and trends on test areas in East-Northern of Albania Drini Basin (FB11)
9. Report: Water quality analysis and trends on Prud test area in BiH (FB12)
10. Report: Water quality analysis and trends on test areas in Niksic (FB14)
11. Report: Water quality analysis and trends on Corfu test area in Greece (FB16)
The project is co-funded by the European Union,Instrument for Pre-Accession Assistance