Introduction With the development of nanotechnology and the increased use of nanoparticles in numerous products and processes, the need to characterize nanoparticles has also grown. Nanoparticles come in a wide variety of compositions, depending on their uses, with silica dioxide (SiO 2 ) nanoparticles being used in many areas, including paint, strengthening of materials, and semiconductor processes, among others. For successful implementation and incorporation into products, the size and size distribution of the SiO 2 particles must be characterized. Nanoparticle-size analysis has traditionally been accomplished by a variety of techniques, including, but not limited to, microscopy, light scattering, small angle x-ray scattering (SAXS) and field flow fractionation (FFF). While all the techniques work well with some advantages and disadvantages, they all are limited by low sample throughput, which inhibits their ability to characterize large numbers of particles. In addition, the above mentioned techniques, except microscopy, do not provide information on individual particle composition, nor direct particle counting. Analysis of SiO 2 Nanoparticles in Standard Mode with Single Particle ICP-MS APPLICATION NOTE Authors: Kenneth Neubauer Chady Stephan Kyoko Kobayashi PerkinElmer, Inc. Shelton, CT ICP - Mass Spectrometry
Transcript
Introduction With the development of nanotechnology and the increased use of nanoparticles in numerous products and processes, the need to characterize nanoparticles has
also grown. Nanoparticles come in a wide variety of compositions, depending on their uses, with silica dioxide (SiO2) nanoparticles being used in many areas, including paint, strengthening of materials, and semiconductor processes, among others. For successful implementation and incorporation into products, the size and size distribution of the SiO2 particles must be characterized.
Nanoparticle-size analysis has traditionally been accomplished by a variety of techniques, including, but not limited to, microscopy, light scattering, small angle x-ray scattering (SAXS) and field flow fractionation (FFF). While all the techniques work well with some advantages and disadvantages, they all are limited by low sample throughput, which inhibits their ability to characterize large numbers of particles. In addition, the above mentioned techniques, except microscopy, do not provide information on individual particle composition, nor direct particle counting.
Analysis of SiO2 Nanoparticles in Standard Mode with Single Particle ICP-MS
A P P L I C A T I O N N O T E
Authors:
Kenneth Neubauer
Chady Stephan
Kyoko Kobayashi
PerkinElmer, Inc.Shelton, CT
ICP - Mass Spectrometry
2
To meet these limitations, single particle ICP-MS (SP-ICP-MS) has been developed1, 2. This technique allows for the rapid analysis of nanoparticles, measuring thousands of particles in less than a minute, while providing individual particle information on particle size, particle size distribution, particle concentration, dissolved concentration of the element, and agglomeration.
Measuring silica (Si) with ICP-MS is challenging due to the presence of 14N2
+ and 12C16O+, which form in the plasma and have the same m/z as the most abundant Si isotope (28Si≈ 92% abundance). As a result, the background at m/z 28 is very high, which inhibits low-level Si determination and can make detection of SiO2 nanoparticles difficult. However, as measurement time decreases, the background signal will also decrease since fewer counts will be accumulated during an individual dwell time, yet the number of ions produced from ionizing a particle remains constant. As a result, the ions are measured over more time slices. Therefore, shorter dwell time should improve particle size detection limit for analytes suffering from elevated background (i.e. SiO2, Fe, Se, etc.).
This work will explore the ability of SP-ICP-MS to detect, measure, and characterize SiO2 nanoparticles using dwell times as low as 25 µs.
Experimental
Sample PreparationKnown SiO2 nanoparticle standards of various sizes were purchased from nanoComposix™ (San Diego, California, USA). Sample preparation involved sonicating the solutions for ten minutes to loosen up any agglomerated particles, followed by dilutions with deionized water to yield final concentrations of 100,000 – 200,000 particles/mL. The final solutions were sonicated again prior to analysis.
Dissolved calibration curves were made by serial dilutions of a 1000 mg/L dissolved silica standard. The silica concentrations of the dissolved standards were 2, 5, 10, and 20 µg/L Si. Particle calibration curves were made from the SiO2 nanoparticle standards (180, 200 nm) at concentrations of about 100,000 particles/mL.
Analysis and InstrumentationAll analyses were performed on a PerkinElmer NexION® 350D ICP-MS operating in Standard mode, using the Nano Application Module (Part No. N8140309) within Syngistix™ for ICP-MS software. Instrumental parameters appear in Table 1 and were optimized to give the highest Si signal while maintaining the lowest possible background due to silica leaching from the torch.
Results and Discussion
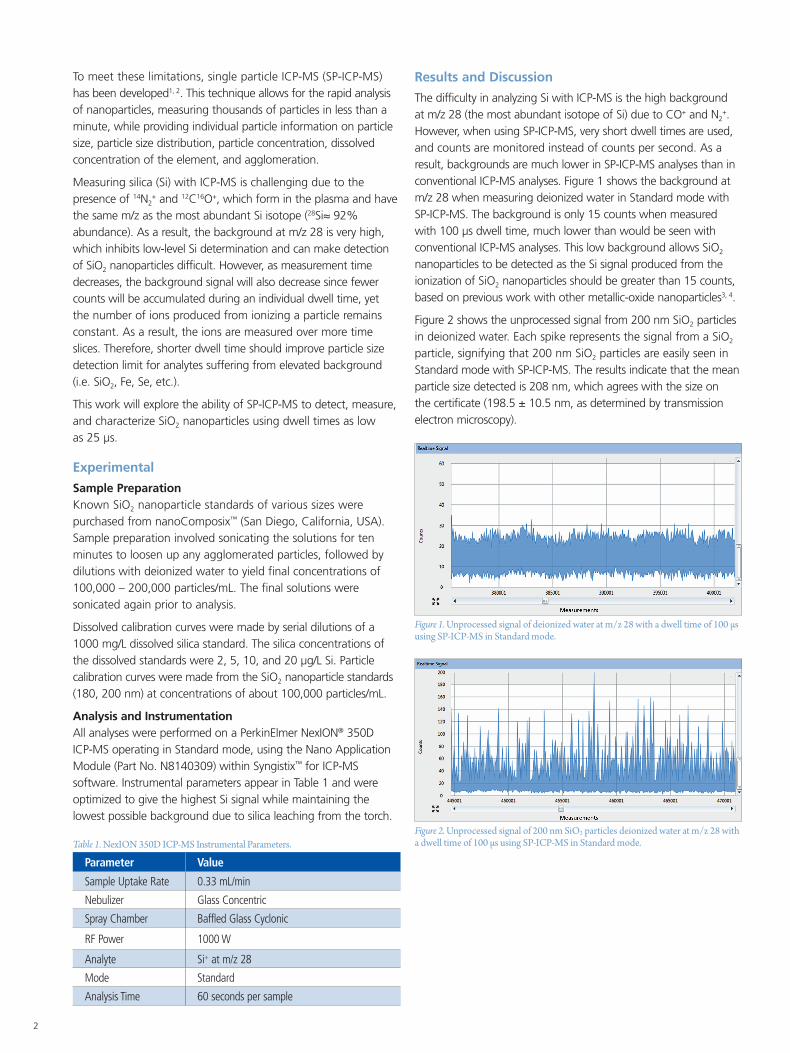
The difficulty in analyzing Si with ICP-MS is the high background at m/z 28 (the most abundant isotope of Si) due to CO+ and N2
+. However, when using SP-ICP-MS, very short dwell times are used, and counts are monitored instead of counts per second. As a result, backgrounds are much lower in SP-ICP-MS analyses than in conventional ICP-MS analyses. Figure 1 shows the background at m/z 28 when measuring deionized water in Standard mode with SP-ICP-MS. The background is only 15 counts when measured with 100 µs dwell time, much lower than would be seen with conventional ICP-MS analyses. This low background allows SiO2 nanoparticles to be detected as the Si signal produced from the ionization of SiO2 nanoparticles should be greater than 15 counts, based on previous work with other metallic-oxide nanoparticles3, 4.
Figure 2 shows the unprocessed signal from 200 nm SiO2 particles in deionized water. Each spike represents the signal from a SiO2 particle, signifying that 200 nm SiO2 particles are easily seen in Standard mode with SP-ICP-MS. The results indicate that the mean particle size detected is 208 nm, which agrees with the size on the certificate (198.5 ± 10.5 nm, as determined by transmission electron microscopy).
Figure 1. Unprocessed signal of deionized water at m/z 28 with a dwell time of 100 µs using SP-ICP-MS in Standard mode.
Figure 2. Unprocessed signal of 200 nm SiO2 particles deionized water at m/z 28 with a dwell time of 100 µs using SP-ICP-MS in Standard mode.
3
Because counts are being measured, shorter dwell times result in lower backgrounds, although the analyte intensity will also be lower. Table 2 shows the effect of dwell time on the signal-to-background (S/B) ratio at m/z 28 for deionized water and a 10 ppb dissolved silica standard. These data demonstrate the importance of using short dwell times. With a dwell time typically used for aqueous analysis (i.e. 50 ms), the S/B ratio is less than 1. However, with dwell times of 100 µs or less, the S/B ratio becomes greater than 1, demonstrating the importance of short dwell times for nanoparticle work. As the dwell time is reduced further, the Si sensitivity decreases, yet the signal-to-background ratio remains constant, which implies that shorter dwell times should allow smaller SiO2 particles to be detected.
The basis for this deduction is that while shorter dwell times result in lower background signals, individual particle mass is constant, and once ionized in the plasma, the number of ions formed is constant and is not a function of the dwell time when surface area integration is applied.
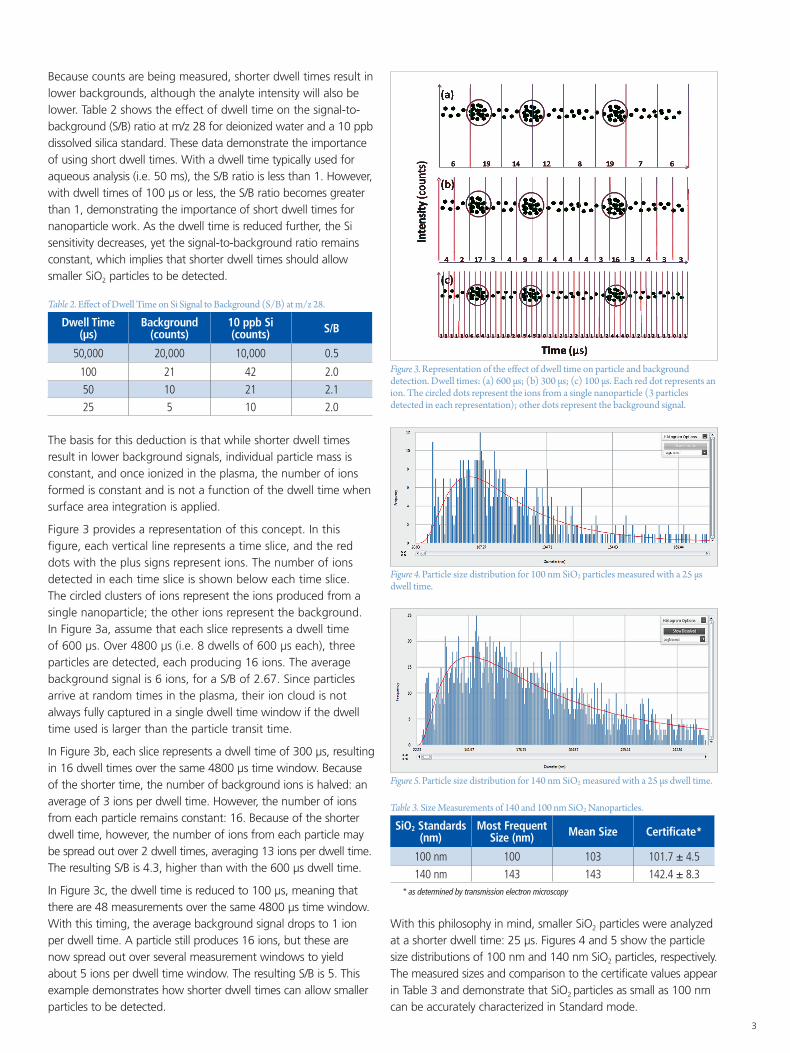
Figure 3 provides a representation of this concept. In this figure, each vertical line represents a time slice, and the red dots with the plus signs represent ions. The number of ions detected in each time slice is shown below each time slice. The circled clusters of ions represent the ions produced from a single nanoparticle; the other ions represent the background. In Figure 3a, assume that each slice represents a dwell time of 600 µs. Over 4800 µs (i.e. 8 dwells of 600 µs each), three particles are detected, each producing 16 ions. The average background signal is 6 ions, for a S/B of 2.67. Since particles arrive at random times in the plasma, their ion cloud is not always fully captured in a single dwell time window if the dwell time used is larger than the particle transit time.
In Figure 3b, each slice represents a dwell time of 300 µs, resulting in 16 dwell times over the same 4800 µs time window. Because of the shorter time, the number of background ions is halved: an average of 3 ions per dwell time. However, the number of ions from each particle remains constant: 16. Because of the shorter dwell time, however, the number of ions from each particle may be spread out over 2 dwell times, averaging 13 ions per dwell time. The resulting S/B is 4.3, higher than with the 600 µs dwell time.
In Figure 3c, the dwell time is reduced to 100 µs, meaning that there are 48 measurements over the same 4800 µs time window. With this timing, the average background signal drops to 1 ion per dwell time. A particle still produces 16 ions, but these are now spread out over several measurement windows to yield about 5 ions per dwell time window. The resulting S/B is 5. This example demonstrates how shorter dwell times can allow smaller particles to be detected.
Dwell Time (µs)
Background (counts)
10 ppb Si (counts) S/B
50,000 20,000 10,000 0.5
100 21 42 2.0
50 10 21 2.1
25 5 10 2.0
Table 2. Effect of Dwell Time on Si Signal to Background (S/B) at m/z 28.
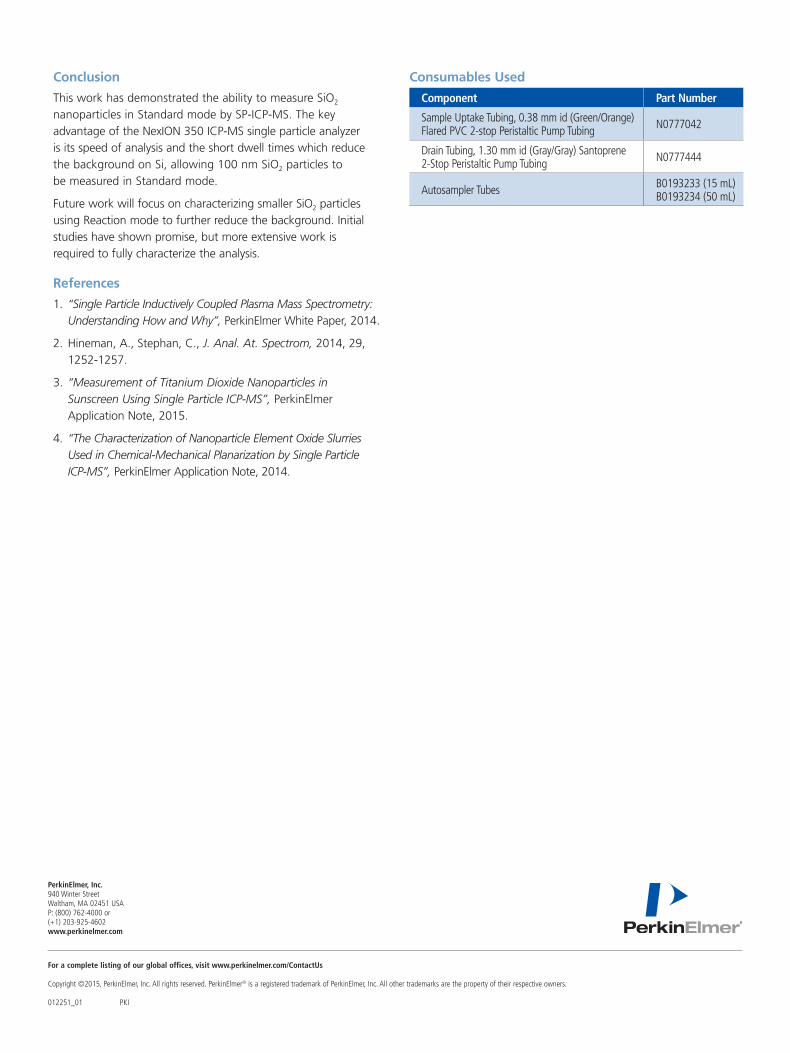
With this philosophy in mind, smaller SiO2 particles were analyzed at a shorter dwell time: 25 µs. Figures 4 and 5 show the particle size distributions of 100 nm and 140 nm SiO2 particles, respectively. The measured sizes and comparison to the certificate values appear in Table 3 and demonstrate that SiO2 particles as small as 100 nm can be accurately characterized in Standard mode.
Figure 3. Representation of the effect of dwell time on particle and background detection. Dwell times: (a) 600 µs; (b) 300 µs; (c) 100 µs. Each red dot represents an ion. The circled dots represent the ions from a single nanoparticle (3 particles detected in each representation); other dots represent the background signal.
Figure 3
Figure 4. Particle size distribution for 100 nm SiO2 particles measured with a 25 µs dwell time.
Figure 5. Particle size distribution for 140 nm SiO2 measured with a 25 µs dwell time.
SiO2 Standards (nm)
Most Frequent Size (nm) Mean Size Certificate*
100 nm 100 103 101.7 ± 4.5
140 nm 143 143 142.4 ± 8.3* as determined by transmission electron microscopy
Table 3. Size Measurements of 140 and 100 nm SiO2 Nanoparticles.
For a complete listing of our global offices, visit www.perkinelmer.com/ContactUs
PerkinElmer, Inc. 940 Winter Street Waltham, MA 02451 USA P: (800) 762-4000 or (+1) 203-925-4602www.perkinelmer.com
Conclusion
This work has demonstrated the ability to measure SiO2 nanoparticles in Standard mode by SP-ICP-MS. The key advantage of the NexION 350 ICP-MS single particle analyzer is its speed of analysis and the short dwell times which reduce the background on Si, allowing 100 nm SiO2 particles to be measured in Standard mode.
Future work will focus on characterizing smaller SiO2 particles using Reaction mode to further reduce the background. Initial studies have shown promise, but more extensive work is required to fully characterize the analysis.
References
1. “Single Particle Inductively Coupled Plasma Mass Spectrometry: Understanding How and Why”, PerkinElmer White Paper, 2014.
2. Hineman, A., Stephan, C., J. Anal. At. Spectrom, 2014, 29, 1252-1257.
3. “Measurement of Titanium Dioxide Nanoparticles in Sunscreen Using Single Particle ICP-MS”, PerkinElmer Application Note, 2015.
4. “The Characterization of Nanoparticle Element Oxide Slurries Used in Chemical-Mechanical Planarization by Single Particle ICP-MS”, PerkinElmer Application Note, 2014.
Consumables Used
Component Part Number
Sample Uptake Tubing, 0.38 mm id (Green/Orange) Flared PVC 2-stop Peristaltic Pump Tubing N0777042
Drain Tubing, 1.30 mm id (Gray/Gray) Santoprene 2-Stop Peristaltic Pump Tubing N0777444