Detection of Lesser Grain Borer Larvae in Internally Infested Kernels of Brown Rice and Wheat Using an Electrically Conductive Roller Mill D. BRABEC, T. PEARSON, and P. W. FLINN Published by www.aaccnet.org
Transcript
Detection of Lesser Grain Borer Larvae in Internally Infested Kernels of Brown Rice and Wheat Using
an Electrically Conductive Roller Mill
D. BRABEC, T. PEARSON, and P. W. FLINN
Published by
www.aaccnet.org
CFW PLEXUS / 1
Detection of Lesser Grain Borer Larvae in Internally Infested Kernels of Brown Rice and Wheat Using
an Electrically Conductive Roller Mill1
D. BRABEC,2,3 T. PEARSON,2 AND P. W. FLINN2
ABSTRACT
Modifications were made to a small laboratory mill to enable the detection of rice kernels internally infested by immature grain insects. The mill, which was originally designed for wheat, monitors electrical conductance through the grain and detects kernels that are infested with live insects based on abrupt changes in electrical conductance as the insects inside the kernels are crushed between the mill rolls. The mill was adapted to detect rice infested by immature lesser grain bor-ers (LGB) by altering the gearing and reducing the gap between the two mill rolls to produce shear between the rolls. Samples of LGB in-fested long, medium, and short grain (dehulled) brown rice and hard red winter wheat were tested in both the modified and original mills. The detection rates for long grain brown rice kernels infested with large, medium, and small LGB larvae were 97, 83, and 42%, respec-tively, with the modified mill and 61, 22, and 4%, respectively, with the original mill. Similar detection rates were observed for medium and short grain brown rice with the modified mill. The detection rates for hard red winter wheat kernels infested by large, medium, and small LGB larvae were 98, 94, and 78%, respectively, with the modified mill and 78, 67, and 38%, respectively, with the original mill. More time was required to process a sample through the modified mill than through the original mill. For rice, a 500 g sample could be processed in 150 sec, making the instrument useful for quality control checks of incoming and outgoing product and for monitoring grain during storage to de-termine whether fumigation is necessary. However, for drier wheat kernels, the flattened teeth in the modified mill allowed kernel slip-page; as a result, the benefit of increased accuracy might not outweigh potential feeding issues.
Rice and wheat are both vulnerable during storage to insect pests that degrade quality and value. Rice is especially vulner-able because it is generally grown and stored in warm, humid climates. Stored-grain insects can cause significant economic losses for grain handlers and processors. Traditional methods for detecting internally infesting, stored-grain insects involve time-consuming X-rays (4,7) or chemical tests to extract insect fragments from milled grains (AACCI Approved Method 28-41B [1]). Because these methods are expensive, can only analyze very small amounts of grain, and are time-consuming, they are not usually performed during grain storage or ship-ment. This leads managers of grain storage facilities to fumi-
gate at regular intervals regardless of whether the grain is actu-ally infested. In addition, the lack of quick methods for detect-ing infested grain makes quality control checks of incoming and outgoing shipments of grain nearly impossible.
Rice and wheat are considered infested when two or more live insects are found during inspection (13). Live adult insects found in the grain represent an obvious sign of potential infes-tation. However, grain can be internally infested without any external evidence. Perez-Mendoza et al. (12) showed that 90% of 2.75 kg wheat samples from rail cars that were infested with stored-grain insects had no adults in the samples. Thus, check-ing only for adult insects in a grain sample can lead to missed infestations, which can then cause significant damage over the course of a few months if the temperature and humidity are fa-vorable for insect growth.
In previous studies by Brabec et al. (2) and Pearson et al. (11), instruments were developed that monitor electrical con-ductance through grain as it is milled. When an insect-infested kernel is crushed between two mill rolls, the moisture from the insect causes a spike in conductance that is detected by a com-puter connected to the mill rolls. This conductance mill can crush 1 kg of wheat in less than 2 min and count kernels in-fested with live larvae, pupae, and pre-emergent adult stored-grain insects. Two major internally infesting insect species were tested: the rice weevil, Sitophilus oryzae (L.), and the lesser grain borer (LGB), Rhyzopertha dominica (F.). The processing speed of the conductance mill makes it a useful tool for grain receiving stations. Insect-infested kernel counts can be used by grain storage managers to make informed decisions regarding the storability of the grain and whether a bin should be fumi-gated.
In 2008–2010 the United States produced around 150 mil-lion cwt of long grain rice in several southern states, including Arkansas, Louisiana, Mississippi, and Texas. In 2009 California produced 45 million cwt of medium grain rice and more than 3 million cwt of short grain rice. The total U.S. rice crop was valued at more than US$3 billion in 2008, 2009, and 2010 (14). Rice is a major food source throughout the world, particularly in Asia and South America.
Preliminary studies with the conductance mill found much lower detection rates for internally infested brown rice than for wheat. Although brown rice is a cereal grain that is similar in shape to wheat, brown rice has a significantly smaller diameter than wheat. Also, larvae tend to be smaller in rice, as observed in X-ray images, possibly because of the harder composition of rice. These factors combine to make the detection of internally infested rice more difficult than that of internally infested wheat.
The objectives of this research were threefold: 1) to modify the conductance mill previously developed for detection of in-sect-infested wheat to improve its ability to detect insect infes-tations in brown rice; 2) to quantify the detection accuracy of
1 This paper reports the results of research only. Any mention of a proprie-tary product or trade name does not constitute a recommendation or en-dorsement by the U.S. Department of Agriculture. The USDA is an equal opportunity provider and employer.
2 USDA-ARS Center for Grain and Animal Health Research, Manhattan, KS, U.S.A.
This article is in the public domain and not copyrightable. It may be freely reprinted with customary crediting of the source. AACC International, Inc., 2012.
CFW PLEXUS / 2
the modified mill for long, medium, and short grain brown rice kernels infested with various sizes of larvae; and 3) to compare the modified mill to the original mill for the detection of in-fested wheat and rice.
MATERIALS AND METHODS
Conductance Mills Two laboratory mills constructed by National Manufactur-
ing were tested. Both mills share a similar exterior appearance (Fig. 1); the only differences involve the internal parts (Fig. 2). The first mill, henceforth referred to as Mill(1), has design fea-tures similar to those of the original instrument developed by Pearson and Brabec (10). This mill crushes the grain using a 1:1 gear ratio between the two rolls, which results in no shear being applied to the grain as it is crushed. The tooth profile of Mill(1) is sharp, with a tooth depth of 0.64 mm (0.025 in.). The sharp tooth profile facilitates uniform feeding of wheat through the tight gap, because the sharp teeth strongly grip the kernels. The gap between the two rolls from peak to peak is
0.45–0.51 mm (0.018–0.020 in.). More importantly, the gap be-tween the tooth valleys of the two rolls is 1.73 mm (0.068 in.). This 1.73 mm gap corresponds to the diagonal of a 1.2 mm × 1.2 mm square void that allows plenty of room for smaller lar-vae to pass through without being detected.
Detection of infested kernels only occurs if larval fluid (hemolymph) is released during the milling of the kernels and larvae, causing an electrical short circuit between both rolls. The rolls and teeth have some spaces between them, and a larva could be oriented such that it might not be crushed or de-tected. Larger spaces allow more chances for infested kernels to pass undetected through the mill. Large LGB larvae reared in long grain brown rice are 1.6 mm long and 0.8 mm in diame-ter. Medium LGB larvae in long grain brown rice are 1.1 mm long and 0.55 mm in diameter, which is smaller than the 1.2 mm × 1.2 mm void space between the rolls shown in Fig-ure 3. In a worst case scenario, if a medium larva is positioned perpendicular to the mill teeth, there is a chance that no con-tact will be made between the larva and both rolls, allowing the infested kernel to go undetected.
Several modifications were made to Mill(1) to facilitate the detection of internally infested rice kernels, resulting in Mill(2). Mill(1) is driven by a pair of gears that rotate at the same speed and basically crush the kernels. Mill(2) uses drive gears that do not rotate at the same speed and cause shearing of the kernels. The differential pair of drive gears used in Mill(2) have a gear ratio of 1:1.4. This modification reduces the space between the rolls, because the teeth always pass over each other. The shape of the teeth also was modified. Shearing between the rolls in-creases the wear on teeth, and sharp teeth would eventually wear down. Thus, the teeth used in Mill(2) have flattened tops. Also, a smaller tooth depth was used, 0.46 mm (0.018 in.), as shown in Figure 3. The changes to mill roll shearing and smaller tooth profiles reduce the maximum void space between the rolls and enhance the detection of smaller larvae.
The gear box for Mill(1) (F832-18K-B5, Boston Gear) oper-ates at 96 rpm and a maximum torque of 78 N·m (690 lbf·in).
Fig. 1. Photograph of a conductance mill. The modified mill is shown, but the original mill is nearly identical.
Fig. 2. Schematic of a conductance mill. The basic electronic circuit created between the rolls and the grain is used to detect infested kernels of rice.
Fig. 3. Roll teeth and gap geometry for the original conductance mill (left) and the modified mill (right). The shearing action of the modified mill reduces the space between the rolls, enabling more larvae to be detected.
CFW PLEXUS / 3
Additional torque was required for Mill(2) because of the shearing and 1:1.4 gear ratio. The Mill(2) gear box has a maxi-mum torque of 165 N·m (1,457 lbf·in) (F842B-36K-B5, Boston Gear) but operates more slowly at 48 rpm. Thus, grain sample throughput is slowed, and sample processing time increases.
During the process of milling grain, heat is created by the friction between the grain and the mill rolls, especially when shear is produced between the rolls. These laboratory mills are intended to operate intermittently and not continuously, and a short pause between sample runs allows the rolls to cool. How-ever, even with intermittent operation, heat in the mills in-creases. Temperature sensors were mounted on the side of each mill, and the temperature of the mill side plate was measured between samples. A cooling fan was mounted on the back of Mill(2) to circulate air around the sides for cooling. Mill opera-tion was limited to temperatures lower than 40°C because tem-peratures higher than 50°C resulted in noninfested kernels be-ing counted as infested.
Grain Samples For the tests described below, 22 kg (50 lb) bags of long, me-
dium, and short grain (dehulled) brown rice (LBR, MBR, and SBR, respectively) were obtained from commercial sources in the United States. The hard red winter wheat (HRW) was ob-tained from the Kansas State University Foundation seed facil-ity. All bags of grain were inspected, and the grain appeared sound, with a normal odor and moisture content <12%. The bags were stored in a large refrigerator at 5°C until use to pre-vent any potential insect activity. Control samples were crushed in a conductance mill, and no insects were detected. Before the control or infested samples were tested, the rice samples were conditioned to 14.2% moisture by tempering and drying 1–2 kg portions. This moisture level was selected because it represents the maximum moisture level at which grain can be safely stored (3,6). Also, brown rice containing more than 14.5% moisture would be less likely to be found in commercial mar-kets because it is considered sample grade (9). Other moisture content levels of noninfested grain samples were tested using the conductance mill as described below.
Insect Colonies for Internally Infested Kernels To acquire a sufficient density of infested kernels for easier
x-raying and sorting, 0.8 g of adult LGB (600 insects) were added to the 250 g samples of HRW and LBR. Only 0.4 g of adults was needed to acquire densely infested colonies in MBR and SBR samples, because these colonies could reproduce more easily. All grain samples were initially tempered to 13% mois-ture before adding the insects. The colonies were stored at 27°C and 60% RH for 8 weeks. New jars of colonies were started each week of the 8 week incubation period. Adults were main-tained within each jar over the incubation period. Sufficient quantities of small, medium, and large larvae were available from several of the jars.
X-ray Imaging of Rice and Wheat Kernels X-ray images were used to manually separate the infested
rice and wheat kernels and to determine the size of the infest-ing larvae (usually there is only one larva per kernel). Approxi-mately 6 g of kernels was placed on a plastic dish and x-rayed using a digital imaging system (MX20-dc44, Faxitron X-ray Corp.). The infested kernels were sorted into three size catego-ries based on the size of the infesting larva (small, medium, or large), according to the following guidelines. Kernels contain-ing larvae and tunnels that occupied more than half the length of the kernel were considered to be infested by large larvae. Kernels that contained larvae and tunnels occupying between
one-quarter and one-half of the kernel length were considered to be infested by medium larvae. Kernels that contained larvae and tunnels occupying less than one-quarter of the kernel length were considered to be infested by small larvae. X-ray photos of the larval stages in LBR, MBR, and SBR are provided in Figure 4. According to Kirkpatrick and Wilbur (8), this size classification roughly corresponds to large larvae as pupae and fourth-instar larvae (1 mm × 3 mm), medium larvae as third-instar larvae (0.6 mm × 1.8 mm), and small larvae as second-instar larvae (0.3 mm × 1 mm).
Experimental Test and Design Infested and noninfested rice and wheat grains were milled
using both Mill(1) and Mill(2) to establish the detection rates for rice infested by LGB larvae of various sizes and to compare the detection rates between the two mills. Mill(1) was tested using two grain types: LBR and HRW. Mill(2) was tested us-ing four grain types: LBR, MBR, SBR, and HRW. The experi-ment contained six grain × mill combinations: LBR × Mill(1), HRW × Mill(1), LBR × Mill(2), MBR × Mill(2), SBR × Mill(2), and HRW × Mill(2).
A randomized block design was used, with each grain × mill combination repeated three times. Within each block, four 500 g samples were tested for each of the three larval sizes and the control. Four samples and three replications yielded twelve samples for each larval size and grain type. Each 500 g sample of noninfested grain was spiked with 12 infested kernels just prior to milling. Thus, a total of 144 large, 144 medium, and 144 small larvae were used with each grain type. There were also 12 noninfested control samples tested for each grain × mill combination.
Fig. 4. An X-ray image shows infested kernels of long grain (top row), medium grain (middle row), and short grain (bottom row) brown rice. Each kernel contains a lesser grain borer larva of a different size: small (left kernels), medium (middle kernels), or large (right kernels). The length of the long grain rice measured 7–8 mm.
CFW PLEXUS / 4
Computer and Software for Monitoring Conductance Signals Data collection and analysis were accomplished using a lap-
top computer and software provided by the manufacturer of the conductance mills (National Mfg.). The software allows the user to specify certain parameters for data smoothing and counting infested kernels. In this study, the slope generator pa-rameter was set at 10, and the slope threshold constant was set at 2%. The slope generator parameter is used to smooth the signal to make the signal produced by infested kernels more distinguishable. The first derivative of the crushed grain signal is used to determine the potential infested kernels, as described by Pearson and Brabec (10). The slope threshold constant is the threshold value for classifying a peak in the derivative signal as an infested kernel and is given as a percentage of the full scale. The 2% level was used with the rice data to maximize true de-tections and minimize false detections. The software also con-tains features for motor control and automatic shut off. The mill was allowed to run empty for 10 sec after the material fin-ished passing through the mill to allow the mill and motor to cool and to help remove any residual grain that might be stuck to the mill rolls.
Testing the Effects of Grain Moisture Electrical conductance through the grain, as measured by
the mill, is somewhat logarithmically proportional to the mois-ture content of the grain. This characteristic was the basis of the concept of the Tag Heppenstall moisture meter (5). At lower moisture levels, the conductance of the grain is low. As seen in the current study, the conductance signal of the grain became more variable as the grain moisture content increased. At 15% moisture, the ability to distinguish between infested kernels and high-moisture grain diminishes because the added moisture from the crushed larvae can be relatively small com-pared with the relatively high conductance signal. The band-width of the conductance signal increases as moisture content increases, and in addition, the bandwidth of its derivative sig-nal (dV/dt) increases. This effect requires higher values for the dV/dt threshold level if the grain sample moisture could be 14% or higher to ensure that noninfested, higher moisture ker-nels are not counted as infested kernels.
To measure the effect of grain moisture on the conductance signal and its derivative signal, LBR, MBR, SBR, and HRW samples were conditioned to 12, 13, 14, and 15% moisture. The moisture levels were determined using the 1 hr ground-grain and oven-air method (AACCI Approved Method 44-15A [1]). Each grain moisture level was tested six times using a 250 g sample per test. The conductance signal averages were calcu-lated. Additionally, the maximum peak height of the conduc-tance signal derivative was recorded so a safe threshold level could be selected for classifying derivative signal peaks as in-fested kernels.
RESULTS AND DISCUSSION
Detection of Internally Infested Brown Rice For LBR infested by large, medium, and small larvae, 61, 22,
and 4%, respectively, of the infested kernels were detected using Mill(1) (Table I). The addition of shear to and the tighter teeth profiles of Mill(2) resulted in significantly higher (P < 0.001) detection rates. Using Mill(2), detection of kernels infested by large, medium, and small larvae averaged more than 97, 83, and 42%, respectively, for LBR. Similar detection rates were ob-served for MBR and SBR using Mill(2). The disadvantage of Mill(2) was the feed rate. It took 150 sec to mill a 500 g sample of brown rice, which was approximately twice the time required for Mill(1).
After the conductance signal was collected, it was processed by computing the derivative of the signal, smoothing the de-rivative signal, and counting the peaks above the threshold. All of the peaks in the derivative signal that were higher than 2% of the full scale were counted as infested kernels. A computer screen image of the conductance signal for Mill(2) for a 500 g sample of LBR kernels with 14% moisture mixed with 12 ker-nels infested with medium larvae is shown in Figure 5, and its derivative is shown in Figure 6. In this example, 10 of 12 in-
Table I. Infested kernel detection rates for the original conductance mill (Mill(1)) and the modified mill (Mill(2)) for long (LBR), medium (MBR), and short (SBR) grain brown ricea
Large 61 11 97 5 97 4 98 4 Medium 22 14 83 10 89 11 89 11 Small 4 7 42 11 40 11 57 11 a Mean = average detection rate, and SD = standard deviation of detection of
infested kernels. Each size category contained 12 samples, and each sample contained 12 lesser grain borer-infested kernels, for a total of 144 infested kernels per larval size.
Fig. 5. Conductance signal from a 500 g sample of long grain brown rice with 14% moisture mixed with 12 kernels infested with mediumlesser grain borer larvae processed through the modified conduc-tance mill.
Fig. 6. The derivative (dV/dt) of the conductance signal is illustratedfor the data used in Figure 5.
CFW PLEXUS / 5
fested kernels were detected. It was apparent that two peaks slightly below the 2% threshold were not counted; these were presumably from the two infested kernels that were not de-tected. It is possible to lower the slope threshold so lower peaks can be detected. However, lowering the slope threshold level increases the risk of false detections. As discussed below, the grain moisture tests indicated that the 2% slope threshold was a reasonable choice.
Peak height in the derivative signal (dV/dt) is not a clear in-dicator of the size of the infesting larva. However, large larvae tend to produce higher peaks relative to smaller larvae. Table II shows the detected peak heights versus larval size for LBR for Mill(2); 55% of the peaks from the large larvae were above the threshold level of 5.0, and 83% of the peaks from the small lar-vae were below the 5.0 threshold. The contact of the larvae with the rolls was variable; thus, no conclusions about larval size can be drawn from specific peaks.
Detection of Internally Infested Wheat The detection rates for infested HRW are provided in Table
III. Large, medium, and small larvae (Fig. 3) were detected at 78, 67, and 38%, respectively, using Mill(1) and 98, 94, and 78%, respectively, using Mill(2). Although mean detection signifi-cantly (P < 0.002) improved with use of Mill(2), there were problems with feeding the wheat through the mill as a result of the flat tooth design. On several occasions, the wheat kernels stopped feeding, and the motor needed to be reversed and re-started to allow the wheat to pass through, thus requiring 190–240 sec to feed 500 g of wheat through the mill. In contrast, Mill(1) operated without any feeding interruptions, and 500 g was crushed within 40 sec. This might be attributable to the sharper tooth design and faster roll rotational speed. It is pos-sible that for wheat other tooth designs could be used with shear and a roll gap similar to Mill(2) that would facilitate more efficient feeding. However, these experiments appear to indi-cate that the increased detection rate for Mill(2) for wheat may not provide enough of an advantage to outweigh the feeding issues and the faster sample run time of Mill(1).
More experimentation with different roll designs is planned to improve the feeding of wheat through a mill with shear and a gap similar to that of Mill(2). A limited number of experi-ments with the sharp tooth rolls used in Mill(1) combined with the 1:1.4 gear ratio used in Mill(2) were performed and indi-cated that wheat would feed reliably with this configuration. However, a long-term study needs to be performed to deter-mine the wear on sharp teeth used with shear before a specific combination can be recommended.
False Detections in Noninfested Rice and Wheat False detections occur when noninfested grain is erroneously
counted as infested. Because a 500 g sample of wheat or brown rice may contain 15,000 kernels, the false detection rate of any
insect-infested kernel detection system must be extremely low. Typical infestation rates are fewer than 20 infested kernels per 2.75 kg sample (12). Thus, more than one or two false detec-tions per sample can render a method ineffective. When the slope threshold was set at 2%, 2 of 36 control samples each had one false detection (one in SBR and one in MBR). When the slope threshold was lowered to 1.5%, 5 of 36 control samples had one false detection. In this case, false detections were ob-served in the two MBR samples and the three SBR samples, with no false detections observed in the LBR control samples.
One source of false detection is contamination with a small piece of soil. Thus, all samples should be sieved with a coarse sieve to remove any soil. This step can be accomplished by pass-ing the sample through a dockage tester or using a separate sieve (e.g., Tyler no. 12 sieve).
Another potential source of error is moisture added to the outside of kernels, such as happens when collecting a sample under rainy or snowy conditions or handling grain with wet hands. Thus, grain samples should be handled in a manner that will not increase moisture prior to testing. Plant materials and foreign kernels that had a chance to equilibrate to the same moisture content as the sample were not found to be a source of false detections.
A third type of false detection was noted when samples with large larvae were tested. On several occasions, a large larva would create multiple peaks. For example, sometimes 13 peaks were detected when only 12 infested kernels were present. Ad-ditional software code was added to avoid counting peaks within 150 msec of a positive detection. However, this change did not completely solve the problem, and other possible solu-tions are being evaluated.
Performance of Conductance Mill(2) at Varying Rice Moisture Contents
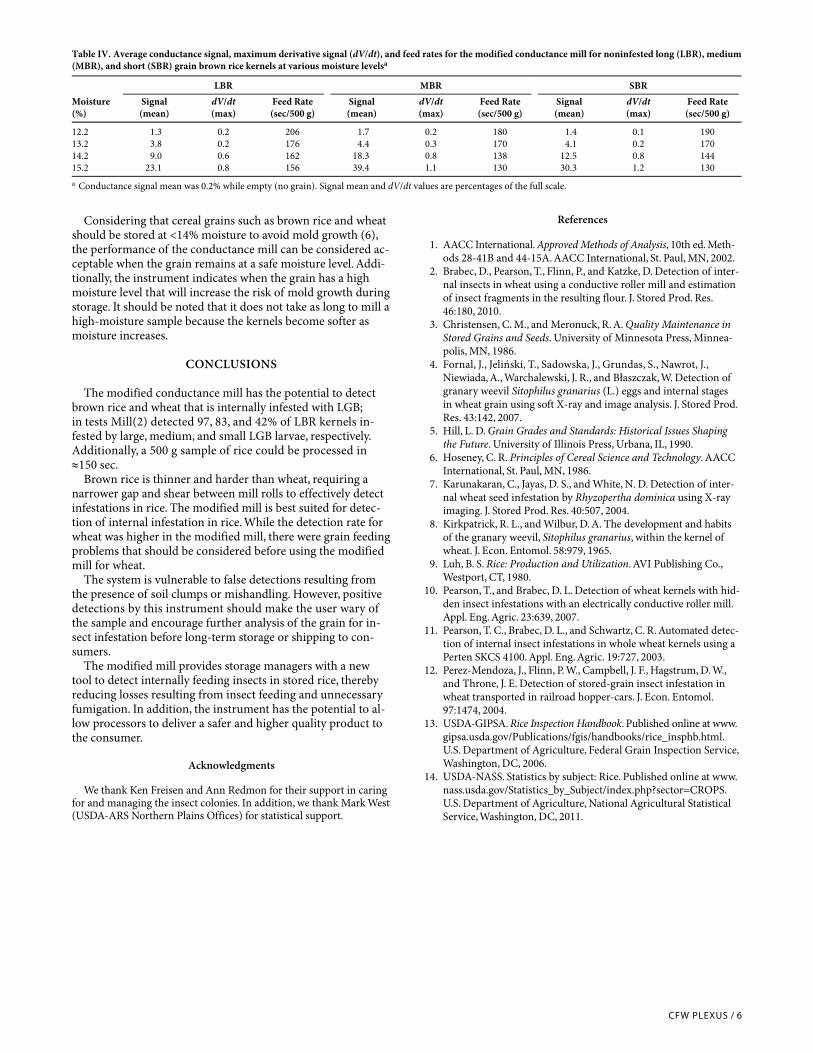
The average electrical conductance and range of derivative signals for rice at various moisture levels are shown in Table IV. As the moisture content increased, the average conductance signal and noise on the derivative signal also increased. At 14.2% moisture, the maximum derivative signal (dV/dt) for all three types of rice was 0.8% of the full scale. This value was slightly less than half the threshold of 2% used for classifying peaks as infested kernels. Thus, the 2% threshold was a safe level for all grain moisture contents <14.2%. Although the de-rivative signal did not exceed 1.2% of full scale at 15.2% mois-ture, the ability of the instrument to detect infested kernels was greatly diminished because the average conductance signal be-came highly elevated (23.1–39.4%), such that any peak created by the moisture of an insect was obscured by the high grain moisture. Therefore, the detection rate of the conductance mill would be decreased for rice at a moisture level of 15.2%. How-ever, using a 2% slope threshold should avoid false detections with 15.2% moisture rice as well.
Table II. Frequency distribution of detected peaks for large, medium, and small larvae in long grain brown rice in the modified conductance milla
No. of Infested Kernels Detected at Different Threshold Levels
Larval Size Detected Count 2.0 3.0 4.0 5.0 6.0
Large Accumulated 136 130 109 75 42 Incremental 6 21 34 33 42 Medium Accumulated 117 94 72 36 17 Incremental 23 22 36 19 17 Small Accumulated 59 36 22 10 0 Incremental 23 14 12 10 0 a For each larval size, 144 kernels were prepared and tested.
Table III. Infested kernel detection rate for the original conductance mill (Mill(1)) versus the modified mill (Mill(2)) for hard red winter wheat (HRW)a
Detection Rate (%) HRW × Mill(1) HRW × Mill(2)
Larval Size Mean SD Mean SD
Large 78 11 98 4 Medium 67 13 94 9 Small 38 14 78 13 a Mean = average detection rate, and SD = standard deviation of detection of
infested kernels. Each size category contained 12 samples, and each sample contained 12 lesser grain borer-infested kernels, for a total of 144 infested kernels per larval size.
CFW PLEXUS / 6
Considering that cereal grains such as brown rice and wheat should be stored at <14% moisture to avoid mold growth (6), the performance of the conductance mill can be considered ac-ceptable when the grain remains at a safe moisture level. Addi-tionally, the instrument indicates when the grain has a high moisture level that will increase the risk of mold growth during storage. It should be noted that it does not take as long to mill a high-moisture sample because the kernels become softer as moisture increases.
CONCLUSIONS
The modified conductance mill has the potential to detect brown rice and wheat that is internally infested with LGB; in tests Mill(2) detected 97, 83, and 42% of LBR kernels in-fested by large, medium, and small LGB larvae, respectively. Additionally, a 500 g sample of rice could be processed in 150 sec.
Brown rice is thinner and harder than wheat, requiring a narrower gap and shear between mill rolls to effectively detect infestations in rice. The modified mill is best suited for detec-tion of internal infestation in rice. While the detection rate for wheat was higher in the modified mill, there were grain feeding problems that should be considered before using the modified mill for wheat.
The system is vulnerable to false detections resulting from the presence of soil clumps or mishandling. However, positive detections by this instrument should make the user wary of the sample and encourage further analysis of the grain for in-sect infestation before long-term storage or shipping to con-sumers.
The modified mill provides storage managers with a new tool to detect internally feeding insects in stored rice, thereby reducing losses resulting from insect feeding and unnecessary fumigation. In addition, the instrument has the potential to al-low processors to deliver a safer and higher quality product to the consumer.
Acknowledgments
We thank Ken Freisen and Ann Redmon for their support in caring for and managing the insect colonies. In addition, we thank Mark West (USDA-ARS Northern Plains Offices) for statistical support.
References
1. AACC International. Approved Methods of Analysis, 10th ed. Meth-ods 28-41B and 44-15A. AACC International, St. Paul, MN, 2002.
2. Brabec, D., Pearson, T., Flinn, P., and Katzke, D. Detection of inter-nal insects in wheat using a conductive roller mill and estimation of insect fragments in the resulting flour. J. Stored Prod. Res. 46:180, 2010.
3. Christensen, C. M., and Meronuck, R. A. Quality Maintenance in Stored Grains and Seeds. University of Minnesota Press, Minnea-polis, MN, 1986.
4. Fornal, J., Jeliński, T., Sadowska, J., Grundas, S., Nawrot, J., Niewiada, A., Warchalewski, J. R., and Błaszczak, W. Detection of granary weevil Sitophilus granarius (L.) eggs and internal stages in wheat grain using soft X-ray and image analysis. J. Stored Prod. Res. 43:142, 2007.
5. Hill, L. D. Grain Grades and Standards: Historical Issues Shaping the Future. University of Illinois Press, Urbana, IL, 1990.
6. Hoseney, C. R. Principles of Cereal Science and Technology. AACC International, St. Paul, MN, 1986.
7. Karunakaran, C., Jayas, D. S., and White, N. D. Detection of inter-nal wheat seed infestation by Rhyzopertha dominica using X-ray imaging. J. Stored Prod. Res. 40:507, 2004.
8. Kirkpatrick, R. L., and Wilbur, D. A. The development and habits of the granary weevil, Sitophilus granarius, within the kernel of wheat. J. Econ. Entomol. 58:979, 1965.
9. Luh, B. S. Rice: Production and Utilization. AVI Publishing Co., Westport, CT, 1980.
10. Pearson, T., and Brabec, D. L. Detection of wheat kernels with hid-den insect infestations with an electrically conductive roller mill. Appl. Eng. Agric. 23:639, 2007.
11. Pearson, T. C., Brabec, D. L., and Schwartz, C. R. Automated detec-tion of internal insect infestations in whole wheat kernels using a Perten SKCS 4100. Appl. Eng. Agric. 19:727, 2003.
12. Perez-Mendoza, J., Flinn, P. W., Campbell, J. F., Hagstrum, D. W., and Throne, J. E. Detection of stored-grain insect infestation in wheat transported in railroad hopper-cars. J. Econ. Entomol. 97:1474, 2004.
13. USDA-GIPSA. Rice Inspection Handbook. Published online at www. gipsa.usda.gov/Publications/fgis/handbooks/rice_insphb.html. U.S. Department of Agriculture, Federal Grain Inspection Service, Washington, DC, 2006.
14. USDA-NASS. Statistics by subject: Rice. Published online at www. nass.usda.gov/Statistics_by_Subject/index.php?sector=CROPS. U.S. Department of Agriculture, National Agricultural Statistical Service, Washington, DC, 2011.
Table IV. Average conductance signal, maximum derivative signal (dV/dt), and feed rates for the modified conductance mill for noninfested long (LBR), medium (MBR), and short (SBR) grain brown rice kernels at various moisture levelsa
LBR MBR SBR Moisture (%)
Signal (mean)
dV/dt (max)
Feed Rate (sec/500 g)
Signal (mean)
dV/dt (max)
Feed Rate (sec/500 g)
Signal (mean)
dV/dt (max)
Feed Rate (sec/500 g)
12.2 1.3 0.2 206 1.7 0.2 180 1.4 0.1 190 13.2 3.8 0.2 176 4.4 0.3 170 4.1 0.2 170 14.2 9.0 0.6 162 18.3 0.8 138 12.5 0.8 144 15.2 23.1 0.8 156 39.4 1.1 130 30.3 1.2 130 a Conductance signal mean was 0.2% while empty (no grain). Signal mean and dV/dt values are percentages of the full scale.


![Untitled 2 [] · /01-!." *23-!." 456-!." *+,-!7" /01-!7" *23-!7" 456-!7" *+,-#!" /01-#!" *23-#!" 456-#!" *+,-##" /01-##" *23-##" 456-##" *+,-#$" /01-#$" *23-#$" 456-#$" *+,-#%" /01](https://static.documents.pub/doc/80x56/5f2f2b6ad0823628e27434f2/untitled-2-01-23-456-7-01-7.jpg)
![Welcome to DrRacket, version 6.1 [3m]. Language: slideshow ...richter/11-7-2014.pdfNov 07, 2014 · 123 456 789 4 2 123 456 789 5 123 456 789 9 123 456 789 7 7 123 456 789 1 456 789](https://static.documents.pub/doc/80x56/5fd9df3a07c10b0ee2107e89/welcome-to-drracket-version-61-3m-language-slideshow-richter11-7-2014pdf.jpg)


