48 Charles Street Berkeley Square London W1J 5EN T: +44 (0)20 7529 5400 F: +44 (0)20 7529 5401 London Paris New York San Francisco 11 February 2013 Fund Raising for European Technology Companies State of the Nation
This communication has been approved and issued by Go4Venture Advisers LLP., which is authorised and regulated by the Financial Services Authority. It may therefore be issued to Professional Clients. In addition, this promotion may be issued to persons who are deemed to be exempt under the Financial Services and Markets Act 2000 (Financial Promotions) Order because they meet the criteria to be classified as investment professionals, high net worth individuals, certified or self certified sophisticated investors or associations of such persons. No reliance should be placed on this document by persons who do not meet these criteria and persons who do not have investment experience should seek professional advice. Reliance on this promotion for the purpose of engaging in any investment activity may expose an individual to a significant risk of losing all of the property or other assets invested. The information contained herein does not constitute an offer to sell or the solicitation of any offer to buy or sell securities and may not be reproduced, further distributed or published by any recipient without prior permission from Go4Venture Advisers LLP. The information and opinions contained in this document are for background purposes only and do not purport to be full or complete. Nor does this document constitute investment advice.
No representation, warranty, or undertaking, express or otherwise is given as to the accuracy or completeness of the information or opinions contained in this document by Go4Venture Advisers LLP or its employees and no liability is accepted by such persons for the accuracy or completeness of any information or opinions. As such, no reliance may be placed on the information and opinions contained in this document.
Registered address: 10 Wellington Street, Cambridge, CB1 1HWLimited Liability Partnership Incorporated in England No. OC336611Authorised and Regulated by the Financial Services Authority
February 2013Page 3
CONFIDENTIAL
Just under 12,000 monthly subscribers, spanning
investors, trade buyers and finance professionals
Proprietary index capturing the level of activity in
European technology investment
Summary of M&A activity of European VC and PE-
backed companies
Authoritative editorial on private investments’ activity
and market trends
First published on October 4, 2004
Monthly European Technology Private Transactions Bulletin
About Go4Venture Advisers
February 2013Page 4
CONFIDENTIAL
1. European Venture Investment Activity
2. European Venture Investors
Contents
February 2013Page 5
CONFIDENTIAL
Roughly in line with 2011 for H1 2012, before overtaking as most active year since 2008 Total investment 27% by value higher than 2011, at €3.18bn, a 96% increase since 2009. Average deal size has increased 47% between 2009 and 2012, from €5.0mn to €7.3mn. More landmark (>= €20mn) transactions, 68% CAGR since low of 2009, to 38 deals in
2012 – representing 63% of all Large HTI transactions by value.
Investors wary of taking on risk and investing in development-stage companies Significant increase in the proportion of less risky later stage investments since 2009 by deal
value, from around 35% of deal value to over 42%. Corresponding decrease in early stage investment amounts.
Little change in deal numbers by stage, supporting the trend seen for larger average investment sizes.
Later Stage Deals Driving Investment
2009 2010 2011 20120%
10%
20%
30%
40%
50%
60%
70%
80%
90%
100%
Late-StageMid-StageEarly Stage
Shar
e of
Dea
ls by
Valu
e
Source: VentureSource
February 2013Page 7
CONFIDENTIAL
Six countries/regions represented 87% of investments by value in 2012 Traditional investment centres of the UK and France (44% combined). Significant and increasing investments in Germany, Russia, Scandinavia and Switzerland
– with Germany overtaking France for the first time in the HTI investment league table.
Germany and Russia emerging as new highly active venture markets Germany up from 12% of total deal value in 2009 to 19% in 2012. Russia up from 0% in 2009 to 8% in 2012. Corresponding reduced emphasis on UK (peak of 40% in 2010, to 30% in 2012) and
Continued strong sectorial spread of investments, led by the internet juggernaut Internet Services: e-tailing, online ads, local directory services, online service provision, etc. Digital Media: music streaming services, social media, news portals, online gaming, etc. Supporting Technologies: mobile apps and platforms, SaaS offerings, Big Data analytics, etc.
Internet Driving European Venture Investment
Internet services Digital Media Software Hardware Cleantech0%
5%
10%
15%
20%
25%
30%
35%
40%
45%
50%
2009
2010
2011
2012
Winners Losers
Source: Go4Venture Advisers LLP, HTI Database
These sectors exhibit various attractive characteristics Rapidly scalable businesses. International expansion
prospects, through ability to rapidly adapt products to new markets.
Low capital intensity.
Strong drop off in more traditional sectors Hardware (capital intensive) . Cleantech (long payback
periods).
February 2013Page 9
CONFIDENTIAL
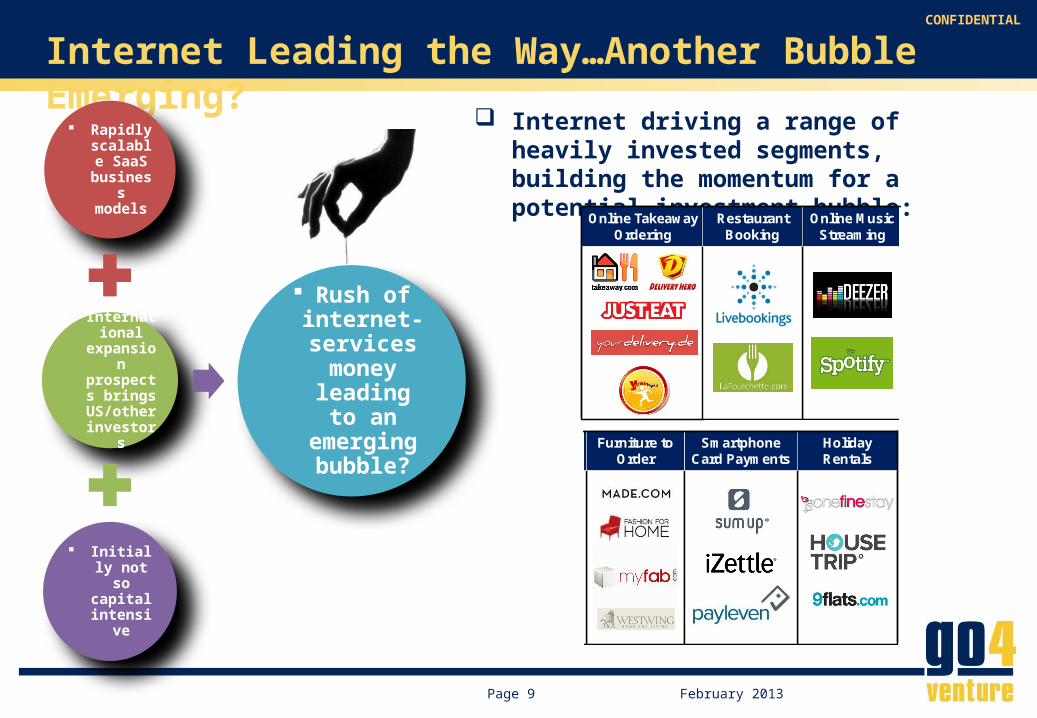
Internet driving a range of heavily invested segments, building the momentum for a potential investment bubble:
Internet Leading the Way…Another Bubble Emerging?
Rapidly scalable
SaaS business models
International
expansion
prospects brings
US/other investors
Initially not so capital
intensive
Rush of internet-services money
leading to an
emerging bubble?
Holiday Rentals
Smartphone Card Payments
Online Music Streaming
Online Takeaway Ordering
Furniture to Order
Restaurant Booking
Holiday Rentals
Smartphone Card Payments
Online Music Streaming
Online Takeaway Ordering
Furniture to Order
Restaurant Booking
February 2013Page 10
CONFIDENTIAL
1. European Venture Investment Activity
2. European Venture Investors
Contents
February 2013Page 11
CONFIDENTIAL
More cross-border transactions occurring Until recently, insular investment market, e.g. 86% of German VC investments in Germany.
This is now changing:
In-part fuelled by the rise of the German and Russian venture markets. This has included French and British firms investing in Germany’s rising internet scene, as well as Russian firms making bold moves into Western Europe.
US and Nordic firms are also increasingly investing across Europe.
Number of HTI transactions having no foreign investors has dropped from ~50% in 2009 to become a minority at 38% in 2012.
More Cross-Border Investment Activity
No Foreign Investors Single Foreign Investor Multiple Foreign Investors0.0%
10.0%
20.0%
30.0%
40.0%
50.0%
60.0%
2009201020112012
Source: Go4Venture Advisers LLP, HTI Database
February 2013Page 12
CONFIDENTIAL
More Investors but VC Dominance Being Challenged Investor numbers up from 421 in 2009 to 564 in 2012. Decrease in proportion of VCs amongst Large HTI investors from 56% in 2009 to 47% in 2012. Gap being filled by an increasing range of investors, including PE funds, corporate investors,
family offices/hedge funds angels and other opportunistic investors.
Increased presence of US-based VCs investing in Europe Driven by more location-agnostic/scalable internet businesses, with US investors helping to
drive more ambitious international expansion:
Strong financial backing.
Access to large US market.
Supported by London financial centre acting as link between US and Europe.
Both funds with EU presence (e.g. Accel, Benchmark, Intel, Insight) and those flying in (e.g. Canaan Partners, Carmel Ventures, Sequoia, Spark, Summit).
Increasing internationalisation of the European venture market Presence of US investors illustrated with four US VCs in top 10. Two Swedish, one German and one Swiss VC fund in top 10. UK and France poorly represented
Emergence of greater numbers of non-traditional and one-off opportunistic investors Amount invested by the top 10 investors as proportion of total Large HTI investments has
trended downwards through time, from 65% in 2008, to 48% in 2012.
Top 10 Investors Representative of Emerging Trends
Source: Go4Venture Advisers LLP, HTI Database
Rank Investor Country # Investments €mn invested**
1 Index Ventures Sw itzerland 11 197.8
2 Accel USA 9 190.4
3 Balderton Capital UK 7 147.4
4 Greylock USA 5 105.5
5 Northzone Ventures Sw eden 4 102.7
6 Partech International USA 4 43.0
7 IdInvest France 3 142.0
8 Kleiner Perkins Caufield & Byers USA 3 88.2
9 Wellington Partners Germany 3 45.7
10 Creandum Sw eden 3 42.2
TOTAL* 52 1105.1
% of Large HTI Transactions* 48% 48%
*Note may include overlap if more than one of the above investors participated in
the same deals
**Total value of investments participated in, including contribution from co-investors
2009 2010 2011 20120%
10%
20%
30%
40%
50%
60%
70%
Shar
e of
All L
arge
HTI
Tra
nsac
tions
Source: Go4Venture Advisers LLP, HTI Database
February 2013Page 14
CONFIDENTIAL
Wider Ecosystem of Investors Emerging (1 of 3)
More non-traditional investors filling the gap created by decreasing proportion of traditional VC investors
Corporates spending cash reserves and diversifying risk through large venture investments.
Large HTI transactions including at least one corporate increased from 14 in 2009 to 29 in 2012, representing 27% by number of all transactions.
Average Large HTI deal size with at least one corporate backer was €23.8mn in 2012, a significant increase from the €19.2mn observed in 2009.
Significant traditional sectorial preference, with Medical Technology, Hardware, Cleantech and Telecoms heavily invested, at expense of ‘hot’ internet-related sectors.
Growth equity/PE investors in later-stage venture deals, looking for value creation in growth, rather than through leveraged acquisitions.
Large HTI transactions including at least one PE fund increased from 14 in 2009 (21% of total number) to 32 in 2012 (30% of total number).
Increase in the total deal value contribution from 23% to 40%, or €905mn.
Strong international spread: Four US, three UK, two Russian and one Dutch PE fund in top 10.
Rank Investor Country # Investments €mn invested*
1 Hermes GPE UK 3 51.4
2 Fidelity Grow th Partners Europe UK 3 29.3
3 Access Industries USA 2 139.2
4 Goldman Sachs USA 2 112.6
5 Baring Vostok Capital Partners Russia 2 90.0
6 Insight Venture Partners USA 2 83.3
7 Digital Sky Technologies (DST) Russia 2 72.1
8 JP Morgan USA 2 59.6
9 Augmentum Capital UK 2 28.9
10 Parcom Capital Management Netherlands 1 65.0
*Total value of investments participated in, including contribution from co-investors
Source: Go4Venture Advisers LLP, HTI Database
February 2013Page 16
CONFIDENTIAL
Wider Ecosystem of Investors Emerging (3 of 3)
Angel Investors, Family Offices and Hedge Funds, looking for higher returns than in under-performing traditional investment opportunities.
Investments involving angel funds increased from 22 in 2009 to 37 in 2012, involving €154mn worth of total investment, or 5% of all HTI transactions by value.
HTI transactions including a family office or hedge fund increased significantly from four in 2009, to 14 in 2012; 8% of all HTI transactions by value in 2012 (or €239mn), compared to 4% in 2009.
February 2013Page 17
CONFIDENTIAL
1. Market growing But “venture” is now half growth equity
2. Market increasingly driven by large transactions Reflecting focus on late-stage and “momentum” internet plays
3. Focus shifting: Geography: not just UK and France – also Germany, Russia, Nordics and Switzerland Sector: internet (incl. mobile); everything else is suffering
4. Growing number of investors Increasing number of new investors dipping in and out
5. Growing importance of Among VCs: US, French, German, Nordic and Russian funds fishing widely Corporate investors Family offices and PE firms joining in for late-stage
6. For early-stage it is about bootstrapping and FF&F Regression or back to normal?


![Finale 2004 - [Showtime I - Fullscore Harmonie.MUS]£ ã ã bb bb bb # # # # b b bb bb bb bb bb bb 44 44 44 44 44 44 44 44 44 44 44 44 44 44 44 44 44 44 44 44 44 44 4 4 4 4 4 4 4 4](https://static.documents.pub/doc/80x56/5b08e3307f8b9a520e8d5803/finale-2004-showtime-i-fullscore-bb-bb-bb-b-b-bb-bb-bb-bb-bb-bb-44.jpg)


