Page 1
- 496 - - 497 -
���� ������������
Crustal Movements in Kinki and Shikoku Districts ����
�����
Geographical Survey Institute
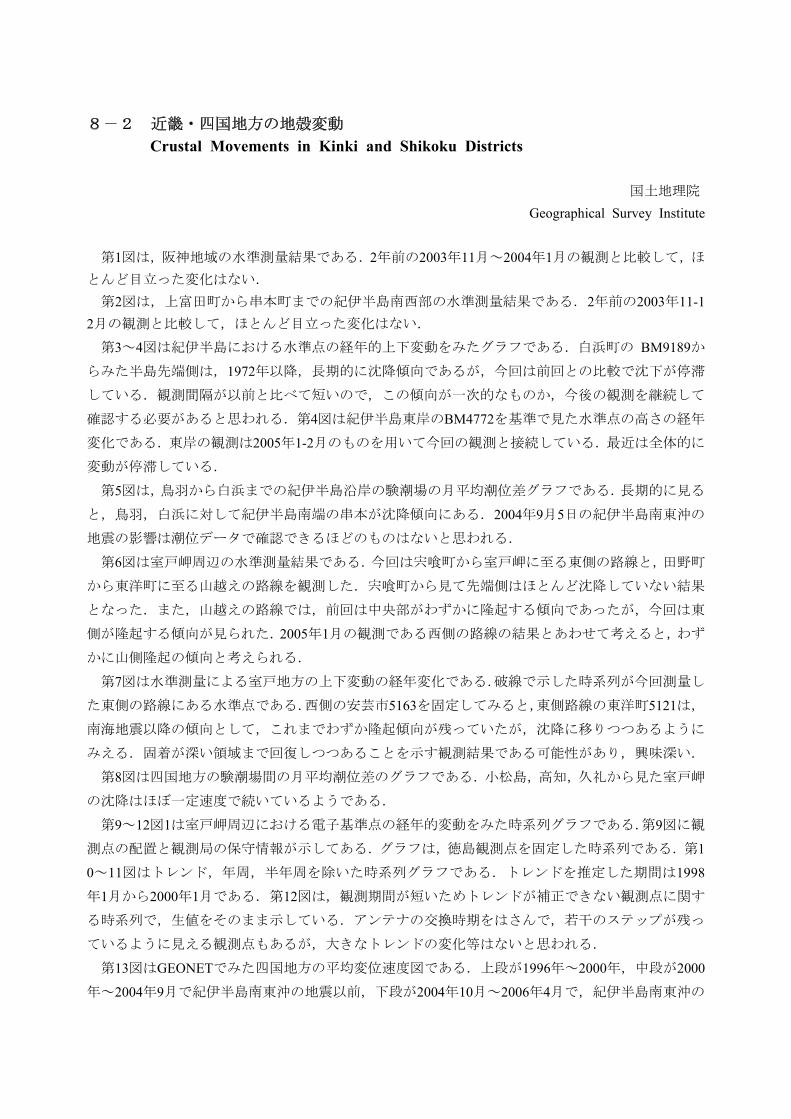
� �1������������������2���2003�11��2004�1������������������������
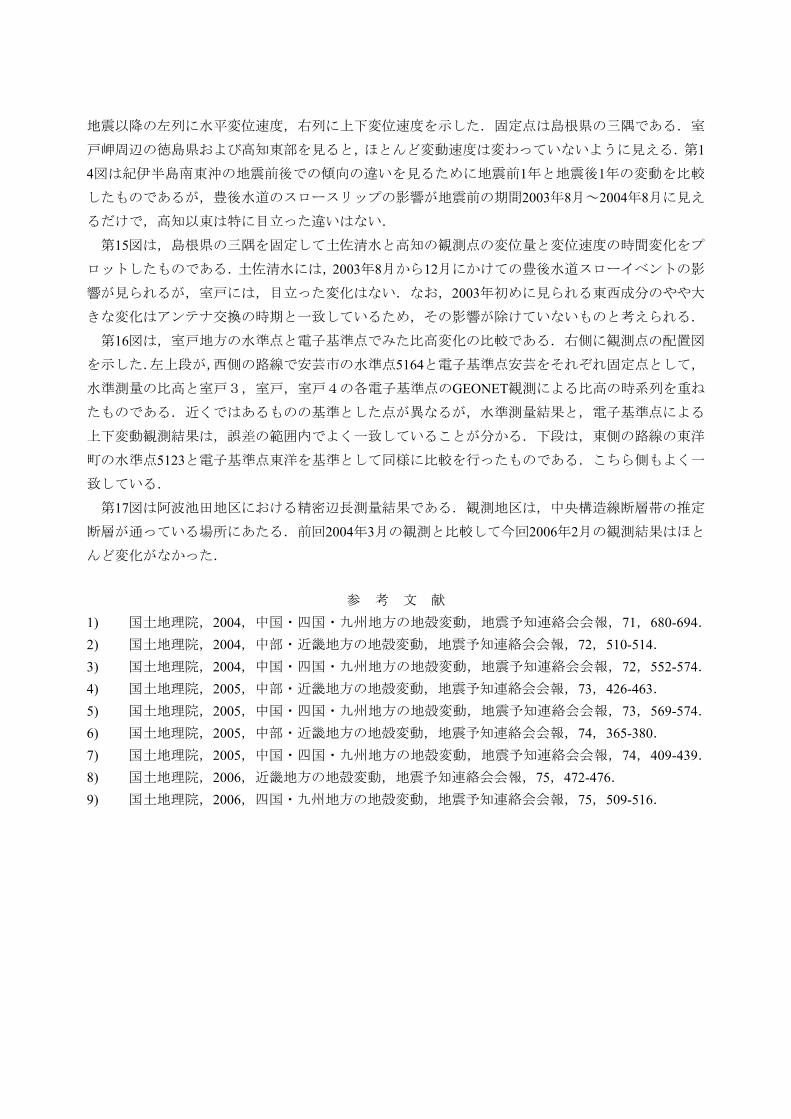
� �2���������������������������������2���2003�11-12������������������������
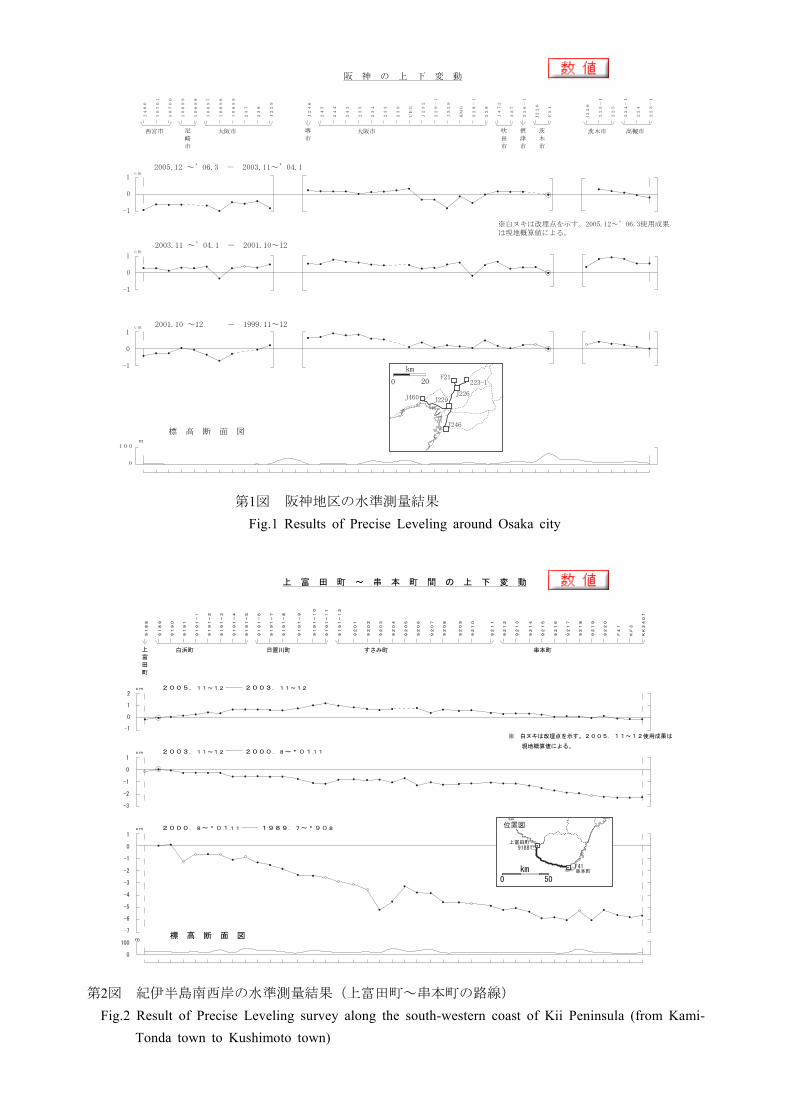
� �3�4����������������������������������� BM9189�
����������1972��������������������������������
��������������������������������������������
����������������4���������BM4772���������������
������������2005�1-2����������������������������
����������
� �5������������������������������������������
�����������������������������2004�9�5����������
�������������������������������
� �6������������������������������������������
��������������������������������������������
��������������������������������������������
��������������2005�1���������������������������
����������������
� �7������������������������������������������
����������������������5163�����������������5121��
��������������������������������������������
��������������������������������������������
� �8������������������������������������������
����������������������
� �9�12�1�����������������������������������9���
��������������������������������������������1
0�11���������������������������������������1998
�1���2000�1������12�����������������������������
��������������������������������������������
�������������������������������������
� �13��GEONET����������������������1996��2000�����2000
��2004�9������������������2004�10��2006�4�����������
Page 2
- 496 - - 497 -
��������������������������������������������
��������������������������������������������1
4������������������������������1�����1�������
�������������������������������2003�8��2004�8����
����������������������
� �15�����������������������������������������
������������������2003�8���12�������������������
��������������������������2003����������������
��������������������������������������������
� �16�����������������������������������������
�����������������������5164��������������������
��������������������������GEONET��������������
��������������������������������������������
��������������������������������������������
�����5123�������������������������������������
������
� �17�����������������������������������������
�����������������2004�3�����������2006�2���������
����������
�� �� �� �
1) ������2004���������������������������71�680-694�2) ������2004������������������������72�510-514�3) ������2004���������������������������72�552-574�4) ������2005������������������������73�426-463�5) ������2005���������������������������73�569-574�6) ������2005������������������������74�365-380�7) ������2005���������������������������74�409-439�8) ������2006���������������������75�472-476�9) ������2006������������������������75�509-516�
Page 3
- 498 - - 499 -
�
�
���
����
��������
����
� ��
��
����
����
�����
�����
�����
�����
�����
�����
�����
���
���
����
����
���
���
���
���
���
���
���
���
����
�����
����
���
�����
���
����
���
�����
����
���
����
�����
���
�����
���
�����
��
��
��
���������
�������������
��� �
�
�
��� �
���� �
�
�
�
�
�
�
�
�
��� ���
������������������������������
���������������������������
����������������������������
���������������������������������������
�
�
��
�
�
��
�
�
��
����
����
����
����
����
������
������
������
������
������
������
������
������
������
�������
�������
�������
����
����
����
����
����
����
����
����
����
����
����
����
����
����
����
����
����
����
����
����
���
���
������
�� ���������� ����������
�� ���������� ������ ��
�� ������ �� ������ �
����������
���������������������������
�
�
�
�
��� ���� ���� ���
����������������������������
���������
� ��
�� ���
�����
���
����
���
��
��
��
��
��
��
��
��
��
��
��
��
��
��
��
��
��
��
����
����
8.������������Crustal Movements in the Kinki and Shikoku Districts
�1�� �����������
Fig.1 Results of Precise Leveling around Osaka city
�2�� ���������������������������Fig.2 Result of Precise Leveling survey along the south-western coast of Kii Peninsula (from Kami-
Tonda town to Kushimoto town)
�3�� ���9189������������������������������Fig.3 Time series of height change of bench marks along the leveling route on the south-west coast
of Kii Peninsula from BM9191-4 (Shirahama) to F41 (Kushimoto) referred to BM9189 (Shirahama)
�4�� ���4772�����������������������������Fig.4 Time series of height change of bench marks along the leveling route on the coast of Kii
Peninsula from BM4738 (Ise) to 9201 (Susami) referred to BM4772 (Kaizan)
�5�� ����������������Fig.5 The difference of Monthly Mean Tide Level, between Tidal stations around Kii Peninsula
�6�a� �������������������������Fig.6a Results of Precise Leveling around Muroto Peninsula (from Aki city to Shishikui town via
Muroto city)
�6�b� ������������������������Fig.6b Results of Precise Leveling around Muroto Peninsula (from Tano town to Toyo town)
�7�� ���5163����������������������������Fig.7 Time series of height change of bench marks along the leveling route on the coast of Muroto
Peninsula from BM5163 (Aki) to via BM5141 (Muroto) to BM5121 (Toyo) referred to BM51 63 (Aki)
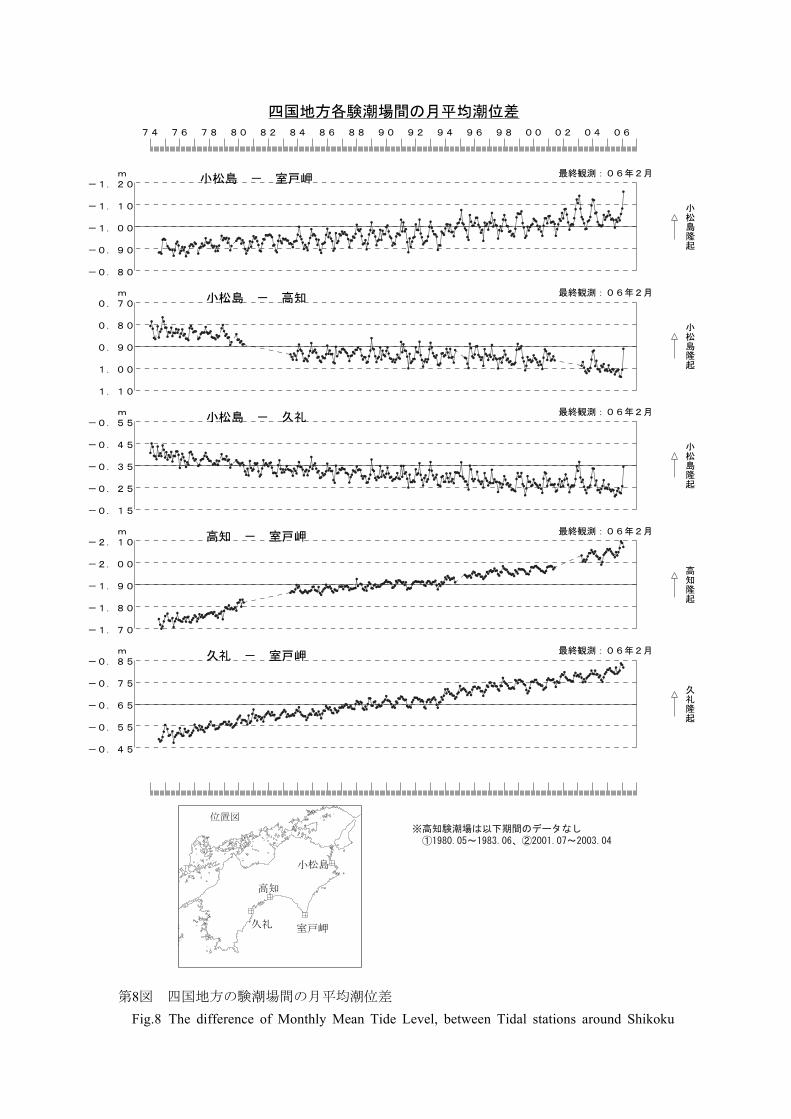
�8�� ����������������Fig.8 The difference of Monthly Mean Tide Level, between Tidal stations around Shikoku
8.������������Crustal Movements in the Kinki and Shikoku Districts
�1�� �����������
Fig.1 Results of Precise Leveling around Osaka city
�2�� ���������������������������Fig.2 Result of Precise Leveling survey along the south-western coast of Kii Peninsula (from Kami-
Tonda town to Kushimoto town)
�3�� ���9189������������������������������Fig.3 Time series of height change of bench marks along the leveling route on the south-west coast
of Kii Peninsula from BM9191-4 (Shirahama) to F41 (Kushimoto) referred to BM9189 (Shirahama)
�4�� ���4772�����������������������������Fig.4 Time series of height change of bench marks along the leveling route on the coast of Kii
Peninsula from BM4738 (Ise) to 9201 (Susami) referred to BM4772 (Kaizan)
�5�� ����������������Fig.5 The difference of Monthly Mean Tide Level, between Tidal stations around Kii Peninsula
�6�a� �������������������������Fig.6a Results of Precise Leveling around Muroto Peninsula (from Aki city to Shishikui town via
Muroto city)
�6�b� ������������������������Fig.6b Results of Precise Leveling around Muroto Peninsula (from Tano town to Toyo town)
�7�� ���5163����������������������������Fig.7 Time series of height change of bench marks along the leveling route on the coast of Muroto
Peninsula from BM5163 (Aki) to via BM5141 (Muroto) to BM5121 (Toyo) referred to BM51 63 (Aki)
�8�� ����������������Fig.8 The difference of Monthly Mean Tide Level, between Tidal stations around Shikoku
Page 4
- 498 - - 499 -
�����������������������������������������������
����
����
����
���
���
���� ���� ���� ���� ���� ���� ����
�
�
������ ������ ����
���� ���� ��
�������
����
����
������������
����
���
���
���������������������������
����
����
���
���
���
���
���
���
���
���� ���� ���� ���� ���� ���� ���� ���� ���� ���� ���� ���� ���� ���� ���� ���� ����
�����
�����
�����
�����
�����
�����
�����
�����
�����
�����
���������������������������������������������
���
���
0 50km
����
��������
����
����
����
�����
�����
����
����
����
8.������������Crustal Movements in the Kinki and Shikoku Districts
�1�� �����������
Fig.1 Results of Precise Leveling around Osaka city
�2�� ���������������������������Fig.2 Result of Precise Leveling survey along the south-western coast of Kii Peninsula (from Kami-
Tonda town to Kushimoto town)
�3�� ���9189������������������������������Fig.3 Time series of height change of bench marks along the leveling route on the south-west coast
of Kii Peninsula from BM9191-4 (Shirahama) to F41 (Kushimoto) referred to BM9189 (Shirahama)
�4�� ���4772�����������������������������Fig.4 Time series of height change of bench marks along the leveling route on the coast of Kii
Peninsula from BM4738 (Ise) to 9201 (Susami) referred to BM4772 (Kaizan)
�5�� ����������������Fig.5 The difference of Monthly Mean Tide Level, between Tidal stations around Kii Peninsula
�6�a� �������������������������Fig.6a Results of Precise Leveling around Muroto Peninsula (from Aki city to Shishikui town via
Muroto city)
�6�b� ������������������������Fig.6b Results of Precise Leveling around Muroto Peninsula (from Tano town to Toyo town)
�7�� ���5163����������������������������Fig.7 Time series of height change of bench marks along the leveling route on the coast of Muroto
Peninsula from BM5163 (Aki) to via BM5141 (Muroto) to BM5121 (Toyo) referred to BM51 63 (Aki)
�8�� ����������������Fig.8 The difference of Monthly Mean Tide Level, between Tidal stations around Shikoku
Page 5
- 500 - - 501 -
8.������������Crustal Movements in the Kinki and Shikoku Districts
�1�� �����������
Fig.1 Results of Precise Leveling around Osaka city
�2�� ���������������������������Fig.2 Result of Precise Leveling survey along the south-western coast of Kii Peninsula (from Kami-
Tonda town to Kushimoto town)
�3�� ���9189������������������������������Fig.3 Time series of height change of bench marks along the leveling route on the south-west coast
of Kii Peninsula from BM9191-4 (Shirahama) to F41 (Kushimoto) referred to BM9189 (Shirahama)
�4�� ���4772�����������������������������Fig.4 Time series of height change of bench marks along the leveling route on the coast of Kii
Peninsula from BM4738 (Ise) to 9201 (Susami) referred to BM4772 (Kaizan)
�5�� ����������������Fig.5 The difference of Monthly Mean Tide Level, between Tidal stations around Kii Peninsula
�6�a� �������������������������Fig.6a Results of Precise Leveling around Muroto Peninsula (from Aki city to Shishikui town via
Muroto city)
�6�b� ������������������������Fig.6b Results of Precise Leveling around Muroto Peninsula (from Tano town to Toyo town)
�7�� ���5163����������������������������Fig.7 Time series of height change of bench marks along the leveling route on the coast of Muroto
Peninsula from BM5163 (Aki) to via BM5141 (Muroto) to BM5121 (Toyo) referred to BM51 63 (Aki)
�8�� ����������������Fig.8 The difference of Monthly Mean Tide Level, between Tidal stations around Shikoku
�����������������
��������������������������������������������������������
�������
����������
���������
�
�����
�����
�����
�����
������������
����
�����������
�
����
����
����
����
�����������
����
�����������
�
����
����
����
����
�����������
����
�����������
�
�����
�����
�����
�����
������������
����
�����������
�
����
����
����
����
�����������
����
�����������
�
����
����
����
����
�����������
����
�����������
�������
��
��
��
��
Page 6
- 501 -
8.������������Crustal Movements in the Kinki and Shikoku Districts
�1�� �����������
Fig.1 Results of Precise Leveling around Osaka city
�2�� ���������������������������Fig.2 Result of Precise Leveling survey along the south-western coast of Kii Peninsula (from Kami-
Tonda town to Kushimoto town)
�3�� ���9189������������������������������Fig.3 Time series of height change of bench marks along the leveling route on the south-west coast
of Kii Peninsula from BM9191-4 (Shirahama) to F41 (Kushimoto) referred to BM9189 (Shirahama)
�4�� ���4772�����������������������������Fig.4 Time series of height change of bench marks along the leveling route on the coast of Kii
Peninsula from BM4738 (Ise) to 9201 (Susami) referred to BM4772 (Kaizan)
�5�� ����������������Fig.5 The difference of Monthly Mean Tide Level, between Tidal stations around Kii Peninsula
�6�a� �������������������������Fig.6a Results of Precise Leveling around Muroto Peninsula (from Aki city to Shishikui town via
Muroto city)
�6�b� ������������������������Fig.6b Results of Precise Leveling around Muroto Peninsula (from Tano town to Toyo town)
�7�� ���5163����������������������������Fig.7 Time series of height change of bench marks along the leveling route on the coast of Muroto
Peninsula from BM5163 (Aki) to via BM5141 (Muroto) to BM5121 (Toyo) referred to BM51 63 (Aki)
�8�� ����������������Fig.8 The difference of Monthly Mean Tide Level, between Tidal stations around Shikoku
� ����
Page 7
- 502 -
8.������������Crustal Movements in the Kinki and Shikoku Districts
�1�� �����������
Fig.1 Results of Precise Leveling around Osaka city
�2�� ���������������������������Fig.2 Result of Precise Leveling survey along the south-western coast of Kii Peninsula (from Kami-
Tonda town to Kushimoto town)
�3�� ���9189������������������������������Fig.3 Time series of height change of bench marks along the leveling route on the south-west coast
of Kii Peninsula from BM9191-4 (Shirahama) to F41 (Kushimoto) referred to BM9189 (Shirahama)
�4�� ���4772�����������������������������Fig.4 Time series of height change of bench marks along the leveling route on the coast of Kii
Peninsula from BM4738 (Ise) to 9201 (Susami) referred to BM4772 (Kaizan)
�5�� ����������������Fig.5 The difference of Monthly Mean Tide Level, between Tidal stations around Kii Peninsula
�6�a� �������������������������Fig.6a Results of Precise Leveling around Muroto Peninsula (from Aki city to Shishikui town via
Muroto city)
�6�b� ������������������������Fig.6b Results of Precise Leveling around Muroto Peninsula (from Tano town to Toyo town)
�7�� ���5163����������������������������Fig.7 Time series of height change of bench marks along the leveling route on the coast of Muroto
Peninsula from BM5163 (Aki) to via BM5141 (Muroto) to BM5121 (Toyo) referred to BM51 63 (Aki)
�8�� ����������������Fig.8 The difference of Monthly Mean Tide Level, between Tidal stations around Shikoku
����
�����
�������
�����
�������
�������
�����
�������
�����
�������
�������
�����
�����
�������
�������
�����
�������
�������
�����
�������
������
�������
�����
�������
�������
�����
�������
�������
�����
�������
�������
�������
�������
�����
�������
�������
�����
�������
�������
�������
�������
�����
�������
�����
�������
�������
�������
�����
�������
�����
�������
�����
�������
�������
�������
�����
�������
�������
�������
�������
�����
�������
�������
�������
�����
�������
�������
�������
�������
�������
����
�� �������� ��������
�� �������� ������� ��
����������
�������������������������
�
�
�
��� ���
�
�
�
�
��
�
�
��
���
���
���
���
���
�
���
�������
����
���
��������������������������������������������������������
����������������������������������
�����������������
Page 8
8.������������Crustal Movements in the Kinki and Shikoku Districts
�1�� �����������
Fig.1 Results of Precise Leveling around Osaka city
�2�� ���������������������������Fig.2 Result of Precise Leveling survey along the south-western coast of Kii Peninsula (from Kami-
Tonda town to Kushimoto town)
�3�� ���9189������������������������������Fig.3 Time series of height change of bench marks along the leveling route on the south-west coast
of Kii Peninsula from BM9191-4 (Shirahama) to F41 (Kushimoto) referred to BM9189 (Shirahama)
�4�� ���4772�����������������������������Fig.4 Time series of height change of bench marks along the leveling route on the coast of Kii
Peninsula from BM4738 (Ise) to 9201 (Susami) referred to BM4772 (Kaizan)
�5�� ����������������Fig.5 The difference of Monthly Mean Tide Level, between Tidal stations around Kii Peninsula
�6�a� �������������������������Fig.6a Results of Precise Leveling around Muroto Peninsula (from Aki city to Shishikui town via
Muroto city)
�6�b� ������������������������Fig.6b Results of Precise Leveling around Muroto Peninsula (from Tano town to Toyo town)
�7�� ���5163����������������������������Fig.7 Time series of height change of bench marks along the leveling route on the coast of Muroto
Peninsula from BM5163 (Aki) to via BM5141 (Muroto) to BM5121 (Toyo) referred to BM51 63 (Aki)
�8�� ����������������Fig.8 The difference of Monthly Mean Tide Level, between Tidal stations around Shikoku
室戸地方の各水準点の経年変化 水準点5163基準(1896年)
����
����
����
����
���
���
���
���
���
���
���
���
���
���
���
���� ���� ���� ���� ���� ���� ���� ���� ���� ���� ���� ���� ����
�
�
51415140513751445148515151315127515551595121
��������������������
51635121安芸市
室戸市
東洋町
51595155515151485144
51275131513751405141
- 503 -
Page 9
- 504 - - 505 -
8.������������Crustal Movements in the Kinki and Shikoku Districts
�1�� �����������
Fig.1 Results of Precise Leveling around Osaka city
�2�� ���������������������������Fig.2 Result of Precise Leveling survey along the south-western coast of Kii Peninsula (from Kami-
Tonda town to Kushimoto town)
�3�� ���9189������������������������������Fig.3 Time series of height change of bench marks along the leveling route on the south-west coast
of Kii Peninsula from BM9191-4 (Shirahama) to F41 (Kushimoto) referred to BM9189 (Shirahama)
�4�� ���4772�����������������������������Fig.4 Time series of height change of bench marks along the leveling route on the coast of Kii
Peninsula from BM4738 (Ise) to 9201 (Susami) referred to BM4772 (Kaizan)
�5�� ����������������Fig.5 The difference of Monthly Mean Tide Level, between Tidal stations around Kii Peninsula
�6�a� �������������������������Fig.6a Results of Precise Leveling around Muroto Peninsula (from Aki city to Shishikui town via
Muroto city)
�6�b� ������������������������Fig.6b Results of Precise Leveling around Muroto Peninsula (from Tano town to Toyo town)
�7�� ���5163����������������������������Fig.7 Time series of height change of bench marks along the leveling route on the coast of Muroto
Peninsula from BM5163 (Aki) to via BM5141 (Muroto) to BM5121 (Toyo) referred to BM51 63 (Aki)
�8�� ����������������Fig.8 The difference of Monthly Mean Tide Level, between Tidal stations around Shikoku
�������
�
�
�
���
����
�
�
���
��
�
��
�
�
�
�
�
�
�
������������������������������������������������������
������������������ �� �� �� �� �� �� �� �� �� �� �� �� �� �� �� ��
����������
���������
�
�����
�����
�����
�����
��������������
�����
����������
�
����
����
����
����
������������
�����
����������
�
�����
�����
�����
�����
�������������
�����
����������
�
�����
�����
�����
�����
�������������
����
����������
�
�����
�����
�����
�����
�������������
����
����������
Page 10
- 504 - - 505 -
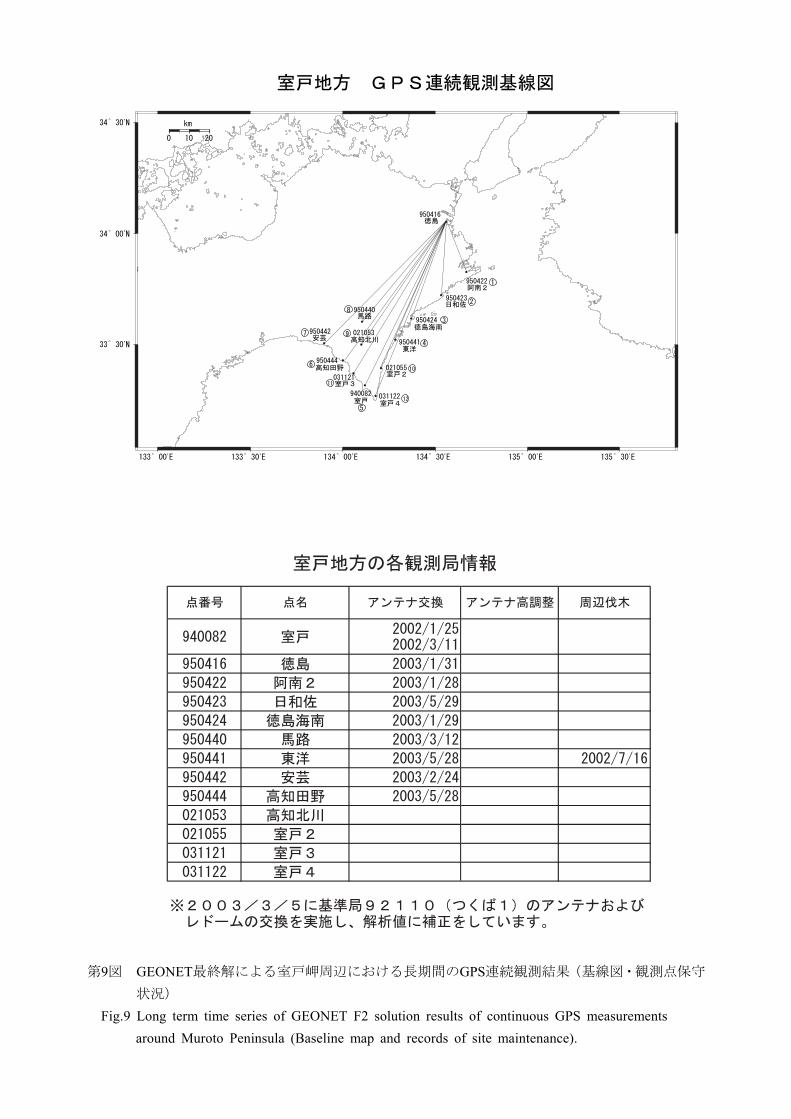
�9�� GEONET�������������������GPS�������������������
Fig.9 Long term time series of GEONET F2 solution results of continuous GPS measurements around Muroto Peninsula (Baseline map and records of site maintenance).
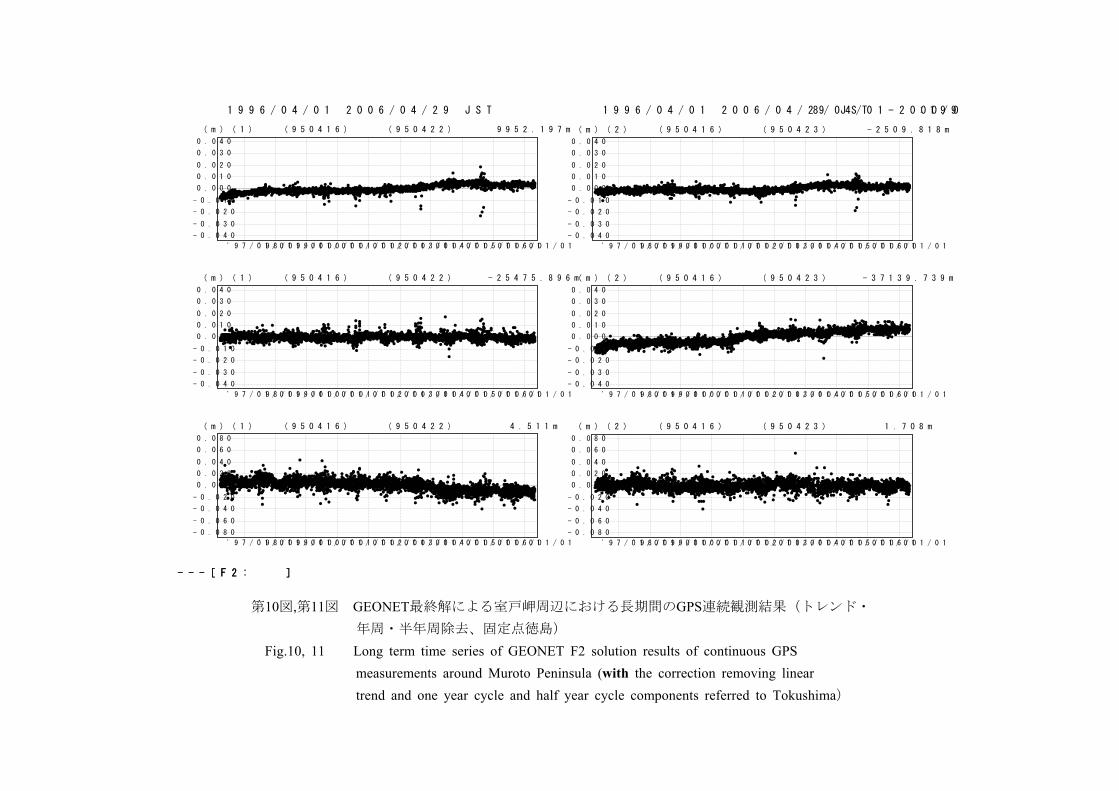
�10�,�11�� GEONET�������������������GPS���������������������������
Fig.10, 11 Long term time series of GEONET F2 solution results of continuous GPS measurements around Muroto Peninsula (with the correction removing linear trend and one year cycle and half year cycle components referred to Tokushima�
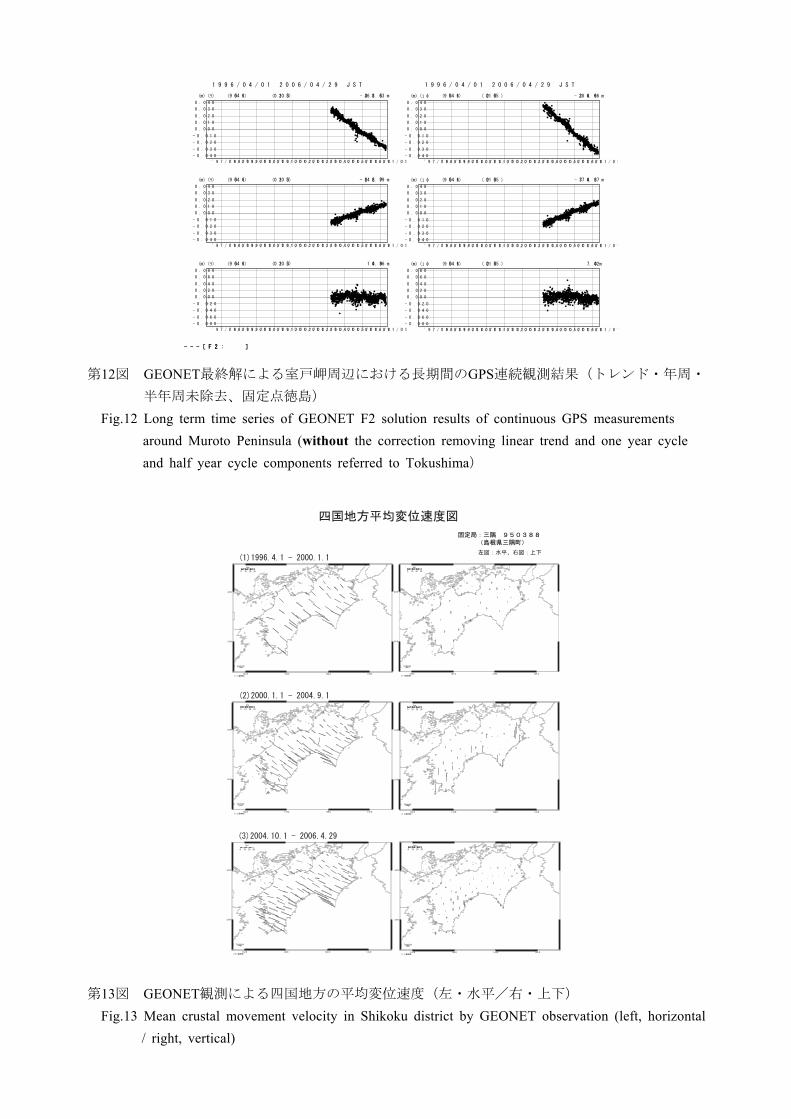
�12�� GEONET�������������������GPS����������������������������
Fig.12 Long term time series of GEONET F2 solution results of continuous GPS measurements around Muroto Peninsula (without the correction removing linear trend and one year cycle and half year cycle components referred to Tokushima�
�13�� GEONET���������������������������Fig.13 Mean crustal movement velocity in Shikoku district by GEONET observation (left, horizontal
/ right, vertical)
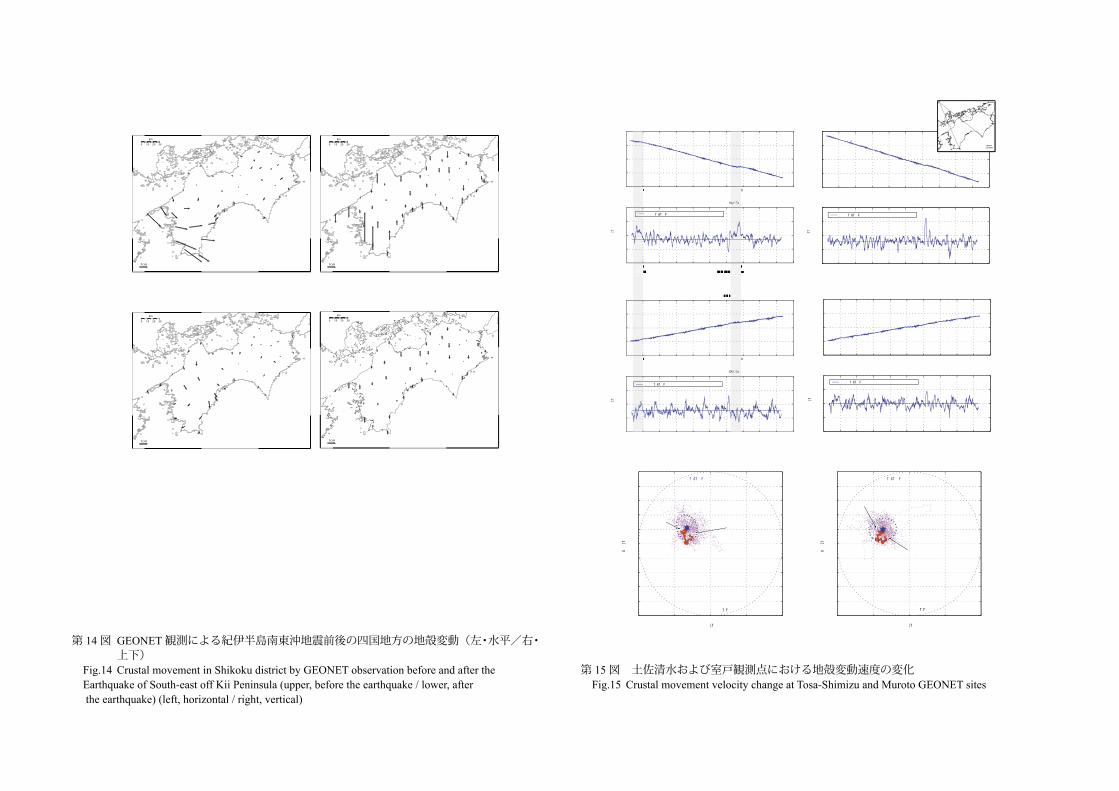
�14�� GEONET�������������������������������������Fig.14 Crustal movement in Shikoku district by GEONET observation before and after the
Earthquake of South-east off Kii Peninsula (upper, before the earthquake / lower, after the earthquake) (left, horizontal / right, vertical)
�15�� �������������������������Fig.15 Crustal movement velocity change at Tosa-Shimizu and Muroto GEONET sites
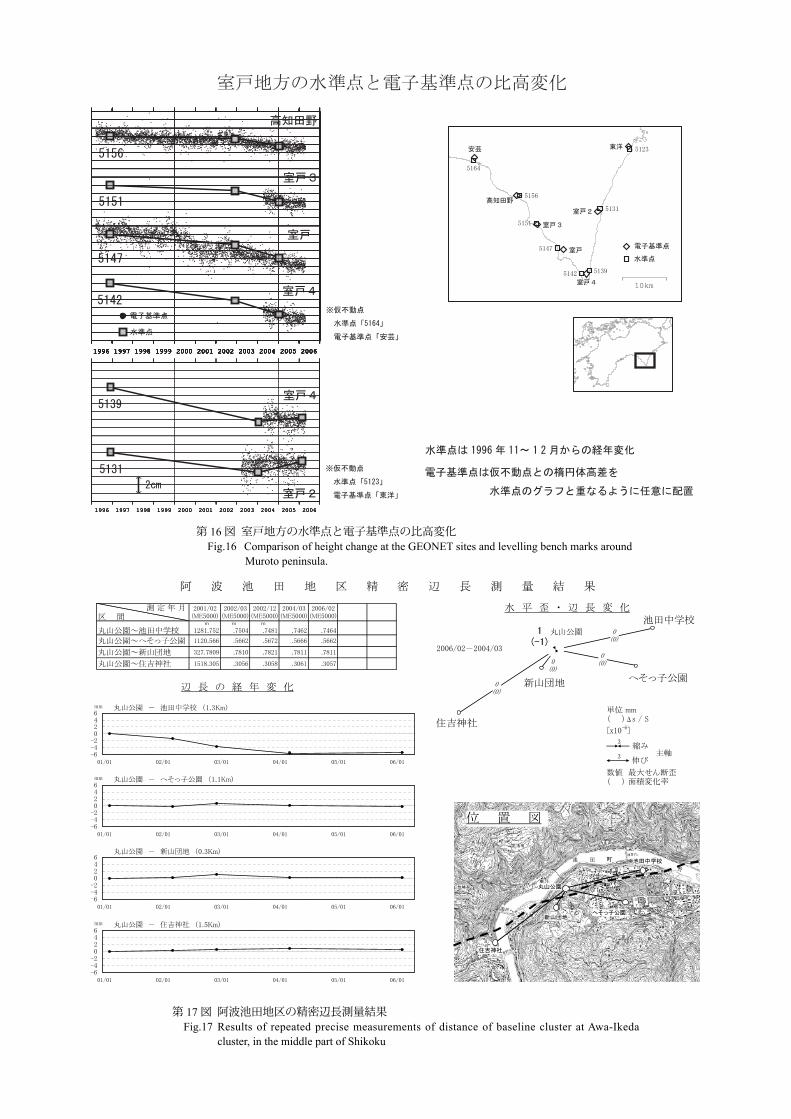
�16�� �������������������Fig.16 Comparison of height change at the GEONET sites and levelling bench marks around
Muroto peninsula.
�17�� ���������������Fig.17 Results of repeated precise measurements of distance of baseline cluster at Awa-Ikeda cluster,
in the middle part of Shikoku
���������������
��������� ��������� ��������� ��������� ��������� ���������
��������
��������
��������
� �� ��
��
������
������
�
������
������
������
������
������ ������
������������
������
������ ������
��
���
���
����
��
��
�� ����
�������
���
�� ���
��
��
��
��
���
���
��
��
��
���
���
��
������ ��������������������
������ �� ���������
������ ��� ���������
������ ��� ���������
������ ���� ���������
������ �� ���������
������ �� ��������� ���������
������ �� ���������
������ ���� ���������
������ ����
������ ���
������ ���
������ ���
����������������������������������������������������������
�����������
��� �� ������� ����������
Page 11
- 506 -
�9�� GEONET�������������������GPS�������������������
Fig.9 Long term time series of GEONET F2 solution results of continuous GPS measurements around Muroto Peninsula (Baseline map and records of site maintenance).
�10�,�11�� GEONET�������������������GPS���������������������������
Fig.10, 11 Long term time series of GEONET F2 solution results of continuous GPS measurements around Muroto Peninsula (with the correction removing linear trend and one year cycle and half year cycle components referred to Tokushima�
�12�� GEONET�������������������GPS����������������������������
Fig.12 Long term time series of GEONET F2 solution results of continuous GPS measurements around Muroto Peninsula (without the correction removing linear trend and one year cycle and half year cycle components referred to Tokushima�
�13�� GEONET���������������������������Fig.13 Mean crustal movement velocity in Shikoku district by GEONET observation (left, horizontal
/ right, vertical)
�14�� GEONET�������������������������������������Fig.14 Crustal movement in Shikoku district by GEONET observation before and after the
Earthquake of South-east off Kii Peninsula (upper, before the earthquake / lower, after the earthquake) (left, horizontal / right, vertical)
�15�� �������������������������Fig.15 Crustal movement velocity change at Tosa-Shimizu and Muroto GEONET sites
�16�� �������������������Fig.16 Comparison of height change at the GEONET sites and levelling bench marks around
Muroto peninsula.
�17�� ���������������Fig.17 Results of repeated precise measurements of distance of baseline cluster at Awa-Ikeda cluster,
in the middle part of Shikoku
-0.040
-0.030
-0.020
-0.010
0.000
0.010
0.020
0.030
0.040
'97/01/01'98/01/01'99/01/01'00/01/01'01/01/01'02/01/01'03/01/01'04/01/01'05/01/01'06/01/01
(m) (1) 徳島(950416)→阿南2(950422) 東西 基準値:9952.197m
-0.040
-0.030
-0.020
-0.010
0.000
0.010
0.020
0.030
0.040
'97/01/01'98/01/01'99/01/01'00/01/01'01/01/01'02/01/01'03/01/01'04/01/01'05/01/01'06/01/01
(m) (1) 徳島(950416)→阿南2(950422) 南北 基準値:-25475.896m
-0.080
-0.060
-0.040
-0.020
0.000
0.020
0.040
0.060
0.080
'97/01/01'98/01/01'99/01/01'00/01/01'01/01/01'02/01/01'03/01/01'04/01/01'05/01/01'06/01/01
(m) (1) 徳島(950416)→阿南2(950422) 比高 基準値:4.511m
-0.040
-0.030
-0.020
-0.010
0.000
0.010
0.020
0.030
0.040
'97/01/01'98/01/01'99/01/01'00/01/01'01/01/01'02/01/01'03/01/01'04/01/01'05/01/01'06/01/01
(m) (2) 徳島(950416)→日和佐(950423) 東西 基準値:-2509.818m
-0.040
-0.030
-0.020
-0.010
0.000
0.010
0.020
0.030
0.040
'97/01/01'98/01/01'99/01/01'00/01/01'01/01/01'02/01/01'03/01/01'04/01/01'05/01/01'06/01/01
(m) (2) 徳島(950416)→日和佐(950423) 南北 基準値:-37139.739m
-0.080
-0.060
-0.040
-0.020
0.000
0.020
0.040
0.060
0.080
'97/01/01'98/01/01'99/01/01'00/01/01'01/01/01'02/01/01'03/01/01'04/01/01'05/01/01'06/01/01
(m) (2) 徳島(950416)→日和佐(950423) 比高 基準値:1.708m
傾斜・半年周・年周補正グラフ 傾斜・半年周・年周補正グラフ期間:1996/04/01~2006/04/29 JST 期間:1996/04/01~2006/04/29 JST計算期間:1998/04/01-2000/01/01
● ---[F2:最終解] ● ---[F2:最終解] 国土地理院
Page 12
- 506 - - 507 -
�9�� GEONET�������������������GPS�������������������
Fig.9 Long term time series of GEONET F2 solution results of continuous GPS measurements around Muroto Peninsula (Baseline map and records of site maintenance).
�10�,�11�� GEONET�������������������GPS���������������������������
Fig.10, 11 Long term time series of GEONET F2 solution results of continuous GPS measurements around Muroto Peninsula (with the correction removing linear trend and one year cycle and half year cycle components referred to Tokushima�
�12�� GEONET�������������������GPS����������������������������
Fig.12 Long term time series of GEONET F2 solution results of continuous GPS measurements around Muroto Peninsula (without the correction removing linear trend and one year cycle and half year cycle components referred to Tokushima�
�13�� GEONET���������������������������Fig.13 Mean crustal movement velocity in Shikoku district by GEONET observation (left, horizontal
/ right, vertical)
�14�� GEONET�������������������������������������Fig.14 Crustal movement in Shikoku district by GEONET observation before and after the
Earthquake of South-east off Kii Peninsula (upper, before the earthquake / lower, after the earthquake) (left, horizontal / right, vertical)
�15�� �������������������������Fig.15 Crustal movement velocity change at Tosa-Shimizu and Muroto GEONET sites
�16�� �������������������Fig.16 Comparison of height change at the GEONET sites and levelling bench marks around
Muroto peninsula.
�17�� ���������������Fig.17 Results of repeated precise measurements of distance of baseline cluster at Awa-Ikeda cluster,
in the middle part of Shikoku
-0.040
-0.030
-0.020
-0.010
0.000
0.010
0.020
0.030
0.040
'97/01/01'98/01/01'99/01/01'00/01/01'01/01/01'02/01/01'03/01/01'04/01/01'05/01/01'06/01/01
(m) (9) 徳島(950416)→高知北川(021053) 東西 基準値:-42683.653m
-0.040
-0.030
-0.020
-0.010
0.000
0.010
0.020
0.030
0.040
'97/01/01'98/01/01'99/01/01'00/01/01'01/01/01'02/01/01'03/01/01'04/01/01'05/01/01'06/01/01
(m) (9) 徳島(950416)→高知北川(021053) 南北 基準値:-62426.979m
-0.080
-0.060
-0.040
-0.020
0.000
0.020
0.040
0.060
0.080
'97/01/01'98/01/01'99/01/01'00/01/01'01/01/01'02/01/01'03/01/01'04/01/01'05/01/01'06/01/01
(m) (9) 徳島(950416)→高知北川(021053) 比高 基準値:104.986m
-0.040
-0.030
-0.020
-0.010
0.000
0.010
0.020
0.030
0.040
'97/01/01'98/01/01'99/01/01'00/01/01'01/01/01'02/01/01'03/01/01'04/01/01'05/01/01'06/01/01
(m) (10) 徳島(950416)→室戸2(021055) 東西 基準値:-32864.966m
-0.040
-0.030
-0.020
-0.010
0.000
0.010
0.020
0.030
0.040
'97/01/01'98/01/01'99/01/01'00/01/01'01/01/01'02/01/01'03/01/01'04/01/01'05/01/01'06/01/01
(m) (10) 徳島(950416)→室戸2(021055) 南北 基準値:-73764.267m
-0.080
-0.060
-0.040
-0.020
0.000
0.020
0.040
0.060
0.080
'97/01/01'98/01/01'99/01/01'00/01/01'01/01/01'02/01/01'03/01/01'04/01/01'05/01/01'06/01/01
(m) (10) 徳島(950416)→室戸2(021055) 比高 基準値:7.402m
成分変化グラフ 成分変化グラフ期間:1996/04/01~2006/04/29 JST 期間:1996/04/01~2006/04/29 JST
● ---[F2:最終解] ● ---[F2:最終解] 国土地理院
��� � ��� � ��� � ��� �
�� �
�� �
� �� �� ��
��
�������
������
��� � ��� � ��� � ��� �
�� �
�� �
� �� �� ��
��
�������
������
��� � ��� � ��� � ��� �
�� �
�� �
� �� �� ��
��
�������
������
��� � ��� � ��� � ��� �
�� �
�� �
� �� �� ��
��
�������
������
�����������
����������������������
����������������������
������������������������
������������������������
�������
�����������
��� � ��� � ��� � ��� �
�� �
�� �
� �� �� ��
��
�������
������
��� � ��� � ��� � ��� �
�� �
�� �
� �� �� ��
��
�������
������
Page 13
- 508 -
基準期間:2004/10/01‐2004/10/30比較期間:2005/10/01‐2005/10/30
基準期間:2003/08/01‐2003/08/30比較期間:2004/08/01‐2004/08/30
室戸地方の水平・上下変動図(傾斜・年周・半年周補正)
国土地理院[F2:最終解]
� �� �� ��
��
☆固定局:三隅(950388)�� �
水平変動 上下変動
水平変動 上下変動
トレンド推定期間:1998/04/01 - 2000/01/01
� �� �� ��
��
☆固定局:三隅(950388)�� �
� �� �� ��
��
☆固定局:三隅(950388)�� �
� �� �� ��
��
☆固定局:三隅(950388)�� �
97 8 99 00 01 02 03 4 05 06 07-0.2
-0.1
0
0.1
0.2
南北成分変位量(使用データ最終日:2006/05
変位量[m]
97 98 99 00 01 02 03 04 05 06 07-0.04
0
0.04
0.08
0.12
南北成分変化率(プロット最終日:2006/
変化率[m/yr]
60日間のデータを1日ずつずらして計算(プロットの位置は計算に用いた期間の中間)
Linear Trend : 1998/04/01-2003/04/01
97 8 99 00 01 02 03 4 05 06 07-0.2
-0.1
0
0.1
0.2
東西成分変位量(使用データ最終日:2006/05/15)
変位量[m]
97 8 99 00 01 02 03 04 05 06 07-0.1
-0.06
-0.02
0.02
0.06
東西成分変化率(プロット最終日:2006/
変化率[m/yr]
間のデータを1日ずつずらして計算(プロットの位置は計算 いた期間の中間)
Linear Trend : 1998/04/01-2003/04/01
基線ベクトル成分の変位量と変化率
三隅(950388)― 土佐清水(940085) 三隅(950388)― 室戸(940082)
98
98
98
60日
5/15)
0
算に用
スローイベントスローイベント
97 98 99 00 01 02 03 04 05 06 07-0.2
-0.1
0
0.1
0.2
東西成分変位量(使用データ最終日:2006/05/15)
変位量[m]
97 98 99 00 01 02 03 04 05 06 07-0.1
-0.06
-0.02
0.02
0.06
東西成分変化率(プロット最終日:2006/04/15)
変化率[m/yr]
60日間のデータを1日ずつずらして計算(プロットの位置は計算に用いた期間の中間)
Linear Trend : 1998/04/01-2003/04/01
97 98 99 00 01 02 03 04 05 06 07-0.2
-0.1
0
0.1
0.2
南北成分変位量(使用データ最終日:2006/05/15)
変位量[m]
97 98 99 00 01 02 03 04 05 06 07-0.06
-0.02
0.02
0.06
0.1
南北成分変化率(プロット最終日:2006/04/15)
変化率[m/yr]
60日間のデータを1日ずつずらして計算(プロットの位置は計算に用いた期間の中間)
Linear Trend : 1998/04/01-2003/04/01
-0.1 -0.05 0 0.05 0.1-0.1
-0.08
-0.06
-0.04
-0.02
0
0.02
0.04
0.06
0.08
0.1
DE[m/yr]DN[m/yr]
★ : Linear Trend 1998/04/01-2003/04/01
平均日数 : 60日間
2006/1/15
2006/4/15
pink(破線):全期間
red(太線) :最近3ヶ月間
-0.1 -0.05 0 0.05 0.1-0.1
-0.08
-0.06
-0.04
-0.02
0
0.02
0.04
0.06
0.08
0.1
DE[m/yr]
DN[m/yr]
★ : Linear Trend 1998/04/01-2003/04/01
平均日数 : 60日間
2006/1/15
2006/4/15
pink(破線):全期間
red(太線) :最近3ヶ月間
水平変化率 水平変化率
�� ��
三隅
土佐清水
室戸
☆
第 14図 GEONET観測による紀伊半島南東沖地震前後の四国地方の地殻変動(左・水平/右・上下)
Fig.14 Crustal movement in Shikoku district by GEONET observation before and after the Earthquake of South-east off Kii Peninsula (upper, before the earthquake / lower, after the earthquake) (left, horizontal / right, vertical)
第 15図 土佐清水および室戸観測点における地殻変動速度の変化Fig.15 Crustal movement velocity change at Tosa-Shimizu and Muroto GEONET sites
Page 14
- 508 - - 509 -
第 16図 室戸地方の水準点と電子基準点の比高変化Fig.16 Comparison of height change at the GEONET sites and levelling bench marks around Muroto peninsula.
第 17図 阿波池田地区の精密辺長測量結果Fig.17 Results of repeated precise measurements of distance of baseline cluster at Awa-Ikeda
cluster, in the middle part of Shikoku
����
����
����
����
����
���� ����
����
��
����
���
��
���
���
������
�����
���
����
���
��
���
���
���
����
����
����
����
����
����
���� ���� � ��� � � ��������
������������������
�������������������������
�������������������
���� ���� ���� ���� ���� ���� ���� ���� ���� ���� �������� ���� ���� ���� ���� ���� ���� ���� ���� ���� �������� ���� ���� ���� ���� ���� ���� ���� ���� ���� �������� ���� ���� ���� ���� ���� ���� ���� ���� ���� �������� ���� ���� ���� ���� ���� ���� ���� ���� ���� �������� ���� ���� ���� ���� ���� ���� ���� ���� ���� �������� ���� ���� ���� ���� ���� ���� ���� ���� ���� �������� ���� ���� ���� ���� ���� ���� ���� ���� ���� �������� ���� ���� ���� ���� ���� ���� ���� ���� ���� �������� ���� ���� ���� ���� ���� ���� ���� ���� ���� �������� ���� ���� ���� ���� ���� ���� ���� ���� ���� �������� ���� ���� ���� ���� ���� ���� ���� ���� ���� �������� ���� ���� ���� ���� ���� ���� ���� ���� ���� ����
�����
����������
����������
�����
����������
����������
�����
���
���
���� ���� ���� ���� ���� ���� ���� ���� ���� ���� �������� ���� ���� ���� ���� ���� ���� ���� ���� ���� �������� ���� ���� ���� ���� ���� ���� ���� ���� ���� �������� ���� ���� ���� ���� ���� ���� ���� ���� ���� �������� ���� ���� ���� ���� ���� ���� ���� ���� ���� �������� ���� ���� ���� ���� ���� ���� ���� ���� ���� ����
��������������������
���������������
���������������
���������������
���������������
���������������
� � ����������� �������� ����� ����� ����� �����
����������� �������� ����� ����� ����� �����
��������� �������� ����� ����� ����� �����
��������� �������� ����� ����� ����� �����
����������
����� ����� ����� ����� ����� �����
�� ��������������������
�����������������������������������������������������
�������������
����������
����� ����� ����� ����� ����� �����
�� ���������������������
����������
����� ����� ����� ����� ����� �����
�������������������
����������
����� ����� ����� ����� ����� �����
�� �������������������
���������������
�������
����
����
����������
�����
�����
����������
����
����
�����
���
����
�����
����
�������
�
�
��
����
���������������
�������������������
���������������


 aliases and, 125 field names and, 15, 76, 125 forms and, 255 parameter queries and, 143 wildcard, 496, 497 A Aberdeen](https://static.documents.pub/doc/80x56/5f0c9d487e708231d43647a1/index-copyrighted-material-wildcard-496-497-squarebrackets-aliases-and-125.jpg)