24
4GEE MOBILE LIVING INDEX Second half 2013 report December 2013

4GEE MOBILE LIVING INDEXSecond half 2013 reportDecember 2013

2
INTRODUCTIONHello, and welcome to the Christmas 2013 edition of the 4GEE Mobile Living Index.We have delved deep into our network to find trends and insights that we think would be of interest. We’ve also interviewed 1,000 of our ever-expanding 4G customer base to find out how they are using our superfast connectivity to do more on the move.
We now have twice as many 4G customers since the first EE Mobile Living Index, and we are seeing patterns emerge that demonstrate the true value of 4G to the people and businesses of Britain.
Most significant is the rapidly growing use of social media over 4G. In six months, social media use has risen from 13% to now represent 18% of our overall 4G network traffic. With 4G, people don’t wait to get home to keep in touch with friends and family via social media.
The Index also shows that 4G is opening up opportunities for consumers and retailers, with a significant increase in the amount of mobile shopping that’s taking place across the network. According to our survey, the number of 4GEE customers set to Christmas shop via mobile will nearly triple because of 4G. It’s a trend that spans the range of EE demographics too, with 13% of pensioners on 4G contracts expecting to do some Christmas shopping on their mobile.
We’ve also looked at other aspects of consumers’ mobile lives, specifically voice calls. Highlighting the continued dominance of mobile we found that four-fifths of consumers say they haven’t used a public phone box over the last five years, and 18% say they haven’t used their home phone. We are seeing this reflected on our network, with a 25% increase in call volumes since the beginning of 2012. And that is why at EE we are committed to delivering a first class voice – as well as data – experience.
I hope you enjoy the latest EE Mobile Living Index and find the information within it useful and interesting. I fully expect that by the next edition, we’ll see people are embracing 4G and using it to make their lives easier, better and more connected.
Olaf Swantee, CEO, EE
CONTENTSProfile of the 4G user 3
4G user behaviour 5
Shop on the hop 9
Evolving behaviour 12
Network usage 17
Network activity 20
METHODOLOGYThe 4GEE Mobile Living Index is a combination of insight and analysis of the EE network and an independent TNS survey of 1,000 4G users. Network information within was gathered throughout H2 2013. TNS conducted the survey of 4GEE customers in October, using telephone research.
Key Findings > 4G users are almost three times as likely to
Christmas shop on their mobile compared to 3G users
> 4G customer demographic is widening: Nearly a third of 4GEE users are now over 45 (vs. 25% at launch)
> 57% of 4GEE customers access the internet via mobile for more than one hour every day, with 21% spending more than three hours online via mobile
> 65% consumers now use their personal devices to work on the move
> 44% of 18-24 year olds have never stepped inside a phone box to make a call
> 18% have never used a home telephone, as people become ever more reliant on their mobiles for voice calls as well as data

PROFILE OF THE 4G USER
4
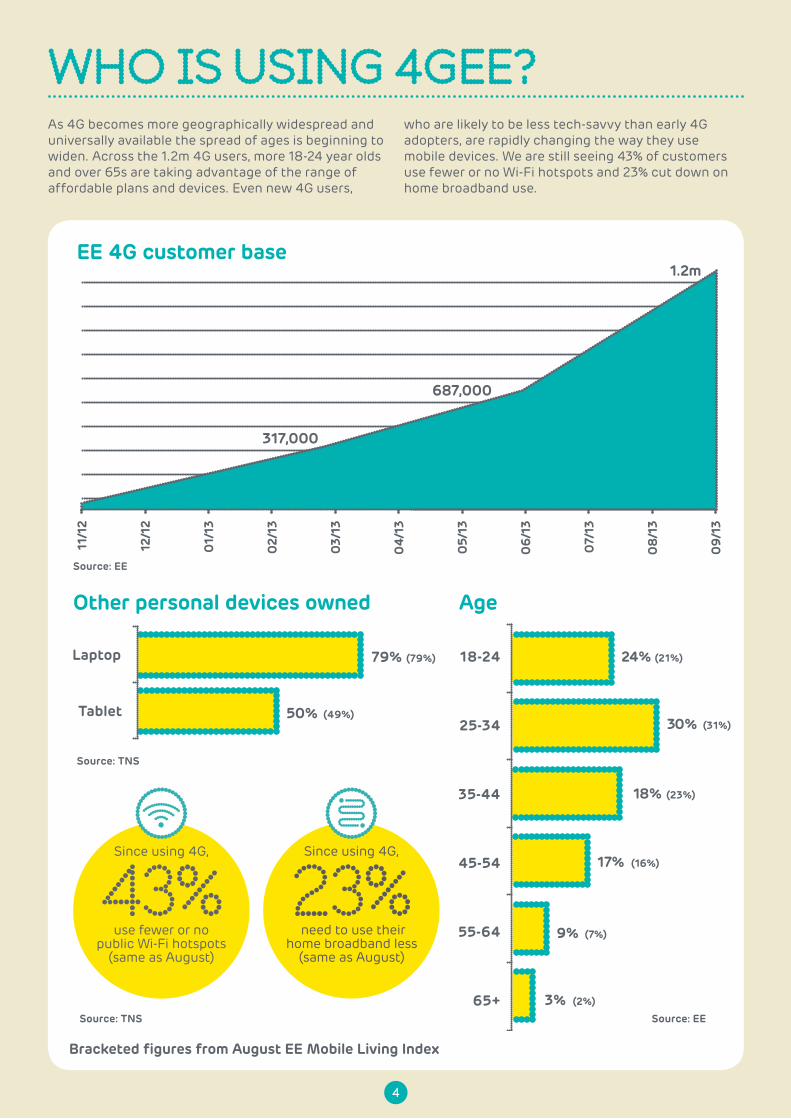
WHO IS USING 4GEE?
Other personal devices owned
79% (79%)
(49%)50%
Laptop
Tablet
As 4G becomes more geographically widespread and universally available the spread of ages is beginning to widen. Across the 1.2m 4G users, more 18-24 year olds and over 65s are taking advantage of the range ofaffordable plans and devices. Even new 4G users,
who are likely to be less tech-savvy than early 4G adopters, are rapidly changing the way they use mobile devices. We are still seeing 43% of customers use fewer or no Wi-Fi hotspots and 23% cut down on home broadband use.
Age
24%
30%
18%
17%
9%
3%
18-24
25-34
35-44
45-54
55-64
65+
(21%)
(31%)
(23%)
(16%)
(7%)
(2%)
23% need to use their
home broadband less(same as August)
Since using 4G,
43%use fewer or no
public Wi-Fi hotspots(same as August)
Since using 4G,
Source: TNS
Source: TNS
Source: EE
11/1
2
12/1
2
01/
13
02/
13
03/
13
04/
13
05/
13
06
/13
07/
13
08
/13
09
/13
317,000
687,000
1.2mEE 4G customer base
Source: EE
Bracketed figures from August EE Mobile Living Index

4G USER BEHAVIOUR

6
4G VS 3G: CONSUMERS SHARE MORE ON 4GIt is a long-held belief that 4G will see mobile beginto dominate social media. So vital is mobile to social media that Facebook’s announcement in October that mobile advertising now accounts for just short of half of the firm’s revenue saw shares soar close to 10%.
There has been a significant shift towardsheavy social media use on 4G. Social media counts
for 18% of all 4G traffic, up from 13% in August,and four percentage points more than on 3G. Users are sharing more photos and videos on the go on social media, and it is even beginning to eat into some of the percentage of overall traffic accounted for by traditional video services. Without having to worry about buffering or waiting for content to load, consumers are doing more, in less time, on social media.
Social media18% (Aug. 13%)
Other10% (Aug. 8%)
File sharing & storage2% (Aug. 2%)
Web browsing & email40% (Aug. 40%)
Music & app downloading & streaming
8% (Aug. 11%)
Video downloading, uploading & streaming
22% (Aug. 26%)
Social media14%
Other14%
File sharing & storage2%
Web browsing & email40%
Music & app downloading & streaming
7%
Video downloading, uploading & streaming
23%
What are people doing with 4G?
What are people doing with 3G?
Source: EE
Source: EE
Bracketed figures from August EE Mobile Living Index

7
FAST, RELIABLE DATA SPEEDS AND BUNDLED CONTENT TRANSFORM MUSIC ON 4GEEFor the first time, we are able to study how 4G usagelooks against the traditional 3G user. Here, acrossfour different types of application (maps, instantmessaging, gaming, and audio) we can see that, overall, 4G user habits are distinct. Though we do see more mapping on 4G in general, the variance betweenapplications used is not vast. iOS Maps is slightly morepopular on 4G due to the preponderance of iPhoneson 4G. In terms of instant messaging, the success ofWhatsApp – a data-driven messaging app that allowsgroups and picture messaging – shines through, witharound 80% of all instant messaging data taking place over the service.
Real variances between 4G and 3G can be seenin audio and gaming applications. In the latter,Playstation and Steam are far more popular on 4G,perhaps due to bundling of services and the slightlyhigher proportion of Windows phones on 3G services.Bundling has a huge impact on audio services, asdoes the consistency of 4G connections. Deezer andSpotify see massive leaps on 4GEE, as users run appsand stream on the go, and also take advantage of the25m songs available with the Deezer add-on, includedwith most 4GEE packages.
Mapping 4G v 3G Gaming 4G v 3G
iOS (Apple) mapsGoogle mapsGoogle earthBing mapsOther
Playstation NetworkSteamXBox LiveOther
64%(57%)
25%(33%)
9%(6%)1%
(2%)
1%(1%)
38%
38%
4%
20%(31%)(38%)
(4%)
(27%)
Instant messaging 4G v 3G Audio 4G v 3G
WhatsAppiMessageOther
HTTP audioDeezerSpotifyOther
79%(82%)
1%(2%)
20%(16%)
45%
35%
5%15%
(80%)
(6%)
(8%)
(5%)
Source: EE
Bracketed figures indicate 3G

8
4G VS 3G: CONSUMERS SWITCH TO DATA-HEAVY APPS ON 4GThere are no major surprises in most popular types of data session over 3G services. Video calling appears relatively high, with three video calling applications in the top ten, because even though there are fewer sessions, the volume of data within each session is comparatively high against normal web browsing (any of the ‘HTTP’ applications).
On 4G, the changes are marked. Social media, as demonstrated on page 7, is driving 4G data use. Facebook and YouTube both rank more highly than on 4G, and both Instagram and Twitter move into the top ten. Music streaming applications Deezer and Spotify also contribute big numbers in terms of data across the 4G network, implying that the 4G user is much more likely to stream music than the 3G user, who may simply revert to music already stored on their mobile device.
Top 20 applications by volume of data 3G
Top 20 applications by volume of data 4G
1 HTTP generic web browsing and email
2 Facebook
3 HTTPS secure web browsing
4 YouTube
5 HTTP video
6 General video calling
7 Google video calling
8 Skype
9 Android market
10 HTTP audio
11 Instagram
12 Twitter
13 Adobe applications
14 File sharing over HTTP
15 MSN webmail
16 iTunes
17 DailyMotion video
18 iMaps
19 WhatsApp
20 Windows Updates
1 HTTP generic web browsing and email
2 Facebook
3 YouTube
4 HTTPS secure web browsing
5 HTTP video
6 Instagram
7 Google video
8 General video calling
9 Twitter
10 HTTP audio
11 Android market
12 Skype
13 Deezer
14 HTTP downloading
15 iMaps
16 iTunes
17 MSN webmail
18 Adobe applications
19 Gmail
20 Spotify
Source: EE

SHOP ON THE HOP

10
WOMEN SPENDING MORE ON MOBILE AS 4G EXPANDS4G is rapidly changing the way people shop online.Increasingly the always online, always mobile, generationis conducting its shopping on-the-go. 66% of 4G usersnow shop on mobile, and 23% shop more since having a4G connection.
Of those that do, it is men that are the big spenders,with nearly a quarter spending more than £200 permonth. Spending among women is rising rapidly, with
nearly double the number spending over £200 (15%)than recorded in the August edition (8%). In fact, whenmen and women results are combined we see a big rise in the percentage spending over £100 (54%, compared with 43% in August).
Again, fashion is the most popular purchase, with 24% of all cash spent on these items.
Amount spent over the past month shopping online using 4G
£201+ £101-£200
£51-£100
£21-£50
£11-£20
£6-£10
£0-£5
Don’tKnow
15%(8%)
20%(24%)
15%(11%)
15%(8%)
17%(15%) 15%
(17%)
22%(19%)
15%(25%)
5%(4%)
4%(13%) 1%
(N/A)1%
(N/A)
5%(N/A)
8%(N/A)
20%(21%)
22%(14%)
Top 10 most popular purchasesFirst half 2013 Second half 2013
1 Fashion Fashion (24% of purchases are fashion)
2 Apps eBay/auction items
3 Entertainment Amazon items
4 Electronics Gifts
5 Books/Magazines Food/Groceries
6 Travel CDs/DVDs
7 Gifts Books/Magazines
8 Automobile accessories Shoes
9 Toys Music
10 Food/Groceries Apps
66%shop on mobile
23%shop on mobile
more since having 4G
Source: TNS
MaleFemale
Bracketed figures from August EE Mobile Living Index

11
SMARTPHONES ARE PUSHING THE CHRISTMAS SHOP ON MOBILEWith Christmas around the corner, we asked 4G usersif they were prepared to shop for Christmas gifts usinga 4G connection. Whereas 15% of users did someChristmas shopping online in 2012, this year morethan a third (39%) expect to buy presents on theirmobile device.
Consumers increasingly trust the security and the quality of experience when shopping on mobile.
With most major retailers now offering mobile-optimised sites, the consistency and speed of a 4G connection is allowingconsumers to browse and spend with confidence. Even 13% of pensioners surveyed plan to shop on mobile for Christmas this year, and a quarter (27%) of those that did spend money on mobile purchases last Christmas expect to spend more this time around. It all means that Santa will have to visit warehouses as much as he will residential areas this year.
50%of those that did
shop on mobile last Christmas spent more than £100
47%of 25-34 year olds
will spend on mobile this Christmas
(and 13% of over 65s)
27%of those that shopped
on mobile last Christmas are set to increase
mobile spend this year
Christmas shopping
Source: TNS
Yes15%
No85%
Yes39%
No61%
Did you Christmas shop on your mobile last year?
Will you Christmas shop on your mobile this year?

EVOLVING BEHAVIOUR

13
THE UK IS MOBILE: 18% OF 4G USERS HAVE NEVER MADE A LANDLINE PHONECALLAs mobile use has accelerated – a TNS survey this year revealed 128% penetration of mobile phones in the UK – so using a mobile over traditional forms of voice communication is becoming the norm. 79% of 4GEE users have not used a phone box for at least five years, of which 24% have never used one at all. Among 18-24 year olds, 44% have never felt the need to use a public phone box.
This pattern of use is mirrored in the home phoneexperience. Though many people have landlines, thenumber using them for voice calls is decreasing. 22%haven’t used a home phone from more than five years,a figure rising to 31% for 18-24 year olds. Conversely,77% of over 65s have used their home phone in thelast week, proving the technology still has a place forthose that have grown-up with it.
Source: TNS
60%
12%
7%
4%
17%
2%4%
17%
55%
22%
When was the last time you used a home phone?
When was the last time you used a public phone box?
Last monthLast yearLast five yearsMore than five yearsNever
50%haven’t used a home
phone in the last week
77%of pensioners have used a home phone
in the last week
22%haven’t used a home phone for more than
five years
31%of 18-24 year olds
haven’t used a home phone for more
than five years
79%haven’t used a
public phone box for more than
five years
44%of 18-24 year olds have never used
a public phone box

14
THE CONSUMER/B2B CROSSOVER: HOW 4G IS ENABLING WORK ON-THE-GOConsumers armed with smartphones have been using them to catch-up on work for some time now. With 4G, consumers are able to fit in work where and when they want. 40% of 4G customers use their smartphone for work every day, whether it be catching-up on emails, sending texts or exchanging large files.
This pattern of use is also reflected on the commute. 18% of 4G users take time on their commute to check work emails, effectively starting the working day earlier as a result. Of those that do something else, the most popular activities are browsing the internet – perhaps catching-up on the morning’s news or gossip – or listening to music. As network stats on page 8 show, that will often be using the Deezer app.
Source: TNS
How often do you use your phone for work?
40%
12%13%
35%
Every dayA few times a weekSometimesNever
What do you do with your phone on your commute?
29%22%
19%17%
10%
18%
8% 7% 5%8%
Browse the internet
Listen tomusic
Use apps Work orcheck work
emails
Make calls Gaming Social networking
Text Read Other

15
THE SOCIAL USER BECOMES THE UNSOCIABLE USERThe ubiquity of mobile phones continues to change the way people act, and our survey shows that, though phone use is widespread, there are still situations where people think a handset should be kept in a pocket or handbag.
Unsurprisingly, though, 4G users are flouting their own rules. Though 31% consider it unacceptable to use a mobile during a meeting, 9% do anyway.
One of the great drivers of mobile phone use is, ofcourse, social media. Comparing this edition with results from the first 4GEE Mobile Living Index, results for how often people use social media sites were fairly flat, with a quarter (24%) still visiting social media sites more than ten times a day.
Source: TNS
How often do you use social media sites during a typical day?
When is it socially unacceptable to use your phone/when do you anyway?
NeverLess than once a day1-2 times a day3-10 times a day11-20 times a dayMore than 20 times a day
When with friends
26%
10%
31%
During meetings
9%
At work
15%
9%
At the cinema
11%
3%
During a meal
20%
4%
At a funeral
10%
2%
7%(6%)
35%(34%)
11%(11%)
13%(15%)
21%(19%)
15%(15%)
Do anywayUnacceptable
Bracketed figures from August EE Mobile Living Index

16
SMARTPHONES ARE PHONES TOOMuch of what consumers do with their mobile devicesis driven by the computing capability of smartphones.Mobile access to the internet is a huge part of howmobile is used. But it isn’t all about data. Buckingperceived trends, consumers are making a growingnumber of phone calls on the EE network. And a higherportion than ever of those calls are taking place on
the 3G layer of the network, in line with the growingpenetration of smartphones and decreasing numberof 2G-only featurephones. Even as phone calls grow inimportance, the dropped call rate on the EE networkis decreasing, and is at a lower rate than at any pointduring 2012.
Source: EE
Number of calls (across the EE network)
25%Number of calls have increased
since the beginning of 2012
36%Dropped calls
in London haveimproved by
since week 31 of 2013
50%3G calls have increased in
number by over
since the beginning of 2012
Q1/11
Num
ber o
f ca
lls
Q2/11 Q3/11 Q4/11 Q1/12 Q2/12 Q3/12 Q4/12 Q1/13 Q2/13 Q3/13 Q4/13
EE Voice trafficEE 3G Voice trafficEE 2G Voice traffic
Quarterly periods in 2011, 2012, and 2013

NETWORK USAGE

18
PORTRAIT OF A MOBILE LIFEHere we look at some of the ways in which customers are accessing the mobile internet and for how long. With the number of 4G users on 4GEE roughly doubling since the last EE Mobile Living Index and the demographic of users widening, it was expected that there may be a fall in the amount of time the average user spends on the internet, due largely to early adopters being more tech savvy.
However, we are still seeing more than one-in-five consumers spending more than three hours a day accessing the internet via mobile. And the number of users doing so for more than five hours has risen to 10%. This coincides with a fall in the number of customers accessing their mobile over Wi-Fi or home broadband, as they continue to substitute the latter service for a consistent 4G experience.
Mobile phone over mobile network
0
10
20
30
40
50
36%(33%)
42%(43%)
12%(14%) 10%
(9%)
Tablet over mobile network50%(48%)
36%(38%)
8%(9%) 6%
(5%)
0
10
20
30
40
50
Mobile over Wi-Fi/ home broadband
32%(30%)
43%(42%)
14%(14%)
10%(13%)
0
10
20
30
40
50
5+ hours 3 – 5 hours1 – 3 hoursLess than 1 hour
5+ hours3 – 5 hours1 – 3 hoursLess than 1 hour
5+ hours3 – 5 hours1 – 3 hoursLess than 1 hour
Source: TNS
Bracketed figures from August EE Mobile Living Index

19
PORTRAIT OF A DIGITAL LIFE
Time spent accessing the internet
5+ hours3-5 hours1-3 hoursLess than one hour
5+ hours3-5 hours1-3 hoursLess than one hour
5+ hours3-5 hours1-3 hoursLess than one hour
5+ hours3-5 hours1-3 hoursLess than one hour
Home broadband use continues to slide among 4G users, with the number spending more than three hours accessing the internet through this sort of connection slipping from 54% to 45%. The same pattern exists in public Wi-Fi, with more customers spending less than an hour a day using the services, perhaps as a result of EE’s 4G rollout moving into areas where public Wi-Fi is scarce.
Using 4G and work broadband, use remained largely stable, indicating that customers are getting their activity completed quickly on mobile networks rather than having to fall-back onto home broadband and public Wi-Fi networks.
What are you doing more of since switching to 4G?
Webbrowsing
GPS-basedservices
Downloading apps
Streamingvideo content
Socialmedia
Downloadingor streaming
music
Using online
banking
Visiting sports or newswebsites
Using apps that need
daily updates
50%(47%)
37%(37%)
36%(35%)
36%(34%) 34%
(33%)26%(30%) 24%
(25%)
25%(20%)
28%(29%)
Source: TNS
4G network
Public Wi-Fi
Work broadband
Home broadband
13%(13%)
11%(14%)
40%(42%)
36%(31%)
3%(2%)
3%(4%)
17%(20%)
77%(74%)
36%(39%)
10%(15%)
27%(21%)
27%(24%)
27%(35%)
18%(19%)
39%(31%)
16%(15%)
Bracketed figures from August EE Mobile Living Index

NETWORK ACTIVITY

21
Instagram peaks on Halloween on the 4G network
INSTAGRAM ACTIVITY PEAKS ON HALLOWEENInstagram accounts for around 3% of all 4G traffic, with customers enjoying posting high-res pictures on the go. We saw our biggest peak for the year on Instagram at approximately 9pm on Halloween, when parents tucked their trick-or-treating children up in bed and found some time alone to get on social media (and also around the time revellers of a more alcoholic nature started to upload their shots).
00
:00
01:
00
02:
00
03:
00
04
:00
05:
00
06
:00
07:
00
08
:00
09
:00
10:0
0
11:0
0
12:0
0
13:0
0
14:0
0
15:0
0
16:0
0
17:0
0
18:0
0
19:0
0
20:0
0
21:0
0
22:0
0
23:0
0
8.00
Peaked9.45
Bytes Up (Gigabytes)
Source: EE

22
06
:00
07:
00
08
:00
09
:00
10:0
0
11:0
0
12:0
0
13:0
0
14:0
0
15:0
0
16:0
0
17:0
0
18:0
0
19:0
0
20:0
0
21:0
0
22:0
0
23:0
0
Arsenal (The Emirates stadium in north London)
Manchester United (Old Trafford in Greater Manchester)
Liverpool (Anfield, in Liverpool’s Anfield area)
Chelsea (London’s King’s Road area)
Kick-off
Dat
a (g
igab
ytes
)THE BEAUTIFUL GAME, ON THE GOOn Sunday 27 October, Chelsea played Manchester City in a Premiership football match. We tracked the day’s activity in and around Chelsea’s stadium, as well as around some other important footballing locations (Manchester United’s Old Trafford ground, Arsenal’s Emirates, and Liverpool’s Anfield) to see if a match televised live has any overall effect on our network.
There was, predictably, huge activity around Stamford Bridge around time of match as people shared images and looked at information over 4G and also watched the match nearby.
But also, in Liverpool, where the stadium is in the middle of a very urban area, we saw a peak at the time of the match, most likely as customers watched on Sky Go or other services.
More popular matches see as much as a 10% upsurge in overall network activity.
Source: EE

23
11:0
0
15:0
0
19:0
0
23:0
0
03:
00
07:
00
11:0
0
15:0
0
19:0
0
23:0
0
03:
00
07:
00
11:0
0
15:0
0
19:0
0
23:0
0
03:
00
07:
00
11:0
0
15:0
0
19:0
0
23:0
0
03:
00
07:
00
2pm
Sat 9Sun 10
3pm
6pm
11pm 11pm
1pm
4pm
HTTP Video Sky Go
Dat
a (g
igab
ytes
)
Sky Packages
BIG MATCHES SEE A 10% UPLIFT IN 4GEE TRAFFICLooking at what is contributing to the aforementioned up-to 10% upward shift in network activity (see previous page), we see Sky Go activity peaks when live football is on. People are increasingly using their existing Sky packages and the 4G service to watch matches on-the-go. Steaming services also rise around the same time.
There is even an 11pm peak in streaming services on Premiership weekends on the Saturday when both Match of the Day and Sky’s highlight shows are televised. Customers have confidence in the speed andquality of 4GEE to use OTT services such asSky Go and Deezer (see page 8) over the network,moving television and music from traditionalhardware (television, radio, and even computer)to mobile devices.
Source: EE

24
A WEEK ON THE 4G NETWORKHere we have a snapshot of Covent Garden, Heathrow and Wembley over ten days in October.
The massive peak at Wembley was for the Jaguars v 49ers American Football match on 27 October.
We also see Heathrow has daily peaks around the flying hours and Covent Garden lights-up at lunchtimes, in the evening, and throughout the weekend. Knowing that certain areas will experience very high peaks allows our network team to make provisions for data use. The network has to have capacity to cope with these peaks even though 99% of the time use will be a lot lower.
Source: EE
23.10.13 24.10.13 25.10.13 26.10.13 27.10.13 28.10.13 29.10.13 30.10.13 31.10.13 01.11.13
12:0
0
12:0
0
00
:00
00
:00
00
:00
00
:00
00
:00
00
:00
00
:00
00
:00
00
:00
00
:00
12:0
0
12:0
0
12:0
0
12:0
0
12:0
0
12:0
0
12:0
0
12:0
0
Covent Garden Piazza
Heathrow
Wembley
Dat
a (g
igab
ytes
)


