38
4Q 2016 Results 23 February 2017 Tan Sri Jamaludin Ibrahim, President & Group CEO Yap Wai Yip, Acting Group Chief Financial Officer

4Q 2016 Results
23 February 2017
Tan Sri Jamaludin Ibrahim, President & Group CEO
Yap Wai Yip, Acting Group Chief Financial Officer

4Q 2016 2
Executive summary: FinancialsPositive QoQ revenue growth for all opcos; FY16 healthy revenue and double digit EBITDA growth.
However 4Q16 and FY16 PATAMI impacted by forex loss, M&As and operational performance.
Positive QoQ revenue growth for all opcos but 4Q16 PATAMI hit by forex loss and Robi-Airtel merger related costs.
FY16 healthy revenue and double digit EBITDA growth; however PATAMI impacted by forex loss, Robi-Airtel merger and Ncell
acquisition related costs, lower contribution from Celcom and Idea, ADS start-up losses, and higher D&A charges.
• QoQ growth : Revenue 6.1% ; EBITDA -5.4% ; PATAMI ->100% ; Normalised PATAMI -84.7%
• YoY growth : Revenue 8.0% ; EBITDA 0.8% ; PATAMI ->100% ; Normalised PATAMI -81.3%
• FY growth : Revenue 8.5% ; EBITDA 10.0% ; PATAMI -80.3% ; Normalised PATAMI -31.5%
At constant currency, FY16 financial performance reflect positive impact from a weaker ringgit vs all currencies, except SLR.
• QoQ growth : Revenue 2.2% ; EBITDA -9.4% ; PATAMI ->100% ; Normalised PATAMI -87.6%
• YoY growth : Revenue 7.1% ; EBITDA -0.5% ; PATAMI ->100% ; Normalised PATAMI -82.7%
• FY growth : Revenue 5.4% ; EBITDA 6.8% ; PATAMI -80.9% ; Normalised PATAMI -32.0%
Forex loss for FY16 of RM824m, including realised losses of RM312m, largely due to Ncell acquisition.
Robi-Airtel merger related costs of RM60m in FY16, comprising merger fee of RM13m, Airtel VRS of RM7m and Airtel losses of
RM40m.
Ncell acquisition related costs of RM287m in FY16, comprising PPA of RM106m and finance cost of RM181m.
D&A for FY16 increased 35.0% (or RM1,469m) to RM5,667m, primarily due to capex in FY15 and FY16, as well as accelerated
depreciation at XL and Robi.
On 27 January 2017, Axiata and edotco completed an equity private placement deal of USD600m, valuing edotco’s final
portfolio at equity value of close to USD1.5bn, or FY16 EV/EBITDA of 12.5x.
Cash balance of RM5.3bn and gross debt/EBITDA at 2.64x (based on Ncell’s annualised EBITDA).
For prudent and strategic reasons, FY16 total dividend declared of 8 sen, including 5 sen interim dividend, translating into
payout ratio of 50%.

4Q 2016 3
Note: Growth number based on results in local currency in respective operating markets
• A stronger quarter in 4Q16 with QoQ growth in service revenue, normalized EBITDA andnormalized PATAMI of +1.4%, +10.9% and +1.8% respectively. The growth in normalisedEBITDA was largely due to lower staff cost.
• Celcom’s FY16 revenue, normalised EBITDA and normalised PATAMI growth was -9.8%,-17.6%, and -29.1%, respectively.
• Positive take up on enhanced postpaid offerings ie First Gold 80 and First Platinum, delivershigher ARPU (+4.1% QoQ) and subscribers (+3.2% QoQ). However, the prepaid segmentcontinues to face near term challenges.
• FY16 mobile data revenue grew by 10.0%, driven by an increase in mobile internet revenuegrowth of 19.0%. Data revenue accounted for 34.1% of total revenue.
Key Group highlights (1/6):Celcom: Early signs of business stabilisation as 4Q16 delivers second consecutive quarter of service revenue
growth, but bottom line was affected by higher D&A charges from accelerated 4G rollout.

4Q 2016 4
Note: Growth number based on results in local currency in respective operating markets
• Strong data revenue growth delivers 4Q16 service revenue and total revenue growth of+1.0% QoQ and +0.5% QoQ, respectively. 4Q16 PAT growth was attributed to one-off towergain offset by accelerated depreciation due to network modernisation.
• XL’s FY16 revenue, EBITDA and PAT growth was -6.7%, -4.0% and +>100%, respectively.
• FY16 EBITDA margin rose 1.1pp to 37.6% mainly due to XL’s efforts on cost optimisationinitiatives, including savings from tower lease renewals.
• XL’s 4G-LTE footprint now spans close to 100 cities, with 8,204 4G BTS. This is furthersupported by XL’s roll-out on U900 which significantly improved the quality of its dataservices in ex-Java areas.
• High smartphone penetration of 63% and data users at 65% of subscriber base havedelivered FY16 total traffic and data revenue growth of 162% and 30.7% respectively. Datarevenue accounted for 38.1% of total revenue.
Key Group highlights (2/6):XL: Execution improvements and stabilizing voice and ex-Java revenue, have led to second consecutive quarter of
service revenue growth in 4Q16.
4Q 2016 5
Note: Growth number based on results in local currency in respective operating markets
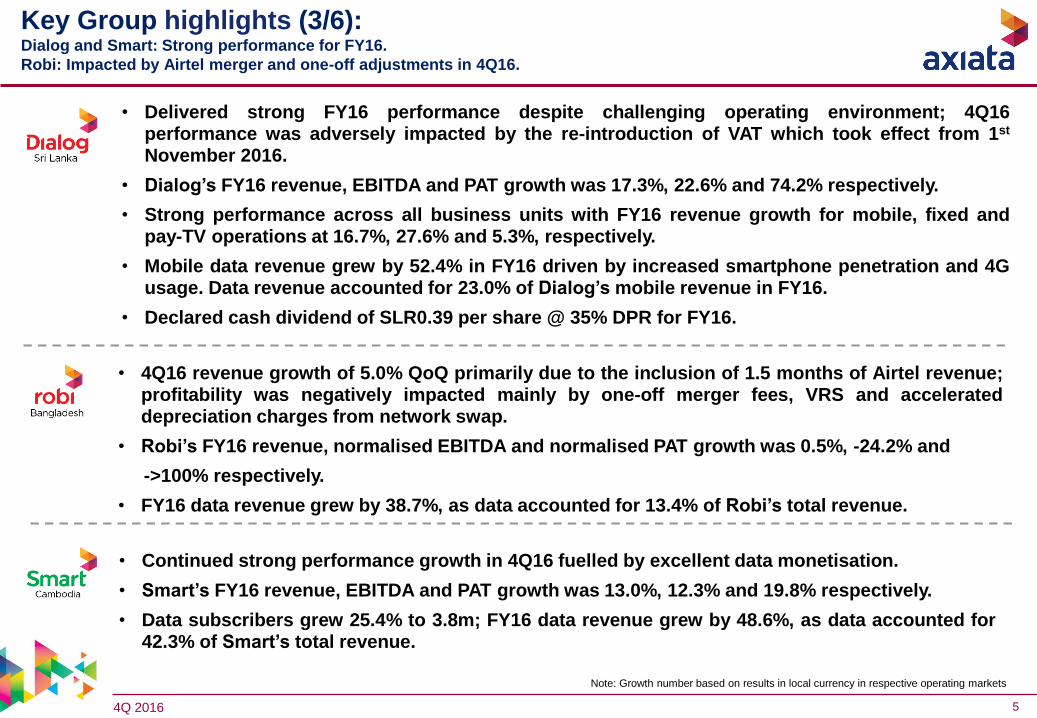
• 4Q16 revenue growth of 5.0% QoQ primarily due to the inclusion of 1.5 months of Airtel revenue;profitability was negatively impacted mainly by one-off merger fees, VRS and accelerateddepreciation charges from network swap.
• Robi’s FY16 revenue, normalised EBITDA and normalised PAT growth was 0.5%, -24.2% and
->100% respectively.
• FY16 data revenue grew by 38.7%, as data accounted for 13.4% of Robi’s total revenue.
• Delivered strong FY16 performance despite challenging operating environment; 4Q16performance was adversely impacted by the re-introduction of VAT which took effect from 1st
November 2016.
• Dialog’s FY16 revenue, EBITDA and PAT growth was 17.3%, 22.6% and 74.2% respectively.
• Strong performance across all business units with FY16 revenue growth for mobile, fixed andpay-TV operations at 16.7%, 27.6% and 5.3%, respectively.
• Mobile data revenue grew by 52.4% in FY16 driven by increased smartphone penetration and 4Gusage. Data revenue accounted for 23.0% of Dialog’s mobile revenue in FY16.
• Declared cash dividend of SLR0.39 per share @ 35% DPR for FY16.
• Continued strong performance growth in 4Q16 fuelled by excellent data monetisation.
• Smart’s FY16 revenue, EBITDA and PAT growth was 13.0%, 12.3% and 19.8% respectively.
• Data subscribers grew 25.4% to 3.8m; FY16 data revenue grew by 48.6%, as data accounted for42.3% of Smart’s total revenue.
Key Group highlights (3/6):Dialog and Smart: Strong performance for FY16.
Robi: Impacted by Airtel merger and one-off adjustments in 4Q16.
4Q 2016 6
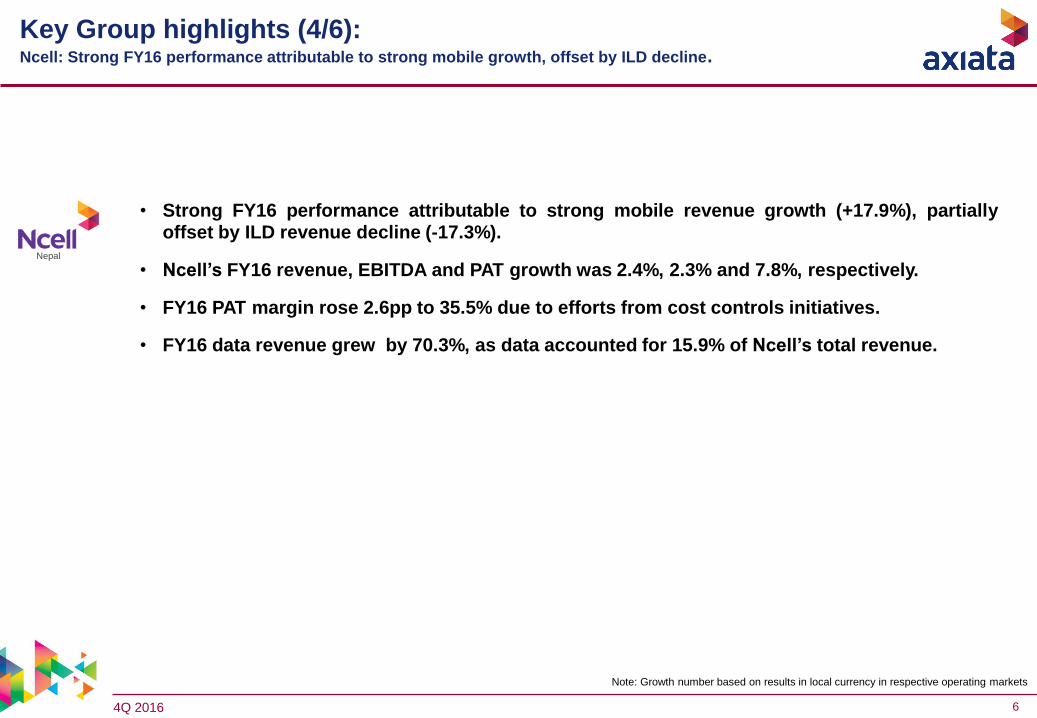
Key Group highlights (4/6):Ncell: Strong FY16 performance attributable to strong mobile growth, offset by ILD decline.
Note: Growth number based on results in local currency in respective operating markets
Nepal
• Strong FY16 performance attributable to strong mobile revenue growth (+17.9%), partiallyoffset by ILD revenue decline (-17.3%).
• Ncell’s FY16 revenue, EBITDA and PAT growth was 2.4%, 2.3% and 7.8%, respectively.
• FY16 PAT margin rose 2.6pp to 35.5% due to efforts from cost controls initiatives.
• FY16 data revenue grew by 70.3%, as data accounted for 15.9% of Ncell’s total revenue.

4Q 2016 7
Key Group highlights (5/6):edotco: Improved performance driven by aggressive co-location growth and SLA achievement.
ADS: Start-up losses as it builds the ecosystem.
• edotco’s FY16 proforma revenue, EBITDA and PAT growth was 26.7%, 38.1% and -12.0%,respectively.
• At end-FY16, edotco owns 17.2k towers (+4.5%), and manages 8.5k sites (+23.8%).
• Aggressive increase in co-location with tenancy ratio rising to 1.54x (vs 1.48x in end-FY15).
• Today ADS has portfolio of 30 companies involved in advertising, marketplace, financialservices, entertainment, IOT, OTT and enablers.
• In 2016, private placement closed for FreedomPop and Adknowledge Asia.
• ADS incurred start-up losses of RM114m in FY16, vs. losses of RM68m in FY15.
• Elevenia and 11st placed as strong no.2 players in Indonesia and Malaysia, respectively.

4Q 2016 8
Note: Growth number based on results in local currency in respective operating markets
Associates
• FY16 M1 reported revenue, EBITDA and PAT growth of -8.3%, -8.7% and -16.1%respectively. For Axiata’s FY16, M1 contributed RM129m (vs RM158m in FY15), accountingfor 9.1% of normalised Group PATAMI.
Key Group highlights (6/6):Associates and joint ventures: Contribution falls 93.1% to RM30m in FY16, largely due to Idea.
• Unprecedented disruption by RJIO since September 2016 resulted in heightenedcompetition in India. For YTD3Q17, Idea reported revenue and EBITDA growth of 3.7% and-6.4% respectively; however consolidated PAT growth was ->100% as a result of higherdepreciation and finance cost. For Axiata’s FY16, Idea contributed RM65m (vs RM369m inFY15) to Axiata, accounting for 4.6% of normalised Group PATAMI.
4Q 2016 9
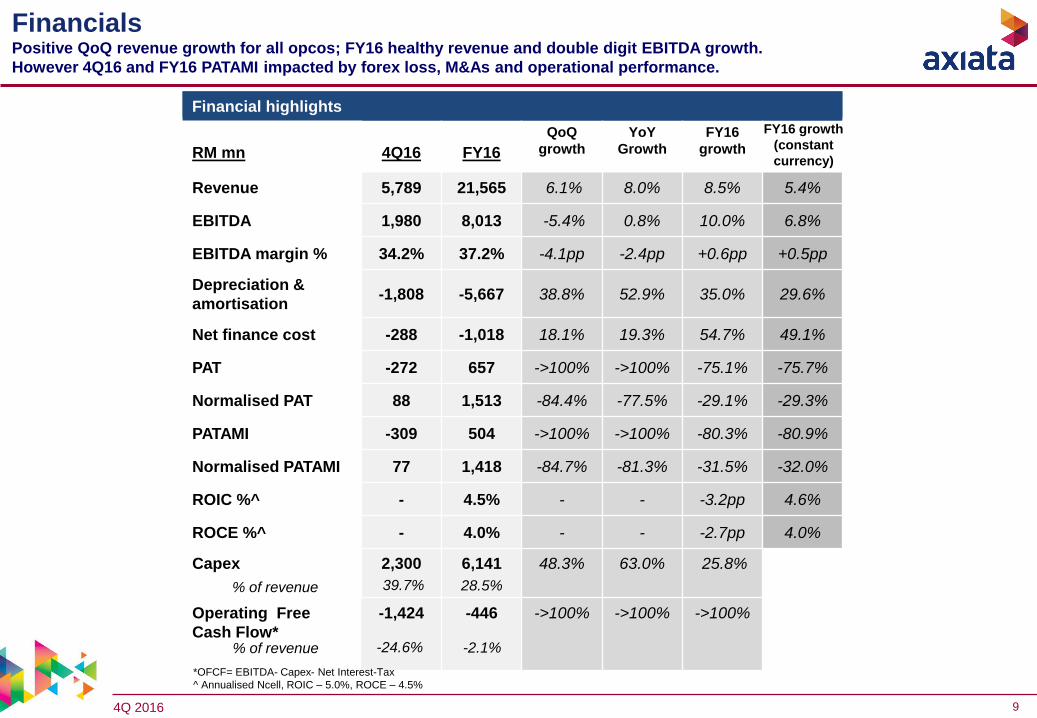
Financial highlights
RM mn 4Q16 FY16
QoQ
growth
YoY
Growth
FY16
growth
Revenue 5,789 21,565 6.1% 8.0% 8.5% 5.4%
EBITDA 1,980 8,013 -5.4% 0.8% 10.0% 6.8%
EBITDA margin % 34.2% 37.2% -4.1pp -2.4pp +0.6pp +0.5pp
Depreciation &
amortisation-1,808 -5,667 38.8% 52.9% 35.0% 29.6%
Net finance cost -288 -1,018 18.1% 19.3% 54.7% 49.1%
PAT -272 657 ->100% ->100% -75.1% -75.7%
Normalised PAT 88 1,513 -84.4% -77.5% -29.1% -29.3%
PATAMI -309 504 ->100% ->100% -80.3% -80.9%
Normalised PATAMI 77 1,418 -84.7% -81.3% -31.5% -32.0%
ROIC %^ - 4.5% - - -3.2pp 4.6%
ROCE %^ - 4.0% - - -2.7pp 4.0%
Capex 2,300 6,141 48.3% 63.0% 25.8%
Operating Free
Cash Flow*
-1,424 -446 ->100% ->100% ->100%
Financial highlights
% of revenue 39.7%
% of revenue -24.6%
FY16 growth
(constant
currency)
28.5%
-2.1%
*OFCF= EBITDA- Capex- Net Interest-Tax
^ Annualised Ncell, ROIC – 5.0%, ROCE – 4.5%
FinancialsPositive QoQ revenue growth for all opcos; FY16 healthy revenue and double digit EBITDA growth.
However 4Q16 and FY16 PATAMI impacted by forex loss, M&As and operational performance.

4Q 2016 10
2,554 2,071
1,418
504
83 400
653
824 340 106 193 111 20
FY
20
15
FO
RE
X &
Oth
ers
XL
ga
in o
n d
isp
osa
lo
f to
we
rs
No
rma
lise
d F
Y2
01
5
Op
era
tio
ns
No
rma
lise
d F
Y2
01
6
FO
RE
X l
os
s
XL
ga
in o
n d
isp
osa
lo
f to
we
rs
Nce
ll P
PA
XL
ac
cele
rate
dd
ep
recia
tio
n
Ro
bi
acc
ele
rate
dd
ep
recia
tio
n
Ro
bi
on
e-o
ff a
dj
FY
20
16
Normalised Growth:
YTD Growth:
-31.5%
-80.3%
Norm PATAMI FY2015 Norm PATAMI FY2016
Celcom 1,308 -344 -26.3% Celcom 964
XL (87) -48 -55.2% XL (135)
Dialog 189 +52 +27.5% Dialog 241
Robi 183 -201 ->100% Robi (18)
Smart 188 +71 +37.8% Smart 259
Ncell - +440 na Ncell 440
Associates & Others 290 -623 ->100% Associates & Others (333)
GROUP 2,071 -653 -31.5% GROUP 1,418
YTD Growth Rates
RM Million
Normalised Group PATAMI: FY15 → FY16Normalised performance decreased by 31.5% due to Celcom, Robi, XL and Idea, cushioned by Ncell, Smart and
Dialog.
FY16 Normalised itemFY15 Normalised item Underlying operational
performance
Norm. PATAMI FY15 Norm. PATAMI FY16FY Growth Rates
FY
16
FY
15
FY Growth:
4Q 2016 11
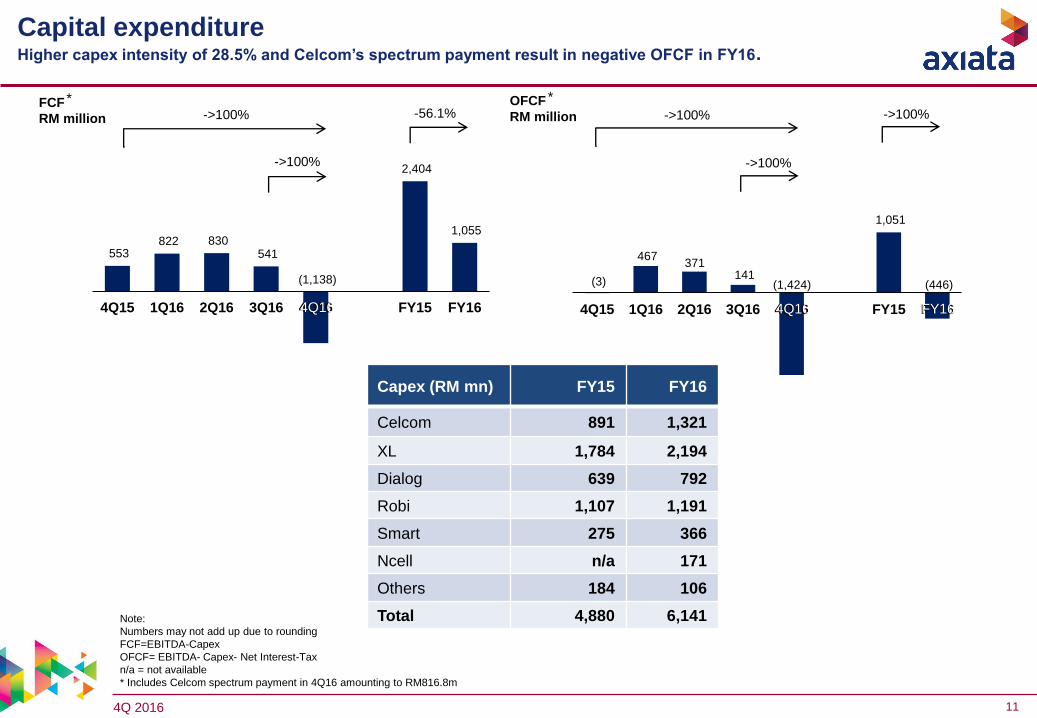
Capital expenditureHigher capex intensity of 28.5% and Celcom’s spectrum payment result in negative OFCF in FY16.
Note:
Numbers may not add up due to rounding
FCF=EBITDA-Capex
OFCF= EBITDA- Capex- Net Interest-Tax
n/a = not available
* Includes Celcom spectrum payment in 4Q16 amounting to RM816.8m
Capex (RM mn) FY15 FY16
Celcom 891 1,321
XL 1,784 2,194
Dialog 639 792
Robi 1,107 1,191
Smart 275 366
Ncell n/a 171
Others 184 106
Total 4,880 6,141
FCF
RM million
OFCF
RM million->100% ->100%
->100%
-56.1%
->100%
->100%
553 822 830
541
(1,138)
2,404
1,055
4Q15 1Q16 2Q16 3Q16 4Q16 FY15 FY16
(3)
467 371
141 (1,424)
1,051
(446)
4Q15 1Q16 2Q16 3Q16 4Q16 FY15 FY16
* *
4Q16 4Q16 FY16

4Q 2016 12
Group borrowings – by currency Group borrowings - hedged / unhedged loans
* Based on Ncell’s EBITDA on an annualised basis.
^ Based on Ncell’s EBITDA of 8.5 months in FY16 (actual).
In million Loan Currency USD Local Total (RM)
Hold co & Non OpCoUSD 2,057 - 9,229
Sub-total 2,057 - 9,229
OpCos USD 664 2,979
RM 5,035 5,035
IDR 9,989,819 4,981
BDT 20,818 1,866
SLR 11,785 1,029
PKR 1,227 53
Sub-Total 664 13,032
Total Group 2,721 22,260
Group statements of financial position Gross debt/EBITDA increases to 2.64x as ringgit depreciates 8.8% QoQ against USD
2.25
2.84^/ 2.43* 2.58^/
2.46*2.43^/ 2.32*
2.78^/ 2.64*
1.49 1.39^ / 1.79*
1.61^/ 1.53*
1.69^/ 1.61*
2.11^/ 2.01*
31-Dec-15 31-Mar-16 30-Jun-16 30-Sep-16 31-Dec-16
Gross debt to EBITDA Net debt to EBITDA
Cash (RM million)Gross and net debt/EBITDA (x)
Local currencies
loans45%
Hedged USD loans25%
Unhedged USD loans30%
5,511
10,879
8,101
6,034 5,332
2,241
7,716
3,100
1,478 1,322
31-Dec-15 31-Mar-16 30-Jun-16 30-Sep-16 31-Dec-16
Total cash Holdco & non opco cash

4Q 2016 13
FY16 Achievement
FY16Headline KPIs
FY16Achievement
FY16Headline KPIs
FY16Achievement
Revenue growth 8.5% 12.2% 8.1% 9.8% 5.4%
EBITDA growth 10.0% 16.0% 9.7% 13.7% 6.8%
ROIC 4.5% 6.8% 4.8% 6.6% 4.6%
ROCE 4.0% 6.1% 4.2% 6.0% 4.0%
Capex ** RM6.1bn RM5.7bn RM5.8bn RM5.5bn RM5.9bn
FY16 headline KPIsBased on Bloomberg estimate and constant currency, FY16 performance is below expectations.
*1 USD = RM4.20
** Capex is not a headline KPI
(based on Bloomberg* estimate in
mid-Oct 2015 for 2016 forex)
@ Actual Currency (based on constant currency)

4Q 2016 14
30%
60%
70%75%
84% 85%
50%
0%
10%
20%
30%
40%
50%
60%
70%
80%
90%
2010 2011 2012 2013 2014 2015 2016
Proposing 50% DPR for FY16:
a) Prudent reasons: Volatile forex in particular USD:MYR, and regulatory risk (including spectrum auction/renewal in most
markets in the next 1-2 years).
b) Strategic reasons: 4G / data leadership investments, to be No.1 in selected areas / regions in every market, and possible
market consolidation and edotco expansion.
This is for the short term and will revert to FY15 level within two years.
Proposed dividendFor prudent and strategic reasons, FY16 DPR is 50%.
DPR
10 sen 19 sen 22 sen 22 sen 20 sen
* Includes special dividend of 12 sen,
** Final dividend is subject to shareholders’ approval.
**
35 sen* 8 senDPS
4Q 2016 15
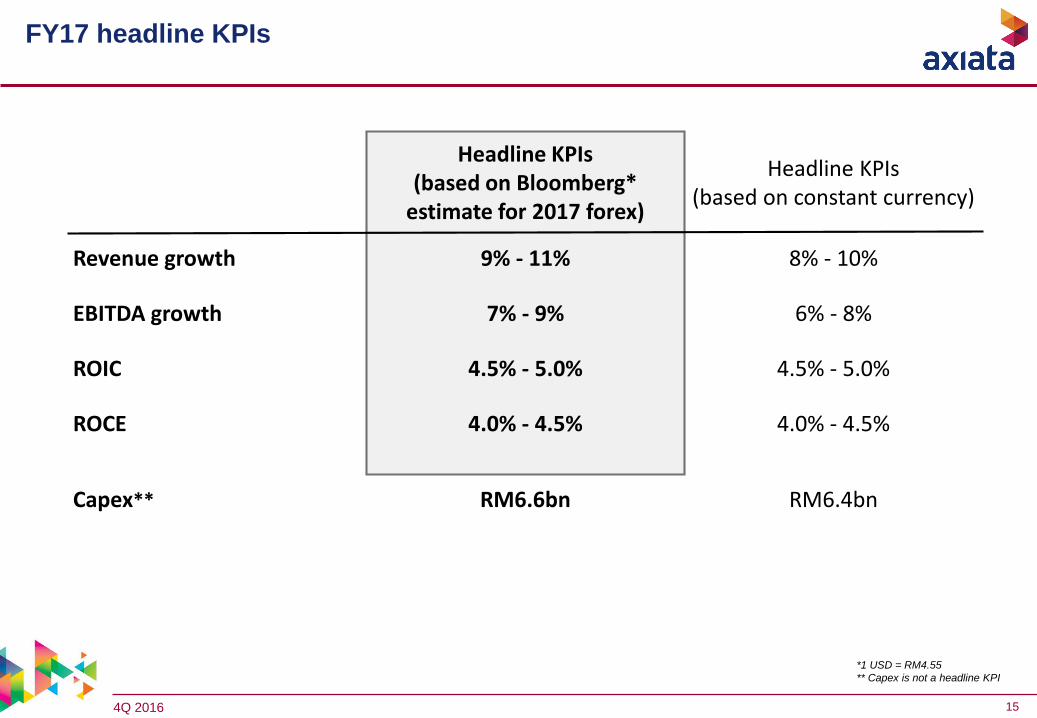
FY17 headline KPIs
Headline KPIs(based on Bloomberg*
estimate for 2017 forex)
Headline KPIs(based on constant currency)
Revenue growth 9% - 11% 8% - 10%
EBITDA growth 7% - 9% 6% - 8%
ROIC 4.5% - 5.0% 4.5% - 5.0%
ROCE 4.0% - 4.5% 4.0% - 4.5%
Capex** RM6.6bn RM6.4bn
*1 USD = RM4.55
** Capex is not a headline KPI

4Q 2016 16
Key opportunities and challenges
Opportunities
Celcom ‘Refresh’ and XL ‘Transformation Agenda’.
Synergistic opportunities from Robi-Airtel merger and Ncell acquisition.
e.Co‘s organic and inorganic growth.
Group-wide cost optimisation – RM2.3bn savings for FY17 to FY19.
Challenges
Currency volatility and increasingly stringent foreign exchange control requirements inMalaysia.
Tax and regulatory uncertainties in Malaysia (spectrum allocation), Nepal (capital gainstax, ILD interconnection), Sri Lanka (new taxes in 2017 Budget) and Indonesia
(spectrum sharing).
Heightened competition in all markets especially Malaysia, Singapore and India.

4Q 2016 17
Appointment of Vivek Sood as Axiata’s Group Chief Financial Officer
Management is please to announce the appointment of Vivek Sood as Group Chief Financial Officer
(“GCFO”) and will join Axiata on 3 April 2017. He replaces the previous GCFO Chari TVT who retired
from this position at the end of December 2016.
Vivek has assumed a variety of senior leadership roles in the telecommunication and finance industries.
He gained diverse global knowledge when he had responsibilities across Asian and European markets,
leading teams from multiple culture and backgrounds.
Notable professional experience:
Telenor Group, Inc – Executive Vice President and Group Chief Marketing Officer (2015 – 2016)
Telenor India – Chief Executive Officer (2014 – 2015)
Grameenphone, Bangladesh – Chief Executive Officer (2013 – 2014)
Telenor India – Chief Financial Officer (2011 – 2012)
Tata AIA Life Insurance Limited – Chief Operating Officer (2010 – 2011)
Tata AIA Life Insurance Limited – Chief Financial Officer (2006 – 2010)
Education
Bachelor in Commerce and Qualified Chartered Accountant India
4Q 2016 18
Appendix

4Q 2016 19
Revenue FY2015 Revenue FY2016
Celcom 7,338 -725 -9.9% Celcom 6,613
XL 6,657 -20 -0.3% XL 6,637
Dialog 2,121 +339 +16.0% Dialog 2,460
Robi 2,623 +160 +6.1% Robi 2,783
Smart 907 +182 +20.0% Smart 1,089
Ncell - +1,630 na Ncell 1,630
Multinet & Others 237 +116 +48.9% Multinet & Others 353
GROUP 19,883 +1,682 +8.5% GROUP 21,565
YTD Growth Rates
REVENUE INCREASED BY RM1,682MN
19,883
21,565
725 20 339 160 182
1,630 116 R
even
ue
FY2
015
Ce
lco
m XL
Dia
log
Ro
bi
Sma
rt
Nce
ll
Mu
ltin
et
&O
the
rs
Rev
enu
eFY
20
16
Revenue Growth: 8.5%Revenue Growth: 8.5%
FY15 Revenue FY16 RevenueFY movement
Revenue FY15 Revenue FY16
RM Million
FY
16
FY
15
Group revenue: FY15 → FY16 FY16 revenue growth lifted by consolidation of Ncell, forex translation and strong growth in data revenue (+34.7%).
FY Growth Rates
4Q 2016 20
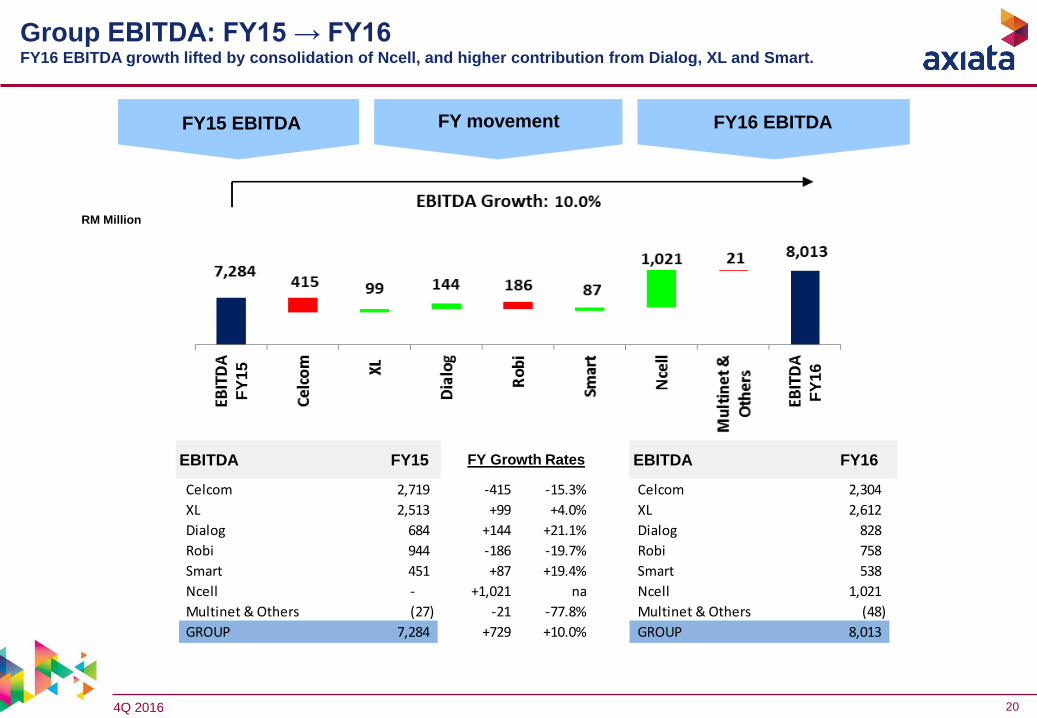
EBITDA FY2015 EBITDA FY2016
Celcom 2,719 -415 -15.3% Celcom 2,304
XL 2,513 +99 +4.0% XL 2,612
Dialog 684 +144 +21.1% Dialog 828
Robi 944 -186 -19.7% Robi 758
Smart 451 +87 +19.4% Smart 538
Ncell - +1,021 na Ncell 1,021
Multinet & Others (27) -21 -77.8% Multinet & Others (48)
GROUP 7,284 +729 +10.0% GROUP 8,013
YTD Growth Rates
EBITDA INCREASED BY RM729MN
FY15 EBITDA FY16 EBITDAFY movement
RM Million
FY
16
FY
15
Group EBITDA: FY15 → FY16FY16 EBITDA growth lifted by consolidation of Ncell, and higher contribution from Dialog, XL and Smart.
FY Growth RatesEBITDA FY15 EBITDA FY16

4Q 2016 21
PATAMI FY2015 PATAMI FY2016
Celcom 1,291 -325 -25.2% Celcom 966
XL (7) +82 +>100% XL 75
Dialog 82 +132 +>100% Dialog 214
Robi 187 -336 ->100% Robi (149)
Smart 188 +71 +37.6% Smart 259
Ncell - +455 na Ncell 455
Multinet & Others 813 -2,129 ->100% Multinet & Others (1,316)
GROUP 2,554 -2,050 -80.3% GROUP 504
YTD Growth Rates
PATAMI DECREASED BY RM2,050MN
FY15 PATAMI FY16 PATAMIFY movement
RM Million
PA
TA
MI
FY
16
PA
TA
MI
FY
15
Group PATAMI: FY15 → FY16FY16 PATAMI growth impacted by forex loss, M&As (Robi-Airtel merger and Ncell acquisition related costs) and
operational performance (Celcom, Idea, ADS and D&A).
FY Growth RatesPATAMI FY15 PATAMI FY16

4Q 2016 22
* Normalisation excludes holding company charge, impact of Edotco disposal, Escape, Celcom Planet, Employee Wish Plan, Sukuk interest
Revenue (RM mn) Data revenue as a % of total revenue
EBITDA* (RM mn) & margins (%)
Normalised
EBITDA
Margin
44.5% 40.7% 38.2% 35.1% 38.6%
PATAMI* (RM mn) & margins (%)
Normalised
PATAMI
Margin
24.7% 21.1% 19.1% 16.9% 17.1%
Service
revenue 90.5% 91.2% 88.2% 92.1% 92.5% 91.8% 91.0%
41.8% 38.2% 23.6% 18.6%
Celcom: financial performance In 4Q16, sequential service revenue growth; normalised EBITDA and PATAMI growth turns positive.
1,819 1,665 1,682 1,630 1,646
7,345
6,622
4Q15 1Q16 2Q16 3Q16 4Q16 FY15 FY16
29% 31%33%
36% 37%
28%
34%
4Q15 1Q16 2Q16 3Q16 4Q16 FY15 FY16
666 625 596 523 585
2,716 2,330
809 678 642 572 635
3,068
2,527
4Q15 1Q16 2Q16 3Q16 4Q16 FY15 FY16
EBITDA Normalised EBITDA
255 288 261 216 200
1,291
966
449 351 320 276 281
1,732
1,229
4Q15 1Q16 2Q16 3Q16 4Q16 FY15 FY16
PATAMI Normalised PATAMI

4Q 2016 23
* OPEX and EBITDA Margin excludes holding company charge, impact of Edotco disposal, Escape and Employee Wish Pllan
Operating Expenses*
31 Dec 15 31 Mar 16 30 June 16 30 Sept 16 31 Dec 16
Capex 885 174 446 892 1,330
Cash and Cash Equivalents 1,535 1,695 841 1,279 1,022
Gross Debt 4,526 4,488 4,535 4,495 5,035
Net Assets -878 -591 -1,330 -1,111 -908
Gross Debt / Equity (x) n/m n/m n/m n/m n/m
Gross Debt / EBITDA (x) 1.5 1.7 1.7 1.8 2.0
% of Revenue 4Q15 1Q16 2Q16 3Q16 4Q16 FY15 FY16
Direct Expenses 27.4% 23.3% 23.6% 22.8% 21.9% 28.1% 22.9%
Sales and Marketing 7.3% 8.3% 7.9% 7.4% 7.5% 7.0% 7.8%
Network Cost 11.5% 13.6% 15.8% 18.2% 18.7% 12.1% 16.6%
Staff Cost 4.5% 8.2% 6.3% 8.9% 5.1% 5.8% 7.1%
Bad Debts 0.1% 0.5% -0.2% 0.1% 0.4% 0.3% 0.2%
Others 4.8% 5.3% 8.4% 7.4% 7.9% 5.1% 7.3%
Total Expenses 55.5% 59.3% 61.8% 64.9% 61.4% 58.2% 61.8%
Normalised EBITDA Margin 44.5% 40.7% 38.2% 35.1% 38.6% 41.8% 38.2%
Depreciation & Amortisation 12.8% 12.9% 13.0% 12.5% 16.6% 11.7% 13.8%
Financial Position (RM mn)
Celcom: financial performance4Q16 normalised EBITDA margin improved QoQ as a result of provision reversal in staff cost.

4Q 2016 24
Celcom: operational performanceNew data led products drive sequential ARPU improvement.
Subscribers (‘000)
Data traffic (‘mil GB) and data usage (GB) Smartphone penetration and 4G pop coverage (%)
ARPU* (RM)
* ARPU re-stated to exclude inbound roaming revenue
Data
subscribers54.4% 54.4% 58.2% 60.2% 61.9%
2,803 2,840 2,897 2,869 2,960
9,447 9,235 8,338 8,285 7,596
12,250 12,075 11,234 11,154 10,556
4Q15 1Q16 2Q16 3Q16 4Q16
Postpaid Prepaid
85
76 76 76 80
85 78
31 29 29 30 31 32 30
42 39 39
41 43 42
41
4Q15 1Q16 2Q16 3Q16 4Q16 FY15 FY16
Postpaid Prepaid Blended
59%62%
66% 66% 64%
53%
61%
72% 72%76%
0%
10%
20%
30%
40%
50%
60%
70%
80%
30%
40%
50%
60%
70%
80%
90%
4Q15 1Q16 2Q16 3Q16 4Q16
Smartphone penetration 4G pop coverage
35.4 45.2 55.8 65.4 76.9
118.6
243.4
1.8 2.3
2.8 3.2 3.9
1.5
3.1
4Q15 1Q16 2Q16 3Q16 4Q16 FY15 FY16
Data traffic ('mil GB) Data usage/data subcriber/month (GB)
4Q 2016 25
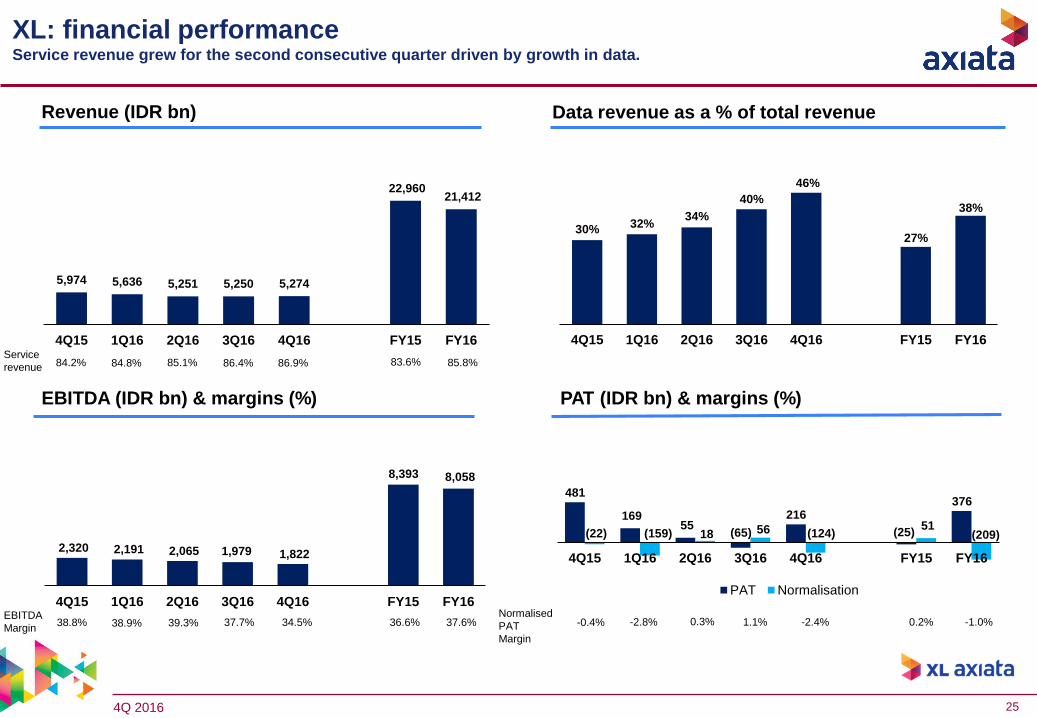
XL: financial performanceService revenue grew for the second consecutive quarter driven by growth in data.
Revenue (IDR bn) Data revenue as a % of total revenue
EBITDA (IDR bn) & margins (%)
EBITDA
Margin 38.8% 38.9% 39.3% 37.7% 34.5% 36.6% 37.6%
PAT (IDR bn) & margins (%)
Normalised
PAT
Margin
-0.4% -2.8% 0.3% 1.1% -2.4% 0.2% -1.0%
Service
revenue 84.2% 84.8% 85.1% 86.4% 86.9% 83.6% 85.8%
5,974 5,636 5,251 5,250 5,274
22,960 21,412
4Q15 1Q16 2Q16 3Q16 4Q16 FY15 FY16
30%32%
34%
40%
46%
27%
38%
4Q15 1Q16 2Q16 3Q16 4Q16 FY15 FY16
2,320 2,191 2,065 1,979 1,822
8,393 8,058
4Q15 1Q16 2Q16 3Q16 4Q16 FY15 FY16
481
169 55
(65)
216
(25)
376
(22) (159) 18 56 (124)51
(209)
4Q15 1Q16 2Q16 3Q16 4Q16 FY15 FY16
PAT Normalisation

4Q 2016 26
XL: financial performance4Q16 EBITDA margin impacted by higher sales & marketing expenses as XL focuses on trade (traditional channels),
network visibility (4G, U900) and postpaid campaigns.
Operating Expenses
31 Dec 15 31 Mar 16 30 Jun 16 30 Sept 16 31 Dec 16
Capitalised Capex 4,848 1,048 2,263 3,450 6,474
Cash and Cash Equivalents 3,312 2,222 6,217 3,343 1,400
Gross Debt 26,953 25,229 17,888 15,157 14,671
Net Assets 14,092 14,270 21,018 20,945 21,209
Gross Debt / Equity (x) 1.9 1.8 0.9 0.7 0.7
Gross Debt / EBITDA (x) 3.2 2.9 2.0 1.8 1.8
% of Revenue 4Q15 1Q16 2Q16 3Q16 4Q16 FY15 FY16
Direct Expenses 9.3% 7.2% 8.0% 10.0% 11.0% 10.1% 9.0%
Sales and Marketing 5.7% 5.8% 5.2% 7.3% 8.5% 4.9% 6.7%
Network Cost 38.7% 39.3% 40.0% 37.4% 37.7% 40.4% 38.6%
Staff Cost 4.8% 5.8% 5.3% 5.0% 5.5% 4.7% 5.4%
Others incl. discount 2.7% 3.0% 2.2% 2.6% 2.8% 3.2% 2.7%
Total Expenses 61.2% 61.1% 60.7% 62.3% 65.5% 63.4% 62.4%
EBITDA Margin 38.8% 38.9% 39.3% 37.7% 34.5% 36.6% 37.6%
Depreciation & Amortisation 31.5% 33.2% 39.8% 34.3% 43.3% 31.1% 37.6%
Financial Position (IDR bn)

4Q 2016 27
437 438 490 511 533
41,465 42,034 43,482 44,461 45,941
41,902 42,472 43,972 44,972 46,474
4Q15 1Q16 2Q16 3Q16 4Q16
Postpaid Prepaid
XL: operational performanceHigh smartphone penetration of 63% and data users at 65% of subscriber base have delivered FY16 total traffic growth
of 162%.
Total traffic (‘000 TB) Smartphone penetration (%) and 4G BTS
ARPU (IDR ‘000)Subscribers (‘000)
Data
subscribers54% 54% 54% 65% 65%
110
127 113 109
118 107
116
41 38 34 34 33 34 34
41 39 35 34 34 34 35
(14)
(4)
6
16
26
36
-
20
40
60
80
100
120
140
160
180
4Q15 1Q16 2Q16 3Q16 4Q16 FY15 FY16
Postpaid Prepaid Blended
60.2 85.2
112.1 137.6 180.4 196.3
515.3
4Q15 1Q16 2Q16 3Q16 4Q16 FY15 FY16
Total traffic ('000 TB)
42%48%
53%
60% 63%
3,134 3,286
5,250 7,204
8,204
(10,000)
(5,000)
-
5,000
10,000
0%
10%
20%
30%
40%
50%
60%
70%
80%
90%
4Q15 1Q16 2Q16 3Q16 4Q16
Smartphone penetration Total 4G BTS

4Q 2016 28
Revenue (SLR mn) Data revenue as a % of total mobile revenue*
EBITDA (SLR mn) & margins (%)
EBITDA
Margin 28.0% 33.2% 33.5% 35.5%
PAT (SLR mn) & margins (%)
PAT
Margin 3.1% 12.6% 10.9% 13.0%32.6% 5.5%32.2% 33.7% 7.0% 10.4%
* Total Mobile Revenue includes Mobile, Data & Digital Services and excludes Dialog Tele-Infrastructure & International
Dialog: financial performance4Q16 performance impacted by the re-introduction of VAT in November 2016 and unrealized forex loss.
20,039 21,157 21,065 21,748 22,775
73,930
86,745
4Q15 1Q16 2Q16 3Q16 4Q16 FY15 FY16
19% 20%22%
24% 25%
18%
23%
4Q15 1Q16 2Q16 3Q16 4Q16 FY15 FY16
5,613 7,019 7,057 7,714 7,422
23,824
29,212
4Q15 1Q16 2Q16 3Q16 4Q16 FY15 FY16
EBITDA
621
2,670 2,287 2,833
1,251
5,188
9,041
4Q15 1Q16 2Q16 3Q16 4Q16 FY15 FY16
PAT

4Q 2016 29
¹ Restated. Spectrum fees now included under ‘network cost’ instead of ‘others’.
² Capex excludes Customer Premises Equipment investments and spectrum acquisition & license renewal
³ Excludes cash from overdraft facilities
Dialog: financial performance4Q16 EBITDA margin impacted by re-introduction of VAT; FY16 EBITDA margin improvement due to cost rescaling
initiatives.
Operating Expenses¹
31 Dec 15 31 Mar 16 30 Jun 16 30 Sept 16 31 Dec 16
Capex² 19,577 2,942 7,091 12,742 23,173
Cash and Cash Equivalents³ 4,429 9,741 3,653 5,072 6,410
Gross Debt 22,910 31,540 31,850 31,916 32,562
Net Assets 47,317 49,935 49,609 52,510 54,021
Gross Debt / Equity (x) 0.5 0.6 0.6 0.6 0.6
Gross Debt / EBITDA (x) 1.0 1.1 1.1 1.1 1.1
% of Revenue 4Q15 1Q16 2Q16 3Q16 4Q16 FY15 FY16
Direct Expenses 28.5% 29.9% 27.7% 26.1% 27.8% 28.8% 27.9%
Sales and Marketing 15.6% 13.7% 13.8% 14.8% 15.0% 13.6% 14.3%
Network Cost 11.3% 12.2% 11.9% 12.8% 12.9% 13.1% 12.5%
Staff Cost 9.9% 7.8% 7.5% 8.1% 8.1% 8.5% 7.9%
Bad debts 1.1% 1.0% 2.5% 0.2% 1.4% 1.0% 1.3%
Others 5.6% 2.0% 3.1% 2.5% 2.2% 2.8% 2.4%
Total Expenses 72.0% 66.8% 66.5% 64.5% 67.4% 67.8% 66.3%
EBITDA Margin 28.0% 33.2% 33.5% 35.5% 32.6% 32.2% 33.7%
Depreciation & Amortisation 20.1% 17.4% 18.1% 18.9% 20.9% 19.4% 18.9%
Financial Position (SLR mn)

4Q 2016 30
Dialog: operational performanceMobile subscribers grew 8.8% YoY and YTD ARPU increased 9.4% YoY.
Smartphone penetration (%) and 4G BTS
ARPU* (SLR)Subscribers* (‘000)
* Restated for 2Q16 subscribers and ARPU.
Data
subscribers22.2% 25.9% 26.1% 27.9% 28.8%
Data traffic (‘mil GB) and data usage (GB)
1,141 1,166 1,187 1,209 1,253
9,731 9,424 9,770 10,103 10,572
10,872 10,590 10,957 11,313 11,825
4Q15 1Q16 2Q16 3Q16 4Q16
Postpaid Prepaid
1,115 1,115 1,180 1,160 1,171 1,082
1,155
290 307 296 316 301 273 305
378 393 392 406
393
362
396
-
50
100
150
200
250
300
350
400
450
-
200
400
600
800
1,000
1,200
1,400
1,600
1,800
4Q15 1Q16 2Q16 3Q16 4Q16 FY15 FY16
Postpaid Prepaid Blended
13.7 14.6 17.8 21.2 24.3
41.3
77.9
1.9 1.8 2.1 2.2 2.4
1.7 2.1
(2.0)
(1.0)
-
1.0
2.0
3.0
-
20.0
40.0
60.0
80.0
100.0
4Q15 1Q16 2Q16 3Q16 4Q16 FY15 FY16
Data traffic ('mil GB) Data usage/data subcriber/month (GB)
33%36%
38%41%
44%1,375
1,778 1,917 2,049
2,384
(1,000)
(500)
-
500
1,000
1,500
2,000
2,500
3,000
0%
10%
20%
30%
40%
50%
60%
4Q15 1Q16 2Q16 3Q16 4Q16
Smartphone penetration Total 4G BTS

4Q 2016 31
4,979 3,981 4,005 4,488 1,874
19,113
14,348
5,127 4,160 4,157 4,630 2,030
19,753
14,976
4Q15 1Q16 2Q16 3Q16 4Q16 FY15 FY16
EBITDA Normalisation
Revenue (BDT mn) Data revenue as a % of total revenue
EBITDA* (BDT mn) & margins (%) PAT* (BDT mn) & margins (%)
Normalised
EBITDA
Margin
Normalised
PAT
Margin
* Normalisation excludes impact of edotco carve out in 3Q15
33.4% 28.4%35.1% 33.4% 13.9% 0.6% -5.7%4.8% 4.0% -28.3%37.0% 37.7% 7.8% 7.7%
Robi: financial performance4Q16 revenue growth of 5.0% QoQ primarily due to the inclusion of 1.5 months of Airtel revenue.
13,871 11,835 12,435 13,859 14,551
52,395 52,682
4Q15 1Q16 2Q16 3Q16 4Q16 FY15 FY16
10%
12% 12%
14%15%
10%
13%
4Q15 1Q16 2Q16 3Q16 4Q16 FY15 FY16
1,006 397 (34) 18 (4,272)
4,004
(3,892)
1,078 568 494 77 (4,117)
4,020
(2,978)
4Q15 1Q16 2Q16 3Q16 4Q16 FY15 FY16
PAT Normalisation

4Q 2016 32
Operating Expenses*
31 Dec 15 31 Mar 16 30 Jun 16 30 Sept 16 31 Dec 16
Capex 19,996 4,435 9,991 12,917 20,335
Cash and Cash Equivalents 1,943 3,395 4,968 4,229 4,228
Gross Debt 15,004 22,029 21,720 19,480 32,562
Net Assets 54,890 55,287 55,253 55,270 69,446
Gross Debt / Equity (x) 0.3 0.4 0.4 0.4 0.5
Gross Debt / EBITDA (x) 0.8 1.4 1.4 1.2 2.3
% of Revenue 4Q15 1Q16 2Q16 3Q16 4Q16 FY15 FY16
Direct Expenses 29.5% 21.8% 25.5% 29.7% 30.9% 26.3% 27.3%
Sales and Marketing 13.1% 13.1% 13.7% 12.6% 15.0% 12.8% 13.6%
Network Cost 10.9% 16.9% 16.1% 13.1% 18.9% 12.8% 16.2%
Staff Cost 5.3% 5.8% 5.6% 5.2% 8.6% 5.2% 6.4%
Bad debts -1.5% 0.4% -0.9% 0.4% 1.4% 0.6% 0.4%
Others 5.8% 6.8% 6.5% 5.7% 11.3% 4.6% 7.7%
Total Expenses 63.0% 64.9% 66.6% 66.6% 86.1% 62.3% 71.6%
Normalised EBITDA Margin 37.0% 35.1% 33.4% 33.4% 13.9% 37.7% 28.4%
Depreciation & Amortisation 20.4% 27.8% 29.7% 28.6% 50.0% 21.0% 34.6%
Financial Position (BDT mn)
* Restated. Commission expenses included under ‘sales and marketing expenses’ and leased line expenses included under ‘Network costs’. Prior to this, both of
these items were included under direct expenses.
Robi: financial performance4Q16 profitability was negatively impacted mainly by one-off merger fees and accelerated depreciation charges
from the merger and network swap.
4Q 2016 33
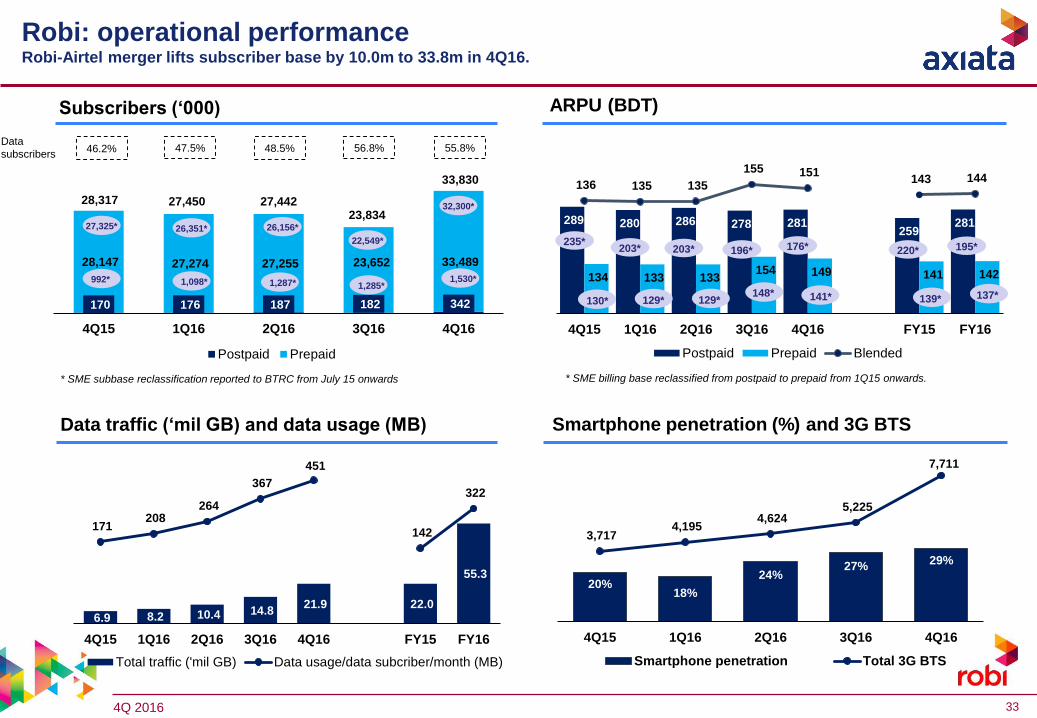
289 280 286 278 281 259
281
134 133 133 154 149 141 142
136 135 135
155 151 143 144
4Q15 1Q16 2Q16 3Q16 4Q16 FY15 FY16
Postpaid Prepaid Blended
170 176 187 182 342
28,147 27,274 27,255 23,652 33,489
28,317 27,450 27,442 23,834
33,830
4Q15 1Q16 2Q16 3Q16 4Q16
Postpaid Prepaid
Smartphone penetration (%) and 3G BTS
ARPU (BDT)Subscribers (‘000)
1,530*
32,300*
992*
27,325*
1,098*
26,351*
1,287*
26,156*
129*
203*
148*
196*
130*
235*
129*
203*
1,285*
22,549*
Data
subscribers46.2% 47.5% 48.5% 56.8% 55.8%
Data traffic (‘mil GB) and data usage (MB)
Robi: operational performanceRobi-Airtel merger lifts subscriber base by 10.0m to 33.8m in 4Q16.
* SME billing base reclassified from postpaid to prepaid from 1Q15 onwards.* SME subbase reclassification reported to BTRC from July 15 onwards
6.9 8.2 10.4 14.8 21.9 22.0
55.3
171 208
264
367
451
142
322
4Q15 1Q16 2Q16 3Q16 4Q16 FY15 FY16
Total traffic ('mil GB) Data usage/data subcriber/month (MB)
20%18%
24%27%
29%
3,717 4,195
4,624 5,225
7,711
4Q15 1Q16 2Q16 3Q16 4Q16
Smartphone penetration Total 3G BTS
141*
176*
137*
195*
139*
220*

4Q 2016 34
Revenue (NPR mn) Data revenue as a % of total revenue
EBITDA (NPR mn) & margins (%)
EBITDA
Margin 69.3% 65.7% 64.7% 60.2% 66.4%
PAT (NPR mn) & margins (%)
PAT
Margin 41.0% 34.5% 38.6% 31.1% 34.0%64.3% 64.2% 32.9% 34.6%
Nepal
Ncell: financial performanceStrong FY16 performance driven by strong growth in core mobile revenues, partially offset by ILD.
13,802 14,054 15,392 14,862 14,343
57,260 58,652
4Q15 1Q16 2Q16 3Q16 4Q16 FY15 FY16
12%14%
15%
17%18%
10%
16%
4Q15 1Q16 2Q16 3Q16 4Q16 FY15 FY16
9,561 9,230 9,962 8,940 9,528
36,823 37,659
4Q15 1Q16 2Q16 3Q16 4Q16 FY15 FY16
5,653 4,852 5,944 4,621 4,880
18,836 20,297
4Q15 1Q16 2Q16 3Q16 4Q16 FY15 FY16

4Q 2016 35
Operating Expenses
31 Dec 15 31 Mar 16 30 June 16 30 Sept 16 31 Dec 16
Capitalised Capex 11,409 1,323 2,570 4,140 6,555
Cash and Cash Equivalents 41,523 42,711 41,985 47,975 38,857
Gross Debt - - - - -
Net Assets 68,039 72,892 78,835 83,456 78,006
Gross Debt / Equity (x) - - - - -
Gross Debt / EBITDA (x) - - - - -
% of Revenue 4Q15 1Q16 2Q16 3Q16 4Q16 FY15 FY16
Direct Expenses 8.3% 8.2% 8.7% 8.6% 8.9% 10.0% 8.6%
Sales and Marketing 3.8% 4.9% 5.2% 8.1% 5.3% 4.7% 5.9%
Network Cost 4.0% 7.0% 7.2% 9.9% 6.3% 6.6% 7.6%
Staff Cost 5.5% 5.8% 5.6% 5.3% 3.5% 5.6% 5.0%
Bad debts 1.5% - 0.3% -0.3% -1.8% 0.4% -0.4%
Others 7.6% 8.4% 8.3% 8.2% 11.4% 8.4% 9.0%
Total Expenses 30.7% 34.3% 35.3% 39.8% 33.6% 35.7% 35.8%
EBITDA Margin 69.3% 65.7% 64.7% 60.2% 66.4% 64.3% 64.2%
Depreciation & Amortisation 17.9% 18.1% 16.6% 16.0% 15.8% 16.8% 16.6%
Financial Position (NPR mn)
Nepal
Ncell: financial performanceIn spite of falling ILD revenue, cost saving initiatives sustains FY16 EBITDA margin at 64.2%.
4Q 2016 36
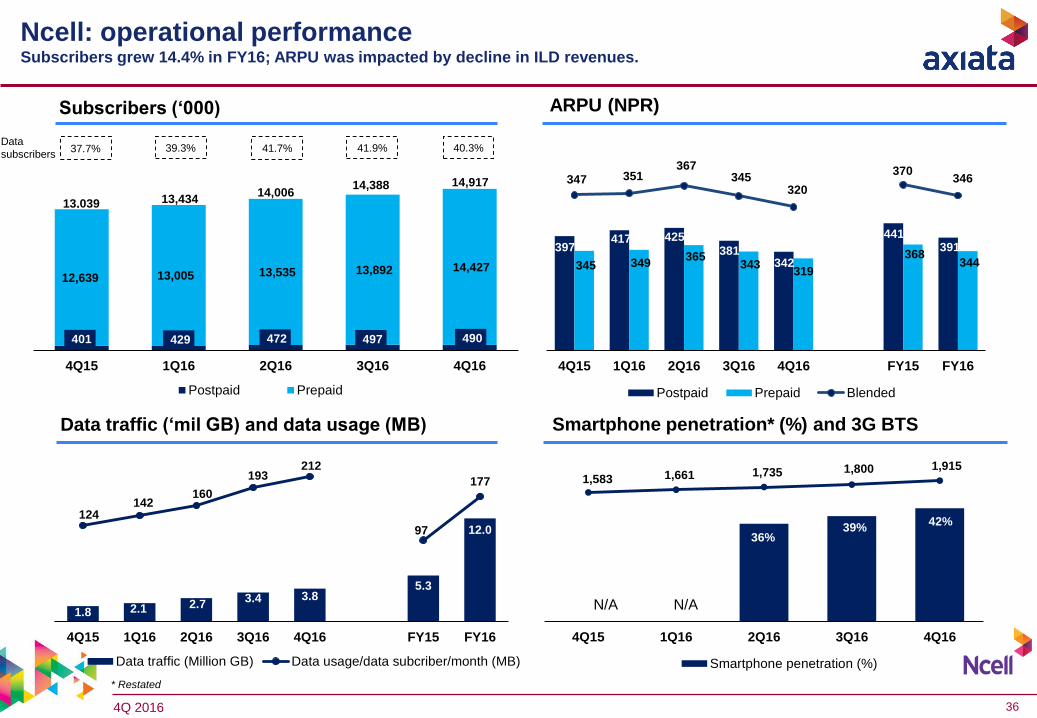
36%39%
42%
1,583 1,661 1,735 1,800 1,915
(2,000)
(1,500)
(1,000)
(500)
-
500
1,000
1,500
2,000
2,500
0
0.1
0.2
0.3
0.4
0.5
0.6
4Q15 1Q16 2Q16 3Q16 4Q16
Smartphone penetration (%)
Nepal
ARPU (NPR)Subscribers (‘000)
Data
subscribers37.7% 39.3% 41.7% 41.9% 40.3%
Data traffic (‘mil GB) and data usage (MB) Smartphone penetration* (%) and 3G BTS
* Restated
Ncell: operational performanceSubscribers grew 14.4% in FY16; ARPU was impacted by decline in ILD revenues.
N/A N/A
401 429 472 497 490
12,639 13,005 13,535 13,892 14,427
4Q15 1Q16 2Q16 3Q16 4Q16
Postpaid Prepaid
13,039 13,43414,006
14,388 14,917
397 417 425
381 342
441 391
345 349 365
343 319
368 344
347 351 367
345 320
370 346
-
50
100
150
200
250
300
350
400
450
-
100
200
300
400
500
600
700
4Q15 1Q16 2Q16 3Q16 4Q16 FY15 FY16
Postpaid Prepaid Blended
1.8 2.1 2.73.4 3.8
5.3
12.0
124 142
160
193 212
97
177
(50)
-
50
100
150
200
0
2000
4000
6000
8000
10000
12000
14000
16000
18000
4Q15 1Q16 2Q16 3Q16 4Q16 FY15 FY16
Data traffic (Million GB) Data usage/data subcriber/month (MB)

4Q 2016 37
Foreign exchange
Source: Bloomberg
Local Currency
Average Rate FY
Dec'15
Average Rate
Q3'16
Average Rate
Q4'16
Average Rate FY
Dec'16
QoQ
Appreciation/
(Depreciation)
against MYR
FY Appreciation/
(Depreciation)
against MYR
QoQ Appreciation/
(Depreciation)
against USD
FY Appreciation/
(Depreciation)
against USD
(%) (%) (%) (%)
INDONESIAN RUPIAH, IDR 0.000291 0.000308 0.000326 0.000311 5.84 6.87 (0.80) 0.61
SRI LANKA RUPEE, LKR 0.028667 0.027804 0.029209 0.028359 5.05 (1.07) (1.54) (6.87)
BANGLADESHI TAKA, BDT 0.050062 0.051712 0.055107 0.052835 6.57 5.54 (0.12) (0.65)
US DOLLAR, USD 3.900961 4.049619 4.320765 4.143921 6.70 6.23 0.00 0.00
SINGAPORE DOLLAR, SGD 2.836184 2.994435 3.065640 3.000212 2.38 5.78 (4.05) (0.42)
PAKISTAN RUPEE, PKR 0.037952 0.038693 0.041251 0.039573 6.61 4.27 (0.08) (1.84)
INDIAN RUPEE, INR 0.060762 0.060465 0.064101 0.061668 6.01 1.49 (0.64) (4.46)
NEPALESE RUPEE, NPR NA 0.037789 0.040066 0.038506 6.03 NA (0.63) NA
Local
CurrencyClosing Rate Dec'15 Closing Rate Sep'16 Closing Rate Dec'16 QoQ % Dec'15 vs Dec'16 %
IDR 0.000311 0.000318 0.000333 4.7% 7.1%
LKR 0.029800 0.028100 0.030000 6.8% 0.7%
BDT 0.054723 0.052653 0.057021 8.3% 4.2%
USD 4.292000 4.121500 4.486000 8.8% 4.5%
SGD 3.037000 3.023400 3.100600 2.6% 2.1%
PKR 0.040937 0.039382 0.042885 8.9% 4.8%
INR 0.064600 0.061621 0.066063 7.2% 2.3%
NPR NA 0.038512 0.041289 7.2% NA


