34
1 4Q 2020 Investor Conference Presentation February 11, 2021 Andrew Lane President & CEO Kelly Youngblood Executive Vice President & CFO

14Q 2020 Investor Conference Presentation
4Q 2020 Investor Conference PresentationFebruary 11, 2021
Andrew LanePresident & CEO
Kelly YoungbloodExecutive Vice President & CFO

24Q 2020 Investor Conference Presentation
This presentation contains forward-looking statements within the meaning of Section 27A of the Securities Act and Section 21E of the Exchange Act. Words such as “will,” “expect,” “look forward,” “guidance,” “targeted”, “goals”, and similar expressions are intended to identify forward-looking statements. Statements about the company’s business, including its strategy, its industry, the company’s future profitability, the company’s guidance on its sales, adjusted EBITDA, adjusted net income, adjusted diluted EPS, adjusted SG&A, gross profit, gross profit percentage, adjusted gross profit, adjusted gross profit percentage, tax rate, capital expenditures and cash from operations, free cash flow, free cash flow after dividends, growth in the company’s various markets and the company’s expectations, beliefs, plans, strategies, objectives, prospects and assumptions are not guarantees of future performance. These statements are based on management’s expectations that involve a number of business risks and uncertainties, any of which could cause actual results to differ materially from those expressed in or implied by the forward-looking statements. These statements involve known and unknown risks, uncertainties and other factors, most of which are difficult to predict and many of which are beyond our control, including the factors described in the company’s SEC filings that may cause our actual results and performance to be materially different from any future results or performance expressed or implied by these forward-looking statements, including the company’s Current Report on Form 8-K dated February 11, 2021.
For a discussion of key risk factors, please see the risk factors disclosed in the company’s SEC filings, which are available on the SEC’s website at www.sec.govand on the company’s website, www.mrcglobal.com. Our filings and other important information are also available on the Investor Relations page of our website at www.mrcglobal.com.
Undue reliance should not be placed on the company’s forward-looking statements. Although forward-looking statements reflect the company’s good faith beliefs, reliance should not be placed on forward-looking statements because they involve known and unknown risks, uncertainties and other factors, which may cause the company’s actual results, performance or achievements or future events to differ materially from anticipated future results, performance or achievements or future events expressed or implied by such forward-looking statements. The company undertakes no obligation to publicly update or revise any forward-looking statement, whether as a result of new information, future events, changed circumstances or otherwise, except to the extent required by law.
Statement Regarding Use of Non-GAAP Measures:The Non-GAAP financial measures contained in this presentation (adjusted EBITDA and adjusted gross profit, adjusted net income, adjusted diluted EPS, adjusted SG&A, free cash flow and free cash flow after dividends) are not measures of financial performance calculated in accordance with U.S. Generally Accepted Accounting Principles (GAAP) and should not be considered as alternatives to net income, gross profit or cash from operations. They should be viewed in addition to, and not as a substitute for, analysis of our results reported in accordance with GAAP. Management believes that these non-GAAP financial measures provide investors a view to measures similar to those used in evaluating our compliance with certain financial covenants under our credit facilities and provide meaningful comparisons between current and prior year period results. They are also used as a metric to determine certain components of performance-based compensation. They are not necessarily indicative of future results of operations that may be obtained by the company.
Forward Looking Statements & Non-GAAP Disclaimer

34Q 2020 Investor Conference Presentation
Largest Pipe, Valves & Fittings (PVF) Distributor – 2020 Sales of $2.6B
Gas Utilities 33%
Downstream & Industrial 31%
Upstream Production 23%
Midstream Pipeline 13%
Commodity price independent
2/3rd less commodity price dependent
MRC Global is a Leader in PVF Distribution – An Infrastructure Company
Industrial Distributor with Diversified Business Mix• Counter-cyclical cash flow generation & strong balance sheet• Cash flow generation in modest growth periods• Balanced portfolio across gas utilities, downstream &
industrial, upstream production & midstream pipeline sectors• Product mix focused on higher margin offerings
Key Role in Global Supply Chains of Energy Companies• Create value for both customers & suppliers• Closely integrated into customer supply chains• Broad footprint with approximately 230 service locations in 17
countries• Premier quality program, material sourcing & customer
service
Balanced Approach to Capital Allocation• Strong balance sheet with financial flexibility through the
cycle
Note: For the twelve months ended December 31, 2020
3
Revenue by Industry Sector

44Q 2020 Investor Conference Presentation
Compelling Investment OpportunityWorld-class Management Team with Significant Distribution & Energy Experience
4
• Market leader in PVF distribution, serving critical function to the energy industry
• Diversified across sectors, regions & customers –approximately half of business independent of energy prices
• Counter-cyclical cash flow and strong balance sheet
• Differentiated global platform creates customer value
• Organic growth potential via market share gains from expanded multi-year MRO contracts & long-term secular growth from global energy demand
• Proven history of driving continuous productivity improvements
• Industry consolidator with proven success in acquiring & integrating businesses

54Q 2020 Investor Conference Presentation
2020 Accomplishments & Key Corporate GoalsCreating Sustainable Shareholder Value Through the Cycle
• Preserved and grew market share, maintaining our position as the #1 PVF distributor to the energy industry
• Achieved 19.7% adjusted gross margins, despite market headwinds (new company record)
• Valve related revenues represented 40% of total company revenue
• Streamlined cost structure reducing operating costs by $113 million in 2020, positioning the company well for impending recovery
• E-Commerce based sales represent 35% of company revenue & 42% of North America revenue
• Generated $261 million in cash from operations and reduced net debt position by 49% - leverage ratio of 2.7X
• $119 million cash balance, $0 ABL balance and $551 million of liquidity exiting 2020
2020 Accomplishments
• Further end market diversification in less commodity price dependent businesses
• Gross margin strategy to yield consistent 20+% margins
• Higher incremental margins due to structural cost reductions – EBITDA margins targeted to return to upper single-digits
• Valve-centric growth strategy with goal to represent 45% of total company revenues
• Gas Utility sector targeted to exceed $1 billion in revenue
• E-commerce based sales with goal to represent 50% of total company revenues
• Continued debt reduction and strengthening of balance sheet
• Evaluate accretive M&A opportunities while maintaining financial discipline and strong balance sheet metrics
Goals 2021 - 2023
64Q 2020 Investor Conference Presentation
MIDDLE EAST / CASPIANASIA PACIFIC
Dubai, UAE
Perth, WA
Singapore
EUROPE
Stavanger, NO
Bradford, UK
Rotterdam, NL
NORDIC
Nisku, AB
Cheyenne, WY
Bakersfield, CA
Odessa, TX
Houston, TX
Munster, IN
Pittsburgh, PA
CANADA
USA
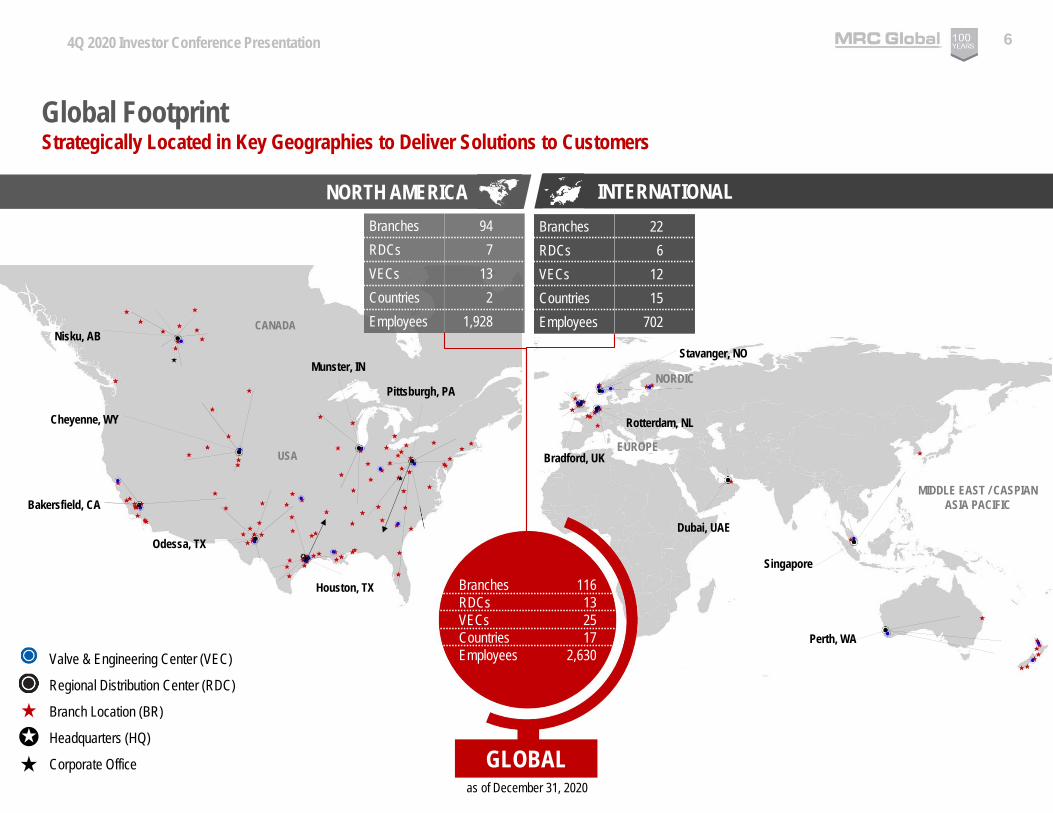
Global Footprint
NORTH AMERICA INTERNATIONAL
Strategically Located in Key Geographies to Deliver Solutions to Customers
Branches 22RDCs 6VECs 12Countries 15Employees 702
Branches 94RDCs 7VECs 13Countries 2Employees 1,928
GLOBAL
Branches 116RDCs 13VECs 25Countries 17Employees 2,630
as of December 31, 2020
Valve & Engineering Center (VEC)
Regional Distribution Center (RDC)
Branch Location (BR)
Headquarters (HQ)
Corporate Office
74Q 2020 Investor Conference Presentation
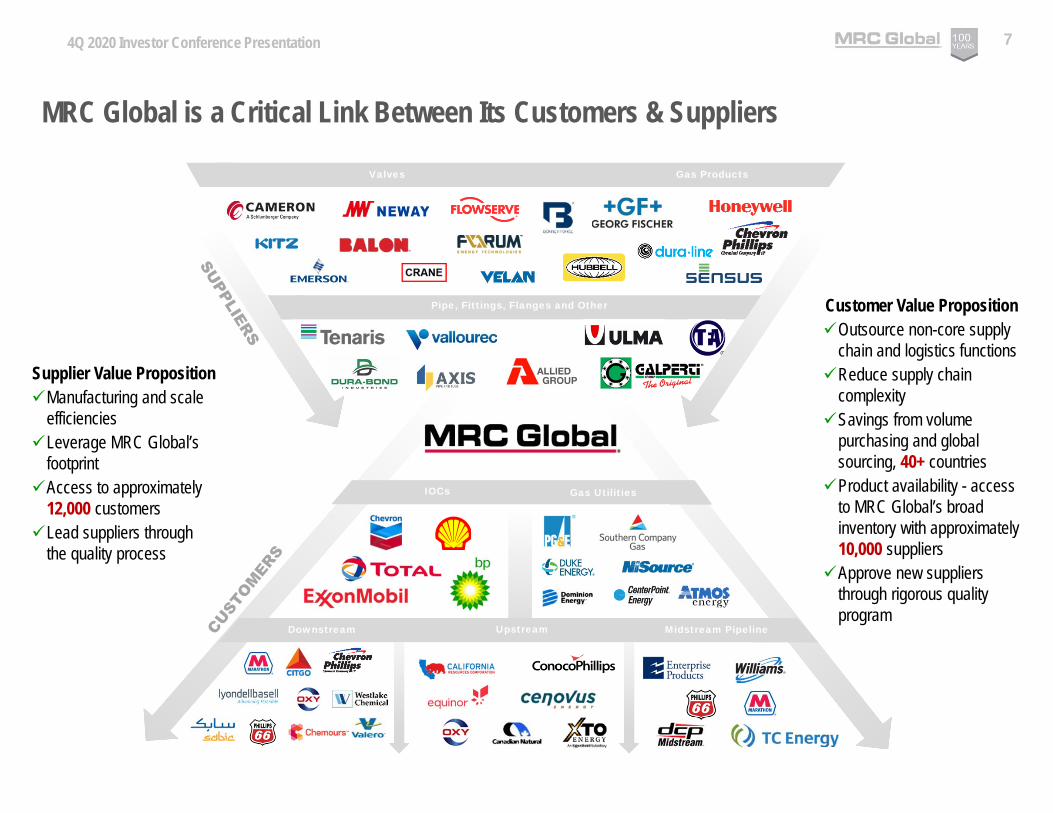
Supplier Value PropositionManufacturing and scale
efficienciesLeverage MRC Global’s
footprintAccess to approximately
12,000 customersLead suppliers through
the quality process
Customer Value PropositionOutsource non-core supply
chain and logistics functionsReduce supply chain
complexity Savings from volume
purchasing and global sourcing, 40+ countriesProduct availability - access
to MRC Global’s broad inventory with approximately 10,000 suppliersApprove new suppliers
through rigorous quality program
Valves Gas Products
Pipe, Fittings, Flanges and Other
IOCs Gas Utilities
Downstream Midstream PipelineUpstream
MRC Global is a Critical Link Between Its Customers & Suppliers

84Q 2020 Investor Conference Presentation 8
Long-Term End Market Growth Opportunities
• Gas utilities are investing in multi-year infrastructure modernization programs to upgrade old, lower pressure distribution systems and pipes, including steel & cast iron; enhancing the safety & integrity of the systems
• Continued commercial & residential infrastructure expansion
Gas Utilities
Downstream & Industrial• Plant spending & upgrades are being driven by aging infrastructure & regulatory mandates,
large & low-cost supply of hydrocarbon resources• Increasing global demand for plastics & low cost, stable feedstock drives petrochemical
investment particularly along the U.S. Gulf Coast
Upstream Production• Capitalizing on oil & gas demand while recognizing the early stages of global energy
transition & market consolidation• Steep shale decline curves & manufacturing approach to shale drilling result in
increasing well completions & facilities
Midstream Pipeline• The demand for energy results in increased need for takeaway capacity and processing
by transmission & gathering companies, including transportation to growing export terminals
• Aging pipeline infrastructure in the U.S. requires annual integrity investment

94Q 2020 Investor Conference Presentation
Well Positioned Through CycleDiversified by Region, Industry Sector & Product Line
Note: For the twelve months ended December 31, 2020
40%Valve, Automation,
Measurement & Instrumentation
25%Carbon Steel Pipe, Fittings & Flanges
20%Gas
Products
10%General Products
5%Stainless Steel & Alloy Pipe,
Fittings & Flanges
REVENUE BY
PRODUCT LINE
23%Upstream Production 33%
Gas Utilities
31%Downstream & Industrial11% Industrial20% Chemicals & Refining
REVENUE BY
INDUSTRY SECTOR13%
Midstream Pipeline
79%United States
5%Canada
16%International
REVENUE BY
REGION

104Q 2020 Investor Conference Presentation 10
Gas Utilities
$310
2010 2011 2012 2013 2014 2015 2016 2017 2018 2019 2020
$ millions
$832
Providing Gas Products to Regulated Gas Utility Customers• Business drivers:
o Multi-year pipeline integrity projects & enhancement projectso New & upgrade residential & commercial installations o Independent of commodity prices
• Characteristics:o Relatively stable, steady growtho Largest provider of products & services to U.S. Gas Utilitieso Contracts with 9 of the top 10 and 18 of the top 25 largest
gas utilities in the U.S., including: Atmos NiSource Duke CenterPoint PG&E Southern Company Gas Dominion
o Strong customer relationships – average 19 years under continuous contract
Growth• Expect a $1 billion revenue base within 2 years• Growth from customers’ multi-year integrity projects under
a guaranteed rate of return model as well as new market shares gains
• Customers’ capex budgets typically grow about 5-7% per year

114Q 2020 Investor Conference Presentation 11
Downstream & Industrial
Providing PVF to Refining, Chemical & Industrial Customers• Refining:
o Recurring MRO revenue from planned & unplanned maintenance
o Provide on-location “zone store” inventoryo Contracts with all the 10 largest refiners in the U.S.,
including: Marathon Petroleum Company Shell Chevron ExxonMobil Valero Phillips 66
• Chemical & Industrial:o Recurring MRO revenue from planned & unplanned
maintenanceo Distribute to a broad range of industrials including
mining, power, pulp & paper, & OEMs (original equipment manufacturers).
o Low gas prices provide stable, advantaged feedstock for plastics
o Customer budgets less oil & gas price dependento Petrochemical customers include: Chemours Westlake Chemicals LyondellBasell CP Chem

124Q 2020 Investor Conference Presentation 12
Upstream Production
Providing Completion Infrastructure to E&P Operators• Provide well hook-ups via on-site product trailers, above-ground
infrastructure PVF products for flow lines & tank batteries • Walk-in counter sales at strategically located branches in active oil
& gas production areas• Primary drivers are customers’ capital budgets for well
completions & production tank battery upgrades & expansions• Located in all major basins - revenue follows basin market activity
levels• Serve exploration & production (E&P) operators, including:
o Chevrono Shello ConocoPhillipso Canadian Natural Resourceso Equinoro BPo California Resources Corporation
134Q 2020 Investor Conference Presentation 13
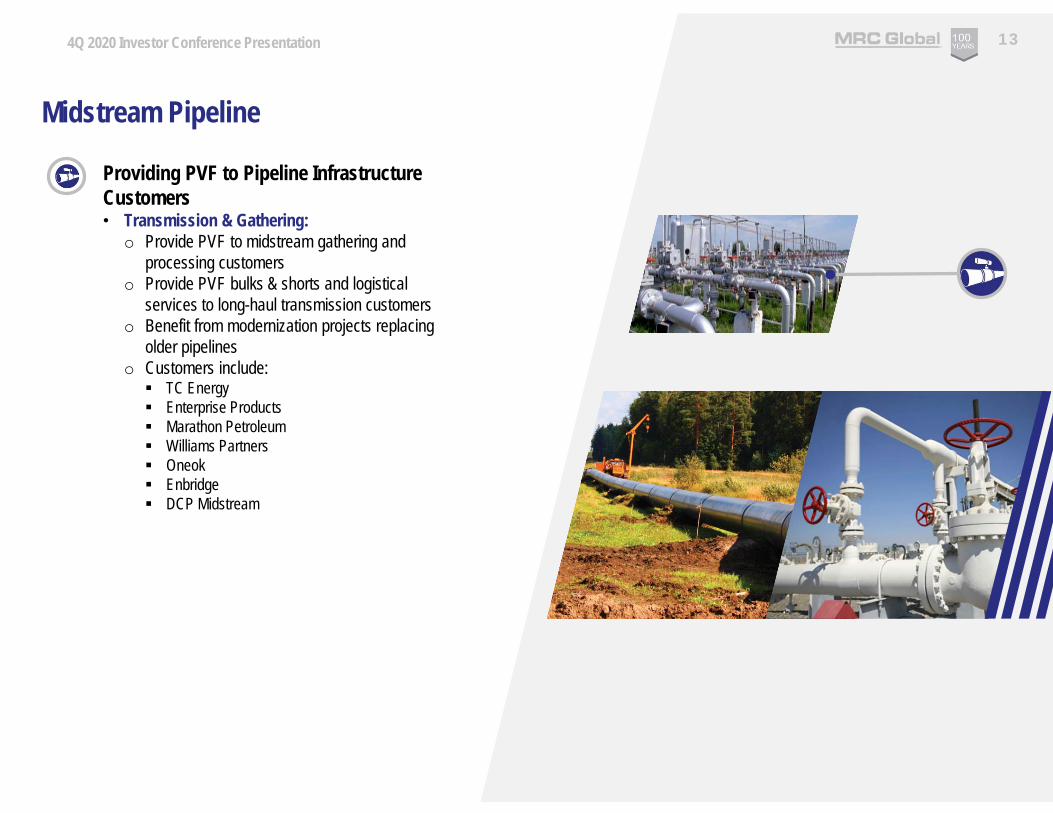
Midstream Pipeline
Providing PVF to Pipeline Infrastructure Customers• Transmission & Gathering:
o Provide PVF to midstream gathering and processing customers
o Provide PVF bulks & shorts and logistical services to long-haul transmission customers
o Benefit from modernization projects replacing older pipelines
o Customers include: TC Energy Enterprise Products Marathon Petroleum Williams Partners Oneok Enbridge DCP Midstream

144Q 2020 Investor Conference Presentation
Long-term StrategyCreating Sustainable Shareholder Value Through the Cycle
• Focus on higher margin products, end-markets & sales strategies
• Leverage scale & global supply chain
• Expand offering of value-added services to capture enhanced margin
• Focus on controlling costs & operating leverage
• Grow E-commerce business to expand market leadership, while lowering costs
Maximize Profitability
• Provide superior customer service & cost-saving supply chain solutions
• Focus on blue chip customers who demand value-added service & technical expertise
• Provide multi-channel engagement to capture buying
Grow Market Share
• Reduce cash conversion cycle
• Optimize inventory to maximize turnover & margin
• Continual operational efficiency improvements
Maximize Working Capital Efficiency
• Optimize capital structure with financial flexibility throughout the cycle
Optimize Capital Structure

154Q 2020 Investor Conference Presentation
Enable lower cost to servevia online channel withcentralized service.
Reduce high cost – low profitability branch
transactions
Digital Supply Chain Integration
Increase digital connections across the
PVF supply chain by integrating with
manufacturers and other vendors
Customer Experience
Differentiated digital capabilities and superior customer experience that
increase loyalty and “ease of doing business”
Grow Digital Sales Channel
Grow digital adoption with existing customers
Market our digital capabilities
Lower Costto Serve
Vision…to create an end-to-end digital supply that connects MRC Global to its customers and vendors at every touch point.
E-Commerce Platform Capabilities Increase Efficiencies

164Q 2020 Investor Conference Presentation
% of Global Revenue Generated via E-Commerce
19%
29% 30%27% 28%
35%
2015 2016 2017 2018 2019 2020
of the top 36 North American customers’ TTM revenueor approximately $729 million was transacted through MRCGO (e.g., all digital sales including catalog, EDI)
51%
Investing in E-Commerce TechnologyLong-Term Growth & Efficiency
• E-Commerce based revenue expected to increase to 50% of revenue by 2023
• Targeting smaller, transactional customers to lower the cost to serve –initial savings of $5 - $10 million expected by 2022
• 4Q20 e-commerce revenue was 39% of global & 48% of North America revenue
• Gas utilities are 62% of e-commerce revenue in 2020
• 2020 results:o $902 million of revenue generated through MRCGOTM/ e-commerceo 355 customers
16
174Q 2020 Investor Conference Presentation 17
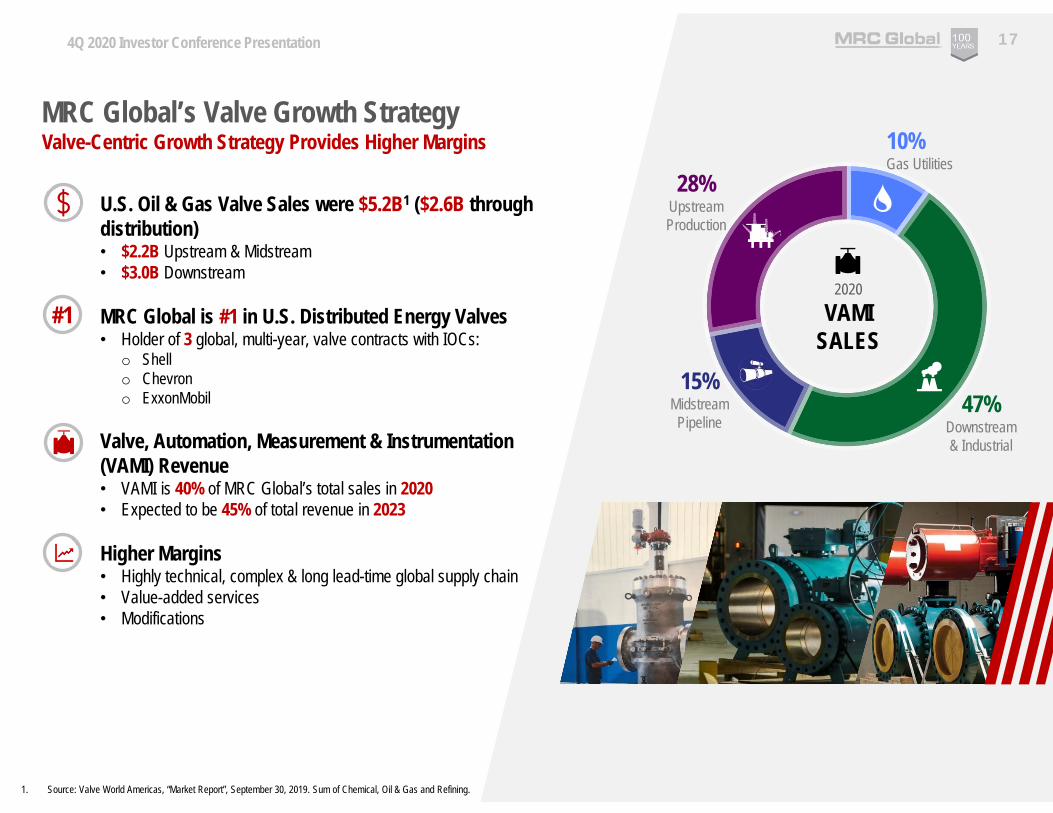
MRC Global’s Valve Growth StrategyValve-Centric Growth Strategy Provides Higher Margins
U.S. Oil & Gas Valve Sales were $5.2B1 ($2.6B through distribution)• $2.2B Upstream & Midstream • $3.0B Downstream
MRC Global is #1 in U.S. Distributed Energy Valves• Holder of 3 global, multi-year, valve contracts with IOCs:
o Shello Chevrono ExxonMobil
Valve, Automation, Measurement & Instrumentation (VAMI) Revenue• VAMI is 40% of MRC Global’s total sales in 2020• Expected to be 45% of total revenue in 2023
Higher Margins• Highly technical, complex & long lead-time global supply chain• Value-added services• Modifications
#1
1. Source: Valve World Americas, “Market Report”, September 30, 2019. Sum of Chemical, Oil & Gas and Refining.
28%Upstream Production
10%Gas Utilities
47%Downstream & Industrial
2020VAMI
SALES15%
Midstream Pipeline

184Q 2020 Investor Conference Presentation
Market Penetration – Valve Engineering & ModificationInvestment in Value-Added Valve Modification Capabilities
Valve Engineering & Modification Center at Houston Operations Complex In-House Capabilities:• Pipe pup transitions, stem extensions, coatings• Differential thermal relief systems • Modification services• Testing services (e.g., hydro testing, weld x-rays)• Documentation packages• Fast track actuation
Market Penetration Opportunity• Midstream pipelines valves• Gas utilities valves• Expected to double revenue to $100 million by 2023
Higher Margins• Value-added services• Supports strategic objective to maximize profitability
18

194Q 2020 Investor Conference Presentation 19
Maximizing Profitability & Working Capital Efficiency
Product Margin Enhancement• Investment in higher margin products & services:
o VAMI services - Valve actuation/automation, modification, engineered solutions, traceability, testing, ValidTorqueTM
o Expanded La Porte - 127,000 ft2 valve engineering & modification center in 2019
• Reduction of lower margin products and projects
Working Capital Management• 2020 Target – 19.5%–19.9% net working capital to sales
ratio • 2020 Result – 17.5% significantly exceeding the target &
setting a new company record• Investments in working capital are weighted to higher
margin products• Initiatives to increase efficiency underway (e.g.,
consolidating inventory in RDCs for better deployment)
Actively Managing Costs• SG&A, adjusted:
o $36 million lower in 4Q20 vs 4Q19 and $113 million lower in 2020 vs 2019
• Actions taken to reduce SG&A in 2020 - ~66% structuralo Closed & consolidated facilitieso Voluntary retirement & involuntary reduction in forceo Hiring and pay freezeso Indefinite suspension of 401K matchingo For eligible executives & employees, a reduction in short &
long-term incentiveso Furloughs in all operations
1. See reconciliation of non-GAAP measures to GAAP measures in the appendix2. Working capital defined as Current Assets (excluding Cash) – Current Liabilities. Sales are on trailing twelve months basis.
18.7%19.7%
2016 2020
Adjusted Gross Margin1
Portfolio Optimization
Optimizing Net Working Capital2
20.4%19.1%
17.5%
2018 2019 2020
Actively Managing SG&A, Adjusted1 Costs
$132
$96
4Q19 4Q20
$ millions

204Q 2020 Investor Conference Presentation
Strategic Capital Decisions Support GrowthWell-Positioned Balance Sheet• Advantageous debt agreements with favorable
terms, low interest rate and maturities 2022+• Liquidity of $551 million at 12/31/20 –
sufficient to support business strategy
Capital Deployment Opportunities• Debt reduction prioritized in near-term
o Reduced debt $168M YTD & $26M in 4Qo Repurchased $3M of Term Loan B at a 23%
discount in 1Q• E-commerce investments to drive cost
efficiencies & share gains• Returned $375 million of cash to shareholders
from 2015 to 2019o Repurchased 24.2 million shares at an average
price of $15.48 per share
Strong Operating Cash Flow Generation• CFFO annual average is $205 million from
2012 to 2020• Counter-cyclical cash flow generation• Business consumes/releases 18%-20% of
working capital per change in sales, on average
1. Investing and Financing cash flows from 2013 through 2020. Net Financing equals the total issuance less repayment of debt and equity excluding share repurchases.
Cumulative Annual Cash Flow from Operations
$240$564 $458
$1,148$1,401 $1,353 $1,342
$1,584$1,845
2012 2013 2014 2015 2016 2017 2018 2019 2020
$1.9 billion CFFO generated through the cycle
25%Share Repurchases
22%M&A
13%CAPEX
2013 –20201
USE OF CASH FLOW
40%Net Financing &
Other
20

214Q 2020 Investor Conference Presentation 21
Committed to Long-Term SustainabilityEnvironmental• Pollution control – our products function to prevent
hydrocarbon and chemical leaks – among other products, we provide low-e valve solutions to reduce fugitive waste emissions
• Committed to conservation, energy efficiency and safety
• Continually improving our environmental performance through increased efficiencies in our supply chain, including fewer transportation moves
Social Responsibility• Strong safety culture• Support the communities where we live and work • Committed to ongoing stakeholder engagement
Governance• Adopted SASB reporting standards• Executive compensation tied to safety metric• ESG Management Committee reports to
Governance Committee

224Q 2020 Investor Conference Presentation 22
MRC Global’s ESG CommitmentCommitted to responsibly operating and long-term sustainability
For more information: Governance- Proxy: Proxy Statement for our 2020 Annual Meeting of StockholdersESG Reports: 2020 Environmental, Social Responsibility & Corporate Governance ReportESG Policies: Corporate Social ResponsibilityCommunity Engagement Community Involvement
Safety Performance• 2020 TRIR and LWDR were the best recorded
safety performance in the company’s history• 2020: Top Quartile Safety Performance in a
National Association Wholesaler-Distributors Survey (compared to last results in 2019 survey)
Sustainable Environment• 94% of 2020 valve sales from inventory are “Low-E”
valves, preventing fugitive emissions of methane & other greenhouse gases
• Reduced North American Scope 1 emissions by approx. 44% from 2013 to 2020
• Produced less waste and increased U.S. recycling diversion by 3% in 2020 (12%) from 2019 (9%)
Supplier Quality Process (Processes, Policies & Audits)• Increase ethical behavior in our supply chain• Avoid improper labor practices• Encourage sustainability
Diversity and Inclusion• 33% of Board of Directors from Diversity Groups• Women make up 45% of global corporate
employees

234Q 2020 Investor Conference Presentation
Quarterly & Financial Performance YTD ($ millions, except per share data)
$766 $585 $579
$3,662
$2,560
4Q 19 3Q 20 4Q 20 2019 2020
$23 $24 $22
$201
$97
4Q19 3Q20 4Q20 2019 2020
3.0% 4.1% 3.8% 5.5% 3.8%
SALES
ADJUSTED EBITDA & % MARGIN1
$151 $115 $114
$719
$504
4Q 19 3Q 20 4Q 20 2019 2020
$(0.21)
$(0.10)$(0.05)
$0.36
$(0.24)
4Q19 3Q20 4Q20 2019 2020
ADJUSTED GROSS PROFIT & % MARGIN1
ADJUSTED DILUTED EPS1
1. See reconciliation of non-GAAP measures to GAAP measures in the appendix
19.7% 19.7% 19.7% 19.6% 19.7%

244Q 2020 Investor Conference Presentation
Strong Balance Sheet & Financial Flexibility ($ millions)
$551
$409 $383
4Q 19 3Q 20 4Q 20
2.6x 3.8x 2.7xNet Leverage1:
$108 $94 $83
$242 $261
4Q19 3Q20 4Q20 2019 2020
TOTAL DEBT
CASH FLOW FROM OPERATIONS
1. Net leverage multiples represent net debt / trailing twelve months adjusted EBITDA. Net debt is total debt less cash.2. Return on average net capital employed is defined as net income plus interest expense after-tax, divided by average net capital employed (debt plus equity).Calculated with GAAP figures.
December 31, 2020Cash and Cash Equivalents $119 Total Debt (including current portion):
Term Loan B due 2024(net of discount & deferred financing costs) $ 383
Global ABL Facility due 2022 -Total Debt $ 383
Preferred stock 355Common stockholders’ equity 350Total Capitalization $ 1,088
Liquidity $ 551
8.2% 8.1% 7.2%
-12.8%
-3.6%
4.4% 6.2% 4.3%
-19.1%
2012 2013 2014 2015 2016 2017 2018 2019 2020
CAPITAL STRUCTURE
RETURN ON AVERAGE NET CAPITAL EMPLOYED2

254Q 2020 Investor Conference Presentation
APPENDIX

264Q 2020 Investor Conference Presentation 26
Customer Contract Wins & Renewals
Customer Type/ Scope Products Geography
LyondellBasell Renewal PVF U.S.
Albemarle Renewal PVF U.S.
PG&E Renewal Gas products U.S.
Dominion Renewal with expanded scope Gas products U.S.
TECO Renewal Gas Products U.S.
Ameren New Gas products U.S.
Noble Midstream New Valves, Fittings and Flanges U.S.
Eversource Renewal with expanded scope Gas products U.S.
Total New Valves Europe & West Africa
INEOS Renewal PVF U.S.
Chevron – Canada New Integrated Supply Canada
SoCal Gas New PFF U.S.
CenterPoint New Integrated Supply U.S.
Oneok New Valves U.S.
ConocoPhillips Renewal PVF N.A.
Chevron-TCO MRO Renewal Valves KZ
Atmos Renewal Integrated Supply U.S.
People’s Gas Renewal PVF U.S.
Selected Recent Contract Awards & Renewals
APPENDIX
Strong Record Yields Growth Opportunities
Renew Existing & Obtain New MRO Contract Customers• Approximately 56% of sales are from our top 25 customers1
Expand Global Chemical & Valve Businesses• Target – Percent of total revenue from valves, automation,
measurement and instrumentation: Target - 45% in 2023(2020 = 40%)
Continue to Expand Integrated Supply Business• 33% of total revenue1
Diversified Customer Base• Serve 200+ fabrication customers
1. For the twelve months ended December 31, 2020
1
2
3
4
$314 $329 $395 $381$242
2016 2017 2018 2019 2020
Fabrication Customer Revenue (millions)

274Q 2020 Investor Conference Presentation 27
Capital Structure & Liquidity Support Growth
Liquidity & Debt Waterfall (millions)
$119
$432
$383
Available Liquidity 2024
$551
DebtRevolverCash
APPENDIX
Credit Agreements (ABL & Team Loan)• Global ABL matures in September 2022 and Term
Loan B matures in September 2024• Term Loan B has 1% per year amortization, paid
quarterly• Term Loan B requires repayment in form of annual
excess cash flow sweep based on leverage ratio (25 - 50% of annual “Excess Cash Flow”)
Financial Maintenance Covenants• Both the ABL & Term Loan B have no financial
maintenance covenant restrictions• In the ABL, a springing covenant is triggered if
“Excess Availability” is less than the greater of 10%of the “Line Cap” or $60 million, then a “Fixed Charge Coverage Ratio” of 1.0:1.0 is required. o “Excess Availability” is approximately $432 milliono “Fixed Charge Coverage Ratio” was 1.38 at Dec. 31,
2020
• The ABL & Term Loan B contain customary restrictive covenants based on leverage metrics that limit our ability to make investments, prepay certain indebtedness, grant liens, incur additional indebtedness, sell assets, make fundamental changes, enter into transactions with affiliates and pay dividends.

284Q 2020 Investor Conference Presentation
Annual Financial Performance ($ millions, except per share data)
SALES
ADJUSTED EBITDA & % MARGIN1
ADJUSTED GROSS PROFIT & % MARGIN1
ADJUSTED DILUTED EPS1
1. See reconciliation of non-GAAP measures to GAAP measures in the appendix
APPENDIX
$5,571 $5,231 $5,933
$4,529
$3,041 $3,646 $4,172
$3,662 $2,560
2012 2013 2014 2015 2016 2017 2018 2019 2020Y-o-Y Growth (6%) 13% (24%) (33%) 20% 14% (12%) (30%)
Y-o-Y Growth (17%) 10% (45%) (68%) 139% 56% (28%) (52%)
$463
$386 $424
$235
$75
$179
$280 $201
2012 2013 2014 2015 2016 2017 2018 2019 2020
8.3% 7.4% 7.1% 5.2% 2.5% 4.9% 6.7% 5.5% 3.8%
$1,058 $1,009 $1,120
$814
$568 $683
$819 $719
$504
2012 2013 2014 2015 2016 2017 2018 2019 2020Y-o-Y Growth (5%) 11% (27%) (30%) 20% 20% (12%) (30%)
19.0% 19.3% 18.9% 18.0% 18.7% 18.7% 19.6% 19.6% 19.7%
$1.87 $1.46 $1.65
$0.42
$(0.67)
$0.22
$1.10
$0.36
$(0.24)
2012 2013 2014 2015 2016 2017 2018 2019 2020
Y-o-Y Growth (22%) 13% (75%) NM NM NM (67%) NM

294Q 2020 Investor Conference Presentation
Balance Sheet ($ millions)
TOTAL DEBT
CASH FLOW FROM OPERATIONS
CAPITAL STRUCTURE
NET WORKING CAPITAL AS % OF SALES2
APPENDIX
1. Net leverage multiples represent net debt / trailing twelve months adjusted EBITDA. Net debt is total debt less cash.2. Working capital defined as current assets (excluding cash) – current liabilities. Sales are on trailing twelve months basis.
$1,245 $978
$1,447
$519 $414 $526 $684 $551
$383
2012 2013 2014 2015 2016 2017 2018 2019 2020
2.6x 2.5x 3.4x 1.9x 4.0x 2.7x 2.3x 2.6x 2.7x
Net Leverage1:
December 31, 2020Cash and Cash Equivalents $ 119Total Debt (including current portion):
Term Loan B due 2024(net of discount & deferred financing costs) $ 383
Global ABL Facility due 2022 -Total Debt $ 383
Preferred stock 355Common stockholders’ equity 350Total Capitalization $ 1,088
Liquidity $ 551
$240 $324
$(106)
$690
$253
$(48) $(11)
$242 $261
2012 2013 2014 2015 2016 2017 2018 2019 2020
20.9%20.2%
24.9%
19.7%18.9% 19.4%
20.4%19.1%
17.5%
2012 2013 2014 2015 2016 2017 2018 2019 2020

304Q 2020 Investor Conference Presentation
THREE MONTHS ENDED YEAR ENDED DECEMBER 31
($ millions) Dec 31, 2020
Sept. 30, 2020
Dec. 30, 2019 2020 2019 2018 2017 2016 2015 2014 2013 2012
Gross profit $ 90 $ 114 $ 131 $ 431 $ 653 $ 689 $ 582 $ 468 $ 786 $ 1,018 $ 955 $ 1,014
Depreciation and amortization 5 5 5 20 21 23 22 22 21 22 22 19
Amortization of intangibles 6 7 9 26 42 45 45 47 60 68 52 49
(Decrease) increase in LIFO reserve 1 (11) 1 (19) (2) 62 28 (14) (53) 12 (20) (24)
Inventory charges and other 12 - 5 46 5 - 6 45 - - - -
Adjusted Gross Profit $ 114 $ 115 $ 151 $ 504 $ 719 $ 819 $ 683 $ 568 $ 814 $ 1,120 $ 1,009 $ 1,058
APPENDIX
Adjusted Gross Profit Reconciliation
Note: Adjusted gross profit is a non-GAAP measure. For a discussion of the use of adjusted gross profit, see our Current Report on Form 8-K dated February 11, 2021.

314Q 2020 Investor Conference Presentation
THREE MONTHS ENDED
($ millions) Dec. 31, 2020 Dec. 31, 2019
SG&A $ 97 $ 141
Severance and restructuring (2) (4)
Facility Closures 1 -
Supplier bad debt - (5)
Adjusted SG&A $ 96 $ 132
APPENDIX
Adjusted SG&A Reconciliation
Note: Adjusted SG&A is a non-GAAP measure. For a discussion of the use of adjusted SG&A, see our Current Report on Form 8-K dated February 11, 2021.

324Q 2020 Investor Conference Presentation
THREE MONTHS ENDED YEAR ENDED DECEMBER 31
($ millions) Dec. 31, 2020 Sept. 30, 2020 Dec. 31, 2019 2020 2019 2018 2017 2016 2015 2014 2013 2012
Net income (loss) $ (5) $ 3 $ (24) $ (274) $ 39 $ 74 $ 50 $ (83) $ (331) $ 144 $ 152 $ 118Income tax expense (benefit) (2) 5 5 (9) 27 21 (43) (8) (11) 82 85 64Interest expense 6 7 9 28 40 38 31 35 48 62 61 113Depreciation and amortization 5 5 5 20 21 23 22 22 21 22 22 19Amortization of intangibles 6 7 9 26 42 45 45 47 60 68 52 49Increase (decrease) in LIFO reserve 1 (11) 1 (19) (2) 62 28 (14) (53) 12 (20) (24)Equity-based compensation expense 4 3 4 12 16 14 16 12 10 9 15 8Foreign currency losses (gains) (1) 2 - 2 (1) (1) (2) 4 3 3 13 (1)Goodwill & intangible asset impairment - - - 242 - - - - 462 - - -Inventory-related charges 12 - 5 46 5 - 6 40 - - - -Facility closures (1) - - 17 - - - - - - - -Severance & restructuring charges 2 5 4 14 9 4 14 20 14 8 1 -Gain on sale of leaseback (5) - - (5) - - - - - - - -Recovery of supplier bad debt & Supplier bad debt - (2) 5 (2) 5 - - - - - - -(Gain) loss on early extinguishment of debt - - - (1) - - - - - - - 114Write off of debt issuance costs - - - - - 1 8 1 3 - - -Litigation matter - - - - - - 3 - 3 - - -Change in fair value of derivative instruments - - - - - (1) 1 (1) 1 1 (5) (2)Loss on disposition of non-core product line - - - - - - - - 5 10 - -Insurance charge - - - - - - - - - - 2 -Cancellation of executive employment agreement (cash
portion) - - - - - - - - - 3 - -
Expenses associated with refinancing - - - - - - - - - - 5 2Pension settlement - - - - - - - - - - - 4Other expense (income) - - - - - - - - - - 3 (1)Adjusted EBITDA $ 22 $ 24 $ 23 $ 97 $ 201 $ 280 $ 179 $ 75 $ 235 $ 424 $ 386 $ 463
APPENDIX
Adjusted EBITDA Reconciliation
Note: Adjusted EBITDA is a non-GAAP measure. For a discussion of the use of adjusted EBITDA, see our Current Report on Form 8-K dated February 11, 2021.

334Q 2020 Investor Conference Presentation
THREE MONTHS ENDEDDec. 31, 2020 Sept. 30, 2020 Dec. 31, 2019
($ millions) Amount Per Share Amount Per Share Amount Per Share
Net (loss) income attributable to common stockholders $ (11) $ (0.13) $ (3) $ (0.04) $ (30) $ (0.37)
Inventory-related charges, net of tax 9 0.11 - - 5 0.06
Facility closures, net of tax (1) (0.01) - - - -
Severance and restructuring, net of tax 2 0.02 5 0.06 3 0.04
Recovery of supplier bad debt and supplier bad debt, net of tax - - (2) (0.02) 5 0.06
Gain on sale leaseback (4) (0.05) - - - -
Increase (decrease) in LIFO reserve, net of tax 1 0.01 (8) (0.10) - -
Adjusted net (loss) income attributable to common stockholders $ (4) $ (0.05) $ (8) $ (0.10) $ (17) $ (0.21)
APPENDIX
Adjusted Net Income Reconciliation
Note: Adjusted net income is a non-GAAP measure. For a discussion of the use of adjusted net income, see our Current Report on Form 8-K dated February 11, 2021.

344Q 2020 Investor Conference Presentation
YEAR ENDED DECEMBER 31($ millions) 2020 2019 2018 2017 2016 2015 2014 2013 2012
Amount Per Share Amount Per Share Amount Per Share Amount Per Share Amount Per Share Amount Per Share Amount Per Share Amount Per Share Amount Per ShareNet income (loss) attributable to common stockholders
$ (298) $ (3.63) $ 15 $ 0.18 $ 50 $ 0.54 $ 26 $ 0.27 $ (107) $ (1.10) $ (344) $ (3.38) $ 144 $ 1.40 $ 152 $ 1.48 $ 118 $ 1.22
Goodwill and intangible asset impairment, net of tax 234 2.85 - - - - - - - - 402 3.94 - - - - - -
Inventory-related charges, net of tax 38 0.46 5 0.06 - - 6 0.06 33 0.34 - - - - - - - -
Severance and restructuring, net of tax 12 0.15 7 0.08 3 0.03 14 0.15 17 0.17 11 0.11 6 0.06 - - - -
Recovery of supplier bad debt and supplier bad debt, net of tax (2) (0.02) 5 0.06 - - - - - - - - - - - - - -
(Decrease) increase in LIFO reserve, net of tax (15) (0.18) (2) (0.02) 48 0.52 18 0.19 (9) (0.09) (33) (0.32) 8 0.08 (13) (0.13) (15) (0.15)
Loss on early extinguishment of debt, net of tax - - - - - - - - - - - - - - - - 74 0.76
Facility closures, net of tax 15 0.18 - - - - - - - - - - - - - - - -
Gain on sale leaseback (4) (0.05) - - - - - - - - - - - - - - - -
Litigation matter, net of tax - - - - - - 2 0.02 - - 2 0.02 - - - - - -
Write-off of debt issuance costs, net of tax - - - - 1 0.01 5 0.05 1 0.01 2 0.02 - - - - 1 0.01
Executive separation expense, net of tax - - - - - - - - - - - - - - 1 0.01 - -
Loss on disposition of non-core product lines, net of tax - - - - - - - - - - 3 0.03 8 0.08 - - - -
Insurance charge, net of tax - - - - - - - - - - - - - - 1 0.01 - -
Expenses associated with refinancing, net of tax - - - - - - - - - - - - - - 3 0.03 - -
Equity-based compensation acceleration, net of tax - - - - - - - - - - - - - - 3 0.03 - -
Income tax adjustment - - - - - - (50) (0.52) - - - - - - 3 0.03 - -
Cancellation of executive employment agreement, net of tax - - - - - - - - - - - - 3 0.03 - - - -
Pension settlement, net of tax - - - - - - - - - - - - - - - - 3 0.03
Adjusted net income (loss) attributable to common stockholders
$ (20) $ (0.24) $ 30 $ 0.36 $ 102 $ 1.10 $ 21 $0.22 $ (65) $ (0.67) $ 43 $ 0.42 $ 169 $ 1.65 $ 150 $ 1.46 $ 181 $ 1.87
APPENDIX
Adjusted Net Income Reconciliation
Note: Adjusted net income is a non-GAAP measure. For a discussion of the use of adjusted net income, see our Current Report on Form 8-K dated February 11, 2021.


