Page Consolidated Statements of Income 2 Consolidated Operating Results Consolidated Net Income 3 Segment Information 4 Business Segment Results Pipeline Group Earnings Before Interest Expense and Income Taxes 5 Throughput 6 Exploration & Production Earnings Before Interest Expense and Income Taxes 7 Sales Volumes, Realized Prices and Costs Per Unit 8 Marketing and Trading Earnings Before Interest Expense and Income Taxes 9 Operating Data 10 Power Earnings Before Interest Expense and Income Taxes 11 Field Services Earnings Before Interest Expense and Income Taxes 12 Other Earnings Before Interest Expense and Income Taxes 13 Schedule of Significant Items 14 Table of Contents Fourth Quarter 2005 EL PASO CORPORATION Operating Statistics 1
Transcript
Page
Consolidated Statements of Income 2
Consolidated Operating ResultsConsolidated Net Income 3Segment Information 4
Business Segment Results
Pipeline GroupEarnings Before Interest Expense and Income Taxes 5Throughput 6
Exploration & ProductionEarnings Before Interest Expense and Income Taxes 7Sales Volumes, Realized Prices and Costs Per Unit 8
Marketing and TradingEarnings Before Interest Expense and Income Taxes 9Operating Data 10
PowerEarnings Before Interest Expense and Income Taxes 11
Field ServicesEarnings Before Interest Expense and Income Taxes 12
OtherEarnings Before Interest Expense and Income Taxes 13
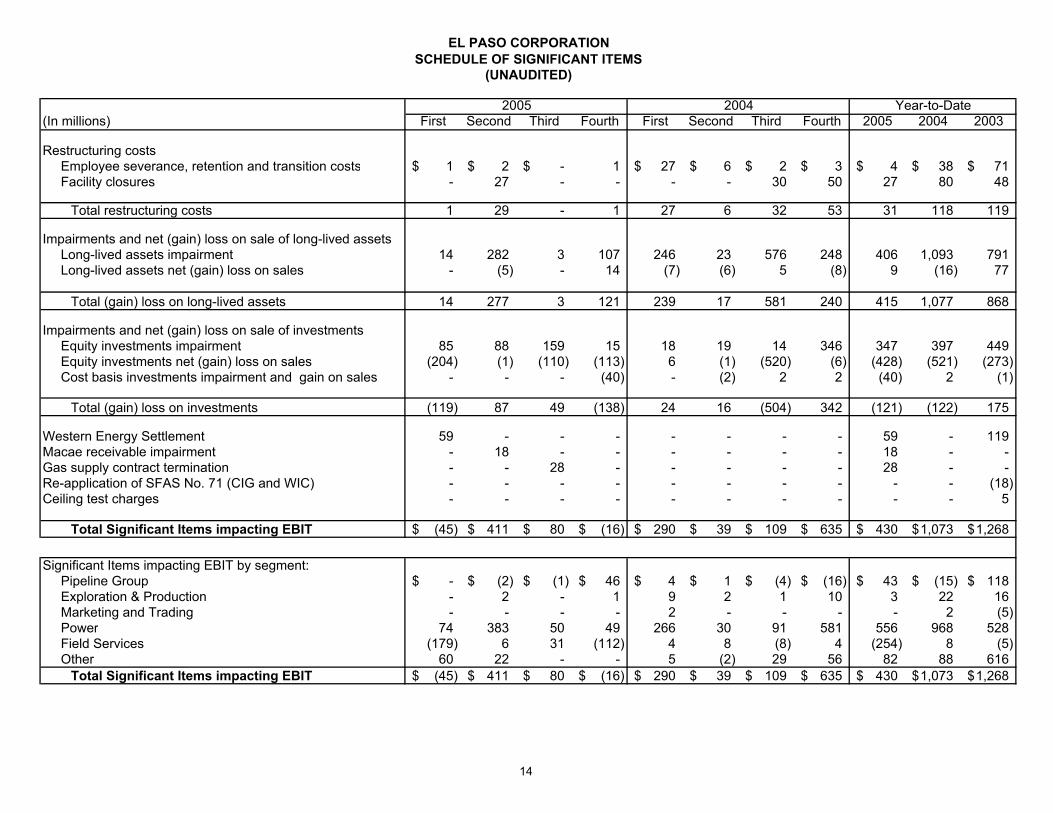
Schedule of Significant Items 14
Table of Contents
Fourth Quarter 2005
EL PASO CORPORATIONOperating Statistics
1
December 31, December 31,2005 2004 2005 2004
Operating revenues 957$ 1,275$ 4,017$ 5,539$
Operating expenses Cost of products and services 64 103 323 1,218 Operation and maintenance 793 592 2,024 1,744 Western Energy Settlement - - 59 - Depreciation, depletion and amortization 281 275 1,121 1,068 Loss on long-lived assets 121 240 407 1,077 Taxes, other than income taxes 59 56 270 250
1,318 1,266 4,204 5,357
Operating income (loss) (361) 9 (187) 182
Equity earnings and other income (expense) 255 (251) 585 635
Earnings (loss) before interest expense, income taxes, and other charges (106) (242) 398 817
Interest and debt expense 346 378 1,380 1,607
Return on preferred interests of consolidated subsidiaries - 7 9 25
Loss before income taxes (452) (627) (991) (815)
Income taxes (benefit) (169) (101) (289) 14
Loss from continuing operations (283) (526) (702) (829)
Discontinued operations, net of income taxes 125 (16) 100 (118)
Cumulative effect of accounting changes, net of income taxes (4) - (4) -
Net loss (162) (542) (606) (947)
Preferred stock dividends 10 - 27 -
Net loss available to common stockholders (172)$ (542)$ (633)$ (947)$
Diluted income (loss) per common shareLoss from continuing operations (0.45)$ (0.82)$ (1.13)$ (1.30)$ Discontinued operations, net of income taxes 0.20 (0.03) 0.16 (0.18) Cumulative effect of accounting changes, net of income taxes (0.01) - (0.01) -
Net loss per common share (0.26)$ (0.85)$ (0.98)$ (1.48)$
Diluted average common shares outstanding (000's) 655,390 639,320 646,130 638,948
EL PASO CORPORATIONCONSOLIDATED STATEMENTS OF INCOME
(In millions, except per share amounts)(UNAUDITED)
Twelve Months EndedThree Months Ended
2
(In millions, except per share amounts) First Second Third Fourth First Second Third Fourth 2005 2004 2003
(1) $4 million in 2005 resulting from the adoption of FIN No. 47, Accounting for Conditional Asset Retirement Obligations and $9 million in 2003 resulting from the adoption of SFAS No. 143, Accounting for Asset Retirement Obligations
(2) Refer to Schedule of Significant Items on page 14 for details
(UNAUDITED)
20042005
EL PASO CORPORATIONCONSOLIDATED NET INCOME
Year-to-Date
3
(In millions) First Second Third Fourth First Second Third Fourth 2005 2004 2003
Total Significant Items -$ 2$ -$ 1$ 9$ 2$ 1$ 10$ 3$ 22$ 16$ (1) Includes Brazil's mark-to-market loss of $10 million as of December 31, 2005 (2) Amounts are included in operating expenses on our consolidated statement of income (3) Production costs include lease operating costs and production related taxes (including ad valorem and severance taxes) (4) Other charges include ceiling test, restructuring costs, asset impairment and (gains) losses on asset sales
2005 2004 Year-to-Date
EXPLORATION & PRODUCTIONEARNINGS BEFORE INTEREST EXPENSE AND INCOME TAXES
(Excludes Intrasegment Transactions)
7
First Second Third Fourth First Second Third Fourth 2005 2004 2003Natural Gas Sales Volumes from Continuing Operations (MMcf)
Total production cost ($/Mcfe) 0.80$ 0.83$ 1.06$ 1.18$ 0.52$ 0.60$ 0.81$ 0.93$ 0.96$ 0.71$ 0.56$
Average general and administrative cost ($/Mcfe) 0.59$ 0.61$ 0.65$ 0.90$ 0.44$ 0.51$ 0.65$ 0.75$ 0.68$ 0.58$ 0.39$
Unit of production depletion cost ($/Mcfe) 2.00$ 2.05$ 2.11$ 2.25$ 1.58$ 1.64$ 1.75$ 1.81$ 2.10$ 1.69$ 1.31$ (1) Includes Canada and Hungary (2) Prices are stated after transportation costs
2005 2004
EXPLORATION & PRODUCTIONSALES VOLUMES, REALIZED PRICES AND COSTS PER UNIT
Year-to-Date
8
(In millions) First Second Third Fourth First Second Third Fourth 2005 2004 2003
Gross margin and other revenue (175)$ (21)$ (389)$ (211)$ (159)$ (141)$ (120)$ (88)$ (796)$ (508)$ (636)$
Operating expensesOperation and maintenance 10 9 14 21 13 10 15 15 54 53 183 Western Energy Settlement - - - - - - - - - - (25) Depreciation, depletion and amortization 1 1 1 1 3 3 4 3 4 13 25 Gain on long-lived assets - - - - - - - - - - (3) Taxes, other than income taxes - 1 - - - - - (12) 1 (12) 3
Analysis of Price Risk Management Activities and Forward Book Trading Portfolio Value at Risk: December 31, 2005
(In millions) One Day VAR-95% Confidence Level at 12/31/05 60$ Average VAR-95% Confidence Level during 2005 36$ High VAR-95% Confidence Level during 2005 60$ Low VAR-95% Confidence Level during 2005 12$
Forward Return of Cash Total CashRisk Management Assets and Liabilities Trading Book Collateral (2) Expectations (3)
Mark to Market Value and Cash Liquidation 2006 (233)$ 219$ (14)$ 2007 (105) 52 (53) 2008 (48) 43 (5) 2009 (57) 45 (12) 2010 (57) 59 2 Remainder (253) 234 (19)
Total (753)$ 652$ (101)$
(1) Average VAR was calculated using the historical simulation methodology at a 95% confidence level. (2) Return of cash collateral includes margin posted against our production hedge payables that are included in Exploration & Production segment's non-trading book.(3) Estimated present value of our expected settlements of accrual positions through 2028, assuming a reasonable utilization of transportation and
storage capacity, was $(345) million at December 31, 2005.
(In millions)
December 31, 2005
MARKETING AND TRADING
2005 2004 Year-to-Date
OPERATING DATA
10
(In millions) First Second Third Fourth First Second Third Fourth 2005 2004 2003
Gross margin and other revenue 30$ 67$ 17$ (4)$ 132$ 165$ 118$ 110$ 110$ 525$ 753$
Operating expensesOperation and maintenance 27 49 28 36 75 72 71 56 140 274 472 Depreciation, depletion and amortization 7 7 5 4 11 9 9 9 23 38 76 Loss on long-lived assets 13 277 - 76 240 16 77 236 366 569 185 Taxes, other than income taxes 7 9 7 (13) 11 13 10 6 10 40 40
Impairments and net (gain) loss on sale of long-lived assetsLong-lived assets impairment 14 282 3 107 246 23 576 248 406 1,093 791 Long-lived assets net (gain) loss on sales - (5) - 14 (7) (6) 5 (8) 9 (16) 77
Total (gain) loss on long-lived assets 14 277 3 121 239 17 581 240 415 1,077 868
Impairments and net (gain) loss on sale of investmentsEquity investments impairment 85 88 159 15 18 19 14 346 347 397 449 Equity investments net (gain) loss on sales (204) (1) (110) (113) 6 (1) (520) (6) (428) (521) (273) Cost basis investments impairment and gain on sales - - - (40) - (2) 2 2 (40) 2 (1)
Total (gain) loss on investments (119) 87 49 (138) 24 16 (504) 342 (121) (122) 175