35
UniCredit Group Presentation to Fixed Income Investors April 2013
| Date post: | 17-Apr-2018 |
| Category: |
Documents |
| Upload: | nguyendieu |
| View: | 216 times |
| Download: | 3 times |

UniCredit Group
Presentation to Fixed Income Investors
April 2013
2
Disclaimer
� This Presentation may contain written and oral “forward-looking statements”, which includes all statements that do not relate solely to historical or current facts and which are therefore inherently uncertain. All forward-looking statements rely on a number of assumptions, expectations, projections and provisional data concerning future events and are subject to a number of uncertainties and other factors, many of which are outside the control of UniCredit S.p.A. (the “Company”). There are a variety of factors that may cause actual results and performance to be materially different from the explicit or implicit contents of any forward-looking statements and thus, such forward-looking statements are not a reliable indicator of future performance. The Company undertakes no obligation to publicly update or revise any forward-looking statements, whether as a result of new information, future events or otherwise, except as may be required by applicable law. The information and opinions contained in this Presentation are provided as at the date hereof and are subject to change without notice. Neither this Presentation nor anypart of it nor the fact of its distribution may form the basis of, or be relied on or in connection with, any contract or investment decision
� The information, statements and opinions contained in this Presentation are for information purposes only and do not constitute a public offer under any applicable legislation or an offer to sell or solicitation of an offer to purchase or subscribe for securities or financial instruments or any advice or recommendation with respect to such securities or other financial instruments. None of the securities referred to herein have been, or will be, registered under the U.S. Securities Act of 1933, as amended, or the securities laws of any state or other jurisdiction of the United States or in Australia, Canada or Japan or any other jurisdiction where such an offer or solicitation would be unlawful (the “Other Countries”), and there will be no public offer of any such securities in the United States. This Presentation does not constitute or form a part of any offer or solicitation to purchase or subscribe for securities in the United States or the Other Countries
� Pursuant the consolidated law on financial intermediation of 24 February 1998 (article 154-bis, paragraph 2) Marina Natale, in her capacity as manager responsible for the preparation of the Company’s financial reports declares that the accounting information contained in this Presentation reflects the UniCredit Group’s documented results, financial accounts and accounting records
� Neither the Company nor any member of the UniCredit Group nor any of its or their respective representatives, directors or employees accept any liability whatsoever in connection with this Presentation or any of its contents or in relation to any lossarising from its use or from any reliance placed upon it

3
Executive SummaryUniCredit – a strong investment proposition with a successfully strengthened Balance Sheet
3
� A well diversified pan-European bank with a leading market
franchise in Italy, Germany, Austria and Central Ea stern Europe
� Continued strengthening of our capital base (includ ing a 7.5bn
capital increase) with CET1 at 10.84% and Total Cap ital at 14.52%
� De-leveraging pays off with one of the lowest lever age ratios in
Europe
� Highly liquid balance sheet with an immediately ava ilable liquidity
buffer of 149 bn – well above wholesale funding matur ing in 1 year
� Large reinforcement of provisions making us the bes t provisioned
bank in Italy
� Successful management actions, in particular discip lined cost
control, position us well for improved profitabilit y

4
Introduction & Strategy
Agenda
Annex
Consolidated Results 4Q12

5
UniCredit at a glanceA clear international profile based on a strong European identity
(1) Based on latest available data. Source: Sodali(*) Including unidentified shares owned by the Group and Cashes
Shareholders’ Structure (1)
� Strong local roots in over 20 countries
� Over 156,000 employees
� About 9,400 branches
� Around 33 mn customers in Europe
� One of the most important banks in Europe with
927 bn total assets
� Part of the 28 global systemically important
banks (G-SIBs) worldwide
� Market capitalization about 20 bn
� Capital increase 7.5 bn in 2012, with strong
response from all investor clusters
� Core Tier 1 Ratio at 10.84% under Basel 2.5
and 9.2% under Basel 3 fully loaded
UniCredit Highlights
Main shareholders:
� Stable shareholders, e.g. Foundations
� Institutional investors, e.g. Blackrock
� Retail investors
Other*
38.2%
3.2%
Domestic Institutional
Investors
Stable Shareholders
3.4%
32.7%
Retail International InstitutionalInvestors
22.5%
5
6
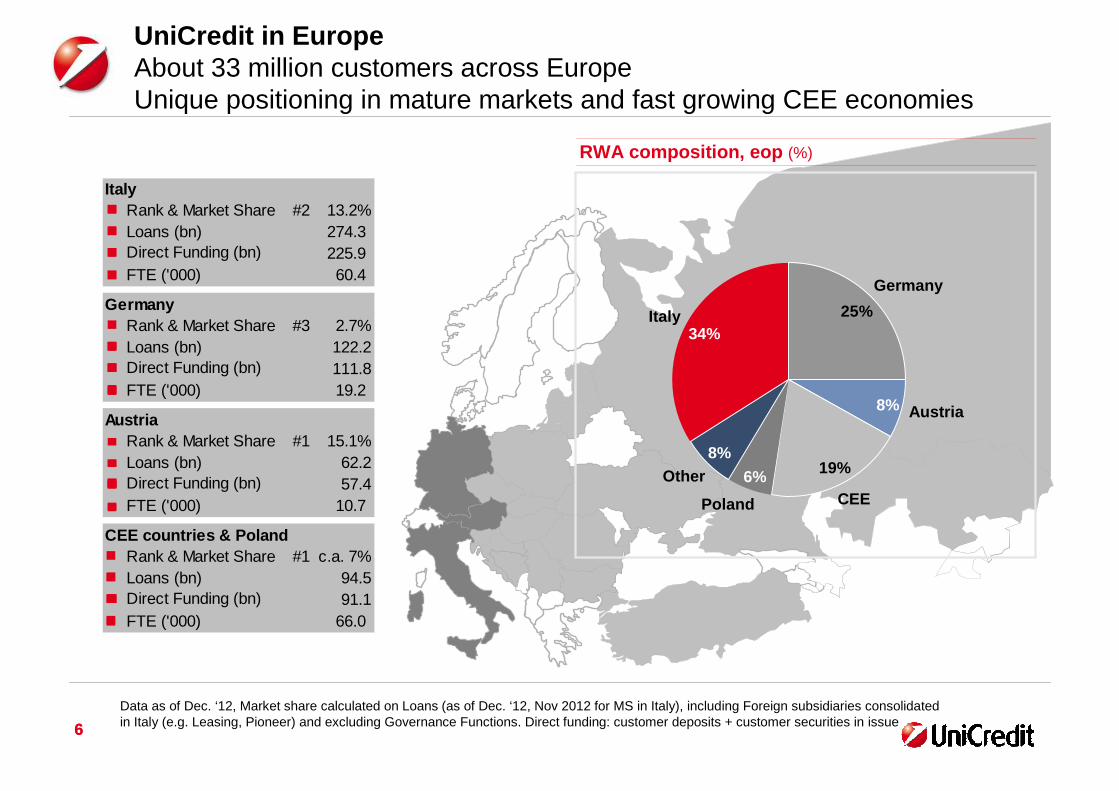
UniCredit in EuropeAbout 33 million customers across Europe Unique positioning in mature markets and fast growing CEE economies
6
Italy Rank & Market Share #2 13.2% Loans (bn) 274.3 Direct Funding (bn) 225.9 FTE ('000) 60.4
Germany Rank & Market Share #3 2.7% Loans (bn) 122.2 Direct Funding (bn) 111.8 FTE ('000) 19.2
Austria Rank & Market Share #1 15.1% Loans (bn) 62.2 Direct Funding (bn) 57.4 FTE ('000) 10.7
CEE countries & Poland Rank & Market Share #1 c.a. 7% Loans (bn) 94.5 Direct Funding (bn) 91.1 FTE ('000) 66.0
Data as of Dec. ‘12, Market share calculated on Loans (as of Dec. ‘12, Nov 2012 for MS in Italy), including Foreign subsidiaries consolidated in Italy (e.g. Leasing, Pioneer) and excluding Governance Functions. Direct funding: customer deposits + customer securities in issue
19%
25%
Other8%
Poland
6%CEE
Austria8%
Germany
Italy34%
RWA composition, eop (%)
77
Czech Rep., #4
Hungary, #7
Slovenia, #4
Croatia, #1
Slovakia, #5
Bosnia, #2
Baltics, #7- #10�200 employees�7 branches
Russia, #8�
�123 branches
Ukraine, #5�7,964 employees�506 branches
Romania, #6�2,967 employees�253 branches
Bulgaria, #1�3,835 employees�243 branches
Kazakhstan, #5�4,340employees�146 branches
Turkey, #6�16,441 employees�889 branches
’s Markets, #2
Serbia, #3
�917 employees�77 branches
Presence also in: Kyrgyzstan & Azerbaijan
Czech Rep., #4�1,957 employees�104 branches
Hungary, #7�1,878 employees�122 branches
Slovenia, #5�559 employees�35 branches
Croatia, #1�4,513 employees�141 branches
Slovakia, #5�1,159 employees�78 branches
Bosnia, #1�1,694 employees�134 branches
Baltics, #8 -#10�185 employees�8 branches
Russia, #8�3,666 employees�109 branches
Ukraine, #5�6,289 employees�418 branches
Romania, #6�2,799 employees�220 branches
Bulgaria, #1�3,793 employees� 215 branches
Kazakhstan, #5�3,281employees�139 branches
Turkey, #5�17,255 employees�987 branches
Poland #2�19,231 employees�1,003 branches
8.0%
6.5%
25.9%
7.1%
20.7%
8.1%
10.1%
8.8%
--1.4%1.7%
7.4%
3.7%
17.1%
9.8%
6.9%
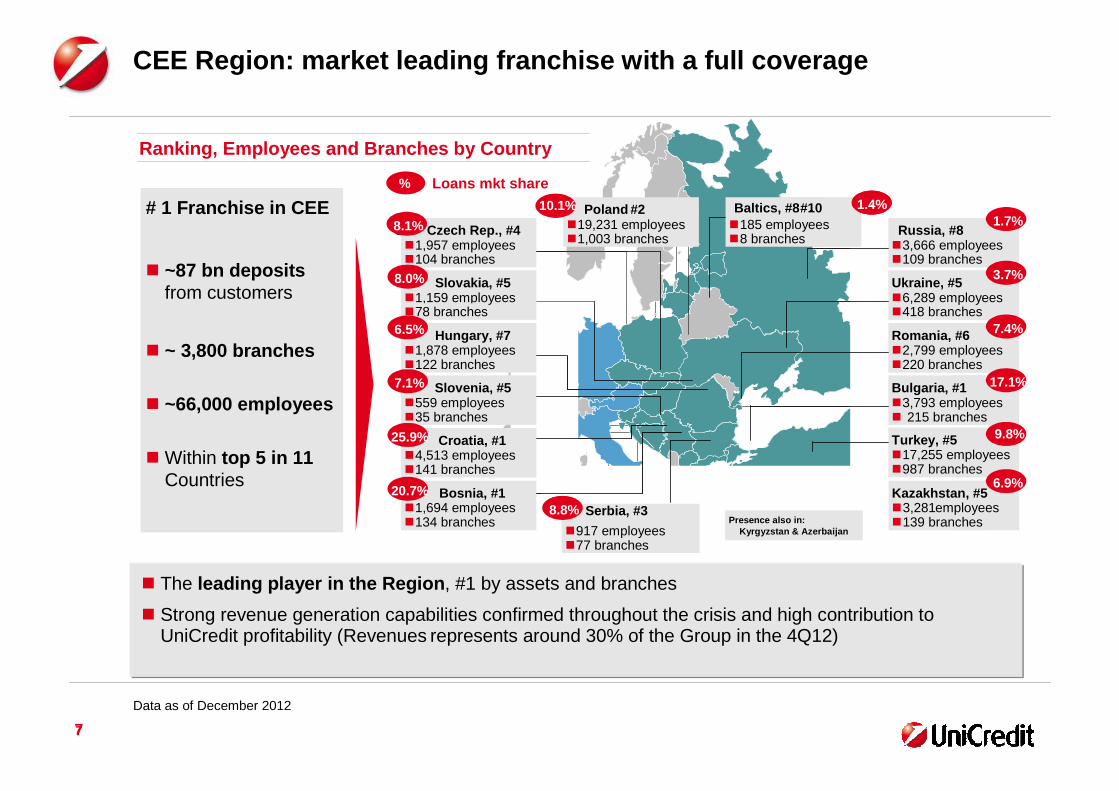
CEE Region: market leading franchise with a full cov erage
� The leading player in the Region , #1 by assets and branches
� Strong revenue generation capabilities confirmed throughout the crisis and high contribution to UniCredit profitability (Revenues represents around 30% of the Group in the 4Q12)
# 1 Franchise in CEE
� ~87 bn depositsfrom customers
� ~ 3,800 branches
� ~66,000 employees
� Within top 5 in 11Countries
% Loans mkt share
Ranking, Employees and Branches by Country
Data as of December 2012

8
Pillars of Strategic Plan 2013 – 2015How to achieve our strategic objectives
8
� Capital
strengthening
� Funding & Liquidity:
rebalancing of L/D
ratio
� Risk: conservative
risk-taking framework
Balance Sheet Structure
� Central Functions
streamlining
� Operations:
enhancing structural
efficiency
� Strict cost control
� Networks redesign
Simplification & Cost Management
� CIB: business
reshaping and run-off
portfolio
� CEE: focused
growth
BusinessRefocusing
� New service model
� Improving asset
quality
� Greater efficiency
Italy Turnaround
999
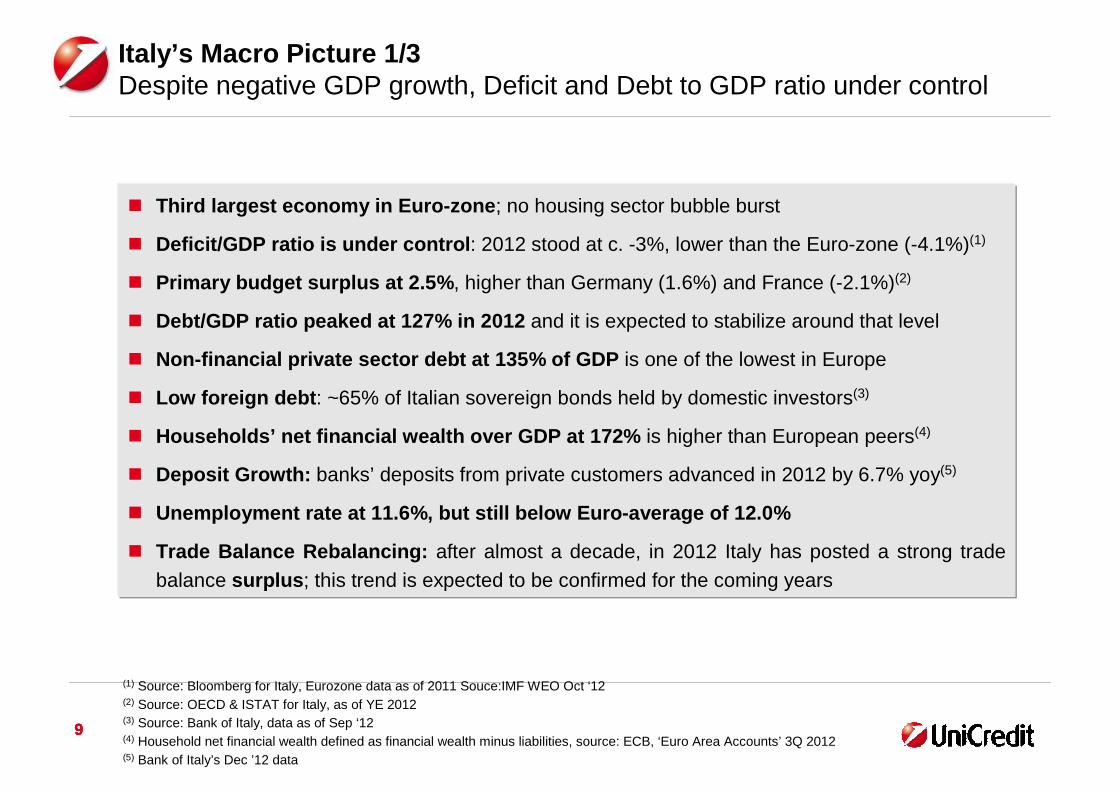
Italy’s Macro Picture 1/3 Despite negative GDP growth, Deficit and Debt to GDP ratio under control
� Third largest economy in Euro-zone ; no housing sector bubble burst
� Deficit/GDP ratio is under control : 2012 stood at c. -3%, lower than the Euro-zone (-4.1%)(1)
� Primary budget surplus at 2.5% , higher than Germany (1.6%) and France (-2.1%)(2)
� Debt/GDP ratio peaked at 127% in 2012 and it is expected to stabilize around that level
� Non-financial private sector debt at 135% of GDP is one of the lowest in Europe
� Low foreign debt : ~65% of Italian sovereign bonds held by domestic investors(3)
� Households’ net financial wealth over GDP at 172% is higher than European peers(4)
� Deposit Growth: banks’ deposits from private customers advanced in 2012 by 6.7% yoy(5)
� Unemployment rate at 11.6%, but still below Euro-averag e of 12.0%
� Trade Balance Rebalancing: after almost a decade, in 2012 Italy has posted a strong tradebalance surplus ; this trend is expected to be confirmed for the coming years
(1) Source: Bloomberg for Italy, Eurozone data as of 2011 Souce:IMF WEO Oct ‘12(2) Source: OECD & ISTAT for Italy, as of YE 2012(3) Source: Bank of Italy, data as of Sep ‘12(4) Household net financial wealth defined as financial wealth minus liabilities, source: ECB, ‘Euro Area Accounts’ 3Q 2012(5) Bank of Italy’s Dec ’12 data

10
Italy ’s Macro Picture 2/3 Total indebtedness is in line with France and Germany……but primary balance even better
309251
212
135164 161
131169
120
Ireland
426
117
74127
Italy
90
263 254
France
372
Spain
289
77
Portugal Euro area 17
259
90
Germany
212
82
Austria
234
Non Financial Private
Public
Deb
t / G
DP
(%
)(1)
(1) Non Financial Private Debt (loans, debt securities and pension fund reserves), source: ECB, ‘Euro Area Accounts’ Q3 2012, GDP: sum of 4 quarters: 4Q2011 – 3Q 2012; Public Debt & GDP data source: Eurostat
(2) General government primary balanced (source: OECD 2012E & ISTAT for Italy)
1.6
-0.9-2.1
2.5
-5.7
-0.7
-4.7
Prim
ary
bala
nce
/ G
DP
(%
)(2)

11
(1) Unemployment rate as of Feb ’13; source: Eurostat(2) Trade Balance, source: ISTAT
Italy’s Macro Picture 3/3 Italian Trade Balance back to positive in 2012; Unemployment still under control compared to other peripheral countries
11.614.2
10.8
5.4 4.8
12.0
ItalyIrelandPortugal France Germany Austria Euro area
17.5
Spain
26.3
Une
mpl
oym
ent R
ate
(%)
(1)
-30.0-25.5
11.0
2001 20022000 2004 20052003 2006 2007 2008 2009 2010 2011 2012
7.81.9
9.2
-13.0
-5.9-8.6
1.6
-20.5
-1.2
-9.4
Italia
n T
rade
Bal
ance
(b
n€)
(2)

12
Agenda
Annex
Introduction & Strategy
Consolidated Results 4Q12

13
Executive SummaryNet Profit at 0.9 bn in FY12 while prudentially increasing coverage ratio in Italy; UniCredit well positioned to economic recovery
� FY12 Net Profit at 865 mln vs. 9,206 mln loss in FY11 . Macro-driven decrease in revenues and conservative coverage enhancement provisioning poli cy affected the Group profitability, otherwise sustained by strong cost control
� 4Q12 showed a net loss of 553 mln also as a result o f one off items. Profitability set to recover in 2013 following the coverage enhancement LLP and int erest rate (in the Euro-zone) bottoming out
�Revenues slightly down mostly due to net interest decline - related to further rates decrease and still weak volumes – in Western Europe, whereas CEE&Poland kept growing
�Strong cost management actions brought costs further down despite some seasonality in other administrative expenses
�Loan loss provisions increase driven by coverage enhancement measures in Italy with bottom line impact offset by goodwill tax redemption
� Sound balance sheet with further improved liquidity position and a stable capital base
�Funding gap further shrinking, both in Western Europe and CEE&Poland
�2012 MLT Funding at 34.7 bn, above target (112%)
�Risk Weighted Assets down q/q driven by lower credit RWAs in Italy
�Basel 2.5 Core Tier 1 ratio at 10.8%; Basel 3 fully-loaded CET1 ratio at 9.2% as at December 2012
�The Board of Directors proposed a 9 cents per share dividend to the AGM

14
777
FY12
865
88
FY11
-9,206
-10,317
1,111
Net Profit (mln) Net Operating Profit (3) (mln)
� 4Q12 Net Loss of 553 mln, including -429 mln related to Integration costs, other non-cash items and buy-back
� Net Operating Profit mostly affected by an increase of LLPs, leading to an improved coverage ratio in Italy of 43.4% (+320 bps q/q); strong efforts in cost control helped to partially offset revenues downturn
Net Profit and Net Operating ProfitProfitability mainly affected by impaired loans coverage enhancement actionsNOP sustained by cost containment in a challenging environment
519
841
4Q12
-2,584
39-2,624
3Q12
578
59
4Q11
-339
FY12
457
796
FY11
3,848
247295
-124
4Q12
-553
-429
3Q12
335
39
4Q11
114
-133
Integration costs, one off non-cashitems and buy-back
Buy back (impacts before taxes)
(1) 4Q12 post tax impact: integration costs (-174 mln), buy-back (+26 mln), goodwill impairment (-22 mln) and Kazakhstan (-260 mln)(2) FY12 post tax impact: integration costs (-174 mln), buy-back (+543 mln), goodwill impairment (-22 mln) and Kazakhstan (-260 mln)(3) Operating Profit after Loan Loss Provisions. Figures restated for ATF, now consolidated under ‘Loss from non-current assets held for
sale, after tax’
(1)
(2)

15
-3.786 -3.724 -3.685
-1.420 -1.776
-4.608
4Q12
5,709
3Q12
6,078
4Q11
6,048
FY12
25,049
-9,613
-14,979
FY11
25,013
-5,733
-15,431
265
4Q12
-2,584
628
-3,212
3Q12
578
672
-94
4Q11
841
576
Net Operating Profit (1) Composition (mln)
Net Operating Profit Breakdown Revenues and LLP trends reflect the negative economic cyclePositive contribution to Net Operating Profit from effective cost management
� The adverse economic environment weakened revenue generation, despite positive trend in fees
� Cost reduction accelerated in 4Q despite seasonality
� The increase in LLP strengthen the coverage ratio in Italy (+320 bps), with bottom line impact offset by goodwill tax redemption
� CEE & Poland supported Group NOP with 2.5 bncontribution in 2012, up in Russia and Turkey
Net Operating Profit (1) by region (mln)
LLP
Costs
Revenues
NOP
FY12
457
2,452
-1,995
FY11
3,848
2,463
1,385
Net of Buy Back(2)
CEE & Poland
Western Europe
-5.8% -3%
-1.1%
-2.9%
+160%
+67.7%
841 3,848-2,584 457
(1) Operating Profit after Loan Loss Provisions. Figures restated for ATF, now consolidated under ‘Loss from non-current assets held for sale, after tax’(2) Proceeds from buy-back related to tender offers on T1-UT2 in 1Q12 and on ABS in 3Q12 and 4Q12
GOP 2,262 9,5822,024 10,0702,354
578
16
316.809 334.015 322.750
+3.6%
-1.8%
CEE &Poland
Western Europe
4Q12
409,514
86,764
3Q12
417,048
83,033
4Q11
395,288
78,479
467.373 464.601 452.663
-1.6%
-2.1%
CEE &Poland
Western Europe
4Q12
547,144
94,482
3Q12
558,709
94,108
4Q11
555,946
88,573
Customer loans (mln)
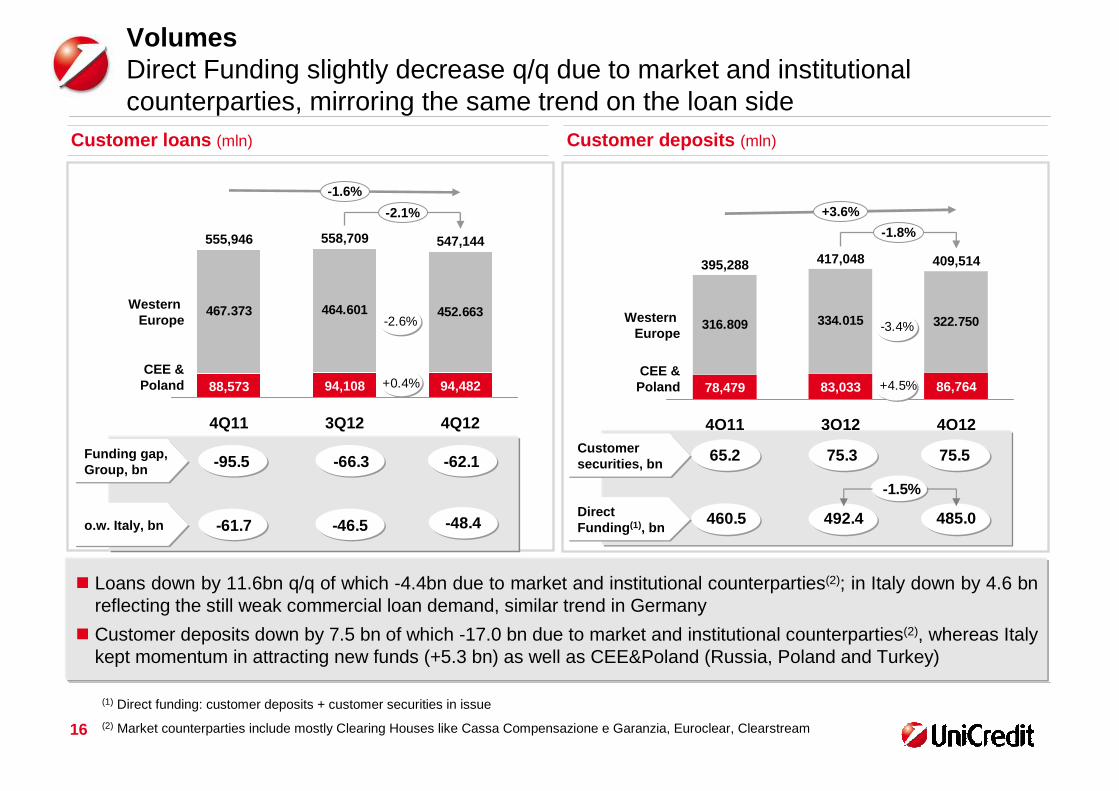
VolumesDirect Funding slightly decrease q/q due to market and institutional counterparties, mirroring the same trend on the loan side
+97.4%
+-200%
� Loans down by 11.6bn q/q of which -4.4bn due to market and institutional counterparties(2); in Italy down by 4.6 bnreflecting the still weak commercial loan demand, similar trend in Germany
� Customer deposits down by 7.5 bn of which -17.0 bn due to market and institutional counterparties(2), whereas Italy kept momentum in attracting new funds (+5.3 bn) as well as CEE&Poland (Russia, Poland and Turkey)
Customer deposits (mln)
(1) Direct funding: customer deposits + customer securities in issue
(2) Market counterparties include mostly Clearing Houses like Cassa Compensazione e Garanzia, Euroclear, Clearstream
-2.6%
+0.4%
-3.4%
+4.5%
Customer securities, bn 65.2 75.3 75.5
Direct Funding (1), bn
460.5 492.4 485.0
-1.5%
Funding gap, Group, bn
o.w. Italy, bn
-62.1
-46.5
-66.3-95.5
-61.7 -48.4

17
Total Operating Costs (mln)
2.167 2.242 2.114
272264296
-2.7%
-1.1%
Depreciation
Other Expenses
Staff expenses
4Q12
3,685
1,299
3Q12
3,724
1,217
4Q11
3,786
1,324
Total Operating Costs by Region (mln)
Operating Costs Group efforts paid off with another quarter of decrease, despite renewed investments in CEE&Poland
Cost income
ratio
� Operating Costs down q/q and y/y with differentiated trend in Western Europe vsCEE&Poland, with the latter affected by inflation
� Staff expenses down mostly thanks to Italy and Germany
� Other Expenses up q/q due to Italy and CEE� Strong focus on discretionary costs in 2012: -135
mln y/y
3.038 2.953 2.905
4Q12
3,685
780
3Q12
3,724
771
4Q11
3,786
748
CEE & Poland
Western Europe
-2.9%
FY12
14,979
1,054
5,009
8,916
FY11
15,431
1,126
5,136
9,169
FY12
14,979
3,062
11,917
FY11
15,431
3,011
12,420
Net of buy-back(1)
+1.7%+1.2%
-1.6% -4%-5.7%
+6.7%
+2.9%
-2.8%
-2.5%
-6.4%
61.8%61.7%62.6% 65.0%61.9%
(1) Proceeds from buy-back related to tender offers on T1-UT2 in 1Q12 and on ABS in 3Q12 and 4Q12

18
124.287 121.970 121.042
-837
-4,006
GBS&CC (2)
(Kazakhstan)
Business Divisions
4Q12
156,354
35,312(3,314)
3Q12
157,190
35,221(3,281)
4Q11
160,360
36,073(3,499)
FTEs(1) (unit) FTEs by Region (unit)
FTEs Staff reduction continued this quarter both in Western Europe, primarily driven by Italy and Germany, and in CEE&Poland
92.586 90.704 90.340
4Q12
156,354
66,014
3Q12
157,190
66,486
4Q11
160,360
67,774
CEE & Poland
Western Europe
� Western Europe highlights a decline y/y of 2,246 FTEs (-2.4%) o/w: Italy -1,514 (-2.4%) driven by Restructuring initiatives, Germany -196 (-1.0%), Austria -351 (-5.2%)
� CEE & Poland declined y/y by 1,760 (-2.6%) driven by Poland -588 (-3.0%) and CEE -1,172 (-2.4%)
� Out of GBS&CC(2),15,814 FTE are fully dedicated to serve the networks; providing IT, back office and real estate services, with full allocation to the Business divisions of the relevant costs
-928
+91
-0.4%
-0.7%
(1) FTEs related to Kazakhstan have been re-classified in the Corporate Centre. P&L and Balance Sheet figures restated for ATF, now consolidated under ‘Loss from non-current assets held for sale, after tax’
(2) Global Banking Services (i.e. the operating machine) and Corporate Centre

19
Cost management actionsNPV of 1.8 bn of savings from cost management efforts thanks to several projects
Actions NPV
Possible source for higher investments on IT and Regulatory requirements
Integration costs in 4Q12 (1)
(1) Difference of 20 mln with P&L figure related to integration costs on Non-HR items(2) Related to additional contribution into solidarity fund following pension reforms
Italy350 branches closing
HR actions offset impact of pension reform
Germany Corporate Center optimization and Network redesign
Austria Corporate Center optimization and Network redesign
NewtonPartnerships with companies leaders in specialized fields (e.g. IT hardware management)
~1.8 bn
~860 mln
~270 mln
~70 mln
~600 mln
119 mln(2)
90 mln
24 mln

20
Loan Loss Provisions (mln) – Group COR (bps) Cost of Risk (bps)
138108
83119119132
163
270
CEEF&SMECIB
466
4Q123Q124Q11
� CoR reflecting the effort to strengthen the coverage ratio in Italy
� Net of LLPs related to coverage enhancement (2.1 bn), the Cost of Risk in Italy would have been at 240 bps in 2012, still increasing vs previous year due to the deteriorated macro scenario in the country
� In Germany the increase in CoR is driven by a re-classification from Risks & Charges of provisions related to a single large ticket, whereas the underlying asset quality and CoR remained stable in the quarter
Cost of RiskSignificant efforts to enhance coverage in Italy
Group Cost of Risk (bp)
4Q12
4,608
332
4,277
3Q12
1,776
250
1,525
4Q11
1,420
256
1,165
CEE & Poland
Western Europe
118
1255
139107
4848
141
29
151
CEE &Poland
AustriaGermanyItaly
545
188
FY12
9,613
1,055
8,558
FY11
5,733
899
4,834
102 128 333 103 174

21
Gross Impaired Loans (bn)
+2.6%
Dec. 12
79.8
Sept. 12
77.8
Dec. 11
69.8
NPLs (bn)
Other Impaired Loans (bn)
Group Asset QualityConservative approach boosted coverage ratio leading to an overall stable net impaired loans ratio in the quarter despite shrinking volumes
Net impaired loans ratio
Coverage ratio
+2.0%
Dec. 12
44.4
Sept. 12
43.5
Dec. 11
40.4
Coverage ratio
+3.4%
Dec. 12
35.4
Sept. 12
34.3
Dec. 11
29.4
Coverage ratio
44.8%
8.1%
42.7%
8.0%
44.4%
7.0%
56.4%55.6%57.2%
30.3%26.5%26.9%
The contribution of Kazakhstan is no more consolidated line by line but grouped into the line “Non-current assets and disposal groups classified as held for sale”. Consequently the Customer Loans of Kazakhstan do not contribute any more to the Group data

22
Gross Impaired Loans (bn)
+3.2%
Dec. 12
56.7
Sept. 12
54.9
Dec. 11
48.1
NPLs (bn)
Other Impaired Loans (bn)
Asset Quality in ItalySizeable provisions helped to enhance coverage across all categories and reduce net stocks, against a difficult economic back drop
Net impaired loans ratio
Coverage ratio
+2.7%
Dec. 12
31.0
Sept. 12
30.1
Dec. 11
27.2
Coverage ratio
+3.8%
Dec. 12
25.7
Sept. 12
24.8
Dec. 11
20.9
Coverage ratio
43.4%
11.7%
40.2%
11.8%
42.1%
10.2%
56.0%53.7%56.2%
28.3%23.7%23.9%
(1) Based on published 4Q12 data and 3Q12 data where not available
� Following the coverage enhancement, UniCredit achieved the highest coverage ratio in Italy(1)

23
Group Impaired Loans, bn
Asset Quality in ItalyCollateral and guarantee values exceed the net value of Gross Impaired Loans, leading to a 140% coverage ratio
Over-collateralization
12.1
Collateral and Guarantee Values (1)
42.6
Net Value
30.5
GenericReserve
1.5
SpecificProvisions
24.6
GrossImpaired
Loans
56.7
Coverage Ratio
43.4% 139.6%
(1) Collateral and Guarantee Values may refer also to other cash exposures towards customers not classified as “Loans and receivables with customers”

24
Total Assets (bn)
926,8949,8938,6913,6
+1.5%
-2.4%
Dec. 12Sept. 12Jun. 12Dec. 11
-4.9x
-0.5x
Dec. 12
17.9x
Sept. 12
18.5x
Jun. 12
18.9x
Dec. 11
22.9x
Tang. Shareholders’ Equity (1) (bn) Leverage Ratio (2)
Balance Sheet structureTotal assets down due to lower loans to banks and to customersLeverage ratio keeps reducing thanks to the growth in Tangible Equity
� Total Assets decrease mainly related to lower loans to banks and loans to customers
� Tangible Equity kept growing thanks to improvement in negative valuation reserves offsetting the 4Q12 loss
� Leverage ratio keeps reducing and being one of the lowest in Europe
(1) Defined as Shareholders’ equity - Goodwill - Other intangible assets
(2) Defined as Tangible Assets/ Tangible Equity as per IFRS (not reflecting netting agreements on derivatives)
TE per share (eur)
47,146,945,4
35,9
Dec. 12Sept. 12Jun. 12Dec. 11
8.1

25
Securities in issue (bn)
Balance Sheet structureSecurities in issue up due to the significant funding activity in the last quarter of 2012
� Securities in issue up, with customers representing about 44% of the total securities placed by the Group
� Net interbank position broadly stable
� ECB gross funding represents 26.1 bn as of today
� Financial Investments up, mostly driven by AFS and Fair Value portfolios, while trading derivatives went down due to mark-to-market effect (in line with trading liabilities)
Financial investments (1) (bn)Net Interbank Position (bn)
65 72 75
95
+2%
+5.8 bn
Customers
Wholesale
Dec. 12
170
76
Sept. 12
165
89
Jun. 12
162
90
Dec. 11
162
97
108,7102,299,599,2
+6.5 bn
Dec. 12Sept. 12Jun. 12Dec. 11
(1) Financial Investments include AFS, HtM, Fair Value portfolios
-43,0-40,5
-75,4
Dec. 12Sept. 12Dec. 11

26
5%
Germany
19%
Italy
57%
Poland
Austria
19%
Funding Mix % of m/l term run-offs by Region (1)
8%7%
30%
2013 (planned)
29 bn
2012 (realized)
34.7 bn
34%
11%
9%
(1) Run-offs refer only to UCG securities placed on external market. InterCompany are not included (2) The Network Bonds have been reclassified according to a definition based upon their origination (i.e. bonds originated through the
Network only)
Group Retail Network
Public Sec. & Mort. CBs
Supranational Funding
Priv. Place. & Schuld.
Bank Cap. Bonds
Public Market and Wholesale MLT
Medium-Long Term Funding Plan2012 Funding Plan above target: high quality and diversified issuances
Austria
Germany
Italy
2015
25.8
19%
27%
54%
2014
26.3
14%
35%
51%
2013
28.5
19%
33%
48%
% M/L termNetwork run-offs (2) 22% 30% 37%
� MLT funding in 2012 closed at 34.7 bn, above year-end target (112%)
� Funding plan for 2013 is approximately 29 bn
� As of March 29th, 18% of 2013 funding plan realized (15% in Italy)
� Out of the 5.4 bn already issued, ca 1.4 bn are retail bonds (Network bonds still represent only about 6.9% of customer’s TFA, providing room for further securities placement)

27
Liquidity buffer (12 months) as of December 2012 ( bn) (1)
Liquidity Sound position: 1Y Liquidity buffer exceeds wholesale funding maturing within one year
Unencumbered assets(immediately available)
Cash and Deposits with Central Banks
Additional eligible assetsavailable within 12 months
Liquidity buffer (12M)
106.4
42.3
21.3
� Liquid assets immediately available amount to 148.8 bn net of haircut and well above 100% of wholesale funding maturing in 1 year
(1) Unencumbered assets are represented by all the assets immediately available to be used with Central Banks; Additional eligible assets (available within 12 months) consist of all the other assets eligible within 1 year time (by the end of June 2013)
148.8
170.1
28
31.519.1 17.4
51.5
52.451.2
-2.2%
Floor
Credit
Market
Operat.
Dec 12
427.1
358.6
Sep 12
436.8
365.3
Dec 11
460.4
0.7
376.8
RWA, eop (bln)
(1)
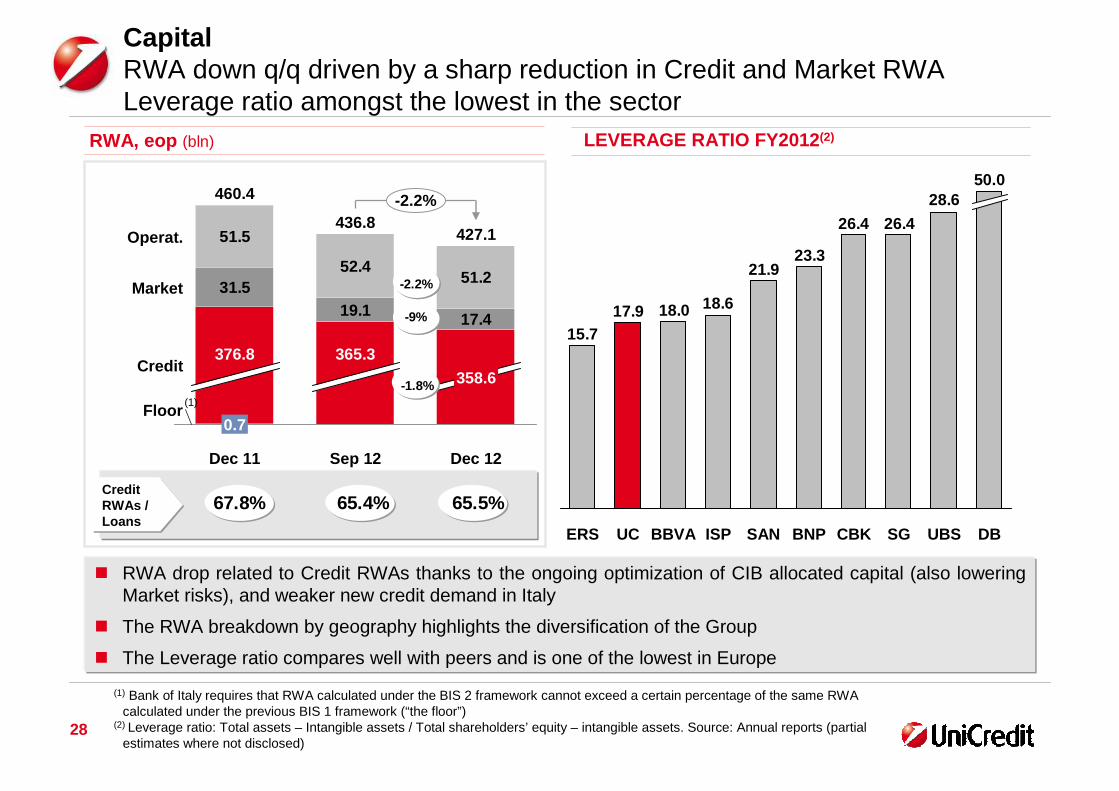
Capital RWA down q/q driven by a sharp reduction in Credit and Market RWALeverage ratio amongst the lowest in the sector
Credit RWAs / Loans
� RWA drop related to Credit RWAs thanks to the ongoing optimization of CIB allocated capital (also lowering Market risks), and weaker new credit demand in Italy
� The RWA breakdown by geography highlights the diversification of the Group
� The Leverage ratio compares well with peers and is one of the lowest in Europe
(1) Bank of Italy requires that RWA calculated under the BIS 2 framework cannot exceed a certain percentage of the same RWA calculated under the previous BIS 1 framework (“the floor”)
(2) Leverage ratio: Total assets – Intangible assets / Total shareholders’ equity – intangible assets. Source: Annual reports (partial estimates where not disclosed)
67.8% 65.4% 65.5%
-2.2%
-9%
-1.8%
28.6
26.426.4
23.321.9
18.618.017.915.7
SG DB
50.0
UBSCBKBNPSANISPBBVAUCERS
LEVERAGE RATIO FY2012 (2)

29
Capital – CIB RWA developmentMassive de-leveraging continued also in 2012
Ring-fenced Portfolio
-12.6
De-leveraging
-20.6
Basel 2.5
+17.0
Dec. 2010
198.6
Volume dynamics
-6.6
Market risk
-0.1
Other
162.6
Dec. 2012
-36.0 bn-53 bn before Basel 2.5 impact
-13.1
2011: -3.6 bn 2012: -32.4 bn
� CIB was able to more than offset the increase driven by the introduction of Basel 2.5 rules in 2011 thanks to the de-leveraging which massively continued also in 2012 (-32.4 bn y/y)
43.7% % on Total Group 37.9%
30
Core Tier I
Tier I
Total Capital
Dec 12
10. 84%
11.44%
14.52%
Sep 12
10.67%
11.26%
13.83%
Dec 11
8.40%
9.32%
12.37%
Capital Ratios Basel 2.5
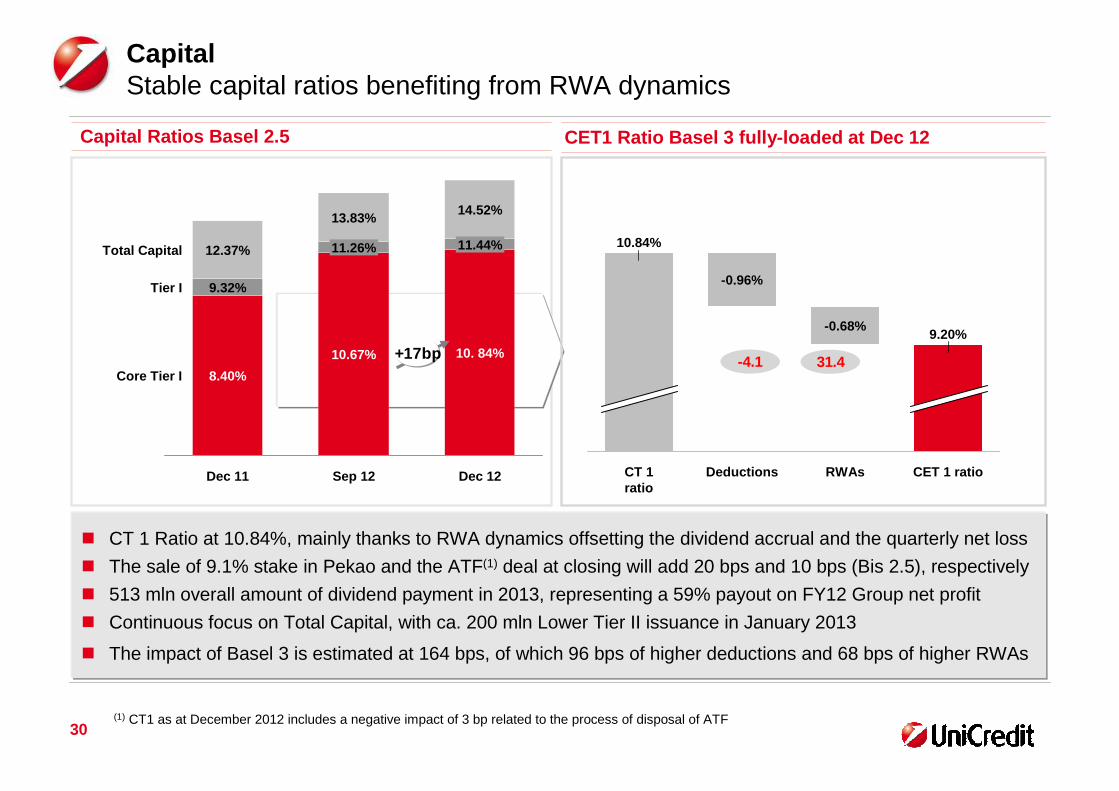
Capital Stable capital ratios benefiting from RWA dynamics
� CT 1 Ratio at 10.84%, mainly thanks to RWA dynamics offsetting the dividend accrual and the quarterly net loss
� The sale of 9.1% stake in Pekao and the ATF(1) deal at closing will add 20 bps and 10 bps (Bis 2.5), respectively
� 513 mln overall amount of dividend payment in 2013, representing a 59% payout on FY12 Group net profit
� Continuous focus on Total Capital, with ca. 200 mln Lower Tier II issuance in January 2013
� The impact of Basel 3 is estimated at 164 bps, of which 96 bps of higher deductions and 68 bps of higher RWAs
+17bp
(1) CT1 as at December 2012 includes a negative impact of 3 bp related to the process of disposal of ATF
CET1 Ratio Basel 3 fully-loaded at Dec 12
CET 1 ratio
9.20%
RWAs
-0.68%
Deductions
-0.96%
CT 1ratio
10.84%
31.4-4.1
31
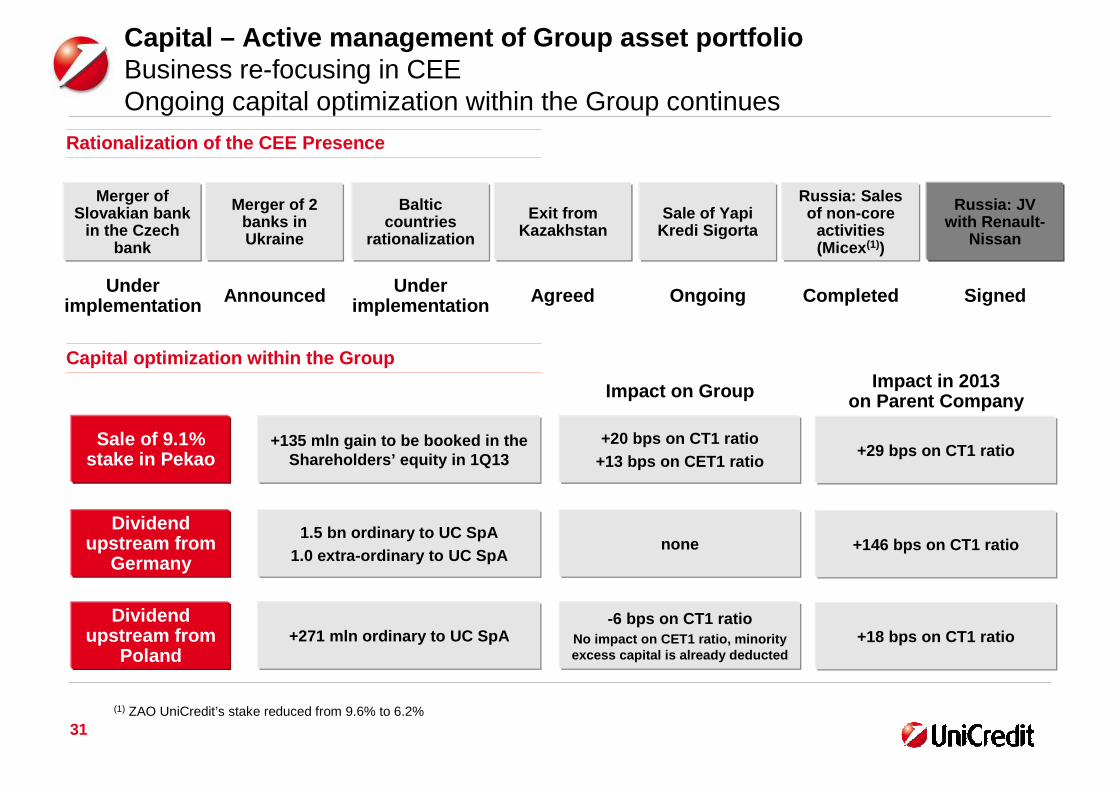
Capital – Active management of Group asset portfolio Business re-focusing in CEE Ongoing capital optimization within the Group continues
Capital optimization within the Group
Rationalization of the CEE Presence
Sale of 9.1% stake in Pekao
+135 mln gain to be booked in the Shareholders’ equity in 1Q13
Dividend upstream from
Germany
Dividend upstream from
Poland
Merger of Slovakian bank
in the Czech bank
Merger of 2 banks in Ukraine
Russia: Sales of non-core
activities (Micex (1))
Exit from Kazakhstan
Baltic countries
rationalization
Sale of YapiKredi Sigorta
CompletedUnderimplementation
Underimplementation AgreedAnnounced SignedOngoing
+20 bps on CT1 ratio+13 bps on CET1 ratio
1.5 bn ordinary to UC SpA1.0 extra-ordinary to UC SpA
none
+271 mln ordinary to UC SpA-6 bps on CT1 ratio
No impact on CET1 ratio, minority excess capital is already deducted
+29 bps on CT1 ratio
+146 bps on CT1 ratio
+18 bps on CT1 ratio
Impact on Group Impact in 2013on Parent Company
Russia: JV with Renault-
Nissan
(1) ZAO UniCredit’s stake reduced from 9.6% to 6.2%

32
Loan lossprovisions
OutlookGiven the current economic environment, the Strategic Plan financial targets will be revised. The underlying set of actions are confirmed
2012
14,285 mln-6.3% y/y
Comments
Interest rates bottoming outNew MLT funding marginal
costs improving but still higher than maturing issues
Still weak loan demand
2013 outlook
Management actions (e.g. asset repricing and product re-mix)
defined to offset the downward trend y/y, due to low average
Euribor level and still high cost of funding
Costs14,979 mln-2.9% y/y
Full implementation of cost actions
Ongoing investments in business and regulatory
compliance
Renewed management effort to at least confirm 2012 cost base, despite planned investments on
regulatory compliance and to sustain the business
Net interestincome
9,613 mln+68% y/y
Prudent coverage enhancement in 4Q12
Still high inflows to impaired but dedicated actions under
way
LLP to slightly decrease in 2013 vs 2012 benefiting from the
prudent coverage enhancement in 4Q12
Capital(fully-loadedCET1 ratio)
9.2%Finalization of CRDIV rules
ongoing, with potential impact on CET1 ratio
9% CET1 minimum level confirmed
33
Agenda
Annex
Introduction & Strategy
Consolidated Results 4Q12

34
Group Profit & Loss and main KPIsGood profitability but still significant upside
34
4Q11 3Q12 4Q12q/q%
y/y%
FY11 FY12y/y%
Total Revenues 6,048 6,078 5,709 -6.1% -5.6% 25,013 25,049 0.1%
Operating Costs -3,786 -3,724 -3,685 -1.1% -2.7% -15,431 -14,979 -2.9%
Gross Operating Profit 2,262 2,354 2,024 -14.0% -10.5% 9,582 10,070 5.1%
Net Write-downs on Loans -1,420 -1,776 -4,608 n.m. n.m. -5,733 -9,613 67.7%
Net Operating Profit 841 578 -2,584 n.m. n.m. 3,848 457 -88.1%
Other Non Operating items (1) -261 182 -337 n.m. n.m. -1,653 -141 n.m.
Income tax -249 -189 2,721 n.m. n.m. -1,414 1,539 n.m.
Profit (Loss) from non-current assets held for sale, after tax
-39 -5 -154 n.m. n.m. -610 -168 -72.4%
Minorities -78 -119 -72 -39.8% -7.9% -365 -358 -2.0%
PPA and goodwill impairment -100 -112 -127 12.6% 26.4% -9,012 -465 n.m.
Group Net Income 114 335 -553 n.m. n.m. -9,206 865 n.m.
Cost Income 62.6% 61.3% 64.5% 3.3 p.p. 1.9 p.p. 61.7% 59.8% -1.9 p.p.
Cost of Risk (bp) 102 128 333 206 bp 231 bp 103 174 +71 bp

3535
UniCredit Ratings OverviewUniCredit’s excellent diversification is a key rating strength, but the tough operating environment and Eurozone sovereign crisisare key concerns – UC SpA is currently constrained by Italy’s ratings, but German and Austrian subsidiaries are rated higher
Ratings
LT/ST
Outlook
Stand-alone
Lower Tier II
Upper Tier II
Tier I
Italy
Baa2/P-2
Neg
Baa2
Baa3
Ba1
Ba2
Baa2
� Key drivers: operating environment and Eurozone crisis , weakprofitability and asset quality, restricted market funding access
� Moody's views our "...well diversified activities both by business line and geography ” as a key rating strength
� UC SpA downgraded twice as part of a broader European review (14th May ) and following Italy’s downgrade to ‘Baa2’ (from ‘A3’) on the 13th July
� Key drivers: Eurozone financial debt crisis, asset quality and executionrisk of strategic plan
� Fitch highlights that “the bank’s considerable geographical risk and revenue diversification ”
� Fitch stated that UC SpA could potentially be rated one notch higherthan Italy
Comments
LT/ST
Outlook
Stand-alone
Lower Tier II
Upper Tier II
Tier I
Italy
BBB+/F2
Neg
bbb+
BBB
BB+
BB
BBB+
� Key drivers: sovereign risk and economic & banking industryconditions plus asset quality and profitability
� S&P states: “Diversification is significantly helping to limit deterioration in profitability and asset quality at group level”
� The UC SpA rating is capped at Italy’s BBB+/A2 due to S&P’s methodology
� As a particular case among European banks, SP’s rates the “core “subsidiaries UC Bank AG and UC Bank Austria at the higher A/A1
LT/ST
Outlook
Stand-alone
Lower Tier II
Upper Tier II
Tier I
Italy
BBB+/A-2
Neg
bbb+
BBB
BBB-
BB+
BBB+


