19
4Q'17 Earnings Release LG Electronics January 25, 2018

4Q'17 Earnings Release
LG Electronics
January 25, 2018

All information regarding management performance and financial results of LG Electronics (the “Company”) during the 4th quarter of 2017
as contained herein has been prepared on a consolidated basis in accordance with International Financial Reporting Standards (“IFRS”).
The information regarding results of 4th quarter of 2017 has been prepared in advance, prior to being audited by outside auditors,
solely for the convenience of investors of the Company, and is subject to change in the process of final audit by external auditors.
The information contained herein includes forward-looking statements in respect to future plans, prospects, and performances of the Company
as well as the Company’s projected sales plan for the year of 2018.
These forward-looking statements also refer to the Company’s performance on consolidated base, as indicated.
The aforementioned forward-looking statements are influenced by changes in the management environment and relative events, and by their nature,
these statements refer to uncertain circumstances. Consequently, due to these uncertainties, the Company’s actual future results may differ
materially from those expressed or implied by such statements.
Please note that as the forward-looking statements contained herein are based on the current market situation and the Company’s management
direction, they are subject to change according to the changes in future market environment and business strategy.
The information contained herein should not be utilized for any legal purposes in regards to investors’ investment results. The Company hereby
expressly disclaims any and all liability for any loss or damage resulting from the investors’ reliance on the information contained herein.

Table of Contents
Consolidated Earnings and Outlook Ⅰ
Performance and Outlook by Division Ⅱ

Ⅰ Consolidated Earnings and Outlook

3.4%2.2%
-0.2%
1
*1) Including LG Innotek
*2) From 2Q'17, Companion Device(Innovative Personal Device) has been restated to ‘MC division’ from ‘Others’.
From 3Q'17, Smart Lighting has been restated to ‘H&A division’ from ‘Others’.
Consolidated Earnings and Outlook Sales / Profits
Sales / Profits
(Unit : KRW tn)
Performance by Division
(Unit : KRW bn)
Operating
Income
(%)
3Q’17 QoQ 4Q’17 YoY 4Q’16
Sales 15,224.1 11.4% 16,963.6 14.8% 14,777.7
Consolidated*1) O.I 516.1 -149.3 366.8 402.0 -35.2
(%) 3.4% -1.2%p 2.2% 2.4%p -0.2%
H&A*2)
Home Appliance
& Air Solution
Sales 4,984.4 -13.1% 4,329.4 6.8% 4,054.7
O.I 424.9 -344.2 80.7 -66.1 146.8
(%) 8.5% -6.6%p 1.9% -1.7%p 3.6%
HE
Home Entertainment
Sales 4,637.6 18.1% 5,475.1 14.2% 4,793.4
O.I 458.0 -74.5 383.5 219.5 164.0
(%) 9.9% -2.9%p 7.0% 3.6%p 3.4%
MC*2)
Mobile Communications
Sales 2,807.7 9.2% 3,065.5 2.8% 2,980.7
O.I -375.3 162.1 -213.2 246.1 -459.3
(%) -13.4% 6.4%p -7.0% 8.4%p -15.4%
VC
Vehicle Components
Sales 873.4 -1.9% 856.7 -1.0% 865.6
O.I -29.0 -12.1 -41.1 -26.7 -14.4
(%) -3.3% -1.5%p -4.8% -3.1%p -1.7%
15.22
16.96
14.78
17.3Q 17.4Q 16.4Q
QoQ
11.4%↑
YoY
14.8%↑
3Q’17 4Q’17 4Q’16
Sales

EBITDA 834.5 391.7 957.1
2
3Q'17 QoQ 4Q'17 YoY 4Q'16
Operating
Income 516.1 -149.3 366.8 +402.0 -35.2
Net financial
income/expense -62.1 -60.9 -123.0 -38.7 -84.3
Gain/loss on
equity method 165.6 -151.9 13.7 -283.6 297.3
Other non-operating
income/expense -103.9 +54.7 -49.2 +211.7 -260.9
Income
Before Tax 515.7 -307.4 208.3 +291.4 -83.1
Corporate
income tax 179.6 -154.1 25.5 -150.2 175.7
Net
Income 336.1 -153.3 182.8 +441.6 -258.8
Income Analysis Consolidated Earnings and Outlook
(Unit : KRW bn) (Unit : KRW bn)
Income Trend Operating Income vs. Net Income Difference Analysis
Operating
Income Net Income
182.8
366.8
49.2
25.5
13.7
123.0
Equity method gain/loss
Net financial income/expense
Other non-operating income/expense
Corporate income tax
3
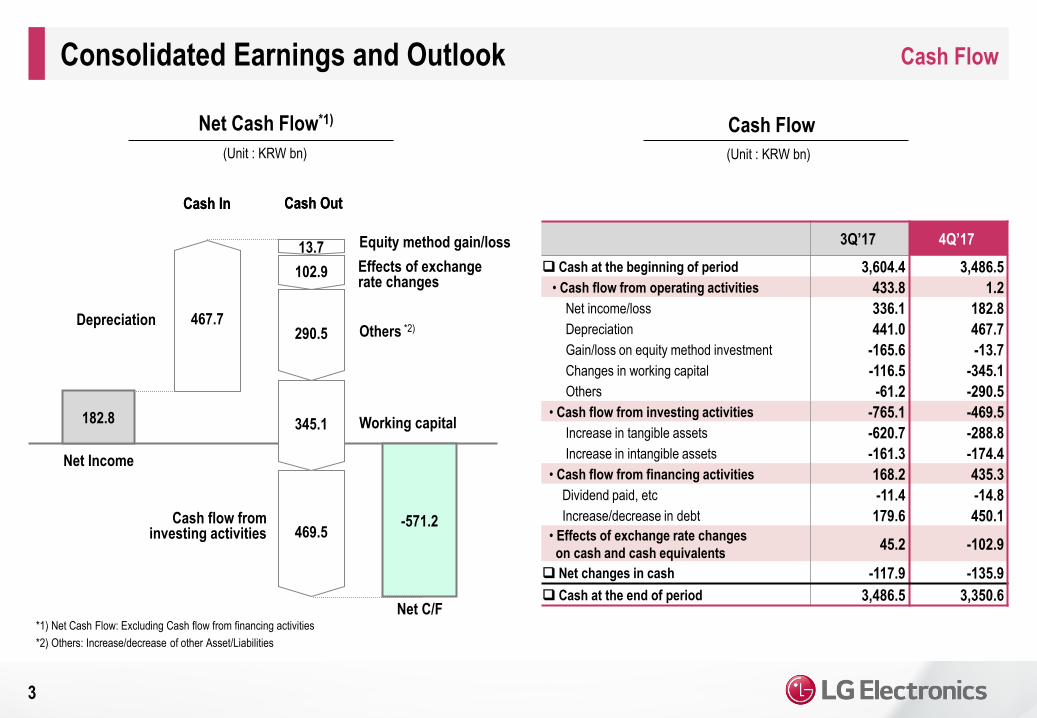
Cash Flow Consolidated Earnings and Outlook
Cash Flow
(Unit : KRW bn)
Net Cash Flow*1)
(Unit : KRW bn)
*1) Net Cash Flow: Excluding Cash flow from financing activities
*2) Others: Increase/decrease of other Asset/Liabilities
Cash Out Cash In
Net Income
3Q’17 4Q’17
Cash at the beginning of period 3,604.4 3,486.5
• Cash flow from operating activities 433.8 1.2
Net income/loss 336.1 182.8
Depreciation 441.0 467.7
Gain/loss on equity method investment -165.6 -13.7
Changes in working capital -116.5 -345.1
Others -61.2 -290.5
• Cash flow from investing activities -765.1 -469.5
Increase in tangible assets -620.7 -288.8
Increase in intangible assets -161.3 -174.4
• Cash flow from financing activities 168.2 435.3
Dividend paid, etc -11.4 -14.8
Increase/decrease in debt 179.6 450.1
• Effects of exchange rate changes
on cash and cash equivalents 45.2 -102.9
Net changes in cash -117.9 -135.9
Cash at the end of period 3,486.5 3,350.6 Net C/F
Cash Out Cash In
-571.2
182.8
467.7
469.5
345.1
290.5
102.9
13.7
Depreciation Others *2)
Cash flow from investing activities
Equity method gain/loss
Effects of exchange rate changes
Working capital
4
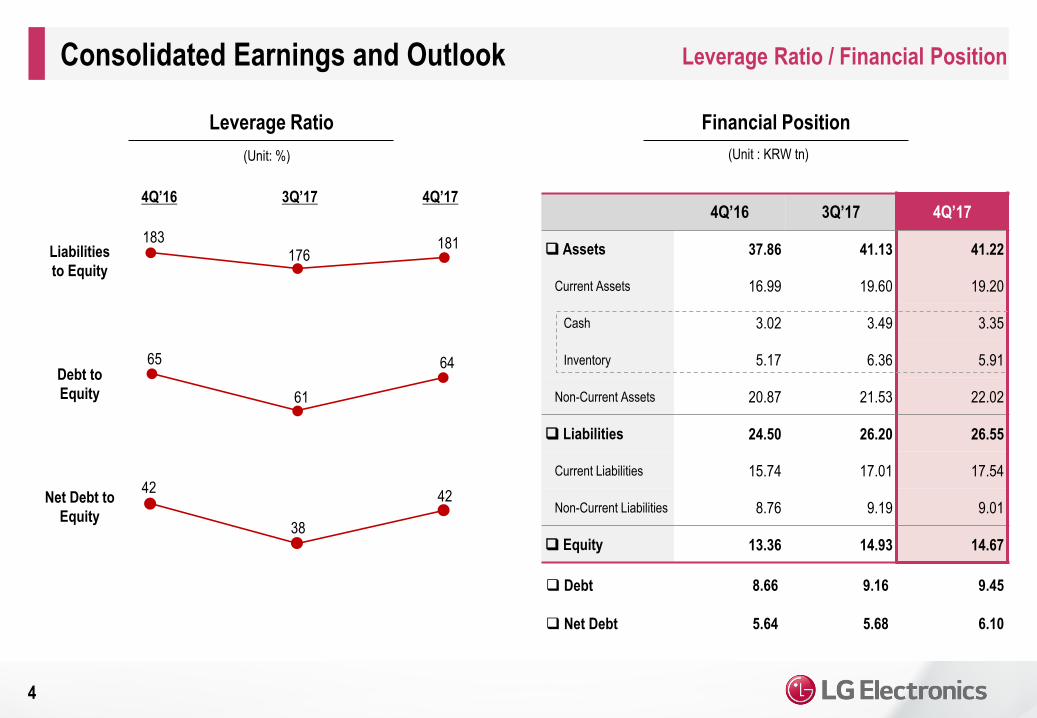
Leverage Ratio / Financial Position Consolidated Earnings and Outlook
Financial Position Leverage Ratio
(Unit: %) (Unit : KRW tn)
4Q’17 4Q’16 3Q’17
Liabilities
to Equity
Debt to
Equity
Net Debt to
Equity
4Q’16 3Q’17 4Q’17
Assets 37.86 41.13 41.22
Current Assets 16.99 19.60 19.20
Cash 3.02 3.49 3.35
Inventory 5.17 6.36 5.91
Non-Current Assets 20.87 21.53 22.02
Liabilities 24.50 26.20 26.55
Current Liabilities 15.74 17.01 17.54
Non-Current Liabilities 8.76 9.19 9.01
Equity 13.36 14.93 14.67
Debt
Net Debt
8.66
5.64
9.16
5.68
9.45
6.10
183 176
181
65
61
64
42
38
42

5
Year 2018 and 1Q’18 Outlook Consolidated Earnings and Outlook
Business
Environment
(Y2018)
Sales & Profits
Outlook
(Y2018, 1Q’18)
Key
Strategies
Maintain Sales growth trend in Y2018 based on Profitability
Expect 1Q’18 Sales to go up YoY and Operating Income to improve significantly QoQ
Establish a strong virtuous cycle of Profit – Growth – Market Dominance
- Continue Profitable Growth
- Foster B2B business to core business level
- Strengthen product competitiveness as the basis of market dominance in the premium market
Increasing U.S. trade protectionism
Competition and cooperation among companies influenced by new business model expansion
based on Artificial Intelligence and Big Data

Ⅱ Performance and Outlook by Division

6
H&A (Home Appliance and Air Solution)
4Q’17 Performance
Y2018 Outlook
- Domestic :
Sales :
Profitability :
- Overseas :
LGE :
Market :
TWINWash InstaView DID Whisen ThinQ A/C
*1) From 3Q'17, Smart Lighting has been restated to H&A division from Others
Performance and Outlook by Division
Performance*1) (Unit: %, KRW tn)
Key Products
Op. Margin
Sales
Achieved 4.3 tn Won, up 7% YoY driven by strong sales in domestic and growth market
Temporary drop in profitability due to
- increased marketing expenses for LG SIGNATURE, SIGNATURE KITCHEN
SUITE, newly added premium home appliances and AI ThinQ brand
- infrastructure investment in U.S. and proactive investment for
AI appliances and robots to secure future growth engine
Up 27% YoY thanks to continuous sales growth in new growth products
such as TWINWash, Styler and dryer etc.
Up 5% YoY (based on USD) thanks to sales expansion in Latin America, Asia and Europe
Despite uncertain business environments such as F/X fluctuation,
raw material price increase, etc., global economy appears to be recovering
mainly from developed markets in North America and Europe.
Expect market demand for premium, convergence and energy-efficient products
continue to grow.
- Maintain stable profitability by increasing sales of premium products such as
TWINWash washing machine, InstaView Refrigerator, etc., and improving
cost structure
- Prepare future growth engine (AI, robots, etc.) in advance
3.6%
11.2% 8.8% 8.5%
1.9%
4.05 4.65
5.26 4.98 4.33
16.4Q 17.1Q 17.2Q 17.3Q 17.4Q4Q’16 1Q’17 2Q’17 3Q’17 4Q’17

4.79 4.33 4.23
4.64 5.48
16.4Q 17.1Q 17.2Q 17.3Q 17.4Q
7
HE (Home Entertainment)
LG Super Ultra UHD TV (Nano Cell TV) LG SIGNATURE OLED TV W
4Q’17 Performance
Profitability :
LGE :
Market :
Sales :
Y2018 Outlook
Performance and Outlook by Division
Performance (Unit: %, KRW tn)
Key Products
Op. Margin
Sales Improved YoY by increasing premium TV sales and continuing cost
reducing activities, but slightly declined QoQ due to year-end peak seasonal
marketing costs
- Expect sales to go up YoY by marketing activities mainly on premium TV
- Focus on maintaining solid profitability by constantly increasing premium
sales and reducing costs
External risks such as F/X fluctuation still exist in the market, but annual TV
demand is expected to grow YoY from sports events; Premium TV (OLED and
UHD TV) market is expected to grow continuously
Maintained sales growth trend from increasing sales more than 10% YoY
by actively responding to year-end peak season demand and increasing premium
TV sales
- TV shipments: Up high-single digit YoY mainly from North America, Europe and Latin America
3.4%
8.8% 8.1% 9.9%
7.0%
4Q’16 1Q’17 2Q’17 3Q’17 4Q’17

8
MC (Mobile Communications)
*1) From 2Q'17, Companion Device(Innovative Personal Device) has been restated
to MC division from Others
Up 9% QoQ and up 3% YoY by increasing sales of V30 and Google’s new premium
OLED phone
- Achieved smartphone shipment of 13.9mn units (+2% QoQ, -1% YoY)
LGE :
Market :
Performance and Outlook by Division
Performance*1) (Unit: %, KRW tn)
Key Products
Op. Margin
Sales
Profitability :
Sales :
4Q’17 Performance
Y2018 Outlook
Loss narrowed QoQ and YoY by increasing premium product sales and
improving business structure, despite marketing expense for V30 and
component price increase
- Increase sales by strengthening premium, mid to high-end smartphone line up
and enhance profitability by improving product mix
- Strengthen business strategy by continuously adding new value
to the competitive platforms
- Reinforce cost competitiveness through platform and modular activities and
strengthen brand and quality of the products
Expect premium smartphone ASP to rise and mass-tier smartphone demand in
emerging market to increase; Chinese competitors’ new products release will
intensify competition
2.98 3.09 2.70 2.81
3.07
16.4Q 17.1Q 17.2Q 17.3Q 17.4Q
-15.4%
0.1%
-4.9%
-13.4%
-7.0%
4Q’16 1Q’17 2Q’17 3Q’17 4Q’17
X4+ V30 Q6

9
VC (Vehicle Components)
• AV/AVN
• Telematics
• CID
Infotainment EV Solution Security & Safety
Performance and Outlook by Division
Performance (Unit: %, KRW tn)
Key Products
Op. Margin
Sales
LGE :
Market :
Profitability :
Sales :
Slight QoQ and YoY decline due to temporary sales decrease in infotainment
business and investments in new businesses related to electric vehicle
components, etc.
• Traction motor
• Inverter
• Battery Pack
• ADAS Camera
• LCD Cluster
• Automotive lamp
4Q’17 Performance
Y2018 Outlook
Expect sales growth by launching new product in 2H Y2018 and
increasing shipments of existing products
- Expect market expansion of infotainment business mainly driven by connectivity
and increasing adoption of electric parts in vehicle component market
- EV component business market is expected to accelerate from global OEMs’
intensified EV launching competition
0.87 0.88 0.88 0.87 0.86
16.4Q 17.1Q 17.2Q 17.3Q 17.4Q
-1.7% -1.7% -1.9% -3.3%
-4.8%
4Q’16 1Q’17 2Q’17 3Q’17 4Q’17
Recorded similar level of sales QoQ and YoY
- EV component business improved YoY while infotainment business
slightly declined due to slow sales from major clients

Organizational Structure of LG Electronics
10
LG Electronics
* Newly established
Home Appliance
& Air Solution
Vehicle
Components
Home
Entertainment
Mobile
Communications
Home Appliance
& Air Solution
Vehicle
Components
Home
Entertainment
Mobile
Communications
B2B (Business to Business)
*

http://www.lg.com/global

Appendix
*) Since the information regarding results of 4Q'17 has been prepared in advance, it is subject to change in the process of final audit by external auditors
Summarized Financial Statements (Consolidated)
Income Statement
(Unit: KRW bn, %)
11
2016 2017
1Q 2Q 3Q 4Q Total 1Q 2Q 3Q 4Q Total
Sales 13,362.1 100.0% 14,002.9 100.0% 13,224.3 100.0% 14,777.7 100.0% 55,367.0 100.0% 14,657.2 100.0% 14,551.4 100.0% 15,224.1 100.0% 16,963.6 100.0% 61,396.3 100.0%
Cost of goods sold 10,038.4 75.1% 10,236.4 73.1% 9,915.4 75.0% 11,440.1 77.4% 41,630.3 75.2% 10,963.0 74.8% 10,830.0 74.4% 11,619.9 76.3% 13,324.7 78.5% 46,737.6 76.1%
Gross profit 3,323.7 24.9% 3,766.5 26.9% 3,308.9 25.0% 3,337.6 22.6% 13,736.7 24.8% 3,694.2 25.2% 3,721.4 25.6% 3,604.2 23.7% 3,638.9 21.5% 14,658.7 23.9%
Selling & admin expense 2,818.5 21.1% 3,181.9 22.7% 3,025.7 22.9% 3,372.8 22.8% 12,398.9 22.4% 2,772.7 18.9% 3,057.3 21.0% 3,088.1 20.3% 3,272.1 19.3% 12,190.2 19.9%
Operating income (Loss) 505.2 3.8% 584.6 4.2% 283.2 2.1% -35.2 -0.2% 1,337.8 2.4% 921.5 6.3% 664.1 4.6% 516.1 3.4% 366.8 2.2% 2,468.5 4.0%
Financial income (Expense) -120.9 -0.9% -81.5 -0.6% -106.8 -0.8% -84.3 -0.6% -393.5 -0.7% -109.2 -0.7% -53.1 -0.4% -62.1 -0.4% -123.0 -0.7% -347.4 -0.6%
Gains (loss) on
equity method investment -22.3 -0.2% -26.2 -0.2% 19.9 0.2% 297.3 2.0% 268.7 0.5% 230.1 1.6% 258.1 1.8% 165.6 1.1% 13.7 0.1% 667.5 1.1%
Other non operating
income (Loss) -80.4 -0.6% -1.6 0.0% -148.4 -1.1% -260.9 -1.8% -491.3 -0.9% 49.5 0.3% -126.9 -0.9% -103.9 -0.7% -49.2 -0.3% -230.5 -0.4%
Net income before tax 281.6 2.1% 475.3 3.4% 47.9 0.4% -83.1 -0.6% 721.7 1.3% 1,091.9 7.4% 742.2 5.1% 515.7 3.4% 208.3 1.2% 2,558.1 4.2%
Corporate Income Tax 83.5 0.6% 206.8 1.5% 129.4 1.0% 175.7 1.2% 595.4 1.1% 256.2 1.7% 227.3 1.6% 179.6 1.2% 25.5 0.2% 688.6 1.1%
Net Income 198.1 1.5% 268.5 1.9% -81.5 -0.6% -258.8 -1.8% 126.3 0.2% 835.7 5.7% 514.9 3.5% 336.1 2.2% 182.8 1.1% 1,869.5 3.0%
Controlled shares 190.6 271.0 -62.0 -322.7 76.9 795.3 497.5 318.1 114.9 1,725.8
Non-controlled shares 7.5 -2.5 -19.5 63.9 49.4 40.4 17.4 18.0 67.9 143.7

Appendix
*) Since the information regarding results of 4Q'17 has been prepared in advance, it is subject to change in the process of final audit by external auditors
Summarized Financial Statements (Consolidated)
Statements of Financial Position
(Unit: KRW bn)
12
2016 2017
1Q 2Q 3Q 4Q 1Q 2Q 3Q 4Q
Assets 37,176.9 37,245.0 37,285.6 37,855.3 38,124.5 39,342.4 41,127.2 41,221.0
Current Assets 17,378.8 17,271.8 17,277.5 16,990.6 17,474.9 18,275.2 19,597.9 19,195.0
Cash and cash equivalents 3,294.8 2,908.0 3,488.5 3,015.1 3,031.9 3,604.4 3,486.5 3,350.6
Accounts receivable 6,838.2 7,351.8 6,644.7 7,059.9 7,360.1 7,344.6 7,737.6 8,178.2
Inventory 5,417.8 5,209.5 5,544.8 5,171.0 5,392.0 5,620.2 6,358.0 5,908.4
Others 1,828.0 1,802.5 1,599.5 1,744.6 1,690.9 1,706.0 2,015.8 1,757.8
Non-current Assets 19,798.1 19,973.2 20,008.1 20,864.7 20,649.6 21,067.2 21,529.3 22,026.0
Investment 4,768.3 4,721.1 4,701.7 5,104.6 5,175.0 5,503.8 5,695.8 5,620.3
PP&E 10,359.8 10,514.9 10,606.2 11,222.4 11,086.9 11,171.4 11,385.1 11,800.8
Intangible assets 1,468.9 1,509.1 1,523.5 1,571.1 1,610.4 1,703.6 1,778.0 1,854.6
Others 3,201.1 3,228.1 3,176.7 2,966.6 2,777.3 2,688.4 2,670.4 2,750.3
Liabilities 24,186.9 24,116.7 24,707.8 24,498.6 24,432.9 24,934.3 26,202.3 26,547.3
Accounts payable 6,561.4 6,315.3 6,740.7 6,746.4 7,613.2 7,116.9 8,127.2 8,137.5
Debt 9,291.7 8,801.6 9,007.7 8,659.0 8,629.2 8,956.5 9,163.7 9,450.5
Others 8,333.8 8,999.8 8,959.4 9,093.2 8,190.5 8,860.9 8,911.4 8,959.3
Equity 12,990.0 13,128.3 12,577.8 13,356.7 13,691.6 14,408.1 14,924.9 14,673.7

Appendix
*2) From 2Q'17, Companion Device(Innovative Personal Device) has been restated to MC division from Others. From 3Q'17, Smart Lighting has been restated to H&A division from Others.
*1) Since the information regarding results of 4Q'17 has been prepared in advance, it is subject to change in the process of final audit by external auditors
Sales / Profits by Division (Consolidated)
(Unit: KRW bn)
13
1Q'16 2Q'16 3Q'16 4Q'16 '16 Total 1Q'17 2Q'17 3Q'17 4Q'17
'17 Total QoQ YoY
H&A Sales 4,229.9 4,711.9 4,281.6 4,054.7 17,278.1 4,647.7 5,264.6 4,984.4 4,329.4 -13% 7% 19,226.1
(Home Appliance & Air Solution) Op. Income 404.0 429.9 336.9 146.8 1,317.6 519.1 464.3 424.9 80.7 1,489.0
(%) 9.6% 9.1% 7.9% 3.6% 7.6% 11.2% 8.8% 8.5% 1.9% 7.7%
HE Sales 4,333.4 4,157.2 4,141.5 4,793.4 17,425.5 4,326.1 4,234.9 4,637.6 5,475.1 18% 14% 18,673.7
(Home Entertainment) Op. Income 335.2 356.7 381.5 164.0 1,237.4 382.2 343.0 458.0 383.5 1,566.7
(%) 7.7% 8.6% 9.2% 3.4% 7.1% 8.8% 8.1% 9.9% 7.0% 8.4%
MC Sales 3,020.6 3,421.2 2,601.4 2,980.7 12,023.9 3,091.7 2,701.4 2,807.7 3,065.5 9% 3% 11,666.3
(Mobile Communications) Op. Income -193.7 -139.5 -425.6 -459.3 -1,218.1 3.7 -132.4 -375.3 -213.2 -717.2
(%) -6.4% -4.1% -16.4% -15.4% -10.1% 0.1% -4.9% -13.4% -7.0% -6.1%
VC Sales 592.9 639.6 674.9 865.6 2,773.0 876.4 882.6 873.4 856.7 -2% -1% 3,489.1
(Vehicle Components) Op. Income -15.8 -16.8 -16.2 -14.4 -63.2 -14.5 -16.4 -29.0 -41.1 -101.0
(%) -2.7% -2.6% -2.4% -1.7% -2.3% -1.7% -1.9% -3.3% -4.8% -2.9%
Others Sales 325.9 255.1 438.0 326.2 1,345.2 340.0 403.7 611.2 668.8 9% 105% 2,023.7
Op. Income -24.4 -10.8 -4.6 11.4 -28.4 -34.1 -15.7 6.6 21.1 -22.1
LGE Consolidated
Excluding
LG Innotek (①)
Sales 12,502.7 13,185.0 12,137.4 13,020.6 50,845.7 13,281.9 13,487.2 13,914.3 14,395.5 3% 11% 55,078.9
Op. Income 505.3 619.5 272.0 -151.5 1,245.3 856.4 642.8 485.2 231.0 2,215.4
(%) 4.0% 4.7% 2.2% -1.2% 2.4% 6.4% 4.8% 3.5% 1.6% 4.0%
LG Innotek (②) Sales 1,195.0 1,120.5 1,384.5 2,054.6 5,754.6 1,644.7 1,339.6 1,787.3 2,869.8 61% 40% 7,641.4
Op. Income 0.4 -34.0 20.6 117.8 104.8 66.8 32.6 55.9 141.2 296.5
LGE-LG Innotek
Inter-company Transaction (③)
Sales 335.6 302.6 297.6 297.5 1,233.3 269.4 275.4 477.5 301.7 -37% 1% 1,324.0
Op. Income 0.5 0.9 9.4 1.5 12.3 1.7 11.3 25.0 5.4 43.4
LGE Consolidated (①+②-③)
Sales 13,362.1 14,002.9 13,224.3 14,777.7 55,367.0 14,657.2 14,551.4 15,224.1 16,963.6 11% 15% 61,396.3
Op. Income 505.2 584.6 283.2 -35.2 1,337.8 921.5 664.1 516.1 366.8 2,468.5
(%) 3.8% 4.2% 2.1% -0.2% 2.4% 6.3% 4.6% 3.4% 2.2% 4.0%


