THE SCALE OF THE ISSUE For many poor people in developing countries, the inability to access jobs, education, and health facil- ities is viewed as the most serious constraint on their quality of life (Narayan 2000a). Motorized transport is often crucial to poor people, but because they frequently live and work in the shadow of motor- ized transport, they are also the most vulnerable to its adverse environmental impacts. Environmental protection must therefore be seen as an essential part of the task of improving the quality of life of the poor, and not as a luxury to be purchased at the expense of the poor’s mobility. A comprehensive strategy for transport and the urban environment should cover the built envi- ronment, including land take, urban form, visual intrusion of infrastructure and traffic, and cultural heritage; the social effects of transport in caus- ing occupational or locational resettlement and community severance; personal safety and secu- rity; and the more commonly recognized prob- lems of noise and air pollution (local, regional, and global). All of these concerns must be for- mally addressed in a typical project’s environ- mental assessment. In this review we deal with matters concerning the built environment in chapters 2 and 6, with the social effects in chapter 3, and with safety and security in chapter 5. In this chapter we deal only with various forms of pollution, especially air pollution. In developing countries an estimated 0.5 million to 1 million people die prematurely each year as a result of respiratory and other illnesses caused by exposure to urban air pollution. This is a larger number than those dying as a consequence of urban traffic accidents, although because of the age distribution of those afflicted, traffic acci- dents probably reduce life-years more. Exposure to lead contributes to behavioral problems and learning disabilities in urban children. It also reduces the quality of life. TRANSPORT AND THE URBAN ENVIRONMENT 39 TRANSPORT AND THE URBAN ENVIRONMENT 4 Road transport contributes significantly to urban air pollution in many countries. The World Health Organization estimates that suspended particulate matter leads to the premature death of over 0.5 million people per year. The economic costs of air pollution have been estimated to be equivalent to about 2 percent of gross domestic product in many countries. Incorporation of environmental issues within an urban transport strategy requires the identification of the main transport-generated pollutants (usually suspended particulate matter, lead, and ozone) and the mobilization of technical, fiscal, and system management controls on fuel and vehicle technology to reduce these pollutants. Frequently these will also contribute to a desirable reduction of greenhouse gas emissions.
Transcript
THE SCALE OF THE ISSUE
For many poor people in developing countries, theinability to access jobs, education, and health facil-ities is viewed as the most serious constraint on theirquality of life (Narayan 2000a). Motorized transportis often crucial to poor people, but because theyfrequently live and work in the shadow of motor-ized transport, they are also the most vulnerable toits adverse environmental impacts. Environmentalprotection must therefore be seen as an essentialpart of the task of improving the quality of life ofthe poor, and not as a luxury to be purchased atthe expense of the poor’s mobility.
A comprehensive strategy for transport and theurban environment should cover the built envi-ronment, including land take, urban form, visualintrusion of infrastructure and traffic, and culturalheritage; the social effects of transport in caus-ing occupational or locational resettlement andcommunity severance; personal safety and secu-rity; and the more commonly recognized prob-
lems of noise and air pollution (local, regional,and global). All of these concerns must be for-mally addressed in a typical project’s environ-mental assessment.
In this review we deal with matters concerningthe built environment in chapters 2 and 6, withthe social effects in chapter 3, and with safetyand security in chapter 5. In this chapter we dealonly with various forms of pollution, especiallyair pollution.
In developing countries an estimated 0.5 millionto 1 million people die prematurely each year asa result of respiratory and other illnesses causedby exposure to urban air pollution. This is a largernumber than those dying as a consequence ofurban traffic accidents, although because of theage distribution of those afflicted, traffic acci-dents probably reduce life-years more. Exposureto lead contributes to behavioral problems andlearning disabilities in urban children. It alsoreduces the quality of life.
TRANSPORT AND THE URBAN ENVIRONMENT 39
TRANSPORT AND THE URBAN ENVIRONMENT4Road transport contributes significantly to urban air pollution in many
countries. The World Health Organization estimates that suspended particulate
matter leads to the premature death of over 0.5 million people per year. The
economic costs of air pollution have been estimated to be equivalent to about
2 percent of gross domestic product in many countries. Incorporation of
environmental issues within an urban transport strategy requires the
identification of the main transport-generated pollutants (usually suspended
particulate matter, lead, and ozone) and the mobilization of technical, fiscal,
and system management controls on fuel and vehicle technology to reduce
these pollutants. Frequently these will also contribute to a desirable reduction
of greenhouse gas emissions.
40 CITIES ON THE MOVE: A WORLD BANK URBAN TRANSPORT STRATEGY REVIEW
GLOBAL WARMING
It is now generally agreed that a global climatechange is occurring. It also appears that thepoorer countries stand to suffer most as a con-sequence of this change, with estimated costs inthe range of 5 to 9 percent of gross domesticproduct (GDP) for some of the poorer countries—several times greater than the relative effect inindustrialized countries.1 It is estimated that thetransport sector is responsible for about 25 per-cent of emissions of the gases contributing toglobal warming in industrialized countries, butonly about one-half this amount in developing-country cities.2 While the proportion appears tohave been stabilized in the Organisation forEconomic Co-operation and Development(OECD) countries, it is still growing in the devel-oping countries as motorized transport increases.This increase in motorized transport is concen-trated in urban areas. Although controversy con-tinues over the optimal greenhouse gas (GHG)reduction strategy, and the distribution of actionbetween industrialized and developing countries,it is accepted that some mitigating strategy iscalled for in all countries.
Despite this, GHG mitigation has a negative con-notation in many developing countries, whereexhortations to limit GHG emissions are per-ceived as a denial of the right to develop the serv-ices and lifestyle being enjoyed by industrializedcountries. The apparent unwillingness of someindustrialized-country governments to take strongaction also does not help, while the inherent long-term and nonlocal nature of the negative impactsof GHGs feeds this attitude.
A “business-as-usual” scenario for the transportsector offers little prospect of relief. The princi-pal components determining the level of GHGemissions in transport are the level of activity (inton or passenger kilometers), the modes of trans-port used, the energy intensity of each mode,and the mix of fuels used. In the industrializedcountries, transport activity has increased paripassu with economic growth, the shift to the pri-
vate car and air transport has worsened themodal balance effect, and changes in the bal-ance of fuels has had little impact. It is only thedramatic increase in fuel efficiency that has actedas a brake on GHG emissions. Even so, trans-port GHG emissions continue to grow in theindustrialized countries even though overall emis-sions have been stabilized. Economic growth inthe developing countries similarly threatens todominate any attenuating effect of technologyimprovement.
To avert this outcome requires a combination oftransportation policy reforms in the short termand technological changes in the longer term.The question is how to get such policies adopted.The suggested key to changing this situation is tolink GHG-mitigation policy initiatives to goalsthat are perceived to be of immediate relevance(such as local air pollution and balance-of-pay-ments considerations) and to try to uncouple, orat least “flex,” the link between economic growthand GHG emissions from the transport sector.3
We start from the observed synergy betweenGHG reduction and local environmental and eco-nomic interests. The GHGs that most contributeto global warming in the transport sector includecarbon dioxide (CO2), methane, and nitrous oxide(N2O). Emissions of CO2 are directly proportionalto the quantity of carboniferous fuel consumed;other things being equal, reduced fuel con-sumption will reduce economic costs and globalpollution simultaneously. Better traffic flow con-ditions typically reduce fuel consumption per kilo-meter. In chapter 6 we advocate both road-basedtraffic management and traffic restraint measuresto that end, while the measures that are sug-gested to improve public transport in chapter 7and to improve nonmotorized transport (NMT)in chapter 8 should have similar effects. Moregenerally, local air quality improvement programsfor urban transport in middle-income countriessuch as Mexico and Chile have also shown somecollateral benefits for reducing GHG emissions.4
While the rest of this chapter focuses primarilyon local air pollution reduction, much of it also
TRANSPORT AND THE URBAN ENVIRONMENT 41
relates, by implication, to the global warmingissue. Because these types of interventions can beshown to be in the immediate self-interest of cityresidents themselves, it is believed that concen-trating on exploiting the synergy between GHGreductions and local economic and environmentalinterests is likely to be the most productive strate-gic stance.
This must be supported by economic incentives.Fossil fuel consumption is influenced directly byfuel choice, vehicle size, and fuel efficiency, andindirectly by individual and corporate decisionson activity location and style, and transport mode.Emissions of methane come largely from leak-ages of gasoline, diesel, and unburned naturalgas and are thus susceptible to influence by fuel-ing infrastructure improvement. The strongestincentive to fuel economy in actions in all thesedimensions is the monetary cost of fuel. It hasbeen shown that pollution controls supported byappropriate prices or taxes are much more effec-tive than is the use of regulations alone.5 In chap-ter 10 we discuss this in detail, arguing for fuelprices that at least cover the full social costs offuel consumption.
Unfortunately there is not always a synergybetween local air pollution and GHG emis-sion–mitigation measures. The current generationof diesel vehicles appears to be more damagingto public health than are gasoline or gas-poweredvehicles. Thus, while diesel is a particularly effi-cient fuel from the point of view of reducing GHGemissions, only the new generation of clean dieselsshould have a role in GHG strategy. Furthermore,mitigation measures for local pollution focus onemissions of vehicles in use, whereas the entirelife cycle (from well to tailpipe) is relevant for analy-sis of GHG emissions. Worldwide policies to refor-mulate transport fuels to mitigate local pollutionby means of severe hydrotreating (particularlyrecent moves in North America and the EuropeanUnion [EU] to limit sulfur in gasoline and diesel to10–50 parts per million by weight [wt ppm] orlower) make refinery processes increasingly energyintensive, increasing GHG emissions. N2O can
increase significantly when catalysts used to con-vert nitric oxide (NO) or nitrogen dioxide (NO2)begin to be deactivated.
A strategic response is therefore required toaddress situations where the synergy is weak ornegative and where a tradeoff between local andglobal effects appears. In this context, the GlobalEnvironment Fund (GEF), a multidonor fundadministered by the World Bank, has promotedthe concept of the “global overlay.” This is a pro-cedure in which measures developed to targetother objectives are subject to a scrutiny explor-ing the possibility and cost of modifying them toyield GHG reductions. In this way an attempt ismade to identify and concentrate on those areaswhere GHG reductions have the least “opportu-nity cost.” Through GEF’s Operational Program11, on transport, GEF funding is available bothfor the development of new globally friendly tech-nologies and, on an incremental cost basis, forother interventions that pilot promising currentGHG reduction policies. An early grant under thisscheme is supporting the development of infra-structure for bicycle movement in an outer areaof Manila. The Bank has also established a“Prototype Carbon Fund” to foster the interna-tional transfer of certified emission reductionsunder the Clean Development Mechanism, asdefined in Article 12 of the Kyoto Protocol.
Technological measures to secure GHG reduc-tion perform primarily through the replacementof the vehicle stock. This may take up to 20 yearsto complete for cars and up to 30 years for freightvehicles. In developing countries, however, mostof the change of vehicle stock is through growth,so that strategies affecting new vehicles may havea more rapid effect on emissions per unit of activ-ity. Hence, with GDP rising, the best way toachieve a decline in GHG emissions by transportvehicles is a combination of policy reforms in theshort term and technological changes in thelonger term. Because most vehicle users aredriven by economic motives, this implies a needfor strong support from taxation and pricinginstruments. “Closing the loop,” so that revenues
42 CITIES ON THE MOVE: A WORLD BANK URBAN TRANSPORT STRATEGY REVIEW
from increased taxation or charges for vehiclesor fuels are seen to contribute to improvementin the transport sector, is likely to be a necessarycondition to secure acceptance of the policies atthe political level. This is further discussed in chap-ter 10.
NOISE AND OTHERDISTURBANCES
Noise from transport appears to be consideredmuch less seriously in developing countries thanin high-income countries. While there have beenstudies of the physical damage resulting fromexposure to occupational noise, these have beenmostly in manufacturing establishments. Thelevels experienced in developing-country streets,while not pleasant, approach but do not exceedthe lower limits above which noise is consideredan occupational hazard. Attitude surveys do notshow urban transport noise to be perceived as aserious hazard.
Other disturbances exist. Heavy road traffic vol-umes can make roads dangerous and difficult tocross, causing community severance. It isreported that in Jakarta, businesspersons rou-tinely take taxis just to get safely to the other sideof the busiest thoroughfares. Barriers, foot-bridges, and tunnels may reduce the danger butincrease the severance, particularly in countrieswhere these facilities appear to be constructedand located to improve motor vehicle flow ratherthan to assist pedestrians (see chapter 5).
Severance can in some circumstances be reducedby the grade separation of motorized traffic andmass transport from pedestrian movements. Inestablished cities, tunneling is often too expen-sive (and technically difficult for major flows ofroad traffic for ventilation reasons) so that eleva-tion is the only viable possibility. This can causesignificant visual intrusion as well as restrict thedispersion of fumes from traffic remaining atground level. The elevated rail transport systemso dominates Silom and Sukhumvit roads in
Bangkok that the government has decided toavoid any further elevated mass transit in the cen-tral area. The problems of community severanceand visual intrusion can, to some extent, bereduced by good engineering design. The mainlesson from experience is that community sev-erance and visual intrusion have often developedbecause of inadequate coordination amongstrategic planning, transport infrastructure invest-ment planning and design, and management ofprivate participation in infrastructure. That empha-sizes some institutional requirements, to whichwe will return in chapter 11.
URBAN AIR POLLUTION
By far the greatest environmental concern abouturban transport in most cities relates to local airpollution. Designing an appropriate strategy, withlimited resources, to address this concern requirescareful identification of priorities, both in select-ing targets and in selecting instruments.6 Thissection first identifies the major local air pollu-tants produced by urban transport, and assessesthe significance of their contribution to the totalurban environmental burden. On this basis, wethen discuss four main types of instrument forconsideration as components of a strategy forreducing the impact of transport on the urbanenvironment. The first two types—actions ontransport vehicles and transport fuels—are pri-marily technological. The other two types ofinstrument—traffic management and fiscal instru-ments—while requiring technological supportfor effective implementation, are “softer” policyinstruments. In some countries, such as Mexico,public transport improvements are sought pri-marily for environmental reasons.
MAJOR TRANSPORT-GENERATED AIRPOLLUTANTS AND THEIR SIGNIFICANCE Vehicular emissions are very damaging to health.
a. High lead concentration in the bloodstreammay increase incidence of miscarriages in
TRANSPORT AND THE URBAN ENVIRONMENT 43
women, impair renal function, and increaseblood pressure. Most significantly, it retardsthe intellectual development of children andadversely affects their behavior. More leadis absorbed when dietary calcium intake islow, in cases of iron deficiency, when thestomach is empty, and by the young, so poormalnourished children are particularly sus-ceptible to lead poisoning. Suspended par-ticulate matter, particularly particles fromvehicle emissions and tire wear that fall pre-dominantly in the submicron range, are ableto penetrate deep into the respiratory tract,cause respiratory problems, exacerbateasthma, and damage lung function. Thereis also a growing consensus that dieselexhaust poses a serious cancer risk.7
b. Carbon monoxide (CO) inhibits the capac-ity of blood to carry oxygen to organs andtissues. People with chronic heart diseasemay experience chest pains when CO levelsare high; at very high levels, CO impairsvision, manual dexterity, and learning abil-ity, and can cause death.
c. Sulfur oxides (SOx) which are emitted indirect proportion to the amount of sulfurpresent in fuel, cause changes in lung func-tion in asthmatics and exacerbate respira-tory symptoms in sensitive individuals; theycontribute to acid rain and to the formationof secondary particulate matter.
d. Oxides of nitrogen (NOx) cause changes inlung function in asthmatics, contribute toacid rain and secondary particulate forma-tion, and are a precursor of ground-levelozone. Both diesel- and gasoline-fueled vehi-cles contribute to NOx emissions.
e. Ozone is responsible for photochemicalsmog and decreases pulmonary function inindividuals taking light to heavy exercise.NOx (which is emitted in significant quanti-ties by gasoline- and diesel-fueled vehicles)and photochemically reactive volatile organic
compounds (to which emissions by gaso-line-fueled vehicles contribute) are the twomain precursors of ozone.
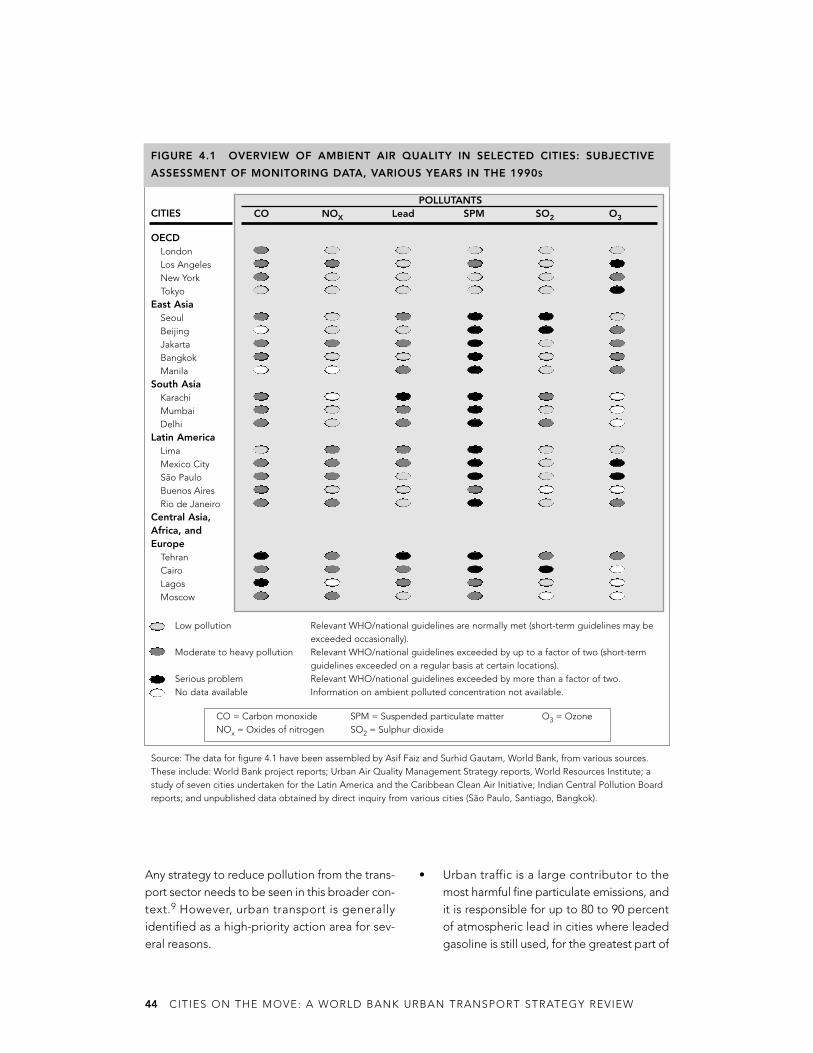
While all of these emissions are potentially dam-aging, their incidence and their health impactsdiffer substantially, both between pollutantsa n d b e t w e e n re g i o n s . Wo r l d H e a l t hOrganization (WHO) studies of megacities,although now somewhat dated, show that,although health norms of all major pollutantsare widely exceeded, the significance of theproblem varies considerably (WHO 1992). Leadexcesses over norm are very serious whereleaded gasoline is used, but not usually else-where. Excess of CO is typically not nearly asgreat as that of fine particulate matter, partic-ularly in countries where the consumption ofgasoline is relatively low compared with that ofdiesel. Significantly elevated levels of ambientSO2 tend to come from the combustion of coalmuch more than from the transport sector.Ambient NO2 concentrations are often belowthe WHO guidelines, but are on the increase,as are those of ozone (figure 4.1).
When risk assessment of susceptibility to physi-cal excesses are combined with evidence ofhealth impacts from dose and response analysis,studies in a number of cities (for example,Bangkok; Cairo; Mexico City; Quito, Ecuador;and Santiago) have indicated that the greatestdamage to human health comes from exposureto fine particulate matter (particles smaller than2.5 microns in aerodynamic diameter, or PM2.5)and to lead. Depending on topographical andmeteorological conditions, ozone can also be aserious health problem in large metropolitanregions, as it is in Mexico City and Santiago.8
Transport is not the only source of urban air pol-lution. In particular, industrial and domestic useof fossil fuels—especially heavy fuel oil, biomass,and brown coal—is a significant source of ambi-ent particulate matter and sulfur dioxide (SO2),especially in temperate regions such as Chinaand Eastern Europe.
44 CITIES ON THE MOVE: A WORLD BANK URBAN TRANSPORT STRATEGY REVIEW
Any strategy to reduce pollution from the trans-port sector needs to be seen in this broader con-text.9 However, urban transport is generallyidentified as a high-priority action area for sev-eral reasons.
• Urban traffic is a large contributor to themost harmful fine particulate emissions, andit is responsible for up to 80 to 90 percentof atmospheric lead in cities where leadedgasoline is still used, for the greatest part of
FIGURE 4.1 OVERVIEW OF AMBIENT AIR QUALITY IN SELECTED CITIES: SUBJECTIVE
ASSESSMENT OF MONITORING DATA, VARIOUS YEARS IN THE 1990S
OECDLondonLos AngelesNew YorkTokyo
East AsiaSeoulBeijingJakartaBangkokManila
South AsiaKarachiMumbaiDelhi
Latin AmericaLimaMexico CitySão PauloBuenos AiresRio de Janeiro
Central Asia,Africa, andEurope
TehranCairoLagosMoscow
POLLUTANTSCO NOX Lead SPM SO2 O3CITIES
Low pollution Relevant WHO/national guidelines are normally met (short-term guidelines may beexceeded occasionally).
Moderate to heavy pollution Relevant WHO/national guidelines exceeded by up to a factor of two (short-term guidelines exceeded on a regular basis at certain locations).
Serious problem Relevant WHO/national guidelines exceeded by more than a factor of two.No data available Information on ambient polluted concentration not available.
CO = Carbon monoxide SPM = Suspended particulate matter O3 = OzoneNOx = Oxides of nitrogen SO2 = Sulphur dioxide
Source: The data for figure 4.1 have been assembled by Asif Faiz and Surhid Gautam, World Bank, from various sources.These include: World Bank project reports; Urban Air Quality Management Strategy reports, World Resources Institute; astudy of seven cities undertaken for the Latin America and the Caribbean Clean Air Initiative; Indian Central Pollution Boardreports; and unpublished data obtained by direct inquiry from various cities (São Paulo, Santiago, Bangkok).
TRANSPORT AND THE URBAN ENVIRONMENT 45
CO emissions, and for significant contribu-tion to the formation of ground-level ozone.
• Large stationary sources of air pollution,which are often located at a distance fromdensely populated city centers, disperse intothe higher layers of the atmosphere whilevehicles emit near ground level in highlypopulated areas. Consequently, vehiclescontribute more to human exposure thantheir share in total emissions loads wouldindicate. In a study of six megacities, vehi-cles accounted for only 6 percent of emis-sions in tons emitted but 32 percent ofaverage exposure for the population.
• The urban transport sector is one of veryrapid growth and change, which makes itvery susceptible to positive and to protec-tive actions. An understanding of the envi-ronmental significance of alternativetransport policies and actions may enablegrowing cities to avoid the environmentalimpacts already endured in the megacities.
FUEL POLICY Fuel policy measures may affect the pollutingcharacteristics of existing fuels, the selectionamong available fuels, and the total amount offuel consumed.
Improving fuel qualityFor the World Bank’s client countries, the first stepin improving the quality of transport fuels is tophase out lead in gasoline. Lead has historicallybeen added to gasoline as an octane enhancer.Because of its toxicity, there is now a worldwidemove to ban its use in gasoline. More than three-quarters of the gasoline sold worldwide today isunleaded. Virtually all OECD countries and manylarge developing and transition countries, includ-ing Bangladesh, Brazil, Honduras, Hungary,Malaysia, and Thailand, have already eliminatedlead in gasoline.10 Some very large countries,including Indonesia, Venezuela, and most coun-tries in Sub-Saharan Africa, remain to be converted.
In the absence of other significant sources of lead,eliminating lead additive in gasoline can reduce
ambient concentrations of lead to less than 0.2micrograms per cubic meter (mg/m3) and the levelof lead in blood to lower than 5 micrograms perdeciliter (mg/dl), below the 10 mg/dl level nowconsidered by many health organizations to bethe appropriate norm. The necessary strategyshould attend both to the introduction ofunleaded fuel and the elimination of leaded fuel.
Eliminating lead additive from gasoline can alsotrigger wider environmental improvement. Theavailability of unleaded gasoline throughout acountry is a prerequisite for the introduction ofcatalytic converters to reduce the emissions ofNOx, CO, and hydrocarbons. The level of COemissions can also be reduced by incorporatingoxygenates into gasoline. It is important, how-ever, to stress that lead elimination should notbe carried out in isolation because many of thegasoline-blending components used to increaseoctane after elimination of lead have their ownadverse health effects. Excessive presence ofbenzene and total aromatics in unleaded gaso-line would be of particular concern. However,controlling gasoline volatility and adjusting refin-ery operations and processing units can managethese blending components at a reasonable costduring the lead phase-out process.
Sulfur in diesel and gasoline generates emissionsof SO2, causes acid rain, and contributes to par-t iculate emissions. I t can be reduced byhydrotreating the base fuels. However, in coun-tries where the carbon component of vehicularparticulate matter remains high, it may not makeeconomic sense to attempt to match NorthAmerican and EU sulfur standards immediatelyin order to mitigate particulate emissions fromdiesel engines.11 Rather, tightening of standardsshould be carefully phased in the light of coun-try-specific circumstances. In some extreme cases,proposed emissions standards are incompatiblewith the transport fuels available on the market.For example, insistence on Euro 2–compliantbuses when the sulfur level in the diesel availablein the country may be as high as 5,000 wt ppm isnot technically coherent. Some regional effort
46 CITIES ON THE MOVE: A WORLD BANK URBAN TRANSPORT STRATEGY REVIEW
may also be necessary to harmonize refining andimport standards to avoid local black markets inhigh-sulfur diesel. Transport, environment, andenergy policies must always be carefully aligned.
It is not enough to regulate fuel quality. In manydeveloping countries, old, poorly maintained vehi-cles dominate vehicle fleets. This reduces the costeffectiveness of imposing stringent fuel specifi-cations.12 Moreover, in some countries transportfuels are routinely adulterated. For example, theaddition of (lower-cost) kerosene to gasoline inAsia (box 4.1), cross-contamination of diesel withcrude oil, and addition of lead additives to gaso-line downstream of refineries or terminals inCentral Asia and the Caucasus all increase vehicleemissions. Regular fuel-quality monitoring,together with costly penalties for noncompliance,could help enforce fuel standards more effectively,although preventing local adulteration is likely toremain very difficult as long as there is any finan-cial incentive to engage in the practice.
Fuel-quality requirements are location specific,depending on climatic conditions, ambient con-centrations, vehicle fleet characteristics, and soon. For example, Chile and Mexico have morestringent standards than do other Latin Americancountries because of the particular pollution char-
acteristics of their capital cities. Countries thathave domestic refineries merit special attentionin this context because refinery processes areintegrated, and changing the specifications ofone fuel can affect the quality of other fuels andoverall refinery economics. While many countrieshave fuel standards, most of these standards arestipulated in the form of fuel composition. In theUnited States, the combination of allowing theoption of fuel certification on the basis of vehi-cle emissions, in lieu of fuel composition, andregional differentiation of specifications hasallowed the refining sector the freedom to seekflexible least-cost solutions for meeting specificvehicle emissions standards.
The governments own many refineries in devel-oping countries. Some are not operated eco-nomically at present. Revamping refineries toimprove fuel mix and quality is likely to renderthem even less commercially viable. Under thesecircumstances the government may resist requir-ing changes in fuel quality, or will embrace themonly while maintaining import protection throughrestrictions or high tariffs. In some developingcountries, the net cost to society of improving fuelquality by importing superior fuels would be lowerthan the costs resulting from the use of domesti-cally manufactured fuels with less-stringent spec-
BOX 4.1 FUEL ADULTERATION IN THAILAND
Adulteration of heavily taxed gasoline by highly subsidized kerosene was a serious problem inThailand in the early 1980s. The government introduced a number of measures, including:
• Dyeing the kerosene blue• Requiring kerosene to be sold in 20-liter containers only• Extensive enforcement efforts by the police.
Although these measures had some effect, sales of kerosene remained high until oil taxes wererestructured in 1986 and the tax on kerosene increased between 1986 and 1991 to remove theincentive to adulterate. However, the incentive to adulterate gasoline with untaxed industrial sol-vents remains, and such adulteration is a continuing problem.
Source: Jitendra Shah, private correspondence.
TRANSPORT AND THE URBAN ENVIRONMENT 47
ifications. Downstream petroleum–sector reformthrough transfer of ownership from the govern-ment to the private sector, coupled with liberal-ization of petroleum product trade and theintroduction of competition, can therefore result inimproved fuel and, ultimately, urban air quality.
Substituting cleaner fuelsA range of alternative fuels considered to becleaner than conventional hydrocarbons continueto be under investigation or development inindustrialized countries. For substitutes to beattractive in the developing world, they must beseen not only as addressing locally perceivedenvironmental problems but also as economi-cally viable at the individual and national levels.It is in that context that the potential of new fuelsfor urban transport in the developing world mustbe appraised.
Compressed natural gas (CNG) is a relativelyclean fuel.13 Natural gas is available in abundancein many developing countries that do not haveother indigenous fuel resources—such asArgentina, Bangladesh, and Thailand—and henceis potentially of great balance-of-payments sig-nificance. As transport use of CNG alone is notenough to justify the development of gas fieldsand the construction of gas transport and distri-bution infrastructure, the availability of CNG fortransport is closely linked to its availability throughcity gas distribution networks. These exist in manylarge cities in Bangladesh, Brazil, Colombia,Indonesia, Pakistan, Eastern Europe, and theformer Soviet Union. Some governments havealready specifically mandated the use of naturalgas as the transport fuel in highly polluted areas(for example, for taxis in Buenos Aires and, morerecently, for buses and all pre-1990 auto-rickshawsand taxis in New Delhi, India).
The environmental benefit of CNG is not undis-puted. Although recent tests by the New YorkCity Transit Authority have shown that natural gasbuses have better local pollutant emission char-acteristics than do ordinary diesel buses, theiremission advantages are significantly lowered or
even eliminated when compared with diesel-powered buses running on ultra low sulfur dieseland equipped with a continuously regeneratingparticulate trap. Similarly, although the overallglobal warming impact of cars fueled by CNG islower than that with gasoline (especially wherethe natural gas would otherwise be flared), gaso-line vehicles that are converted to natural gassuffer from potentially high leakage of the GHGmethane. Although some good retrofitted kits(for example, those used in Argentina) work effi-ciently, many do not. For example, the conver-sion of a fleet of Mercedes buses in Rio de Janeirois reported to have increased most emissionsexcept those of particulates.
A second disadvantage concerns the economicand technical sustainability of the technology indeveloping countries. The New York City TransitAuthority reported that CNG vehicles pay a 30to 35 percent energy premium over diesel vehi-cles. Technically, of a fleet of 40 CNG buses inJakarta, 20 were out of operation in mid-2001due to maintenance problems. Dual-fuel vehi-cles also carry some extra cost penalties and reli-ability problems. Again in Jakarta, a fleet ofNissan dual-fuel vehicles is now being run assingle-fuel (diesel) vehicles for technical reasons.
The economics of CNG are complex. Becausethe choice of fuel generally rests with the busi-ness or individual, the critical factor is ultimatelythe cost and convenience of CNG compared withthat of other fuels. As far as the fuel is concerned,the Intergovernmental Panel on Climate Change(IPCC) estimated the wellhead gasoline equiva-lent production cost of CNG to lie between 70and 90 percent that of gasoline or diesel, so thatgiven differences in distribution and storagecosts, the cost at the pump (excluding taxes)could be very similar. The actual real resourcecost thus depends critically on the local avail-ability of fuel and density of the distribution net-work.14 As far as vehicles are concerned, there isextra cost associated with the CNG engine (orits conversion), the fuel control system, and thefuel tanks. Together these increase the cost of a
48 CITIES ON THE MOVE: A WORLD BANK URBAN TRANSPORT STRATEGY REVIEW
basic vehicle, whether a bus or a car, by up to 30percent.15 The convenience factor is also impor-tant because CNG vehicles lose significantamounts of luggage and passenger space to fueltanks; at low penetration levels, refueling caninvolve some dead-running and can be time-con-suming; vehicle range may be reduced by over50 percent, doubling the refueling frequency.Considering all these factors, international evi-dence suggests that, except for some very heavymileage vehicles, the pump price differencewould need to be about 50 percent of the pro-duction cost of liquid fuels for natural gas to beattractive to users. Hence natural gas would seemto require strong fiscal encouragement if it is tobe more than a niche fuel.
Liquefied petroleum gas (LPG) is a mixture oflight hydrocarbons, mainly propane and butanes.It is easier to distribute and store than CNG,16
and although the octane number of LPG is notas high as that of natural gas, it has excellent anti-knock characteristics allowing dedicated propanevehicles to take advantage of engines with slightlyhigher compression ratios than can be used withgasoline. The limited amount of highly reactivehydrocarbons and the low sulfur content of LPGin comparison with gasoline or diesel are some ofLPG’s good environmental features; it does, how-ever, contain olefins, which are photochemicallyreactive. LPG-powered three-wheelers are com-mercially available in Bangkok, and have alreadyeffectively replaced the old two-stroke gasoline-powered “tuk-tuks.”
The main problems in introducing LPG to thetransport sector are the supply sources and dis-tribution system. Several countries already importsignificant amounts of LPG. India, Pakistan, andSri Lanka, for example, import about 30 to 40 per-cent of their LPG demand. On the distributionside, LPG is stored under pressure both insidethe vehicle and in the refueling tanks. Specialrefueling equipment is needed to transfer thepressurized liquid from storage tanks to the vehi-cle and to ensure that no LPG escapes duringrefueling. As with CNG, the required investments
in LPG distribution and refueling stations havenot been made in most developing countries,and the need for such stations remains a con-straint on widespread LPG use.
Ethanol and methanol. True biofuels (that is, thosewithout substantial fossil fuel use hidden in har-vesting and processing) would give a real reduc-tion in GHG emissions, but these are still elusiveat costs competitive with those of gasoline or diesel.The only long-term effort to promote biofuels fortransport in developing countries, the sugar-ethanolprogram of Brazil, appeared attractive as a meansof saving foreign exchange when oil prices wereat their peak, but has lost most of its attractiveness;the new car market in Brazil is now almost exclu-sively for gasoline vehicles. In any case, manyexperts argue that only alcohol produced from cel-lulose can truly claim a GHG benefit.
Electric vehicles. Electric road vehicles are quietand nonpolluting at their point of use and haveobvious attractions as urban vehicles, whetherpowered directly, as in the case of electric trainsor trolleybuses, or indirectly, as in the case ofsome buses, small vans, and cars. A program forelectric three-wheelers is being undertaken inKathmandu, Nepal (box 4.2). While these havethe lowest environmental impacts at point of use,their overall environmental impact depends onthe way in which electricity is generated andstored, and the disposal problems associatedwith expired batteries, which can be substantial.Whatever that environmental balance, the marketattractiveness of electric-powered transportdepends, as is the case for other fuels, on its eco-nomic attractiveness in terms of overall cost andconvenience. At present the economics of elec-tric vehicles are far from favorable.17
Battery technology is central to the economic suc-cess of battery electric vehicles. Lead-acid bat-teries, currently used in electric vehicles, take 6 to10 hours to slow-charge, emit hydrogen whenrecharging (requiring indoor recharging facilities tobe well ventilated) and still have very limited range.Other battery types are still in the development
TRANSPORT AND THE URBAN ENVIRONMENT 49
stage, and significant efforts are being directedto electric–internal combustion engine hybridsrather than pure electric engine vehicles. The eco-nomics of electric vehicles also depends on theprice of electricity. The power sector in many devel-oping countries is currently undergoing reformand restructuring. The long-term viability of elec-tric vehicles should be evaluated from the stand-point of market-based power pricing. Given thecurrent state of technology, electric vehicles wouldnot be expected to have widespread applications;with carefully considered government interven-tion, however, they could play a useful, thoughlimited, role in extremely polluted traffic corridors.Moreover, the greenhouse characteristics of elec-tric vehicles depend critically on a full fuel cycleanalysis; if the electricity is produced from pres-ent mixes (coal, oil, or gas), there may be no green-house benefit at all compared with a small internalcombustion engine.
Hybrid diesel-electric vehicles are now beingdeveloped with some success and tested inindustrialized countries under a GEF grant. Theircost is similar to that of a heavy CNG vehicle.Onboard diesel engines operated at constant
load to maintain battery power for peak demandsand in sensitive areas can give a 30 percentenergy savings compared with a conventionaldiesel vehicle.
Hydrogen fuel cell. This is a widely advocated“sunrise” technology, at least for heavy-dutyurban vehicles. Fuel-cell buses are already beingused in trial projects, including a program fundedby the United Nations Development Programme.The environmental performance of these vehi-cles—depending on the source of the hydro-gen—can far exceed that of CNG or improveddiesel engines, and their life-cycle operating costsare projected to be lower than that of CNG ordiesel. It is possible that we will see such vehi-cles deployed in active service in urban fleets(buses and urban freight delivery applications) inthe industrialized countries in about a decade. Itis unlikely, however, that they will have early appli-cation in the developing countries.
Influencing fuel consumptionIn industrialized countries technological improve-ments in engine efficiency tended to decreaseboth local and global pollution in the 1970s and
BOX 4.2 ELECTRIC THREE-WHEELERS IN KATHMANDU
In 1993, faced with growing air pollution in Kathmandu, the government of Nepal banned thesale of new diesel three-wheelers imported from India. In the same year, the Kathmandu munic-ipality invited the United States–based Global Resources Institute to design an electric three-wheeler for the city. The pilot vehicle, known as “safa tempo,” was put on the road in September1993, and U.S. Agency for International Development (USAID) support expanded to buy eightvehicles, promote the program, and train mechanics. When USAID funding ended in 1996, two localbusiness groups started assembling, servicing, and operating electric vehicles, which sell for about$6,000. In September 1999 the government finally banned all existing diesel three-wheelers. Thereare now six suppliers of electric vehicles, and as of May 2000, the city has over 500 battery-pow-ered three-wheelers, each capable of carrying up to 12 passengers. This is the world’s largest fleetof electric passenger transport vehicles for use on public roads. The future is not secure, how-ever. In May 2000 the government approved the import of 300 15-seat vans with the same pref-erential import duties accorded to the electric vehicles. In May 2001 it decided to ban new ortransferred registration of all three-wheelers, including safa tempos, although that decision waslater rescinded under pressure from donors.
Source: The Wall Street Journal Europe, May 30, 2000.
50 CITIES ON THE MOVE: A WORLD BANK URBAN TRANSPORT STRATEGY REVIEW
the first half of the 1980s, although effectivereductions in fuel consumption have subse-quently been lost in the United States byincreases in vehicle size. Possibilities for furtherimprovement in new-vehicle fuel economy arisefrom reduction of vehicle size or weight; directfuel injection, lean-burn technology; measuresto increase the share of diesel (which may, how-ever, adversely affect local pollution); and opti-mized engine transmission systems and hybridvehicles. Fuel-consumption standards, such asthe corporate average fuel efficiency (CAFE) stan-dards imposed by the U.S. government and thosemore recently agreed on between Associationdes Constructeurs Européens d’Automobiles(ACEA—the organization of the European motorindustry) and the European Commission, haveattempted to force the pace of technologicalprogress in this respect.18
In developing countries, fuel economy is affectedby what is occurring in the industrialized coun-tries through the availability and cost of importedsecond-hand vehicles, but they also have specialproblems of their own. Fuel economy is often lowbecause of poor vehicle maintenance, fuel adul-teration, and a number of other factors. Usinggasoline with an octane number that is lower thanthat recommended by vehicle manufacturers—either because lower-octane gasoline (for exam-ple, 80 research octane number [RON]) is availableand is less expensive or because gasoline is adul-terated with kerosene—can decrease fuel econ-omy, lead to knocking and ultimately to enginedamage, and to higher emissions. Hence a ratherdifferent focus may be appropriate for policy onfuel economy in developing countries.
The scope for improving fuel economy is great-est in countries where a large fraction of vehicleshave low engine compression ratios. In the newindependent states of the former Soviet Union,many vehicles run on gasoline with a motoroctane number as low as 72. Increasing theoctane and the engine compression ratio willresult in fuel savings—and reductions in GHGemissions—in the long run.
A staged strategy for fuelsThe timing of the development of fuel-cell tech-nology may have a significant part to play instrategic thinking about the alternatives. CNGrequires significant investment in gas production,distribution infrastructure, and vehicles, whichwould only be recouped over a substantialperiod. The incremental cost of cleaning up theperformance of diesel is significantly lower. Exceptin a few cities where the CNG infrastructure isalready in place, it may make more sense, as aninterim strategy, to concentrate on getting thediesel vehicles currently on the road performingwell and cleanly, to gradually reduce sulfur con-tent in diesel fuel, and to bring in cleaner diesel-vehicle technology in new vehicles on the road,while waiting for the cost of fuel cells to becomeviable.19
VEHICLE POLICYEnvironmental issues for vehicles can be dividedinto those relating to improving new-vehicle tech-nology, those relating to replacing the existingstock by more environmentally friendly technol-ogy, particularly with respect to motorcycles, andthose relating to the use of the existing vehiclestock. Although we discuss vehicles and fuelsseparately here, in practice they must be con-sidered simultaneously.
Improving vehicle technologyLargely in response to stricter vehicle emissionsrequirements, considerable progress has alreadybeen made in developing vehicle hardware toreduce emissions. Efficiently operated three-waycatalytic converters can reduce exhaust CO andhydrocarbon emissions of gasoline vehicles byas much as 95 percent and NOx by over 75 per-cent. Similarly, state-of-the-art diesel vehicles thatuse ultra low sulfur diesel fuel and continuouslyregenerating traps can be almost as clean as vehi-cles that use CNG. Such advanced technologiesare unlikely to offer cost-effective solutions invery low income countries in the near future, buttheir existence makes the point—an importantone to keep in mind in formulating incentive poli-cies—that not all diesel vehicles are alike.
TRANSPORT AND THE URBAN ENVIRONMENT 51
The EU, Japan, and the United States lead theworld in setting stringent vehicle emissions stan-dards and fuel specifications. These countries arepursuing the best available technology for fur-ther reducing emissions from new vehicles. Thecontrol measures include a combination of thefollowing: dramatic reduction of sulfur in gaso-line and diesel, to extend the useful life of thecatalyst and to enable new catalyst technologiesfor reducing NOx
20 and particulate emissions;new measures for control of tailpipe emissions(for example, particulate traps with regenerationfor diesel engines); emerging vehicle technolo-gies such as common-rail direct-injection dieselengines; and the use of alternative fuels for verylow emission or zero emission vehicles (as aremandated in California). Although the rest of theworld will probably adopt these standards andtechnologies some day, the issue for developingcountries is how to phase in these measures cost-effectively.
In encouraging the use of catalytic convertersin developing countries, a number of conditionsneed to be satisfied to ensure that they func-tion effectively. These conditions are (a) wideavailability of unleaded gasoline and, prefer-ably, complete phase-out of leaded gasoline,to eliminate the chances of misfueling; (b) dif-ferentiated taxation during the transition periodto prevent misfueling;21 (c) a reasonably low levelof sulfur in gasoline, preferably lower than 500wt ppm; (d) specification of the emissions per-formance levels and the length of time duringwhich the catalyst system must meet thoselevels; and (e) effective inspection and mainte-nance (I/M) to ensure that converters are oper-ating properly. If these conditions cannot befully satisfied, the additional cost associatedwith the installation of converters may not bejustified by the benefits.22 Even where effectiveuse of catalytic converters is considered feasi-ble, governments should consider specifyingemissions levels for new vehicles rather thanmandat ing cata ly t i c conver ters per se .Retrofitting in-use vehicles with catalytic con-verters is not usually considered cost effective.
Options for motorcyclesMotorcycles account for about one-half of thevehicle fleet in many Asian cities (and up to 75percent in some). In many cities motorcycles offersubstantially greater speed and flexibility ofmovement than do inadequate and congestion-bound bus services, while being broadly com-parable to them in cost. In Taiwan, China, theownership is already 0.55 per capita. The major-ity of motorized two- and three-wheelers in Asiaare powered by two-stroke engines, which arepreferred because they have a (now only slightly)lower capital cost than do four-stroke engines,have more power (higher power-to-weight ratio,higher specific output, higher torque, and lowrevolutions per minute response) for a given dis-placement, and are simpler to self-maintain.
Unfortunately, conventional two-stroke enginesare environmentally very damaging because oftheir inherent combustion technology; their poormaintenance and misfiring, particularly at coldstart; and their frequent and excessive use oflubricants not manufactured for use in two-stroke-engine vehicles.23 In Delhi, India, for example,45 percent of particulate emissions and two-thirdsof unburned hydrocarbon emissions in the trans-port sector are estimated to come from two- andthree-wheelers powered by two-stroke engines.Despite this, no country has issued standards forPM (particulate matter) emissions for two- andthree-wheelers, largely because there is noproven methodology for measuring oil droplets(although smoke standards might be used as aproxy standard for two-stroke engines).
The balance of advantage between two-strokeand four-stroke technologies is changing. Thedifference in capital cost is rapidly beingeroded.24 Taking into account differences in fueleconomy and the lower cost of crankcase oil thantwo-stroke oil, the total annual operating cost ofowning and operating a four-stroke can alreadybe lower than that of owning and operating atwo-stroke. Furthermore, the decision of one ofthe major market economies, Taiwan, China, toimpose stringent environmental standards on
52 CITIES ON THE MOVE: A WORLD BANK URBAN TRANSPORT STRATEGY REVIEW
two-stroke motorcycles starting in 2004 is likelyto shift the economies of scale in production infavor of the four-stroke, and to concentrate futuretechnical development on the four-stroke tech-nology. Already, Japanese manufacturers appearto be concentrating their sales efforts on four-strokes, even where two-strokes are still legal.
Basic two-stroke technology can be improved atsource by emissions-reduction technologiesincluding electronic control for fuel metering andimproved scavenging characteristics, or by after-treatment.25 Two-stroke engines manufacturedin India, meeting year 2000 emissions standards,emit very little PM. Unfortunately, the durability ofcatalyst and secondary air systems is limitedbecause of the high concentration of hydrocar-bons in the exhaust gas.26 Retrofitting ofimproved technology is relatively expensive andineffective for this category of small vehicle. It istherefore advisable that governments specifyemissions levels for new vehicles and adopt poli-cies to secure premature replacement for highpolluters, rather than mandate catalytic convert-ers per se. The key is to switch to four-strokeengines.
New technology does not deal with the problemof the high average age and low replacement rateof vehicles currently in use. For these vehicles,emissions on the road are usually much higherthan are emissions levels found during tests, dueto bad operational and maintenance practice.They are estimated to emit more than 10 timesthe amount of fine particulate matter per vehiclekilometer than is a modern car, and only a littleless than a light diesel truck.27 In some countries,such as Bangladesh, low-octane gasoline is used(80 RON, compared with a recommended mini-mum of 87 RON), and gasoline is often adulter-ated with inexpensive kerosene, causing enginemalfunction. It is also common for the proportionof lubricant in the fuel mix to be two to three timesthe recommended level, even though this bothincreases cost and reduces performance.Nevertheless, given the strong current preferencefor the use of two-stroke engines, mandatory
scrappage of existing fleets is likely to be politi-cally difficult. Phasing out more gradually might beachieved by the imposition of differential licensefees, according to technology and location, toencourage more-polluting vehicles to move intorural areas where pollutant concentration is less.The same effect might be achieved by refusingto license high emitters in the cities or limitingthe maximum permissible age of vehicles. Subsidyof environmentally advantageous scrap-and-replace programs might also help. For two-strokevehicles remaining in use, the first step might beto mandate an appropriate lubricant standard.Maintaining the recommended mixtures (2 per-cent oil for two-wheelers and 3 percent for three-wheelers) might be facilitated by the sale ofpremixed fuel. Driver education is an importantsource of improvement in this respect (box 4.3).Improved I/M are also powerful instruments.28
The evidence thus suggests a number of strands ina strategy for addressing the motorcycle problem.
• The information basis for policy needs to beimproved through more systematic meas-urement of ambient air quality, the intro-duction of PM standards for new two-strokes,public information campaigns on fuel mixand vehicle maintenance, identification oflocally cost-efficient retrofit technologies,and the establishment of secure commoninstitutional commitment (police, inspectionagencies, and so on).
• Standards on new motorcycles should beregularly reviewed and progressively tight-ened in the light of technological possibili-ties. This process would be enhanced ifgovernment announced long-term objec-tives with respect to fuel quality and vehicleemissions standards.
• Existing two-stroke performance should beimproved by introducing minimum gasolineoctane requirements (87 RON), mandatingappropriate oil standards, introducing pre-mixed fuel, introducing systematic I/M, andoffering incentives for conversion to cleanfuels for three-wheelers.
TRANSPORT AND THE URBAN ENVIRONMENT 53
• High polluters should be eliminated througha program including the statistical identifi-cation of high-polluting ages and categories,testing followed by improvement to stan-dard or buy-in of nonconforming vehicles,the introduction of tax- or license fee–incen-tives for low polluters in cities, and the reduc-tion of import duties on environmentallybenign vehicles and parts.
Using the existing stock of vehiclesThe share of emissions is not uniformly distrib-uted over the vehicle fleet. A fraction of all vehi-cles—ill maintained, often old—is typicallyresponsible for a disproportionately high amountof pollution from the transport sector. If these“high emitters” (typically, commercial vehiclesand public transport vehicles, including, in someplaces, two- and three-wheeler taxis with two-stroke engines) can be repaired or eliminatedpermanently, a considerable reduction in pollu-tion can be achieved at relatively small cost.
The implementation of such a scheme is far fromsimple. To be cost effective, any scheme target-ing high emitters should identify polluting vehi-cles with high annual vehicle kilometers traveledoperating in densely populated areas. Old vehi-cles in very poor condition may be candidates
for retirement. Those that are highly pollutingbut are better maintained may be considered forrepair or for retrofitting with more recent vehicletechnology. Complicating the issue is the factthat in some cities, such as Cairo, the proportionof old, gross polluters may be very high, with theresult that targeting does not leave very manyvehicles out of the scope.
APPLYING ENVIRONMENTAL STANDARDS To apply environmental standards, it will be nec-essary to design appropriate vehicle inspectionand maintenance programs, scrappage pro-grams, as well as ensure that related policies areappropriate, and provide the correct incentives,including those related to domestic taxation,trade liberalization, and public expenditures.
Inspection and maintenance programsVehicle emissions standards and technologiesare not effective without proper maintenance.Poorly maintained vehicles are high emitters andare responsible for a disproportionate share oftotal vehicle emissions. Data collected in India inNovember to December 1999 during a series ofI/M “clinics” for two-wheelers indicated thatminor vehicle repairs improved fuel economy byan average of 17 percent and reduced CO emis-
BOX 4.3 THE BENEFITS OF INFORMATION: LUBRICATING TWO-STROKES
It is a commonly believed fallacy in some countries that if a little oil is a good thing, more must bebetter. In Dhaka, Bangladesh, many operators of two-stroke three-wheelers use less-expensivestraight mineral oil rather than the recommended two-stroke oil. Because this gives less lubrica-tion, they also tend to use as much as 8 or even 12 percent mix compared with the recommended3 percent for two-stroke oil. Since two-stroke oil cost twice that of mineral oil in June 2000, followingthe recommended procedures would actually give a savings of 25 to 40 percent in oil costs aswell as reduce engine damage and emissions. But bad habits are inbred in a generation of oper-ators and mechanics. To counter such misinformation, training sessions for mechanics and “autoclinics” for three-wheeler taxi drivers were therefore held in 2000 under the Energy SectorManagement Assistance Program. Similarly, in Pakistan, pamphlets containing basic informationon fuel and lubricants have been distributed by the Hydrocarbon Development Institute.
Source: Masami Kojima, World Bank.
54 CITIES ON THE MOVE: A WORLD BANK URBAN TRANSPORT STRATEGY REVIEW
sions by 44 percent. A well-run, uncorrupt I/Mprogram should be able to strengthen theenforcement of emissions standards significantly.
Introducing effective I/M programs has proveddifficult. For example, recent experience inWuhan, China, showed that in roadside testing,93 percent of vehicles fell short of the standardeven though 97 percent of those tested in thesame period at the I/M station met it.29 Thus,wider use of spot-checking equipment capableof identifying major problems from any relevantvehicle type, and of fixed I/M stations for morethorough examination and follow-up of vehiclesso identified, holds promise of significant impacton the pollution problem. An appropriate systemof fines, and controls thereof, could also make
such system self-financing. As far as off-road test-ing is concerned, experience from various partsof the world suggests that an I/M system basedon centralized, high-volume, inspection-only cen-ters with computerized emissions measurementto minimize tampering and corruption, such asthe I/M system in Mexico City, is likely to be moreeffective than is a decentralized system with alarge number of private garages participating inthe I/M. If the proper controls are in place, theprivate sector can be an important partner inoperating effective I/M programs (box 4.4).
The usual reason for not properly maintainingvehicles is to avoid out-of-pocket expenses. Thereare, however, certain maintenance practices thatwould actually yield cost savings. An example is
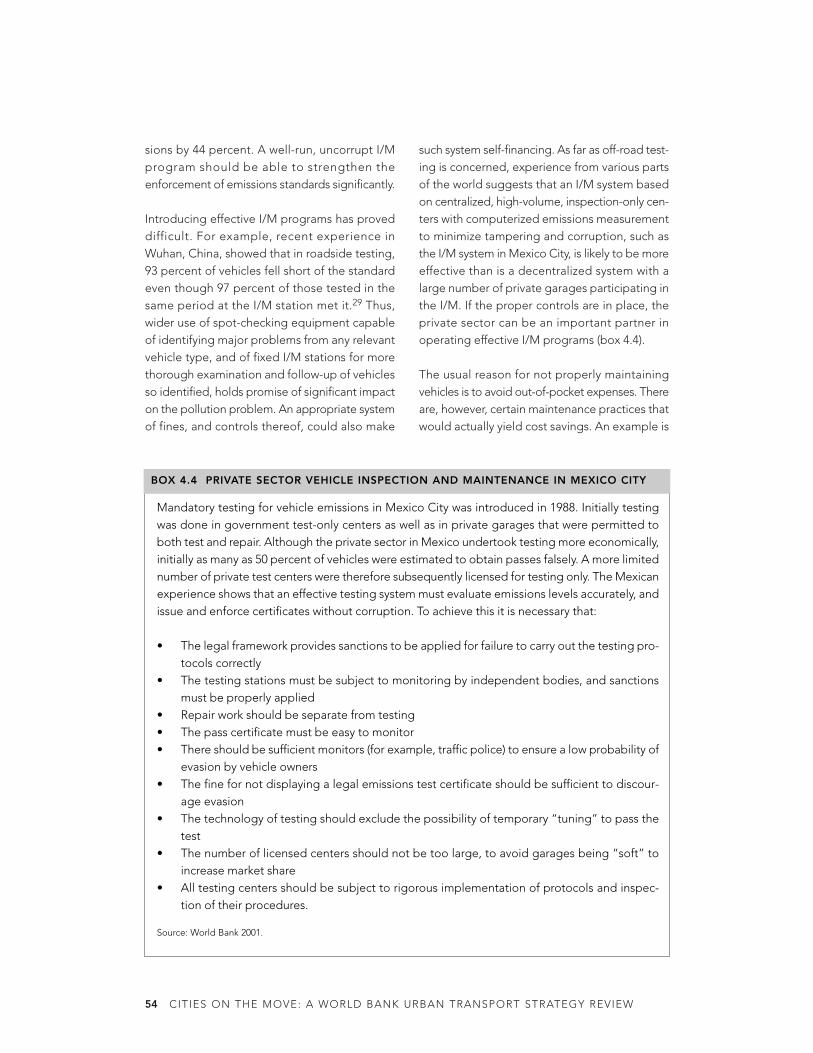
BOX 4.4 PRIVATE SECTOR VEHICLE INSPECTION AND MAINTENANCE IN MEXICO CITY
Mandatory testing for vehicle emissions in Mexico City was introduced in 1988. Initially testingwas done in government test-only centers as well as in private garages that were permitted toboth test and repair. Although the private sector in Mexico undertook testing more economically,initially as many as 50 percent of vehicles were estimated to obtain passes falsely. A more limitednumber of private test centers were therefore subsequently licensed for testing only. The Mexicanexperience shows that an effective testing system must evaluate emissions levels accurately, andissue and enforce certificates without corruption. To achieve this it is necessary that:
• The legal framework provides sanctions to be applied for failure to carry out the testing pro-tocols correctly
• The testing stations must be subject to monitoring by independent bodies, and sanctionsmust be properly applied
• Repair work should be separate from testing• The pass certificate must be easy to monitor • There should be sufficient monitors (for example, traffic police) to ensure a low probability of
evasion by vehicle owners• The fine for not displaying a legal emissions test certificate should be sufficient to discour-
age evasion• The technology of testing should exclude the possibility of temporary “tuning” to pass the
test• The number of licensed centers should not be too large, to avoid garages being “soft” to
increase market share • All testing centers should be subject to rigorous implementation of protocols and inspec-
tion of their procedures.
Source: World Bank 2001.
TRANSPORT AND THE URBAN ENVIRONMENT 55
use of the correct kind and amount of lubricant inthe two-stroke engines that are common in SouthAsia (box 4.3 above). At a minimum, wide publiceducation campaigns should be undertaken topromote cost-effective practices.
Scrappage programsWhen emissions standards are enforced effec-tively, the cost of owning old vehicles actuallyincreases, making vehicle renewal more attrac-tive.30 Vehicle retirement and scrappage pro-grams can further encourage this phenomenonas long as it is possible to identify gross emittersthat are operating at a high annual rate of vehi-cle kilometers and that still have reasonableremaining economic lives. Considerable care isneeded in designing such schemes, however.Using age as a proxy for high emissions does notalways identify the worst cases. If the program isdirected at urban pollution, it must also preventthe import of old vehicles from outside the cityto take advantage of the retirement bonus.Evidence in Europe that may be relevant for someof the higher-income developing countries sug-gests that—because gross emitters are typicallyowned by low-income households that are oftenin no position to purchase much newer vehicles—cash-for-scrappage schemes may be more effec-tive than cash-for-replacement schemes.31 In themost polluted areas, it may even be possible touse cash-for-scrappage schemes to influencemodal split.31
In many developing countries, particularly thosein which particulate emissions are the most seri-ous pollution concern, commercial vehicles(buses, trucks, and taxis) are the greatest con-tributors to urban air pollution. Some countrieshave been quite successful in stimulating earlyreplacement of these vehicles. For example,Hungary offered large cash incentives for replace-ment of old buses and trucks with new vehiclescomplying with most recent emissions standards($3,600 in 1997 dollars for a bus replacement). Inthe early 1990s Chile combined tax incentiveswith preferential treatment of environmentallybenign vehicles in competitively tendered fran-
chising arrangements to remove the most-pol-luting diesel buses from the urban transport fleet.
Domestic taxation policiesThe importance of taxing fuels at a level thatreflects the externalities, as well as the bordercosts and any proxy charges for road mainte-nance costs, was emphasized in a recent WorldBank sector policy paper.33 Although the cost ofmitigating impacts is logically a better founda-tion for defining appropriate levels of environ-mental taxation valuation of damage, theevidence on marginal damage costs of the sixmegacities, quoted above, suggests taxes around60 percent of the import cost of gasoline and 200percent of that of diesel fuel.
These estimates emphasize not only the impor-tance of the absolute levels of fuel taxes andprices but also their relative levels. Around theworld the retail price of diesel is typically lowerthan that of gasoline, because of differential tax-ation. The trend is particularly pronounced inSouth Asia. In Bangladesh, for example, the retailprice of gasoline was almost double the price ofdiesel in 1999. The price differential, togetherwith the low profit margin fixed by the govern-ment for the sale of gasoline, has led to the adul-teration of gasoline with kerosene and, as anunintended consequence, higher particulateemissions from vehicles. In Pakistan, where theprice difference is even higher, the diesel-gaso-line ratio consumed in the transport reached 5.3to 1 in fiscal 1999/2000, which is very high by inter-national standards. Relative tax rates may thusbe encouraging the highest-mileage urban vehi-cles (taxis, mini-buses, and so on) to switch fromgasoline—not to CNG or other clean fuels butto diesel, the fuel with the most damaging urbanenvironmental impacts. A large price differentialbetween kerosene and gasoline, based on theuse of kerosene by the poor as a domestic heat-ing fuel, leads to illegal addition of kerosene togasoline, resulting in higher pollutant emissions.
The usual reason for low tax rates on diesel is itsuse for heavy interurban freight movement and
56 CITIES ON THE MOVE: A WORLD BANK URBAN TRANSPORT STRATEGY REVIEW
agricultural purposes. Given that the healthimpact of particulate emissions is likely to belower in low-density interurban and rural areasthan in cities, the emphasis on the economicrather than the environmental impact of dieselfueling outside urban areas may not be unrea-sonable. Hence it is necessary to develop taxstructures that protect the urban environmentbut that do not discourage use of the most eco-nomical fuel by agriculture or intercity freightvehicles. One possible way of doing that is toidentify the most damaging vehicle types (cars,urban mini-buses, and vans) and use high dutieson those types of diesel vehicle, rather than fueltaxation, as the means of changing the balanceof economic advantage. That is already beingdone in some countries by exempting clean vehi-cles from import duties or vehicle license duties.Another option is to increase the tax on dieselto make the price of automotive diesel compa-rable to that of gasoline, but to rebate industrialand agricultural users of diesel. This approachhas been adopted successfully in Chile. Anotheris to tax automotive diesel more and use a dyeto distinguish automotive diesel from diesel forother uses.
Setting relative tax levels is a complex issue. Inprinciple, one should identify the emissions valuesof different pollutants and structure vehicle andfuel taxes to reflect differences in the summedvalue of emissions for different vehicle types. Inpractice, however, emissions levels depend notonly on the fuel type and composition but alsoon where and how it is burned. Moreover, the evi-dence on the health costs of different pollutantsremains sketchy. At best, then, the use of fiscalincentives would be somewhat rough and ready.Nevertheless, on the basis of successful applica-tion of fiscal incentives in industrialized countries,it is possible to confidently recommend differen-tiation of excise taxes between leaded andunleaded gasoline, and between diesel and CNG.
Tax structures that discourage the purchase ofnew vehicles—for example, registration fees orexcise taxes based on the market value of the
vehicle—may have adverse environmentalimpacts that should be weighed against theirperceived distribution effects. Possible measuresinclude replacing import tariffs on new vehicles byownership taxes reflecting the environmentalquality of the vehicle, eliminating the systemunder which vehicle registration fees are pro-portional to the book value of the vehicle (whichmakes it more expensive to own new vehiclesthan old ones), and minimizing the tax on thepurchase of new vehicles. The fiscal impact ofthese changes might need to be offset by anincrease in direct charges for road use. In somemiddle-income countries, it may be necessary toconsider a safety net to offset the immediateimpact of making it more costly for the poor tooperate old vehicles, particularly in the taxi trade.
Trade liberalizationIt is common for developing countries to use tar-iffs or trade barriers to protect domestic indus-try and to prevent the expenditure of scarceforeign exchange on luxury goods that are notessential to economic growth. Where either ofthese arguments is applied to the import of vehi-cles, the effect is likely to be the protection ofoutdated technology. Liberalization of vehicletrade is hence an important step, particularly incountries that have automobile-manufacturingfacilities. The removal of barriers that hinderaccess to the technology available in the rest ofthe world would enable consumers in these coun-tries to meet tighter emissions standards at leastcost. Rules such as local content requirements(for example, requiring that 70 percent of thevehicle weight or content must be produceddomestically) often result in inefficiency and inheavier vehicles if the percentage is based onweight. High import tariffs on new vehicles, rigidlicensing schemes for imports, and quotas are alllikely to slow the rate of vehicle renewal, withpotentially adverse impacts on air quality (pollu-tion); their distributional impact must thereforebe weighed against their environmental effects.
Free trade in used cars raises the question of“environmental dumping.” Among the largest
TRANSPORT AND THE URBAN ENVIRONMENT 57
recipient markets for used cars are Cyprus,Jamaica, Peru, Sri Lanka, and the RussianFederation, while Japan remains the largest iden-tifiable single source of used-car exports. Theforces driving the export of used cars by indus-trialized countries will become stronger as emis-sions standards become more stringent andregulations concerning the end-of-life vehicle areimplemented, as in the EU.
In the interest of environmental protection, thegovernment may limit the age of the vehiclesthat may be imported. For example, Hungaryset the age limit to 10 years old in 1991 and pro-gressively reduced it to 8, 6, and finally in 1997,4 years old. Chile bans imports of used vehiclesaltogether. However, the purchasing pattern ofvehicle owners should be carefully balancedagainst the hypothetical environmental advan-tage of restricting the import of old vehicles. Ifcommercial operators (and, in some of the tran-sition economies, low-income households) arein no position to buy relatively new vehicles, suchan import restriction constrains the supply, andincreases the price of replacement vehicles, post-poning the replacement of high emitters.However, a combination of higher general taxa-tion on motoring and environmental standardson vehicles is always likely to reconcile restrainton car use with environmental protection betterthan discriminatory import taxation.
Transport fuel is also an internationally tradedcommodity. Having an open border and beingable to take advantage of superior fuels manu-factured in other countries makes it much easierto phase lead out of gasoline and to implementother fuel-quality improvement measures. Insome parts of the world, there is a move towardharmonizing fuel specifications to ensure mini-mal environmental standards, foster intrare-gional trade, and enhance the efficiency ofsupply. Fuel specifications in North America, theEU, and the countries of the former Soviet Unionare already harmonized, for the most part.Similar measures have been proposed in LatinAmerica.34
Public expenditure policiesThe traditional role of public sector expenditurein addressing environmental externalities cen-ters on the provision of classic public goods.These public goods include (a) maintenance ofan emissions inventory and (b) setting andenforcement of standards, including establish-ing I/M arrangements (even if these arrangementsare implemented by the private sector).
Environmental benefits are often attributed topublic transport subsidies because of modaltransfers from car to bus, or from bus to rail.Generally, these arguments should be treatedcautiously for two reasons. First, the “preferred”modes only yield benefits if they are well patron-ized. Poorly loaded buses are more environ-mentally damaging than are well-loaded cars.Second, the environmental benefit only accruesif the subsidized modes draw their patronagefrom an environmentally inferior mode, ratherthan from new trip generation. In the case ofcar–public transport transfers, the evidence isthat the cross-elasticity of demand between cardriving and public transport is low. In the case ofrail-bus transfers, which are the most common,the problems concern the financial and economiccost of securing the transfers. It is therefore wiseto draw a cautious conclusion: not that it is impos-sible to secure environmental benefit from publictransport subsidies, but that subsidy alone mightbe an inefficient means of securing that environ-mental benefit. Public transport subsidy is bestaddressed in the much wider context of improv-ing congestion and distribution, as well as in thecontext of environmental benefits. Other forms ofenvironmentally focused subsidy can representbetter value for money. As argued above, well-targeted support of premature retirement of environmentally damaging vehicles or fuel con-versions is much more likely to yield high bene-fits-per-dollar committed.
There is, of course, much more to public expen-diture decisions. Giving priority to infrastructurefor public transport and NMT may be more effec-tive in changing modal choice than may subsidies,
58 CITIES ON THE MOVE: A WORLD BANK URBAN TRANSPORT STRATEGY REVIEW
and may also be more consistent with the generalpoverty reduction strategy of poorer countries.
SYSTEM MANAGEMENT POLICIESSystem management policies to reduce the envi-ronmental impact of urban traffic can be dividedinto three categories. These categories are (a)those giving priority to less-polluting modes, (b)those relieving the impact by allowing traffic toperform in a more environmentally friendly way,and (c) those relieving the impact by reducingtraffic volumes.
Public transport prioritiesIn developing countries, buses are often the trans-port mode of choice for the poor, but they arefrequently highly polluting because of the manystops and starts and idle running of engines inheavy traffic. Giving priority to buses not onlyreduces their direct environmental impact butalso improves their attractiveness with respect tothe private car. It also improves their finances.The construction of separated busways, as hasbeen done in several Brazilian cities, or even ahighly integrated priority bus network, as inCuritiba, appears capable of affecting car own-ership and, more significantly, car use. It is stilldoubtful how far good bus services by themselvescan defer or deter motorization. The case for buspriorities will thus be a combination of economic,distributional, and environmental considerations.
In this context it is appropriate to consider theconcern that economic liberalization of transportoperations will have adverse environmental con-sequences. In road haulage, where liberalizationis best established, it has usually increased bothaverage vehicle size and load factor. As long asthis is accompanied by adequate enforcementof emissions standards, the effect should be ben-eficial rather than harmful. In the bus industry theopposite appears to have happened, with bothaverage vehicle size and load per vehicle falling,often in the context of poor environmentalenforcement. In the absence of a well-function-ing regulatory system, complete liberalization of
bus services, such as has occurred in Mexico Cityand Lima, has clearly increased environmentalpollution. That outcome is not inevitable, how-ever. For example, faced with this effect inSantiago, the Chilean government successfullyintroduced competition “for the market,” in theform of a competitively tendered franchisingsystem using environmental quality of the vehicleas one of the selection criteria. This highlightsthe importance of concentrating on regulatoryreform, rather than simple deregulation; this isdiscussed further in chapter 7.
Traffic managementTraffic congestion reduces average speed andincreases most emissions (except for NOx). Trafficcongestion worsens the emissions of both localand global pollutants. Increasing the averagespeed in city traffic from 10 kilometers per hour(km/h) to 20 km/h could cut CO2 emissions bynearly 40 percent. Increasing vehicle speed from12 to 15 km/h to 30 km/h in Bangkok and KualaLumpur was estimated to be equivalent toinstalling three-way catalytic converters in 50 per-cent of the cars in these cities. Experience sug-gests, however, that though it is possible toreduce congestion in the short run, this favorableresult invites greater car use in the long run, thusultimately resulting in further congestion. Studieshave shown that measures to decrease traffic con-gestion by providing more road space eventu-ally increase the volume of traffic.35
More subtle forms of traffic management may beable to reduce unit emissions rates without gen-erating extra traffic to negate the benefit.Coordination of traffic lights is generally benefi-cial. Traffic-calming devices, which slow trafficdown but do not stop it, may also result in cleaner,as well as safer, traffic. Good signage can pre-vent excessive “hunting” movements for scarceparking space.
Traffic restraintIn the industrial economies, demand for morespace in lower-density settlement, and the vehi-
TRANSPORT AND THE URBAN ENVIRONMENT 59
cle ownership and use associated with it, haveall proved income elastic, while at high incomesand low motoring costs, the price elasticity ofdemand for car travel has been low. Increasedvehicle fleet and mileage may therefore appearinevitable as economies develop. The politicalfeasibility of denying those economic character-istics has also been widely doubted.
In some of the world’s most congested and pol-luted cities, politicians are reassessing that con-servative judgment; some quite direct attackson vehicle use have been recently made for envi-ronmental reasons. Exclusion of some vehicles,selected by registration numbers from all roadson particular days, as in the “hoy no circula” (“donot drive today”) scheme, first imposed inMexico City in 1989 and subsequently copied inother cities, such as São Paulo, can result in dra-matic reductions in traffic volume during the firstmonths of implementation. In the longer term,however, the schemes may be counterproduc-tive because some households purchase an addi-tional vehicle or retain an old and pollutingvehicle that would have otherwise been replaced,in order to avoid the effect of the restrictions.The most recent variant of this strategy, the “picoy placa” (“peak-hour restrictions by license platenumber”) scheme in Bogotá, applies only topeak hours, but increases to two the number ofdays per week on which each vehicle is kept offthe road.
Further focusing restraint to exclude all vehiclesfrom particularly sensitive areas (such as pedes-trian-only city shopping centers or residentialareas) is now adopted in many countries, and isincreasingly being provided for in initial planningof new development. When first introduced itwas believed that this type of measure wouldreduce trade in the controlled areas and hence beresisted by traders. In actuality, however, itappears not to have had that effect and, whenassociated with good planning of preferentialpublic transport access, can reduce private roadtraffic over a broader area.
For the broadest impacts, economic instrumentsstill look the most promising. The World Bankenergy sector strategy argues that it should bethe objective for all countries to integrate localenvironmental and social externality costs intoenergy pricing and investment decisions.36 Theextreme case is that of Singapore, where verystrong political action to limit the stock of cars tothat deemed sustainable has been implementedthrough the auctioning of a controlled stock ofcertificates to purchase vehicles as well as by con-gestion pricing in the CBD and some of its majorfreeway accesses.37 The existence of a singlejurisdiction with the ability to use the revenuesfrom vehicle taxation to finance other support-ing elements of a comprehensive policy seemsimportant to that case. Perhaps equally signifi-cant, in the United Kingdom the legal provisionof revenues from congestion pricing to accrue tothe local authority introducing it has been thebasis for the development of new enthusiasm forthe pricing device from business as well as envi-ronmental interests.
In some industrialized countries, studies also indi-cate that, in the long run, own-price elasticity forgasoline consumption is significant enough tomake fuel taxation a potential policy instrumentfor reducing vehicle usage and kilometers trav-eled. A World Bank study concluded that a judi-cious use of gasoline tax could save the citizensof Mexico City $110 million a year more thanwould an otherwise well-designed control pro-gram with no gasoline tax.38 This might be accen-tuated by converting some of the other costs ofownership (such as insurance, parking, and vehi-cle taxation) into costs of use, although in manydeveloping countries these charges are low andoften evaded.
NMT modes are the least polluting of all modes,as well as often being the less expensive for short-distance movements. The elimination of imped-iments to NMT thus has environmental benefits,in addition to the poverty focus advantages dis-cussed in chapter 8.
60 CITIES ON THE MOVE: A WORLD BANK URBAN TRANSPORT STRATEGY REVIEW
CONCLUSIONS: A STRATEGY FOR URBAN TRANSPORT AND ENVIRONMENT
A number of strong conclusions arise from theabove discussion of strategic priorities.
On basic knowledgeBetter basic understanding both improves policyidentification and helps to persuade decision-makers to implement the policies:
• Local data collection and analysis on vehi-cle registrations and on levels and sourcesof ambient air pollution
• Development of better understanding of thehealth impacts of different small particulateemissions from transport (although thisdevelopment may be better left to the indus-trialized countries)
• Dissemination of basic knowledge on envi-ronmental impacts of transport modes (forexample, optimal oil/fuel mix for two-strokegasoline engines)
• Education campaigns on efficient vehicleoperation, maintenance, and so on.
On technological priorities While it is generally preferable to concentrate onperformance standards, rather than on specifictechnology preference, there are some relativelyclear-cut technological priorities:
• Elimination of lead from gasoline • Replacement of two-stroke by four-stroke
motorcycles • Elimination or cleaning up of high-mileage,
heavily polluting vehicles; the Bank can helpboth with technical assistance in these fieldsand, in some cases, with the financing ofpublic infrastructure and incentive mecha-nisms to stimulate change
• Introduction of computerized I/M regimesadministered by centralized, private sectorcontractors, subject to scrutiny to preventcorruption, and targeted initially at old andhigh-polluting vehicle categories.
On managing transport demand Technological and fiscal measures must be com-plemented by a coherent transport managementstrategy lest increasing traffic volumes swampthe beneficial effects of other measures. Thiswould include:
• Public transport investment programs,including improved conditions for walkingand cycling
• Traffic management, including rigorouslyenforced priorities for public transport in con-gested and environmentally sensitive areas
• Traffic-calming and other measures ofdemand management.
On incentive systemsBecause most critical decisions about travelbehavior are made by individuals, and are largelydriven by economic self-interest, tax levels andstructures are often decisive in determining theamount of transport undertaken, choice of mode,technology, and fuel. This emphasizes:
• Tax reform both to restrain demand fortransport to an efficient and environmentallyacceptable level and to generate efficientincentives in the choice of vehicle and fueltype, size of vehicle, and location and timingof vehicle use
• Exploration of ways to overcome limitationsof fiscal measures associated with multiplesectors and multiple objectives.
On institutionsBecause there are multiple pollutants and multi-ple types of ambient conditions, comprehensive,multi-instrument packages need to be tailored tospecific local circumstances. This requires:
• Assessment of environmental impacts as anintegral part of transport and land-use struc-ture planning
• Development of technical competence andprobity in administration as an essential pre-requisite for effective action, because of thecomplexity of these packages
TRANSPORT AND THE URBAN ENVIRONMENT 61
• Development of concerted action betweenjurisdictions and tiers of government.
The Bank can help to identify and focus on majorpolluters, and can help in the internationalexchange of experience in designing integratedurban environmental strategies. Moreover, inte-gration of transport interventions in generalmunicipal development packages may offerbetter leverage than transport-specific projects,as cities seek to reduce pollution.
NOTES
1. IPCC 1996.2. Lvovsky and others 2000. 3. Schipper and Marie-Lilliu 1999.4. Eskeland and Xie 1998.5. Eskeland and Devarajan 1996.6. For technological detail of the issues
involved, see Kojima and Lovei 2001.7. The advisory board to the U.S. National
Toxicology Program has recommended thatdiesel exhaust particles be listed as “reasonablyanticipated to be a human carcinogen.”
8. Recent studies have found a significant inde-pendent effect on premature mortality for ozoneif the important nonlinear effects of temperature(and humidity) are taken into account (Holgateand others 1999).
9. Ideally, a comprehensive urban air strategypolicy should involve the systematic collectionof air quality data and identification of majorsources contributing to the pollutants of concern.Source apportionment analysis, emissions inven-torization coupled with dispersion modeling, canbe carried out to identify which sources shouldbe targeted for control. These steps will thenenable comparison of costs and benefits of dif-ferent identified measures for improving air qual-ity, and to identify priority actions (Kojima andLovei 2001).10. Lovei 1996.11. Sulfur in diesel was lowered to 0.05 weightpercent (500 parts per million by weight, wt ppm)in 1993 in the United States and in 1996 in Europe
to meet new standards for particulate emissions.This move came after a number of vehicle tech-nology measures had substantially lowered thecarbonaceous contribution to particulate emis-sions.12. In the Uni ted States the Ai r Qual i tyImprovement Research Program of 1989–95found that high-emitting, poorly maintained vehi-cles contributed about 80 percent of total vehi-cle emissions but represented only about 20percent of the population. Improving fuel qual-ity decreased emissions somewhat but not nearlyas much as changing vehicle technology (forexample, by identifying and repairing old vehi-cles). Similarly, the European Programme onEmissions, Fuels and Engine Technologies foundthat the spread in emissions levels related to vehi-cle technologies was wider than the variationsattributable to fuels.13. In comparison with a modern, catalyzedgasoline car, a CNG-fueled car of equivalentsize has been estimated to emit approximately10 to 20 percent less CO2 and particulates pervehicle kilometer, up to 25 percent less NOx,and 80 percent less CO, nonmethane hydro-carbons, and other smog-forming emissions.For buses, compared with diesel 80S Euro 2 bus,a lean-burn CNG bus has an advantage in allthe major pollutants, including a 20 percentadvantage in global warming gases and an 85percent advantage in particulates, despite thefact that the modern clean diesel bus emits onlyone-quarter of the NOx and one-eighth the par-ticulates of the diesel bus of 1990. The stoi-chiometric CNG bus has a smaller advantageover diesel in CO and CO2 (only 10 percent) thanthe lean-burn version, but an even greateradvantage in NOx. For a fuller discussion andsources of statistics quoted here, see Gwilliam2000a.14. For example, transportation and distributiondouble the wellhead price for a refueling stationon the Atlantic coast of Colombia, but give a sta-tion cost five times the wellhead price for the cen-tral zone, where the distribution network is only20 percent utilized. The real economic cost is thuslowest in urban areas close to the gas fields.
62 CITIES ON THE MOVE: A WORLD BANK URBAN TRANSPORT STRATEGY REVIEW
15. For example, for the barest 12-meter low-floor bus, the extra cost of a CNG vehicle mightbe $30,000 on a price of $120,000. For the moresophisticated vehicles used in urban transport inthe U.S. and Western Europe, the basic costmight be twice that, while the incremental costof CNG would not increase proportionately. Thatmight be reduced by international unification ofregulations for homologation and safety, andeventually through scale economies in OEM. Indeveloping countries retrofitting is the norm, asthe conversion of existing vehicles may be lessexpensive, even in the long run, than prematurereplacement by dedicated new vehicles.16. LPG requires pressures ranging from 4 to 13bar, compared with 200 bar for CNG.17. At present the weight of available lead/acidbatteries is likely to account for nearly 40 percentof the vehicle mass, limiting speed to about 40km/h and range to about 55 kilometers. The costof eight batteries and additional modificationsrequired for a three-wheeler is about $1,000,which doubles the price of electric comparedwith two-stroke gasoline three-wheelers. Whilebattery technologies under development (Ni MHor Lithium Ion) may raise achievable speeds toover 50 km/h and range to over 100 kilometers,these performance levels are still much inferiorto those of existing technologies.18. ACEA (the organization of the Europeanmotor industry) and the European Commissionhave agreed that average CO2 emissions fromnew cars will be reduced by one-quarter com-pared with current levels, to 140 grams per kilo-meter by 2008. 19. For further guidance on selection of tech-nology, see TRB 1998a.20. Nitrogen oxides (NOx) are formed duringcombustion as nitrogen in the air reacts withoxygen at high temperatures. The amount of NOx
formed can be reduced by controlling the peakcombustion temperature (for example, by recir-culating exhaust gas in vehicles), by reducing theamount of oxygen available during combustion,or by converting NOx to nitrogen and oxygen-containing inorganic compounds after its for-
mation (for example, by installing three-way cat-alytic converters for gasoline engines).21. Many countries have made effective use ofdifferentiated taxation—taxing leaded gasolinemore than unleaded gasoline—to encouragethe use of unleaded gasoline and prevent theuse of leaded gasoline in cars equipped withcatalytic converters. In the absence of such afiscal policy, control programs need to be in placeto prevent permanent deactivation of catalyticconverters on a large scale as a result of misfu-eling. The effectiveness of differentiated taxa-tion depends on the extent to which fuelquality—in this case, leaded versus unleadedgasoline—is enforced.22. Unfortunately, there are many examples ofuncoordinated policies. In one country the gov-ernment is proposing mandatory installation ofcatalytic converters in heavy-duty diesel vehicleswithout taking measures to lower the sulfur levelin diesel (currently 0.7 weight percent, or 7,000parts per million by weight [wt ppm]). At such ahigh sulfur level, the life of the catalyst will beshortened, and the oxidation catalyst will merelyoxidize sulfur completely to SO3 (and sulfate par-ticulate matter will form), thereby significantlyincreasing particulate emissions. In another coun-try the government mandated catalytic convert-ers in passenger cars without specifying theemissions levels to be met—an omission thatcould defeat the purpose of the new require-ment. In other cases, catalytic converters havebeen mandated without a reliable system of pro-viding unleaded gasoline.23. Kojima, Brandon, and Shah 2000.24. For example, in June 2000 the current pricesof three-wheelers from an ex-showroom in Delhi,inclusive of all state and local taxes, are Rs. 66,500(US$1,359) for a two-stroke vehicle and Rs. 70,500(US$1,440) for the four-stroke equivalent. In July2001 no difference was discernible in the aver-age price of equivalent two-stroke and four-strokemachines.25. Typically consisting of a catalyst to oxidizeHC (hydrocarbon) and CO, and secondary air toassist conversion.
TRANSPORT AND THE URBAN ENVIRONMENT 63
26. The durability standard for catalytic con-verters in Taiwan, China, is still only 15,000 kilo-meters, although in 2000 the Society of IndianAutomobile Manufactures offered to give a war-ranty of 30,000 kilometers for all two- and three-wheeler vehicles fitted with catalytic converters.Even this is only one year’s life for a typical three-wheeler in commercial use.27. Weaver and Chan 1996.28. In a recent U.S. Agency for InternationalDevelopment (USAID)–financed program, theSociety of Indian Automotive Manufacturesundertook free emissions tests for 65,000 partic-ipants in 12 locations over a three-week period.Vehicles failing the test were given a free mechan-ical check involving carburetor adjustment, sparkplug cleaning and adjustment, and air filter clean-ing. As a result of this minor maintenance, emis-sions of HC (hydrocarbons) were reduced by 30.9percent and those of CO by 59.7 percent.29. Roth 1996.30. Empirical evidence from Spain suggests thatchanges in the I/M program may have had con-siderable effects on trends in first-time vehicleregistration (European Conference of Ministersof Transport 1999a).31. European Conference of Ministers ofTransport 1999a.32. In a pilot program implemented in 1996 inBritish Columbia, Canada, owners were offeredthe choice of cash or a one-year free transit pass(worth about 1,000 Canadian dollars) on the localpublic transport network, to replace vehicles ofmodel year 1983 or older. Fifty-two percent ofthe owners participating in the program chosethe second option.
33. World Bank 1996.34. There is a tradeoff between harmonizingfuel specifications and setting site-specific fuelstandards. Ideally, provided that the distributionsystem can handle segregation of different fuels,cleaner (and costlier to produce) transport fuelsshould be used in large cities, and fuels with less-stringent specifications should only be used inareas outside urban centers. Leakages and otherenforcement problems, as well as the logisticsof delivering fuels of different qualities to dif-ferent depots, make it difficult to implementregional differentiation cost effectively. Countriesthat import the bulk of their transport fuels typ-ically find it easier to harmonize with neighbor-ing countries than with countries that havedomestic refineries. Trade considerations(between Canada and the United States, withinCentral America, and within the European Union[EU]) are a strong driving force for harmonizingfuel specifications. In the case of developingcountries, harmonizing fuel specifications withNorth America or the EU is most unlikely to becost effective.35. The U.S. Environmental Protection Agencysuggests that up to one-half of the annual U.S.traffic growth of 2.7 percent could be a result ofconstruction of added road capacity, while areport of the British Standing Committee on TrunkRoad Assessment in 1994 concluded that increas-ing the capacity of the road network eased con-gestion only temporarily because of additionalgenerated traffic (Sactra 1994).36. World Bank 1998.37. Willoughby 2000b.38. Eskeland and Devarajan 1996.