Instructions for the completion of Section 1 are given on Page 02 of your question and answer booklet X707/77/01.
Record your answers on the answer grid on Page 03 of your question and answer booklet.
Before leaving the examination room you must give your question and answer booklet to the Invigilator; if you do not, you may lose all the marks for this paper.
X707/77/02 BiologySection 1 — Questions
TUESDAY, 23 MAY
9:00 AM – 11:30 AM
A/HTP
Page 02
SECTION 1 — 25 marks
Attempt ALL questions
1. Trypan blue is used as a vital stain to identify viable cells when viewed in a haemocytometer.
A vital stain
A stains all cells
B only stains dead cells
C only stains living cells
D only stains the culture medium.
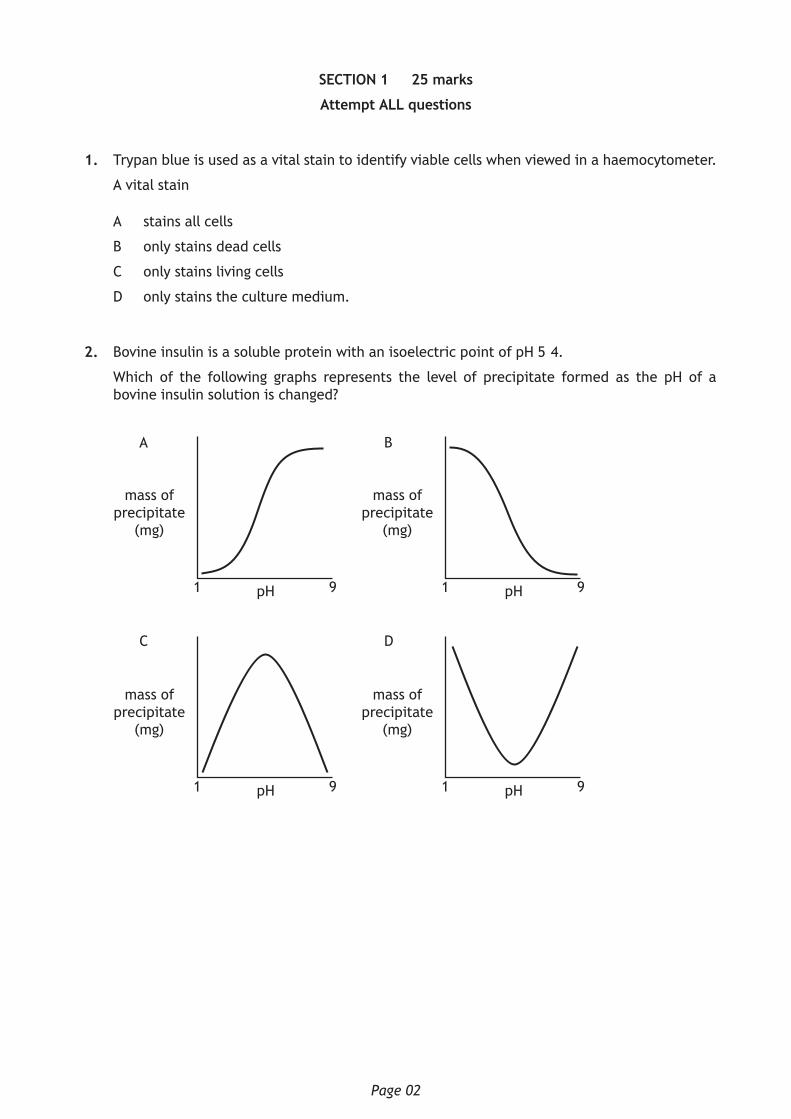
2. Bovine insulin is a soluble protein with an isoelectric point of pH 5·4.
Which of the following graphs represents the level of precipitate formed as the pH of a bovine insulin solution is changed?
9 9
9 9
1 1
1 1
pH pH
pH pH
mass ofprecipitate
(mg)
mass ofprecipitate
(mg)
mass ofprecipitate
(mg)
mass ofprecipitate
(mg)
C
A B
D
Page 03
3. The figure shows how a scientist used serial dilution followed by plating to check the number of bacteria in a stock culture.
0∙1 cm3 transferred toagar plate followed byincubation for 2 days
9∙0 cm3
119 colonies
1∙0 cm3 1∙0 cm3 1∙0 cm3 1∙0 cm3
Bacterial stock
How many bacteria were there in 1 cm3 of the original bacterial stock?
A 1·19 × 105
B 1·19 × 106
C 1·19 × 107
D 1·19 × 108
4. Place the following events for a sodium potassium pump into the correct sequence.
1 Phosphorylation
2 Potassium ions released into cell
3 Transporter protein has high affinity for sodium ions inside the cell
4 Dephosphorylation
A 2, 1, 4, 3
B 3, 4, 2, 1
C 2, 1, 3, 4
D 3, 1, 4, 2
[Turn over
Page 04
5. The binding of oxygen to haemoglobin is affected by small changes in temperature or pH.
Which of the following changes would decrease haemoglobin’s affinity for oxygen?
A increased temperature, decreased pH
B increased temperature, increased pH
C decreased temperature, decreased pH
D decreased temperature, increased pH
6. The gene represented in the diagram codes for multiple proteins due to alternative RNA splicing.
The coding regions (exons) are labelled 1 to 10.
1 2 3 4 5 6 7 8 9 10
Alternative RNA splicing results in an mRNA that contains exon 2 or 3, exon 4, 5 or 6 and exon 7 or 8.
Predict the total number of different proteins that can be produced from this gene.
A 3
B 7
C 12
D 15
Page 05
7. In an immunoassay used to detect the presence of an antigen for a disease-causing organism (pathogen), the following samples were tested.
1 A sample from an individual thought to be infected with the pathogen.
2 A sample from an organism known to cause similar symptoms, but unrelated to the pathogen.
3 A sample from the pathogen.
4 A sample of purified water.
Which row in the table identifies the purpose of each sample?
Positive control Negative control Test assay
A 3 4 2
B 3 2 1
C 2 4 3
D 2 3 1
8. Which of the following diagrams represents the sequence of phases involved in the cell cycle?
M G2
G2 S
G2 S
M G2
G1 G1
G1 G1
S M
S M
B
C D
A
[Turn over
Page 06
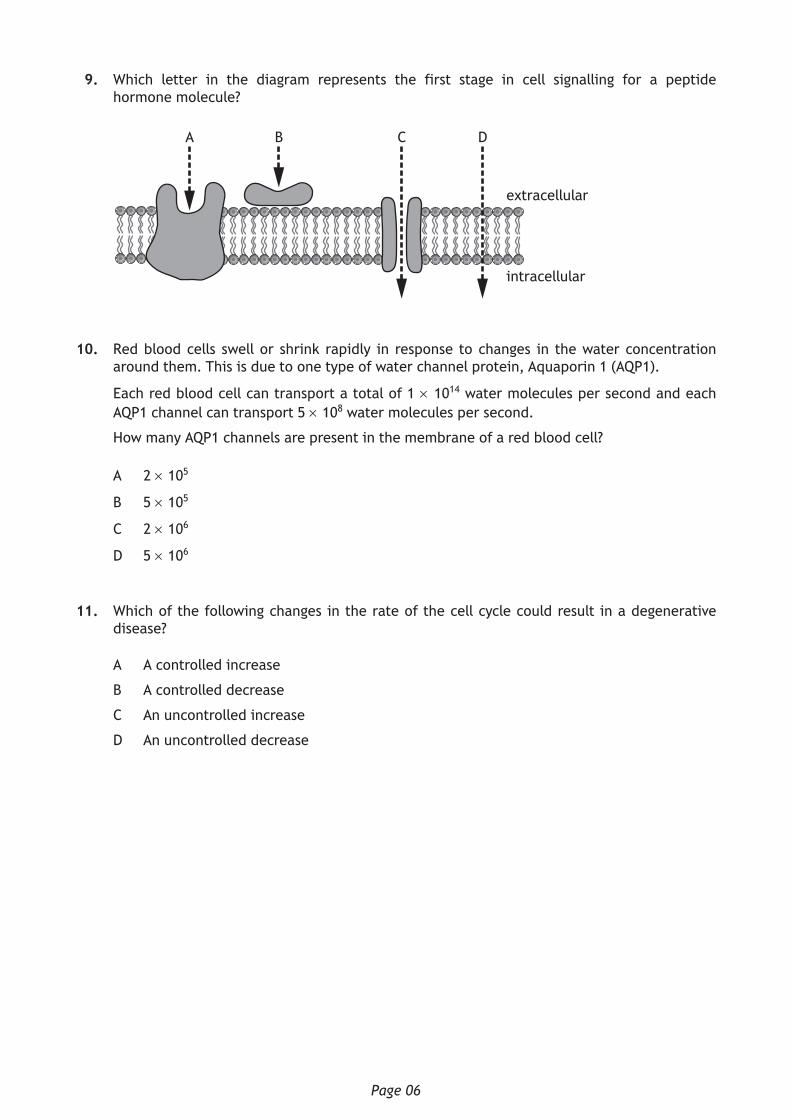
9. Which letter in the diagram represents the first stage in cell signalling for a peptide hormone molecule?
C DBA
extracellular
intracellular
10. Red blood cells swell or shrink rapidly in response to changes in the water concentration around them. This is due to one type of water channel protein, Aquaporin 1 (AQP1).
Each red blood cell can transport a total of 1 × 10¹⁴ water molecules per second and each AQP1 channel can transport 5 × 10⁸ water molecules per second.
How many AQP1 channels are present in the membrane of a red blood cell?
A 2 × 10⁵
B 5 × 10⁵
C 2 × 10⁶
D 5 × 10⁶
11. Which of the following changes in the rate of the cell cycle could result in a degenerative disease?
A A controlled increase
B A controlled decrease
C An uncontrolled increase
D An uncontrolled decrease
Page 07
12. Which of the following diagrams represents the sequence of stages involved in mitosis?
Telophase Prophase
Prophase Anaphase
Anaphase Metaphase
Anaphase Prophase
Metaphase Anaphase
Metaphase Telophase
Prophase Telophase
Telophase Metaphase
C
BA
D
13. Bacteriophage M13 is a virus that can infect bacteria. When bacteria in the lab are infected with M13, it is essential to use the correct ratio of one virus particle to two bacterial cells.
A 0·25 cm3 sample of an E. coli culture having a concentration of 8 × 10⁸ cells per cm3 is placed into a tube.
What volume of a bacteriophage stock having a concentration of 2 × 10⁹ bacteriophage per cm3 should be added to the cell sample to give a bacteriophage to bacteria ratio of 1:2?
A 0·05 cm3
B 0·2 cm3
C 5 cm3
D 20 cm3
[Turn over
Page 08
14. A student planned to measure the activity of catalase by using an oxygen probe to measure oxygen production. As part of their pilot study, the student used a standard sample with an oxygen concentration of 22·00% to test the accuracy and precision of the probe.
Four readings of the standard sample were taken and the results obtained are shown in the table.
Reading
1 2 3 4
Oxygen concentration (%) 20·94 20·93 20·93 20·94
The results indicate the measurements taken were
A accurate and precise
B accurate but not precise
C precise but not accurate
D neither accurate nor precise.
15. Which of the following formulae would allow relative fitness to be calculated?
A frequency of a particular genotype after selectionfrequency of a particular genotype before selection
B frequency of a particular genotype before selectionfrequency of a particular genotype after selection
C number of surviving offspring of a particular genotypenumber of surviving offspring of other genotypes
D number of surviving offspring of other genotypesnumber of surviving offspring of a particular genotype
Page 09
16. Some invertebrate species can be used as indicator species to assess the level of pollution by organic waste in freshwater systems. Species within the taxa Ephemeroptera (mayflies), Plecoptera (stoneflies) and Trichoptera (caddisflies) are particularly sensitive to pollution. These taxa are referred to collectively as EPT taxa.
The presence of these species can be used to assess water pollution levels by calculating an EPT index using the formula shown. The value obtained allows the water quality to be assessed using Table 1.
EPT index = total number of EPT taxa present × 100
total number of taxa present
Table 1
EPT index Water quality
>50% excellent
35–49% good
25–34% moderate
<25% poor
A study sampled the invertebrate species in a stretch of river and the results are shown in Table 2.
Table 2
Taxa Number of individuals
Striped stonefly 6
Dragonfly 5
Simulid blackfly 9
Net-spinning caddisfly 6
Bloodworm 8
Flathead mayfly 3
Damselfly 7
The data suggests the water quality of this river is
A excellent
B good
C moderate
D poor.
[Turn over
Page 10
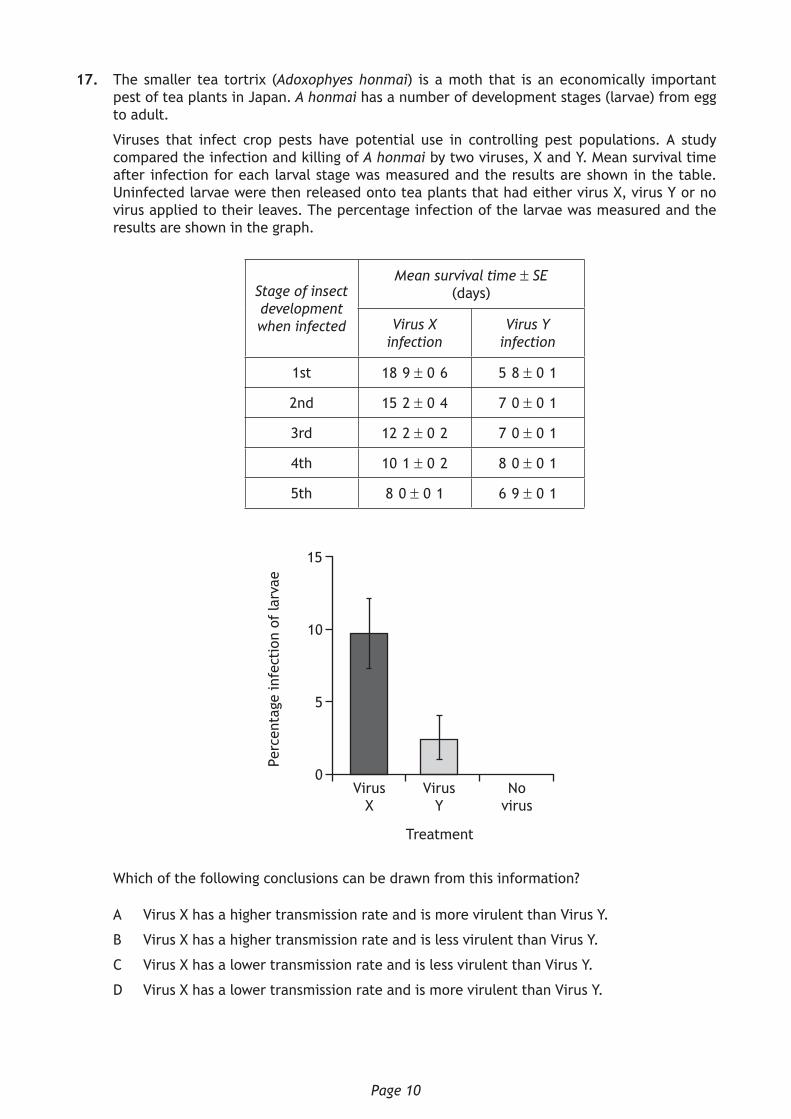
17. The smaller tea tortrix (Adoxophyes honmai) is a moth that is an economically important pest of tea plants in Japan. A honmai has a number of development stages (larvae) from egg to adult.
Viruses that infect crop pests have potential use in controlling pest populations. A study compared the infection and killing of A honmai by two viruses, X and Y. Mean survival time after infection for each larval stage was measured and the results are shown in the table. Uninfected larvae were then released onto tea plants that had either virus X, virus Y or no virus applied to their leaves. The percentage infection of the larvae was measured and the results are shown in the graph.
Stage of insect development when infected
Mean survival time ± SE (days)
Virus X infection
Virus Y infection
1st 18·9 ± 0·6 5·8 ± 0·1
2nd 15·2 ± 0·4 7·0 ± 0·1
3rd 12·2 ± 0·2 7·0 ± 0·1
4th 10·1 ± 0·2 8·0 ± 0·1
5th 8·0 ± 0·1 6·9 ± 0·1
15
10
5
0Virus
XVirus
YNo
virus
Treatment
Perc
enta
ge in
fect
ion
of la
rvae
Which of the following conclusions can be drawn from this information?
A Virus X has a higher transmission rate and is more virulent than Virus Y.
B Virus X has a higher transmission rate and is less virulent than Virus Y.
C Virus X has a lower transmission rate and is less virulent than Virus Y.
D Virus X has a lower transmission rate and is more virulent than Virus Y.
Page 11
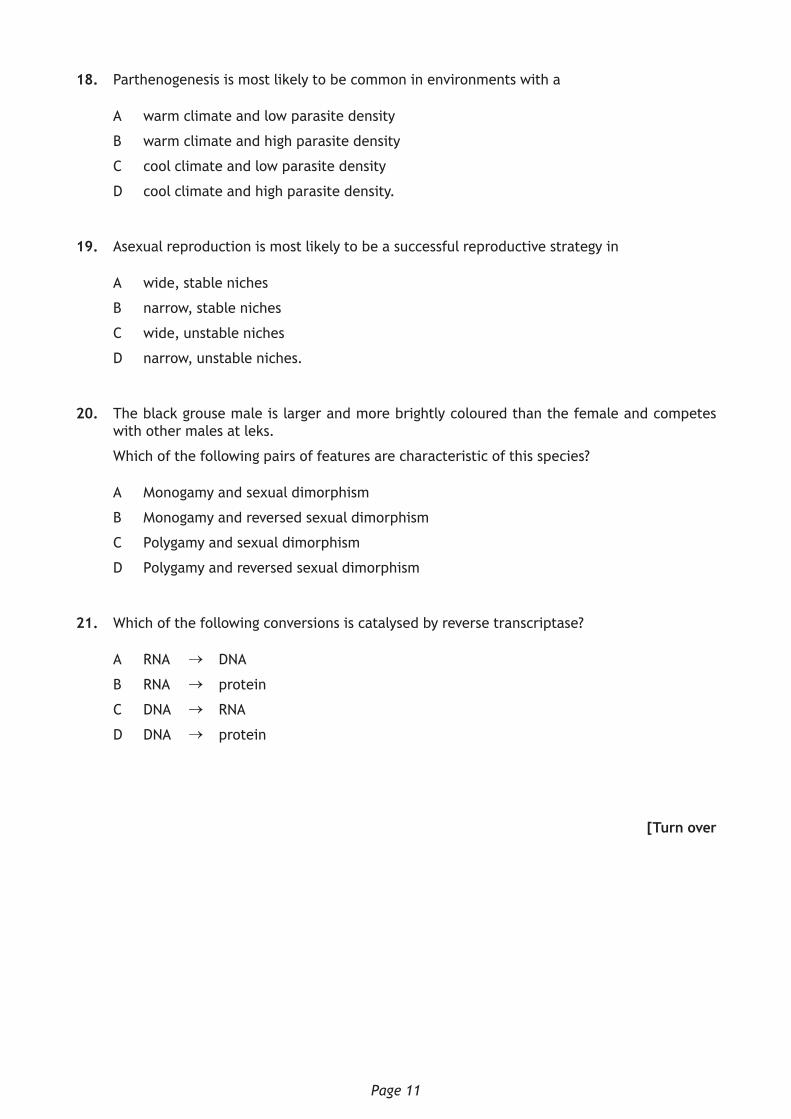
18. Parthenogenesis is most likely to be common in environments with a
A warm climate and low parasite density
B warm climate and high parasite density
C cool climate and low parasite density
D cool climate and high parasite density.
19. Asexual reproduction is most likely to be a successful reproductive strategy in
A wide, stable niches
B narrow, stable niches
C wide, unstable niches
D narrow, unstable niches.
20. The black grouse male is larger and more brightly coloured than the female and competes with other males at leks.
Which of the following pairs of features are characteristic of this species?
A Monogamy and sexual dimorphism
B Monogamy and reversed sexual dimorphism
C Polygamy and sexual dimorphism
D Polygamy and reversed sexual dimorphism
21. Which of the following conversions is catalysed by reverse transcriptase?
A RNA → DNA
B RNA → protein
C DNA → RNA
D DNA → protein
[Turn over
Page 12
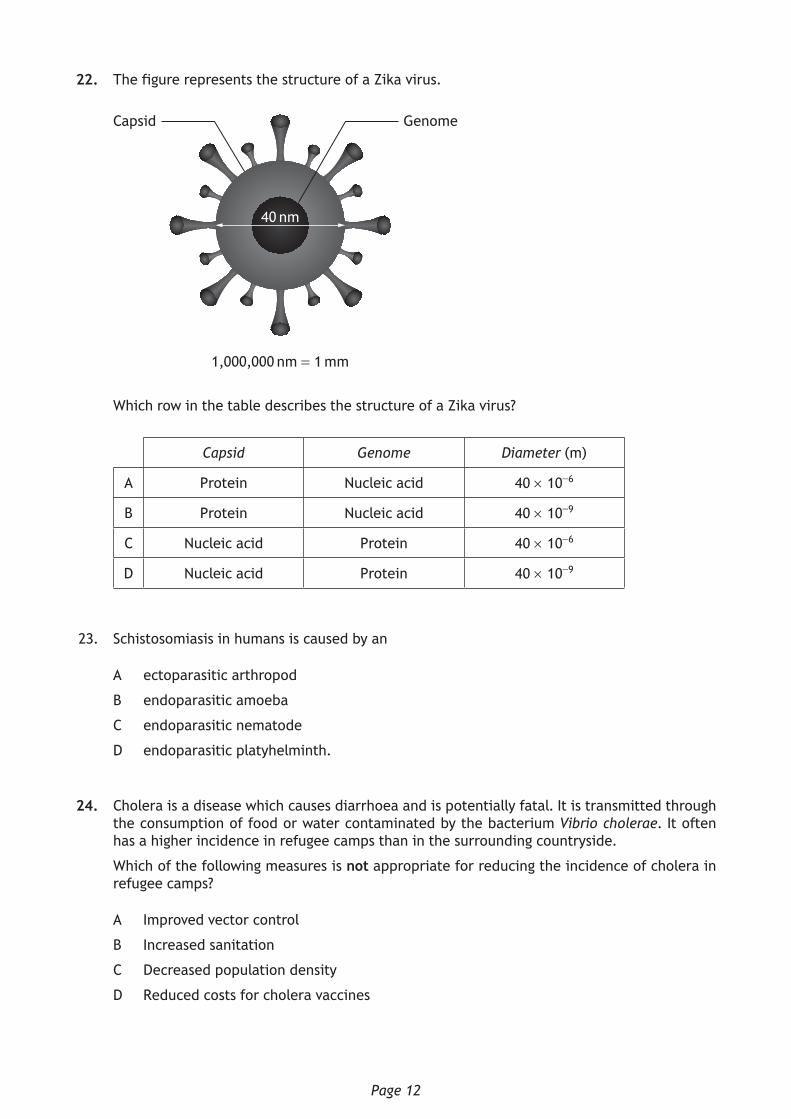
22. The figure represents the structure of a Zika virus.
GenomeCapsid
40 nm
1,000,000 nm = 1 mm
Which row in the table describes the structure of a Zika virus?
Capsid Genome Diameter (m)
A Protein Nucleic acid 40 × 10−6
B Protein Nucleic acid 40 × 10−9
C Nucleic acid Protein 40 × 10−6
D Nucleic acid Protein 40 × 10−9
23. Schistosomiasis in humans is caused by an
A ectoparasitic arthropod
B endoparasitic amoeba
C endoparasitic nematode
D endoparasitic platyhelminth.
24. Cholera is a disease which causes diarrhoea and is potentially fatal. It is transmitted through the consumption of food or water contaminated by the bacterium Vibrio cholerae. It often has a higher incidence in refugee camps than in the surrounding countryside.
Which of the following measures is not appropriate for reducing the incidence of cholera in refugee camps?
A Improved vector control
B Increased sanitation
C Decreased population density
D Reduced costs for cholera vaccines
Page 13
25. The scatterplot shows the results obtained when life expectancy at birth was plotted against age at first reproduction for 24 species of mammals of different sizes.
Age
at f
irst
rep
rodu
ctio
n
Life expectancy
Which of the following conclusions can be drawn from the data?
A An increase in life expectancy causes an increase in the age of first reproduction.
B An increase in the age of first reproduction causes an increase in life expectancy.
C Larger animals have longer life expectancy.
D Life expectancy and age at first reproduction are correlated.
[END OF SECTION 1. NOW ATTEMPT THE QUESTIONS IN SECTION 2 OF YOUR QUESTION AND ANSWER BOOKLET.]
Page 14
[BLANK PAGE]
DO NOT WRITE ON THIS PAGE
Page 15
[BLANK PAGE]
DO NOT WRITE ON THIS PAGE
Page 16
[BLANK PAGE]
DO NOT WRITE ON THIS PAGE
*X707770101*
*X7077701*
AHFOR OFFICIAL USE
Fill in these boxes and read what is printed below.
SECTION 1 —25 marksAttempt ALL questions.Instructions for the completion of Section 1 are given on Page 02.
SECTION 2 —65 marksAttempt ALL questions.
A Supplementary Sheet for Question 1 is enclosed inside the front cover of this question paper.
Write your answers clearly in the spaces provided in this booklet. Additional space for answers and rough work is provided at the end of this booklet. If you use this space you must clearly identify the question number you are attempting. Any rough work must be written in this booklet. You should score through your rough work when you have written your final copy.
Use blue or black ink.
Before leaving the examination room you must give this booklet to the Invigilator; if you do not, you may lose all the marks for this paper.
X707/77/01
TUESDAY, 23 MAY
9:00 AM – 11:30 AM
A/HTP
BiologySection 1 — Answer Grid
and Section 2
*X707770102*Page 02
SECTION 1 — 25 marks
The questions for Section 1 are contained in the question paper X707/77/02.
Read these and record your answers on the answer grid on Page 03 opposite.
Use blue or black ink. Do NOT use gel pens or pencil.
1. The answer to each question is either A, B, C or D. Decide what your answer is, then fill in the appropriate bubble (see sample question below).
2. There is only one correct answer to each question.
3. Any rough working should be done on the additional space for answers and rough work at the end of this booklet.
Sample Question
The thigh bone is called the
A humerus
B femur
C tibia
D fibula.
The correct answer is B — femur. The answer B bubble has been clearly filled in (see below).
A B C D
Changing an answer
If you decide to change your answer, cancel your first answer by putting a cross through it (see below) and fill in the answer you want. The answer below has been changed to D.
A B C D
If you then decide to change back to an answer you have already scored out, put a tick (3) to the right of the answer you want, as shown below:
A B C D
or
A B C D
*X707770103*Page 03
*OBJ25AD1*
A B C D
1
2
3
4
5
6
7
8
9
10
11
12
13
14
15
16
17
18
19
20
21
22
23
24
25
SECTION 1 — Answer Grid
[Turn over
*X707770104*Page 04
[BLANK PAGE]
DO NOT WRITE ON THIS PAGE
*X707770105*Page 05
[Turn over for next question
DO NOT WRITE ON THIS PAGE
*X707770106*Page 06
MARKS DO NOT WRITE IN
THIS MARGIN
SECTION 2 — 65 marks
Attempt ALL questions
It should be noted that question 11 contains a choice
1. Read through the Supplementary Sheet for Question 1 before attempting this question.
(a) Refer to Figure 2 in the Supplementary Sheet for Question 1.
Describe the trend shown in Figure 2.
(b) Describe the action of caspases in cell destruction.
(c) Refer to Figure 3 in the Supplementary Sheet for Question 1.
(i) Explain how the data supports the conclusion that the intrinsic pathway for apoptosis is triggered by the extract.
(ii) Describe what the three negative values in Figure 3 indicate about the level of apoptosis in these treatments.
1
1
2
1
*X707770107*Page 07
MARKS DO NOT WRITE IN
THIS MARGIN
1. (continued)
(d) Refer to Figures 4A and 4B in the Supplementary Sheet for Question 1.
(i) Calculate the percentage increase in the number of cells with 400 units of DNA in the cells treated with extract compared to the control cells.
Space for calculation
(ii) It was concluded that the extract initiated cell cycle arrest at a checkpoint after DNA replication but prior to cell division in these cells.
Explain how the data in Figures 4A and 4B support this hypothesis.
[Turn over
1
2
*X707770108*Page 08
MARKS DO NOT WRITE IN
THIS MARGIN
2. The light sensitive layer at the back of the human eye is called the retina. It is able to detect light due to the presence of photoreceptor cells called cones and rods. There are three types of cone cells (blue, green and red) which are sensitive to different wavelengths of light as shown in Figure 1. Different wavelengths of light are perceived as different colours.
Figure 1
Wavelength (nm)
Abso
rban
ce
Red cones
Green conesRods
Blue cones
50
100
0400 500 600 700
(a) (i) In cone cells, the light sensitive molecule retinal combines with a membrane protein to form photoreceptor proteins.
Name this membrane protein.
(ii) One percent of human males do not have functional red cone cells, a colour vision deficiency called protanopia.
Affected individuals would perceive a red object reflecting light of a wavelength of 670 nm as black.
Use Figure 1 to explain this observation.
1
1
*X707770109*Page 09
MARKS DO NOT WRITE IN
THIS MARGIN
2. (continued)
(b) Rod cells are more sensitive than cone cells at low light intensities.
State how this sensitivity is achieved.
(c) Most birds have four types of cone cells.
Name the additional wavelength range to which these organisms are sensitive.
[Turn over
1
1
*X707770110*Page 10
MARKS DO NOT WRITE IN
THIS MARGIN
3. Cortisol is a hydrophobic signalling molecule, produced by the human adrenal gland, that affects a number of different tissues in response to stress. It has a role in increasing blood sugar levels, in suppressing the immune system, and in promoting the metabolism of fats, proteins, and carbohydrates.
(a) (i) Cortisol is a steroid hormone.
Describe the mechanism by which this type of signalling molecule causes an effect within the target cell.
(ii) Suggest a way in which cortisol might have different effects in different tissues.
2
1
*X707770111*Page 11
MARKS DO NOT WRITE IN
THIS MARGIN
3. (continued)
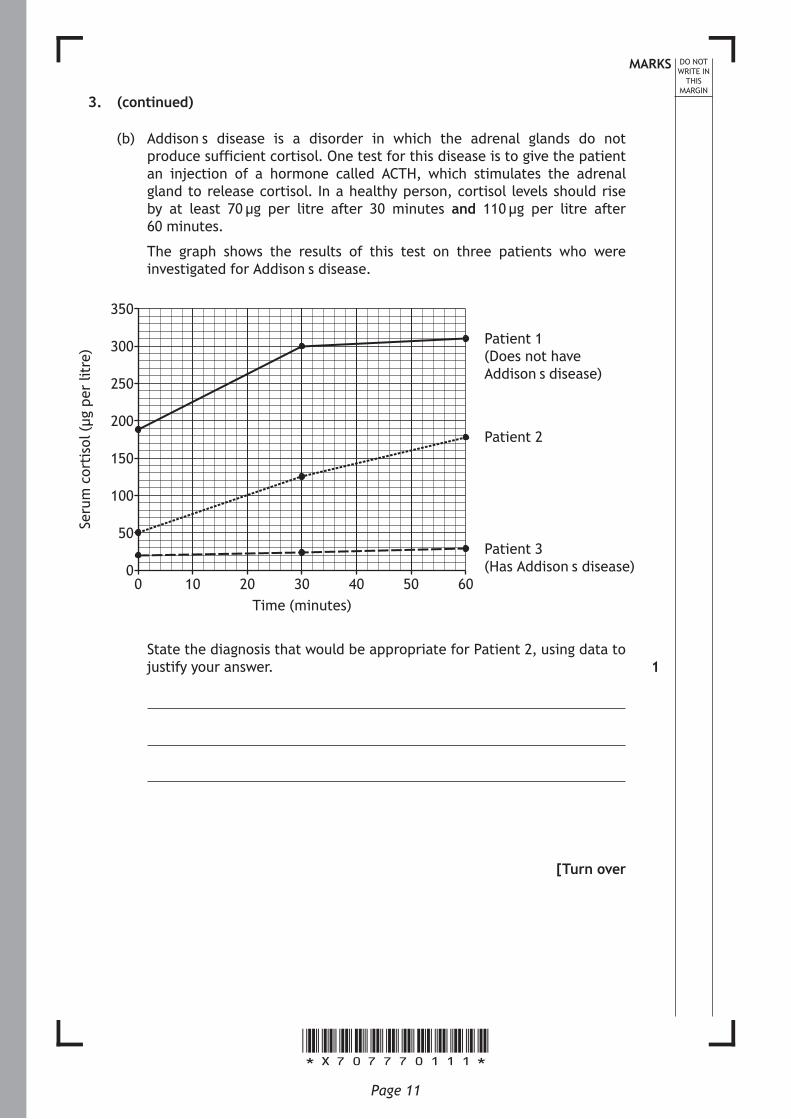
(b) Addison’s disease is a disorder in which the adrenal glands do not produce sufficient cortisol. One test for this disease is to give the patient an injection of a hormone called ACTH, which stimulates the adrenal gland to release cortisol. In a healthy person, cortisol levels should rise by at least 70 µg per litre after 30 minutes and 110 µg per litre after 60 minutes.
The graph shows the results of this test on three patients who were investigated for Addison’s disease.
Patient 3(Has Addison’s disease)
Patient 2
Time (minutes)
Seru
m c
orti
sol (
µg p
er li
tre)
Patient 1(Does not have Addison’s disease)
100 20 30 40 50 600
50
100
150
200
250
300
350
State the diagnosis that would be appropriate for Patient 2, using data to justify your answer.
[Turn over
1
*X707770112*Page 12
MARKS DO NOT WRITE IN
THIS MARGIN
4. The diagram shows how two types of enzyme can be involved in controlling the activity of a protein in response to the presence of a signalling molecule within the cell (intracellular signal molecule). Intracellular signalling molecules are often produced as a result of extracellular signals received by cell-surface receptors.
Intracellular signal molecule
present
Intracellular signal molecule
removed
enzyme Xprotein kinase
target protein active
target protein inactive
(a) (i) Explain how the action of protein kinase can switch a target protein from inactive to active.
(ii) Name the type of enzyme represented by enzyme X.
(iii) Explain the importance of the system being able to return the target protein to its inactive state.
1
1
1
*X707770113*Page 13
MARKS DO NOT WRITE IN
THIS MARGIN
4. (continued)
(b) Protein kinase A (PKA) is an enzyme that is involved in this type of signalling. To test the hypothesis that PKA is found in a variety of cell types, cell extracts were prepared from different cell types and the proteins in the extracts separated by electrophoresis in a gel. The proteins were blotted onto a solid support and an antibody recognising PKA (anti-PKA antibody) was used to detect the presence of PKA.
(i) Describe how protein electrophoresis is used to separate proteins.
(ii) Explain how the anti-PKA antibody would be used to detect the presence of PKA.
[Turn over
1
2
*X707770114*Page 14
MARKS DO NOT WRITE IN
THIS MARGIN
5. The water vole (Arvicola amphibius) was common in Scotland but has declined markedly in recent years due to habitat loss and predation by American mink (Neovison vison).
A survey was carried out to estimate the population of water voles on a Scottish river system by counting the number of latrines (droppings sites) on a river bank at the water’s edge. Water vole latrines are created as part of a territorial behaviour where a water vole will revisit the same site over and over again to deposit its droppings.
Water vole American mink
(a) Suggest one reason why counting latrines is an appropriate indirect sampling technique for water voles.
(b) The survey team worked on a total of 518 km, using survey sites of 500 m at 5 km intervals along the river system. The number of latrines per kilometre of waterways was counted.
Name the type of sampling used.
1
1
*X707770115*Page 15
MARKS DO NOT WRITE IN
THIS MARGIN
5. (continued)
(c) All surveys were conducted in June, July and August of the same year. There was heavy rainfall for three days in August. Any survey site too deep to walk into was omitted. The remains of one water vole that had been preyed upon were discovered at one survey site. Of the 92 sites sampled, only one site showed any latrines.
Identify one aspect of the experimental design that shows:
(i) High reliability;
(ii) Low reliability.
(d) It was concluded that the water vole population on this river had become extremely low due to predation by American mink.
Give two reasons why this may not be a valid conclusion.
1
2
[Turn over
1
1
2
*X707770116*Page 16
MARKS DO NOT WRITE IN
THIS MARGIN
6. The mechanism of sex determination is not the same for all species.
(a) In most mammals the sex of the organism is determined by its genotype.
Describe how genetic control determines the phenotype of maleness in mammals.
(b) In some reptile species the sex of offspring is environmentally rather than genetically controlled.
Describe how an environmental factor can influence the sex ratio of offspring in such species.
(c) Diabetes insipidus is a condition characterised by the production of an excessive volume of dilute urine. An hereditary form of the disease in humans is the result of an X-linked mutation in the gene coding for the receptor for the hormone ADH. The mutated allele (Xa) is recessive to the normal allele (XA).
(i) Explain why males are more likely to be affected by diabetes insipidus than females.
(ii) Explain why carrier females are usually not affected by diabetes insipidus even though they carry a mutated copy of the gene.
1
1
1
2
*X707770117*Page 17
MARKS DO NOT WRITE IN
THIS MARGIN
6. (c) (continued)
(iii) A man who is not affected by diabetes insipidus has a partner who is a carrier.
State the proportion of their sons that would be predicted to have the condition.
Space for working
%
[Turn over
1
*X707770118*Page 18
MARKS DO NOT WRITE IN
THIS MARGIN
7. Students observed a group of California sea lions (Zalophus californianus) that were situated on a rocky outcrop off the coast of California. During each observation period, ten sea lions were observed for six minutes each. The sea lions were watched from a distance using binoculars. The checklist was used as a reference when recording the behaviours observed.
California sea lion
Behaviour Description of behaviour
grooming Licking, smoothing self with tongue, scratching
observing Sitting up on flippers looking around
restingLying down with some
head raising, barking or yawning
movement, aggressive
Barking, aggressive charging or chasing
movement, non-aggressive
Moving for better position on rock
other Behaviours not specified above
(a) State the term used for a behavioural checklist of this kind.
(b) As they observed the sea lions the students noted the time at which each new behaviour started.
Describe how the data could be used to construct a time budget.
1
1
*X707770119*Page 19
MARKS DO NOT WRITE IN
THIS MARGIN
7. (continued)
(c) One student noted, “Sometimes the sea lions tried to annoy each other.”
Explain why anthropomorphic statements such as this should be avoided in behavioural studies.
(d) Observing the sea lions from a distance made distinguishing some details of behaviour difficult.
Suggest an improvement to the method, other than direct observation, that would reduce this source of error.
[Turn over
1
1
*X707770120*Page 20
MARKS DO NOT WRITE IN
THIS MARGIN
8. “So sex exists to keep parasites at bay.” (Lane, 2009)
With reference to the Red Queen hypothesis, discuss the importance of sexual reproduction in defence against parasites. 5
*X707770121*Page 21
[Turn over for next question
DO NOT WRITE ON THIS PAGE
*X707770122*Page 22
MARKS DO NOT WRITE IN
THIS MARGIN
9. Acraea encedon is a butterfly found in tropical Africa.
Females of this species can be one of two types: either producing broods that are entirely female or producing broods that have males and females in an approximate 1:1 sex ratio. One hypothesis proposed to explain the all-female broods was that bacteria inherited from the mother kill male embryos only.
(a) Explain how antibiotics that kill bacteria could be used in a controlled trial to test this hypothesis.
(b) Research has shown that the rapid evolution of male-killing bacteria from non-male-killing strains has been enabled by horizontal gene transfer.
Explain what is meant by “horizontal gene transfer”.
2
1
*X707770123*Page 23
MARKS DO NOT WRITE IN
THIS MARGIN
9. (continued)
(c) Some populations of the butterfly are extremely female-biased with over 90% being infected with this bacterium. These females form lekking swarms at landmarks. This has been described as sex-role-reversal. Butterfly populations that are not female-biased do not have lekking swarms.
Suggest the purpose of the lekking swarms and explain why they are only found in female-biased populations of the butterfly.
(d) Other sex-role-reversed mating systems are usually associated with males investing more than females in offspring, but this is not the case with A. encedon.
Suggest one way in which males might demonstrate greater reproductive investment than females in a sex-role-reversed mating system.
[Turn over
2
1
*X707770124*Page 24
MARKS DO NOT WRITE IN
THIS MARGIN
10. The graph shows the number of measles notifications (reported cases) since 1950 and vaccination rates since 1970.
Measles notification (× 1000)
Key:
Vaccine uptake (%)
Vacc
ine
upta
ke (%
)
Case
s ( ×
100
0)
Year50 54 58 62 66 70 74 78 82 86 90 94 98 02 04
100
80
60
40
20
0
900
800
700
600
500
400
300
200
100
0
(a) State the term used to describe the study of data concerned with the outbreak and spread of infectious disease.
(b) Describe the pattern of measles notifications prior to the introduction of vaccination.
(c) Describe the correlation suggested by the graph.
1
1
1
*X707770125*Page 25
MARKS DO NOT WRITE IN
THIS MARGIN
10. (continued)
(d) The MMR vaccine was introduced in 1988 to combat the infectious viral diseases of measles, mumps and rubella. In 1998, a report, published in a peer reviewed medical journal, claimed to establish a link between the MMR vaccine and the disorder known as autism.
(i) Explain what is meant by the term “peer reviewed”.
(ii) Although criticised heavily and eventually discredited, this research led to a considerable reduction in the number of children being vaccinated. In some areas, such as Swansea in South Wales, vaccination rates fell as low as 67·5%. Over the same period, a huge increase in the number of measles notifications occurred in that area.
Account for the spread of measles in the Swansea epidemic.
(iii) Explain how the events in Swansea confirm that the graph not only shows correlation but also shows causation.
(e) The World Health Organisation (WHO) recommends 95% of children should be immunised (vaccinated) against measles in order to protect all.
State the term used to describe this WHO threshold.
[Turn over for next question
1
1
1
1
*X707770126*Page 26
MARKS DO NOT WRITE IN
THIS MARGIN
11. Answer either A or B in the space below and on Page 27.
A Discuss the role of amino acid R-groups in:
(i) the determination of tertiary structure of proteins;
(ii) influencing the location of proteins within cells.
OR
B Discuss cell membranes under the following headings:
(i) the phospholipid bilayer as a selective barrier;
(ii) types of transport proteins and their functions.
3
6
2
7
*X707770127*Page 27
MARKS DO NOT WRITE IN
THIS MARGIN
SPACE FOR ANSWER FOR QUESTION 11
[END OF QUESTION PAPER]
*X707770128*Page 28
MARKS DO NOT WRITE IN
THIS MARGIN
ADDITIONAL SPACE FOR ANSWERS AND ROUGH WORK
*X707770129*Page 29
MARKS DO NOT WRITE IN
THIS MARGIN
ADDITIONAL SPACE FOR ANSWERS AND ROUGH WORK
*X707770130*Page 30
[BLANK PAGE]
DO NOT WRITE ON THIS PAGE
*X707770131*Page 31
[BLANK PAGE]
DO NOT WRITE ON THIS PAGE
*X707770132*Page 32
[BLANK PAGE]
DO NOT WRITE ON THIS PAGE
Acknowledgement of CopyrightQuestion 5 Ian Schofield/shutterstock.com Stephan Morris/shutterstock.comQuestion 7 Eric Isselee/shutterstock.comQuestion 8 Quote is taken from “Life Ascending: The Ten Great Inventions of Evolution” (Page 135)
by Nick Lane. ISBN 9781861978486. Published by Profile Books. Reproduced by kind permission of Profile Books.
1. There are two main pathways of programmed cell death (apoptosis): intrinsic (from within the cell) and extrinsic (from outside the cell).
Figure 1 summarises some of the main features of the two pathways.
Figure 1
Intrinsic Pathway
Caspase 3 activation
Caspase 8 activation
Apoptosis
Caspase 9 activation
Cell membrane receptor bindingp53 activation
Extracellular death signalDNA damage
Extrinsic Pathway
Apoptosis is deregulated in many tumours, resulting in uncontrolled cell division despite the presence of significant DNA damage. One strategy for the discovery of new anti-cancer drugs has been to examine traditional medicinal herbs.
A study was carried out to investigate the effect of an extract of the wild ginger plant, Asiasari radix, on the initiation of apoptosis in colon cancer cells.
Colon cancer cells were treated with this extract and then assessed for the presence of apoptotic cells. The percentage increase in cells undergoing apoptosis was calculated by comparing the level of apoptosis in treated cells with that in untreated controls as shown in Figure 2.
Figure 21200
1000
800
600
400
200
02015105
Extract concentration (μg/cm3)
Incr
ease
in c
ells
und
ergo
ing
apop
tosi
s (%
)
Page 03
1. (continued)
To investigate the involvement of caspases in this process of apoptosis, the experiment was repeated using a single dose of extract (10 µg/cm3) but with the addition of a variety of caspase inhibitors (drugs known to prevent the activation of one or more caspases). Inhibitors used included an inhibitor known to prevent activation of all caspases (all ci) and individual inhibitors of caspase 3 (ci 3), caspase 8 (ci 8) and caspase 9 (ci 9). Percentage changes in the number of cells undergoing apoptosis compared to untreated cancer cells are shown in Figure 3.
Figure 3
Chan
ge in
num
ber
of c
ells
un
derg
oing
apo
ptos
is
(%)
ci 9 + Extract
ci 8 + Extract
ci 3 + Extract
all ci + Extract
Extract
Treatment
500
400
300
200
100
0
−100
The distribution of the cancer cells across the different phases of the cell cycle was then investigated by measuring the DNA content of the cells. Cultures of cells were treated with 10 µg/cm3 extract or left untreated for 24 hours as a control and then the DNA content of 10,000 cells was analysed for each cell culture. Results for treated cells are shown in Figure 4A and for control cells in Figure 4B. DNA content is displayed with arbitrary units where 200 units represents the DNA content of a non-dividing diploid cell.
300 300
240 240
180 180
120 120
60 60
0 0600 600400 400200 2000 0
DNA content (arbitrary units) DNA content (arbitrary units)