123 Introduction e Bay Area Regional Deformation (BARD) network is a collection of permanent, continuously operating GPS receiv- ers that monitor crustal deformation in the San Francisco Bay Area (SFBA) and Northern California� Started in 1991 with two stations spanning the Hayward Fault, BARD has been a collab- orative effort of the Berkeley Seismological Laboratory (BSL), the USGS at Menlo Park (USGS/MP), and several other aca- demic, commercial, and governmental institutions� e BARD network is designed to study the distribution of deformation in Northern California across the Pacific-North America plate boundary and interseismic strain accumulation along the San Andreas fault system in the Bay Area for seismic hazard as- sessment, and to monitor hazardous faults and volcanoes for emergency response management� It also provides data in real time for use in Earthquake Early Warning (EEW) and rapid response applications� e BSL maintains and/or has direct continuous telemetry from 31 stations comprising the BARD Backbone, while additional stations operated by the USGS, US Coast Guard and others fill out the extended BARD network� Since the completion of major construction on the Plate Boundary Observatory (PBO) portion of EarthScope in 2004, the number of GPS stations in Northern California has expand- ed to over 250 (Figure 4�5�1)� Together, PBO and BARD sta- tions provide valuable information on the spatial complexity of deformation in the SFBA and Northern California, while the BARD network has the infrastructure and flexibility to addi- tionally provide information on its temporal complexity over a wide range of time scales as well as in real-time� All BARD Backbone stations collect data at 1 Hz sampling frequency and stream their data in real time to the BSL, and in turn is provid- ed in real time to the public� Furthermore, seventeen BARD Backbone sites are collocated with broadband seismic stations of the BDSN, with which they share continuous telemetry to UC Berkeley� As geodetic and seismic data become more close- ly integrated, these collocated stations are already available to provide combined data products� Station configuration e BARD networks include two models of receiver: Trim- ble NetRS and Topcon Net-G3A� All BARD stations use a ra- dome-equipped, low-multipath choke-ring antenna, designed to provide security and protection from weather and other natural phenomena, and to minimize differential radio prop- 5 Bay Area Regional Deformation Network Figure 4�5�1: Map of the BARD Backbone network and surrounding PBO sites in Northern California� e right figure is an enlarged view of the box on the leſt figure�
Transcript
123
Introduction
The Bay Area Regional Deformation (BARD) network is a collection of permanent, continuously operating GPS receiv-ers that monitor crustal deformation in the San Francisco Bay Area (SFBA) and Northern California� Started in 1991 with two stations spanning the Hayward Fault, BARD has been a collab-orative effort of the Berkeley Seismological Laboratory (BSL), the USGS at Menlo Park (USGS/MP), and several other aca-demic, commercial, and governmental institutions� The BARD network is designed to study the distribution of deformation in Northern California across the Pacific-North America plate boundary and interseismic strain accumulation along the San Andreas fault system in the Bay Area for seismic hazard as-sessment, and to monitor hazardous faults and volcanoes for emergency response management� It also provides data in real time for use in Earthquake Early Warning (EEW) and rapid response applications� The BSL maintains and/or has direct continuous telemetry from 31 stations comprising the BARD Backbone, while additional stations operated by the USGS, US Coast Guard and others fill out the extended BARD network�
Since the completion of major construction on the Plate Boundary Observatory (PBO) portion of EarthScope in 2004,
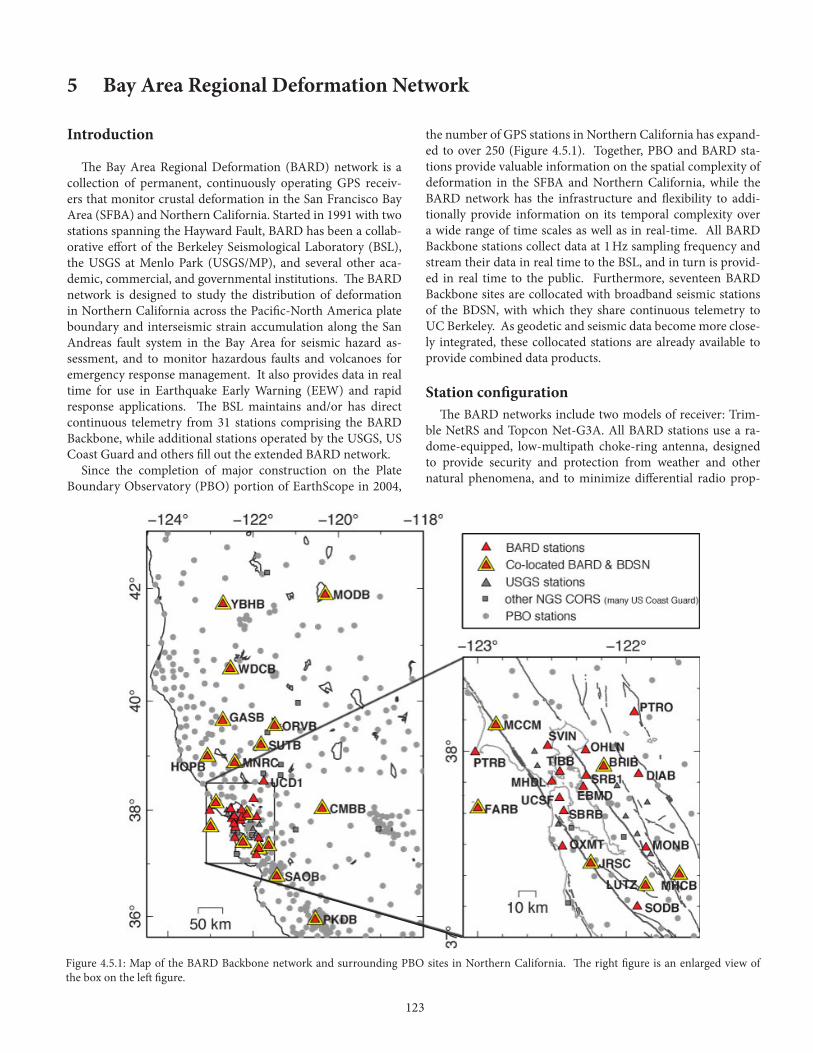
the number of GPS stations in Northern California has expand-ed to over 250 (Figure 4�5�1)� Together, PBO and BARD sta-tions provide valuable information on the spatial complexity of deformation in the SFBA and Northern California, while the BARD network has the infrastructure and flexibility to addi-tionally provide information on its temporal complexity over a wide range of time scales as well as in real-time� All BARD Backbone stations collect data at 1 Hz sampling frequency and stream their data in real time to the BSL, and in turn is provid-ed in real time to the public� Furthermore, seventeen BARD Backbone sites are collocated with broadband seismic stations of the BDSN, with which they share continuous telemetry to UC Berkeley� As geodetic and seismic data become more close-ly integrated, these collocated stations are already available to provide combined data products�
Station configurationThe BARD networks include two models of receiver: Trim-
ble NetRS and Topcon Net-G3A� All BARD stations use a ra-dome-equipped, low-multipath choke-ring antenna, designed to provide security and protection from weather and other natural phenomena, and to minimize differential radio prop-
5 Bay Area Regional Deformation Network
Figure 4�5�1: Map of the BARD Backbone network and surrounding PBO sites in Northern California� The right figure is an enlarged view of the box on the left figure�
124
agation delays� A low-loss antenna cable is used to minimize signal degradation on the longer cable setups that normally would require signal amplification� Low-voltage cutoff devices are installed to improve receiver performance following power outages�
All BARD stations are continuously telemetered to the BSL� Many use frame relay technology, either alone or in combina-tion with radio telemetry� Other methods include direct radio link to Berkeley and satellite telemetry� At MODB, MCCM, and MNRC we are able to telemeter 1 Hz data using the USGS VSAT system that collects seismic broadband data as part of the Na-tional Seismic Network (NSN)� We have also changed our data strategy by allowing some data to be transferred by web-based telemetry (ADSL lines)� This will reduce our communication operational costs and, we hope, will not affect our ability to re-act to a large event�
BARD station monumentations broadly fall into three types� Most are anchored into bedrock, either directly or via a steel-re-inforced concrete cylinder� The five “mini-PBO” (mPBO) stations that are still operated by the BSL are collocated with USGS strainmeters, and their GPS antennas are bolted onto the borehole casing using an experimental mount developed at the BSL, which has since been adopted by PBO for their strainmeter sites� Four sites (UCD1, SRB1, UCSF, SBRB) are located on the roofs of buildings� Most of the last type have been installed in the past four years, and their stability over long periods of time is yet to be evaluated� Six stations installed under the American
Recovery and Reinvestment Act (ARRA) have PBO style short-brace monuments cemented into bedrock�
Data handling
ArchivalRaw and RINEX data files from the 31 BARD Backbone sta-
tions and several other stations run by BARD collaborators, such as the USGS and LBNL, are archived at the Northern Cali-fornia Earthquake Data Center (NCEDC)� The data are checked to verify their integrity, quality, completeness, and conformance to the RINEX standard, and are then made accessible, usually within 1 hour of the end of the UTC day, to all participants and other members of the GPS community through the Internet, both by anonymous FTP and through the World Wide Web (http://ncedc.org/)� BARD data are also available to the com-munity through the GPS Seamless Archive Centers (GSAC), such as that hosted by the Scripps Orbit and Permanent Array Center (SOPAC, http://gsac.ucsd.edu)� High-rate raw data are also decimated to create 15 s RINEX data files� 1 Hz RINEX files are available for all BARD Backbone sites after May 2010�
As part of the activities funded by the USGS through the BARD network, the NCEDC has established an archive of the 10,000+ survey-mode occupations collected by the USGS since 1992 and the NCEDC is the principal archive for this dataset� These and other survey-mode data are used together with data from BARD and PBO stations to produce BAVU (Bay Area Ve-locity Unification), a united set of continuous and survey data from the wider San Francisco Bay Area, processed under iden-tical conditions using GAMIT (d’Alessio et al�, 2005)�
Data from five of our sites (HOPB, MHCB, CMBB, OHLN, and YBHB) are sent to the National Geodetic Survey (NGS) in the framework of the CORS (Continuous Operating Refer-ence Stations) project (http://www.ngs.noaa.gov/CORS/)� The data from these five sites are also distributed to the public through the CORS FTP site�
Real-time streamingAll BARD stations are currently available in real time with
1 Hz data sampling; a step toward our goal of integrating GPS with the Northern California Seismic System (NCSS) for use in hazard assessment and emergency response and for Earth-quake Early Warning applications� Data streams are received from the stations in BINEX format� They are received at the BSL and converted into RTCM using Sharc software package (maintained by USGS, Pasadena)� Both the original BINEX and RTCM streams are then made available to the public from an Ntrip-caster operated by the BSL (http://seismo.berkeley.edu/bard/realtime)� The BSL also acts as a conduit for re-al-time streams for seven continuous GPS stations operated by the USGS, Menlo Park and five stations installed by the Law-rence Berkeley National Lab (LBNL), in order to make those data easily accessible to the GPS community�
Figure 4�5�2: Velocities from BAVU3β, including BARD stations, as well as campaign, and PBO stations� Yearly velocities are relative to station LUTZ, marked by a yellow circle�
125
Interseismic Velocities and Daily Time Series Average station coordinates are estimated from 24 hours of
observations for BARD stations and other nearby continuous GPS sites using the GAMIT/GLOBK software developed at MIT and SIO (Herring et al�, 2010a & b)� GAMIT uses dou-ble-difference phase observations to determine baseline dis-tances and orientations between ground-based GPS receivers� Ambiguities are fixed using the widelane combination followed by the narrowlane, with the final position based on the iono-spheric free linear combination (LC)� Baseline solutions are loosely constrained until they are combined together� GAMIT produces solutions as “H-files”, which include the covariance parameters describing the geometry of the network for a giv-en day and summarize information about the sites� We com-bine daily, ambiguity-fixed, loosely constrained H-files using the Kalman filter approach implemented by GLOBK (Herring, 2010b)� They are combined with solutions from the IGS glob-al network and PBO and stabilized in an ITRF2005 reference frame� The estimated relative baseline determinations typically
have 2-4 mm long-term scatter in the horizontal components and 10-20 mm scatter in the vertical�
BARD data are an important component of the Bay Area Ve-locity Unification (BAVU) project (d’Alessio et al�, 2005)� BAVU contains all available campaign data in Northern California and processes them in a consistent manner to produce a compre-hensive and high-density velocity map� It relies on a network of CGPS stations to provide a framework on which these data can be combined� With data going back to 1992, BARD stations can provide such a framework (Figure 4�5�2)� Average linear velocities for each station are estimated from monthly combina-tions of the campaign, BARD, PBO and IGS solutions and are shown in Figure 4�5�2�
Time series of station positions are produced with daily, au-tomated updates� BARD data are processed within 24 hours us-ing IGS rapid orbit information and the time series are updated immediately� When rapid PBO and IGS global station solutions become available (usually within 2-3 days), they are combined with the rapid BARD solutions using GLOBK and the time se-
Site Lat.(deg)
Lon.(deg) Receiver Telem. Samp.
RateColloc.
Net. Location
BRIB 37�92 -122�15 NETRS FR 1 Hz BDSN Briones Reservation, Contra Costa CountyCMBB 38�03 -120�39 NET-G3A FR 1 Hz BDSN Columbia College, Tuolumne CountyDIAB 37�88 -121�92 NETRS FR 1 Hz Mt� Diablo , Contra Costa County
EBMD 37�82 -122�28 LEICA R 1 Hz East Bay MUD Headquarters, Alameda County FARB 37�70 -123�00 NETRS R-FR 1 Hz BDSN Farallon Island , San Francisco CountyGASB 39�65 -122�72 NET-G3A R-FR 1 Hz BDSN Alder Springs, Glenn CountyHOPB 39�00 -123�07 NET-G3A R-FR 1 Hz BDSN Hopland Field Station, Mendocino CountyJRSC 37�41 -122�23 NET-G3A Int 1 Hz BDSN Jasper Ridge Biol� Preserve, San Mateo CountyLUTZ 37�29 -121�87 NET-G3A FR 1 Hz BDSN SCC Communications , Santa Clara County
MCCM 38�14 -122�88 NET-G3A VSAT 1 Hz BDSN Marconi Conference Center, Marin CountyMHCB 37�34 -121�64 NETRS FR 1 Hz BDSN Lick Observatory, Santa Clara CountyMHDL 37�84 -122�49 NETRS R-FR 1 Hz mPBO Marin Headlands, Marin CountyMNRC 38�88 -122�44 NET-G3A VSAT 1 Hz BDSN McLaughlin Mine, Lake CountyMODB 41�90 -120�30 NETRS VSAT 1 Hz BDSN Modoc Plateau , Modoc CountyMONB 37�50 -121�87 NET-G3A FR 1 Hz Monument Peak, Santa Clara CountyOHLN 38�01 -122�27 NET-G3A FR 1 Hz mPBO Ohlone Park, Contra Costa CountyORVB 39�55 -121�50 NET-G3A FR 1 Hz BDSN Oroville , Butte CountyOXMT 37�50 -122�42 NET-G3A FR 1 Hz mPBO Ox Mountain , San Mateo CountyPKDB 35�95 -120�54 NETRS R-T1 1 Hz BDSN Bear Valley Ranch, Monterey CountyPTRB 38�00 -123�01 NETRS R-FR 1 Hz Point Reyes Lighthouse , Marin CountyPTRO 38�21 -121�94 NET-G3A FR 1 Hz BDSN Potrero Hills, Solano CountySAOB 36�77 -121�45 NETRS FR 1 Hz BDSN San Andreas Observatory, San Benito CountySBRB 37�69 -122�41 NET-G3A FR 1 Hz mPBO San Bruno Replacement, San Mateo CountySODB 37�17 -121�93 NET-G3A R-FR 1 Hz Soda Springs, Santa Clara CountySRB1 37�87 -122�27 NET-G3A Fiber 1 Hz Seismic Replacement Building, Alameda CountySUTB 39�21 -121�82 NETRS R-FR 1 Hz BDSN Sutter Buttes , Sutter CountySVIN 38�03 -122�53 NET-G3A R-FR 1 Hz mPBO St Vincents , Marin CountyTIBB 37�89 -122�45 NET-G3A R-Int 1 Hz Tiburon , Marin County
UCD1 38�54 -121�75 NETRS Int 1 Hz UC Davis , Yolo County (operated by UC Davis)UCSF 37�76 -122�46 NET-G3A FR 1 Hz UC San Francisco , San Francisco County
Table 4�5�1: List of BARD stations maintained by the BSL� The receivers operating now are: Trimble NETRS, (NETRS) and Topcon Net-G3A (Net-G3A)� Site EBMD, operated by the East Bay Municipal Utility District, has a Leica GX1230 receiver and Leica AR10 antenna� The telemetry types listed are FR = Frame Relay, R = Radio, Int = Internet, VSAT = Satellite, T1 = Private T1 line� mPBO are the remaining “mini-PBO” sites operated by the BSL� Telemetry often includes a radio hop from the GPS site to the seismic vault, indicated by an initial R� All (except EBMD) are equipped with Ashtech or Topcon choke ring antennas�
126
ries is again updated� Final processing with both GAMIT and GLOBK occurs when IGS final orbits and final PBO solutions become available (1-2 weeks); the time series is then updated for the last time with the final positions�
After each update, the time series are cleaned by removing outliers and common mode noise� Common mode noise is estimated by stacking the difference between observations and modeled motion for all stations� The model is derived from a priori values for station velocity, coseismic offsets and post-seismic decay� The cleaned data is then used to re-estimate the a priori model parameters in an iterative process� Outliers are identified as points whose misfit to a linear trend is greater than 4s on any single component of motion (North, East, or Up)� Overall time series scatter is low; with average RMS values across the BARD network of 1�8 mm, 2�9 mm, and 5�8 mm for the North, East and Up directions respectively� Plots of station time series are posted daily on the BARD website (http://seis-mo.berkeley.edu/bard/timeseries)�
Earthquake Early WarningWith support from the Gordon and Betty Moore Foundation,
we have been working on integrating information from GPS into Earthquake Early Warning (EEW) algorithms in a module we call G-larms� Our goals for this project include establishing a robust system for processing GPS data streams into displace-ment time series and designing and implementing methods to use these results to supplement seismic Earthquake Early Warn-ing systems during large earthquakes� More details on G-larms are available in Research Sections 2�32 and 2�33 �
The BSL is now using data from 62 GPS stations in the greater
San Francisco Bay Area to generate real-time position estimates on a routine basis� This includes 26 stations that are operated by the BSL and 8 that are operated by the USGS, Menlo Park� We also process 29 stations operated by the Plate Boundary Obser-vatory (PBO), who collect real-time data for a subset of their stations and make these available to the public�
Additionally, we use trackRT, together with predicted or-bits from the International GPS service (IGS) to produce high sample rate displacement time series with 2-3 second laten-cy� TrackRT was developed at MIT and is based on GAMIT/GLOBK, which we use for daily processing� TrackRT follows a network processing approach, with displacements generated with respect to a reference station� The benefits of this approach are that common noise sources, such as local atmosphere, are canceled out, leading to more precise relative displacements�
We employ a fully triangulated network scheme in which neighboring station pairs are processed individually, such that no station serves as the universal reference site (Figure 4�5�3)� This makes our network resilient against an outage or telemetry loss at any individual station� The low processing overhead of trackRT makes it possible for us to run separate instances of the program to produce displacement time series for all ~160 baselines in our network�
The scatter in the displacement time series for each baseline depends on distance and increases during days with changeable weather conditions� However, it is often within 2 cm over the course of 24 hours, which is considered a stable result� Simu-lations of a M6�9 Hayward fault earthquake show that relative motions of over 20 cm would be expected between many of the station pairs near the fault and would be easily resolved by well-behaved data (see Research Section 2�33)�
Earthquake Rapid ResponseWhile real-time processing of GPS data is capable of provid-
ing measurements of displacement within seconds of its occur-rence, post-processing provides results with lower noise levels, leading to better precision� We have developed a strategy to use real-time GPS data access with rapid post-processing (RPP) techniques to estimate static offsets from moderate to large earthquakes and use them to constrain a non-linear search for fault plane parameters� Rapid post-processing requires waiting 1-2 minutes after the earthquake for data to accumulate, but dis-placement time series can then be generated within 5 minutes using the software Track, developed at MIT� From these, full fault plane determination can be performed within another 5 minutes� While real-time processing techniques are critical for using GPS data for Earthquake Early Warning, rapid post-pro-cessing provides higher precision in the static offset measure-ment� This allows GPS data to be used for smaller earthquakes and still finishes within a time frame appropriate for ShakeMap�
Using data from the 2007 M5�6 Alum Rock and 2004 M6�0 Parkfield earthquakes, we find that RPP with Track allows more robust static offset determination from these smaller earth-quakes than real-time processing (as it exists today)� For both earthquakes, sub-cm offsets can be resolved and match post-event analyses well� We perform our search for the best-fitting
50 km
BARDPBOPBO RTPBO (USGS received)USGSCORS
Figure 4�5�3: Map showing triangulated real-time processing net-work� Each black line represents an independent processing instance of trackRT�
127
fault plane parameters using no a priori information� That is, we attempt to simulate a situation where the type and location of faulting for these earthquakes is not known� While low station density makes this difficult for the M5�6 Alum Rock earthquake, the fault plane for the M6�0 Parkfield earthquake can be quickly and robustly determined� We therefore expect this strategy to be successful for earthquakes of at least M6�0 and could be used for smaller events in areas with good station coverage�
Figure 4�5�4 shows how including the fault plane affects the ShakeMap calculations for the Parkfield earthquake; in-cluding the RPP determined plane produces a ShakeMap that matches the final CISN ShakeMap well� However, while the finite plane used for the official ShakeMap matches the GPS determined plane, it was determined manually based on the af-tershock distribution� As such, it was several hours before this information was incorporated into the ShakeMap� By contrast the same information can be obtained from GPS within 15 min-utes�
AcknowledgementsThe BARD program is overseen by Ingrid Johanson and
Richard Allen� Joshua Miller, Sarah Snyder, John Friday, Aaron Enright, Doug Neuhauser, Mario Aranha and Jennifer Taggart
contributed to the operation of the BARD network in 2012–2013� Operation of the BARD network is partially supported by funding from the USGS/NEHRP program grant #G10AC00141� Real-time data processing is supported by a grant from the Moore Foundation�
M� H� Murray, Slicing up the San Francisco Bay Area: block kinemat-ics and fault slip rates from GPS-derived surface velocities, J. Geophys. Res., 110(B06403), doi:10�1029/2004JB003496, 2005�
Herring, T� A�, R� W� King, and S� C� McClusky, GAMIT: GPS Analysis at MIT—Release 10.4, MIT, 2005� [online] Available from: http://www-gpsg.mit.edu/~simon/gtgk/GAMIT_Ref.pdf�
Herring, T� A�, R� W� King, and S� C� McClusky, GLOBK: Global Kalman filter VLBI and GPS analysis program—Version 10.4, MIT, 2010� [online] Available from: http://www-gpsg.mit.edu/~simon/gtgk/GLOBK_Ref.pdf�
Figure 4�5�4 (Above): Three ShakeMaps for the 2004 Parkfield earthquake� The left and middle ShakeMaps are scenarios that contain only information from a distance/attenuation model� The right-most figure is the official CISN ShakeMap using both a model and instrumental data� Dis-tance in the left-most figure is calculated to the earthquake epicenter only; in the middle plot, it is the closest distance to the fault plane�
Figure 4�5�5 (At left): Distance vs� maximum acceleration for stations given the point source (red points) and the finite fault (blue points)� The black points show the modeled relationship� The difference between the red and blue points is in how the distance from the station to the earth-quake is calculated�


![NetRS: Cutting Response Latency in Distributed Key-Value ... · namo [6], Voldemort [7], Couchbase [8], etc.) generally replicate data over multiple servers to be highly available](https://static.documents.pub/doc/80x56/60078390eeb9204e7b12870e/netrs-cutting-response-latency-in-distributed-key-value-namo-6-voldemort.jpg)


