197 5 Economic Factors influencing the Shark Fin Trade 5.1 Chapter Overview and Purpose The preceding chapters describe the present state of the global shark fin trade and attempt to determine whether shark resources can sustain the trade at existing levels. This supply- side approach is now complemented by a demand-side analysis which explores linkages between the quantity of shark fins in trade and a number of economic indicators. This analysis is intended to elucidate potential factors underlying shark fin trade expansion as well as anticipate future levels of market demand. Given the absence of supply-side constraints, such as catch limits or quotas in most shark fisheries, market demand as determined by price, consumer income, substitutes and/or other factors is likely to drive exploitation rates. Identifying the key determinants of market demand is thus essential for understanding future pressures on shark resources and for evaluating the usefulness of market-based conservation strategies. A connection between the liberalisation of Mainland China and the growth of the shark fin trade was first proposed in the early 1990s (Cook 1990). Since that time, China’s economy has expanded to become the world’s seventh largest, and some sources claim that in terms of purchasing power parity China’s consumers now rank second only to those in the United States (Wang and Wong 1999). Concomitantly, the quantity of shark fins in trade has also increased despite changes in product form and complexities in trade routings that tend to falsely inflate official customs statistics (see Chapter 4). This chapter uses the latest adjusted trade statistics and economic data from Hong Kong and Mainland China (the Mainland) to test the hypothesis that economic growth in China is driving the shark fin trade. The results, in conjunction with a survey-based
Transcript
197
5 Economic Factors influencing the Shark Fin Trade
5.1 Chapter Overview and Purpose
The preceding chapters describe the present state of the global shark fin trade and attempt
to determine whether shark resources can sustain the trade at existing levels. This supply-
side approach is now complemented by a demand-side analysis which explores linkages
between the quantity of shark fins in trade and a number of economic indicators. This
analysis is intended to elucidate potential factors underlying shark fin trade expansion as
well as anticipate future levels of market demand. Given the absence of supply-side
constraints, such as catch limits or quotas in most shark fisheries, market demand as
determined by price, consumer income, substitutes and/or other factors is likely to drive
exploitation rates. Identifying the key determinants of market demand is thus essential
for understanding future pressures on shark resources and for evaluating the usefulness of
market-based conservation strategies.
A connection between the liberalisation of Mainland China and the growth of the shark
fin trade was first proposed in the early 1990s (Cook 1990). Since that time, China’s
economy has expanded to become the world’s seventh largest, and some sources claim
that in terms of purchasing power parity China’s consumers now rank second only to
those in the United States (Wang and Wong 1999). Concomitantly, the quantity of shark
fins in trade has also increased despite changes in product form and complexities in trade
routings that tend to falsely inflate official customs statistics (see Chapter 4). This
chapter uses the latest adjusted trade statistics and economic data from Hong Kong and
Mainland China (the Mainland) to test the hypothesis that economic growth in China is
driving the shark fin trade. The results, in conjunction with a survey-based
198
characterisation of the Hong Kong shark fin trade community, are used to identify the
most important factors contributing to market demand and to indicate the prospects for
trader- and consumer-based conservation initiatives.
5.2 Econometric Exploration of Market Demand
5.2.1 Introduction
Econometrics involves applying mathematical statistics to economic data for the purpose
of lending empirical support to theoretical models. The models specify the relationship
between a dependent variable and one or more independent, or explanatory, variables
based on economic principles (Gujarati 1995). A variety of model forms may be
specified but all are evaluated based on their ability to explain both the overall trend, and
any short-term deviations from the overall trend, in the dependent variable. In this
analysis, shark fin imports, the dependent variable, are modelled using available
indicators of consumer spending and economic conditions. While it is recognized that
econometric studies based on short time series from transitional economies pose
considerable challenges, such studies are valuable because they provide a quantitative
approach to what may otherwise be personal and judgmental assessments (Url and
Wörgötter 1995).
Econometric analysis of Asian demand for wildlife, fish or other food products has been
conducted for elephant ivory and rhino horn in Hong Kong and Japan (Milner-Gulland
1993), for seafood in Japan (Price and Gislason 2001, Wessells and Wilen 1994) and rice
in Mainland China (Peterson et al. 1991). However, previous studies of markets for shark
fins have been largely descriptive. Parry-Jones (1996) discussed international trade
routes and prices in Hong Kong, while Fong and Anderson (2000) characterized dealer
199
distribution channels and shark fin grading, also in Hong Kong. Other studies of the
shark fin trade based outside of Hong Kong have assessed its economic importance to
fishing fleets (McCoy and Ishihara 1999), and global reach, diversification and value
(Rose 1996, TRAFFIC 1996). Quantitative studies of shark fin trade economics include
Fong and Anderson’s (2002) work using trader preference information to model optimal
shark sizes for harvest.
5.2.2 Model Conceptualization
The analytical framework for this study is based on the assumption that the demand for
shark fins in Hong Kong and Mainland China, and the supply of shark fins by Hong Kong
traders and their subsidiaries in the Mainland, represents a single, coherent market.
Although it is obvious that economic conditions between the two areas differ, the shark
fin trade flows between Hong Kong and the Mainland are open and multi-channelled.
The only available records of the quantities of goods passing through this market consist
of customs statistics, however, as discussed in Chapter 4, major discrepancies have been
observed between Hong Kong and Mainland customs data for shark fin. These
discrepancies cast doubt on the reliability of the Mainland China data for enumerating
shark fin imports and partitioning consumption of processed shark fin between the two
areas. As a result, an integrated model is proposed, with imports of shark fin to Hong
Kong as the dependent variable, and time series data from both Hong Kong and the
Mainland as explanatory variables.
A general form for the model was defined based on principles underlying the economic
theory of demand (Dubin 1998). In its simplest form, the demand function for a
particular good is defined by its price. Therefore, price is expected to be a critical
determinant of demand for shark fin in Hong Kong and Mainland China. Another
important demand determinant in most markets is consumer income, or similar factors
200
such as consumer spending. Economic expansion in Mainland China in recent years is
assumed to have led to rising per capita income which may in turn have caused an
increase in demand for shark fins. The relative change in quantity demanded associated
with the relative change in income, i.e. the income elasticity, would be expected to be
positive, implying shark fin is a ‘normal’ good, and possibly greater than 1, implying
shark fin is a ‘luxury’ good. Models of demand also must consider substitute goods since
the availability and quality of substitutes often directly influences demand elasticities for
the particular good of interest. In Chinese cuisine shark fin is served at wedding
banquets, important business functions and other special occasions (Rose 1996), therefore
other foodstuffs served on these occasions may be possible substitutes for shark fin.
Finally, the model should account for the influence of past consumption patterns on
current consumption. A linkage between past and present consumption may arise from
consumers forming a habit of eating shark fin on certain occasions or delays in the
reaction of traders to market forces. Incorporating past values (i.e. lags) of the quantity of
shark fin demanded into the model is one simple way of addressing this potential demand
determinant.
The demand for shark fins can thus be expressed as:
),,,,( ttttitt uSIPYfY −= (Eq. 5.1)
where Y is the quantity of shark fin demanded,
P is price of shark fin,
I is income,
S is the price(s) of substitute good(s),
u is the error term,
subscript t indicates the time period, and
subscript i indicates the lag period.
201
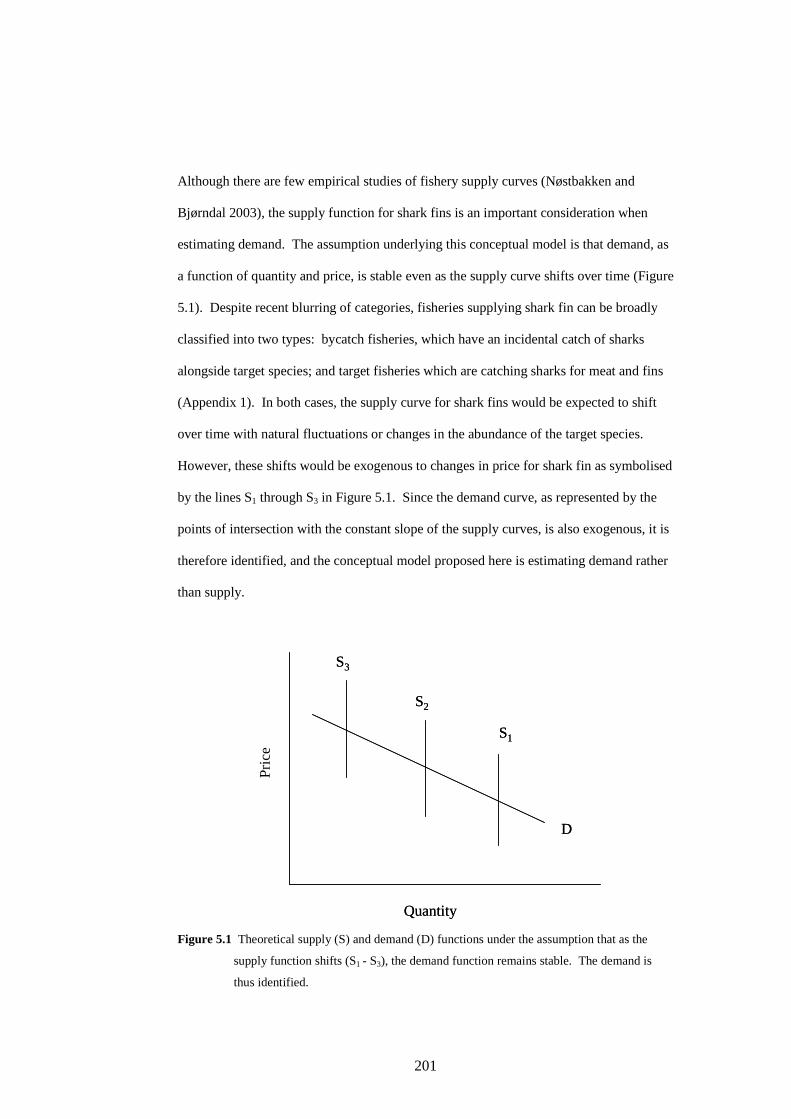
Although there are few empirical studies of fishery supply curves (Nøstbakken and
Bjørndal 2003), the supply function for shark fins is an important consideration when
estimating demand. The assumption underlying this conceptual model is that demand, as
a function of quantity and price, is stable even as the supply curve shifts over time (Figure
5.1). Despite recent blurring of categories, fisheries supplying shark fin can be broadly
classified into two types: bycatch fisheries, which have an incidental catch of sharks
alongside target species; and target fisheries which are catching sharks for meat and fins
(Appendix 1). In both cases, the supply curve for shark fins would be expected to shift
over time with natural fluctuations or changes in the abundance of the target species.
However, these shifts would be exogenous to changes in price for shark fin as symbolised
by the lines S1 through S3 in Figure 5.1. Since the demand curve, as represented by the
points of intersection with the constant slope of the supply curves, is also exogenous, it is
therefore identified, and the conceptual model proposed here is estimating demand rather
than supply.
Figure 5.1 Theoretical supply (S) and demand (D) functions under the assumption that as the
supply function shifts (S1 - S3), the demand function remains stable. The demand is
thus identified.
Price
Quantity
D
S1
S3
S2
Price
Quantity
D
S1
S3
S2
Pri
ce
202
As stated above, the dependent variable Y, representing quantity demanded, was specified
as imports of shark fin to Hong Kong due to data deficiencies for Mainland China
imports. However, for variables P, I and S, it was acknowledged that conditions in Hong
Kong (HK) and Mainland China (MC) may be sufficiently different to warrant
specification of separate explanatory variables for each variable, e.g. PHK and PMC, etc.
Substitutes are expected to be identified among other traditional Chinese luxury
foodstuffs served on special occasions and may differ between the two systems. The
need and justification for separate specification for the Mainland and Hong Kong prices
and the selection of substitutes was evaluated in light of available data as discussed
below.
5.2.3 Data Sources
Compilation of data was undertaken in Hong Kong and Mainland China through library
and online searches, visits to government departments, and enquiries at intergovernmental
and private data clearing houses. Some data were made freely available in digital form,
whereas other datasets required purchase and manual data entry (e.g. shark fin price data).
Searches were conducted for relevant data extending as far back as 1980 and with the
maximum reporting frequency possible (Table 5.1).
Hong Kong’s shark fin import data is published monthly by the Hong Kong Special
Administrative Region Government based on traders’ self-declared quantities (Hong
Kong Government 2002). Some illegal trade, conducted to avoid import tariffs levied by
the Mainland China government, is suspected but, as documented in Chapter 4, does not
appear to have a strong effect on import quantities declared in Hong Kong where the
trade is legal and duty-free. Inventory stockpiling is a potential drawback to the use of
import data as a proxy for market demand as it may interfere with detecting the response
of traders to the other variables in the model. However, given the limited warehousing
20
3
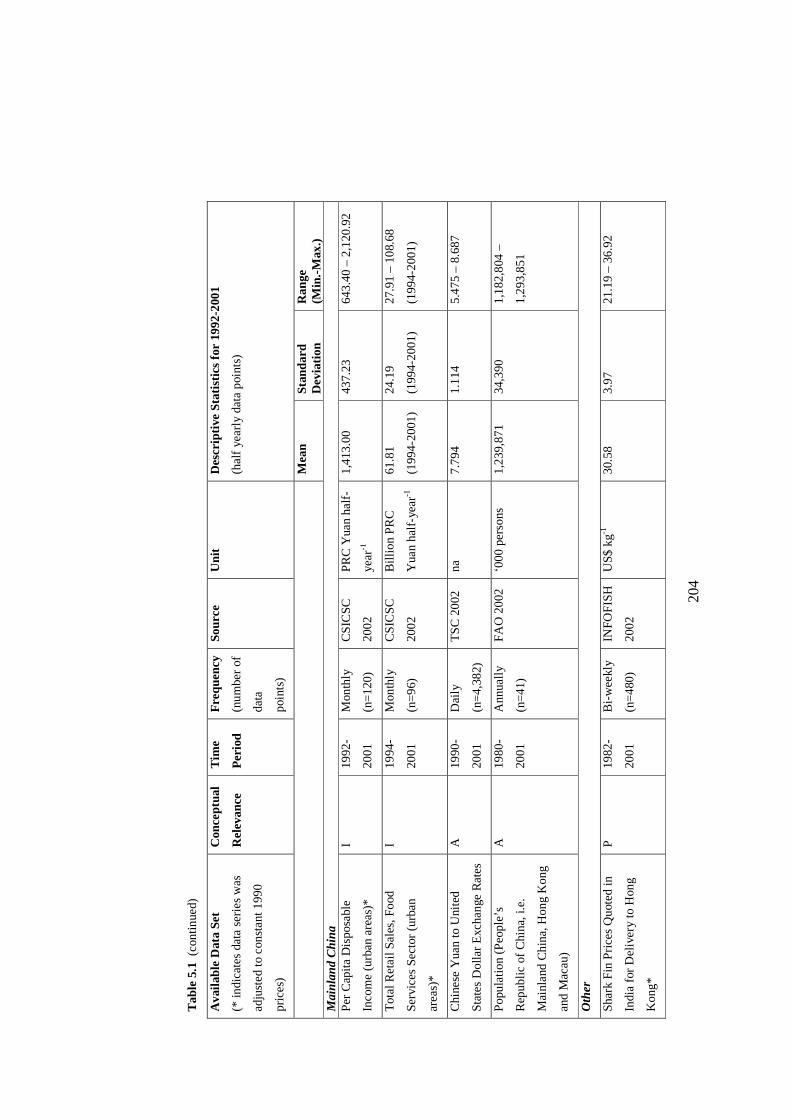
Tab
le 5
.1 D
ata
sou
rce
s a
nd d
esc
riptiv
e st
atis
tics
for
the
eco
nom
etri
c m
ode
l. T
he t
ime
pe
riod
re
fers
to
the
ava
ila
bilit
y of
da
ta f
rom
the
qu
ote
d so
urce
; a
dditi
ona
l
hist
oric
al r
eco
rds
ma
y be
ava
ilabl
e fr
om o
ther
sou
rce
s.
Con
cept
ual r
ele
vanc
e:
Y =
qua
ntity
de
ma
nde
d;
P =
pri
ce; I
= in
com
e o
r a
ltern
ativ
e m
easu
re o
f sp
en
din
g; S
=
subs
titut
es;
A =
ad
just
men
t da
ta f
or p
er
capi
ta m
ea
sure
s or
exc
hang
e r
ate
s.
Ava
ilabl
e D
ata
Set
(* in
dica
tes
data
se
rie
s w
as
adj
uste
d to
con
sta
nt 1
990
pric
es)
Con
cept
ual
Rel
evan
ce
Tim
e
Per
iod
Fre
que
ncy
(num
ber
of
data
poi
nts)
Sou
rce
Uni
t D
escr
iptiv
e S
tatis
tics
for
1992
-200
1
(hal
f ye
arl
y da
ta p
oint
s)
M
ean
Sta
ndar
d
Dev
iatio
n
Ran
ge
(Min
.-M
ax.)
Hon
g K
ong
Imp
orts
of
Pro
cess
ed
and
Un
proc
ess
ed
Sha
rk F
in
Y
198
0-
200
1
Mon
thly
(n=
264)
Hon
g K
ong
Gov
t.
2002
kg h
alf-
year
-1
2,53
0,5
02
497,
689
1,8
48,7
81 –
3,4
49,3
98
Pri
vate
Con
sum
ptio
n (t
ota
l)*
I
198
9-
200
1
Qua
rte
rly
(n=
52)
Hon
g K
ong
Gov
t.
2002
HK
$ M
half-
yea
r-1
229,
659
19,0
84
184,
609
– 25
8,13
8
Tot
al R
est
aur
ant
Re
ceip
ts
(va
lue
)*
I 19
83-
200
1
Qua
rte
rly
(n=
76)
Hon
g K
ong
Gov
t.
2002
HK
$ M
half-
yea
r-1
16,0
46
872
14,4
35 –
17,
845
Pri
ces
of M
arin
e F
ish
(ga
rou
pa,
reta
il)*
S
198
0-
200
1
Mon
thly
(n=
396)
Hon
g K
ong
Gov
t.
2002
HK
$ kg
-1
52.6
4 7.
79
44.4
0 –
69.4
8
Pop
ula
tion
A
198
0-
200
1
Ha
lf-ye
arly
(n=
70)
Hon
g K
ong
Gov
t.
2002
‘00
0
Pe
rson
s
6,36
2 32
0 5,
800
– 6
,759
Hon
g K
ong
Dol
lar
to U
nite
d
Sta
tes
Dol
lar
Exc
han
ge R
ate
s A
198
0-
200
1
Mon
thly
(n=
336)
HK
MA
200
2 N
A
7.75
1 0.
024
7.
727
– 7
.799
20
4
Tab
le 5
.1 (
cont
inue
d)
Ava
ilabl
e D
ata
Set
(* in
dica
tes
data
se
rie
s w
as
adj
uste
d to
con
sta
nt 1
990
pric
es)
Con
cept
ual
Rel
evan
ce
Tim
e
Per
iod
Fre
quen
cy
(nu
mbe
r of
data
poi
nts)
Sou
rce
Uni
t D
escr
iptiv
e S
tatis
tics
for
1992
-200
1
(ha
lf ye
arl
y da
ta p
oint
s)
M
ean
Sta
ndar
d D
evia
tion
Ran
ge
(Min
.-M
ax.)
M
ainl
and
Chi
na
Pe
r C
apita
Dis
posa
ble
Inco
me
(ur
ban
are
as)
*
I 19
92-
2001
Mon
thly
(n=
120
)
CS
ICS
C
200
2
PR
C Y
uan
half-
yea
r-1
1,4
13.0
0 43
7.23
64
3.40
– 2
,120
.92
Tot
al R
eta
il S
ale
s, F
ood
Se
rvic
es
Se
ctor
(ur
ban
are
as)
*
I 19
94-
2001
Mon
thly
(n=
96)
CS
ICS
C
200
2
Bill
ion
PR
C
Yua
n ha
lf-ye
ar-1
61.8
1
(199
4-20
01)
24.1
9
(199
4-20
01)
27.9
1 –
108.
68
(199
4-20
01)
Chi
nese
Yua
n to
Uni
ted
Sta
tes
Dol
lar
Exc
han
ge R
ate
s A
1990
-
2001
Dai
ly
(n=
4,38
2)
TS
C 2
002
na
7.
794
1.
114
5.
475
– 8
.687
Pop
ula
tion
(Pe
ople
’s
Rep
ublic
of
Chi
na,
i.e.
Mai
nla
nd C
hin
a, H
ong
Kon
g
and
Ma
cau)
A
1980
-
2001
Ann
ually
(n=
41)
FA
O 2
002
‘0
00 p
ers
ons
1,2
39,8
71
34,3
90
1,1
82,8
04 –
1,2
93,8
51
Oth
er
Sha
rk F
in P
rice
s Q
uot
ed
in
Indi
a f
or D
eliv
ery
to
Hon
g
Kon
g*
P
1982
-
2001
Bi-
we
ekl
y
(n=
480
)
INF
OF
ISH
200
2
US
$ kg
-1
30.5
8 3.
97
21.1
9 –
36.9
2
205
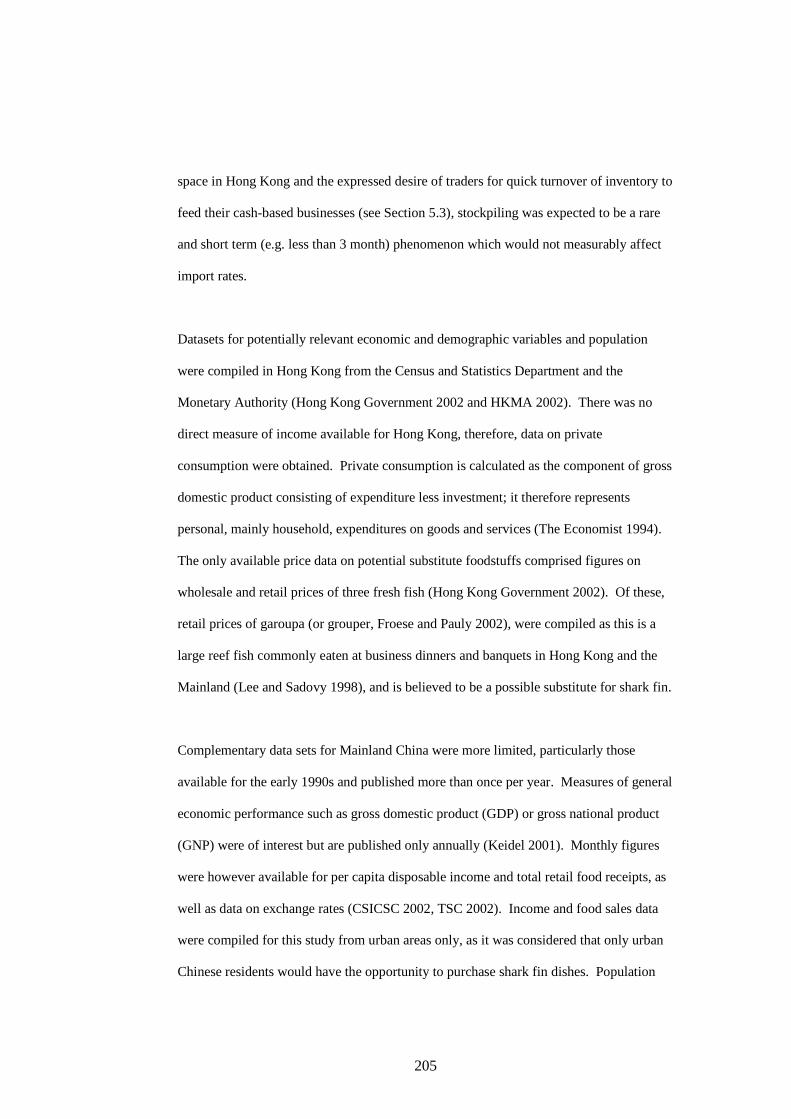
space in Hong Kong and the expressed desire of traders for quick turnover of inventory to
feed their cash-based businesses (see Section 5.3), stockpiling was expected to be a rare
and short term (e.g. less than 3 month) phenomenon which would not measurably affect
import rates.
Datasets for potentially relevant economic and demographic variables and population
were compiled in Hong Kong from the Census and Statistics Department and the
Monetary Authority (Hong Kong Government 2002 and HKMA 2002). There was no
direct measure of income available for Hong Kong, therefore, data on private
consumption were obtained. Private consumption is calculated as the component of gross
domestic product consisting of expenditure less investment; it therefore represents
personal, mainly household, expenditures on goods and services (The Economist 1994).
The only available price data on potential substitute foodstuffs comprised figures on
wholesale and retail prices of three fresh fish (Hong Kong Government 2002). Of these,
retail prices of garoupa (or grouper, Froese and Pauly 2002), were compiled as this is a
large reef fish commonly eaten at business dinners and banquets in Hong Kong and the
Mainland (Lee and Sadovy 1998), and is believed to be a possible substitute for shark fin.
Complementary data sets for Mainland China were more limited, particularly those
available for the early 1990s and published more than once per year. Measures of general
economic performance such as gross domestic product (GDP) or gross national product
(GNP) were of interest but are published only annually (Keidel 2001). Monthly figures
were however available for per capita disposable income and total retail food receipts, as
well as data on exchange rates (CSICSC 2002, TSC 2002). Income and food sales data
were compiled for this study from urban areas only, as it was considered that only urban
Chinese residents would have the opportunity to purchase shark fin dishes. Population
206
data on the People’s Republic of China, including Hong Kong and Macau Special
Administrative Regions, was compiled for use in per capita adjustments.
Relevant price data for shark fin proved elusive, as the price data contained on the Hong
Kong auction data sheets (Chapter 2) represented only a short timeframe, and there were
no other existing, long-term data sources identified in either Hong Kong or the Mainland.
The most useful available dataset consisted of bi-monthly price quotes in US dollars for
various seafood products from around the world (INFOFISH 2002). The dataset was
examined for consistent shark fin types, gradings and countries of origin, but no price
quotes were available for shark fin offered for sale specifically in Hong Kong or
Mainland China. A time series of price quotes for ‘black shark fins other than tails’,
quoted in India for delivery to South East/Far East Asian ports was compiled as the best
proxy for price of unprocessed shark fin in Hong Kong and the Mainland.
5.2.4 Data Adjustment
Adjustment was required to establish a common frequency for all data series, to account
for inflation in financial data, and to standardize units between data series. This section
describes the background and rationale for each of these adjustments.
In order to make maximum use of all available datasets in a consistent time format, data
were first prepared in quarterly intervals. For data series representing quantities, such as
imports of shark fin, private consumption, disposable income and restaurant receipts, this
required summing all available values into quarterly totals. Price and exchange rate data
were averaged over the quarter1, and population figures were generated by applying a
1 Agglomeration of price data is usually accomplished via weighted averages, but in this case the measures of price (P) and quantity (Y) were unrelated and thus simple averages of price were used.
207
linear extrapolation to annual or mid-year figures. The model time frame was limited to
1992-2001 (n=40) due to the lack of published data for the Mainland China variables
prior to 1992.
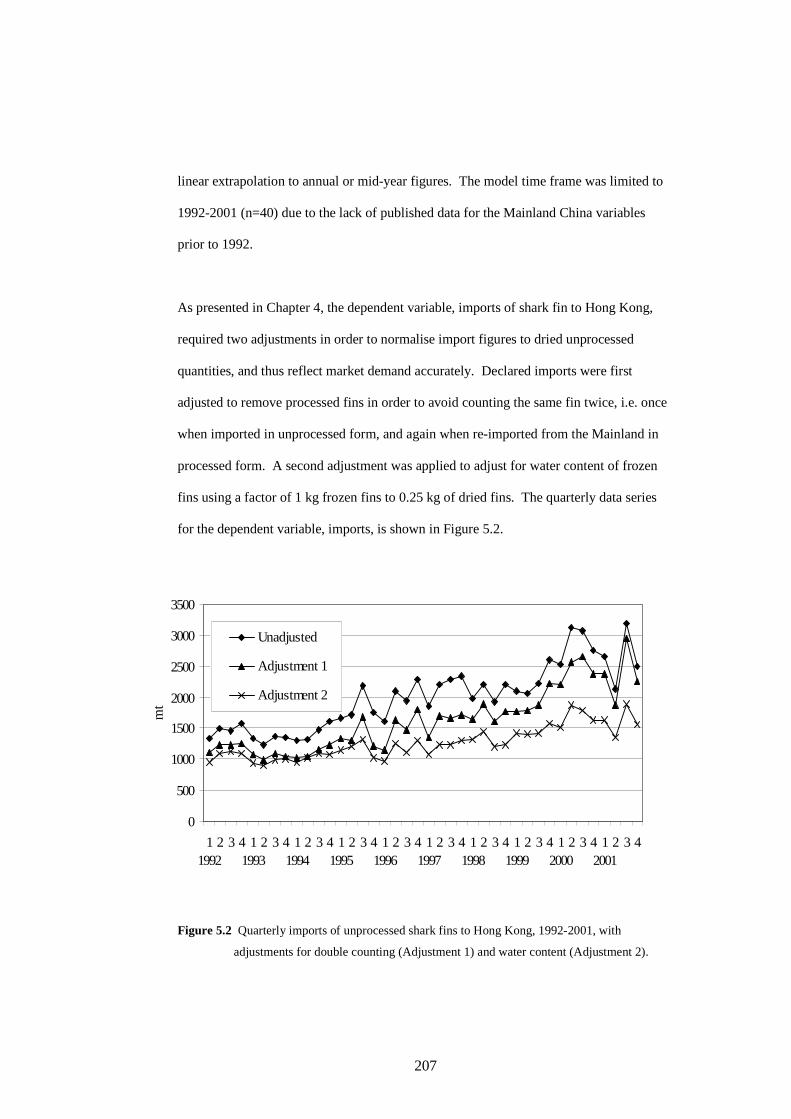
As presented in Chapter 4, the dependent variable, imports of shark fin to Hong Kong,
required two adjustments in order to normalise import figures to dried unprocessed
quantities, and thus reflect market demand accurately. Declared imports were first
adjusted to remove processed fins in order to avoid counting the same fin twice, i.e. once
when imported in unprocessed form, and again when re-imported from the Mainland in
processed form. A second adjustment was applied to adjust for water content of frozen
fins using a factor of 1 kg frozen fins to 0.25 kg of dried fins. The quarterly data series
for the dependent variable, imports, is shown in Figure 5.2.
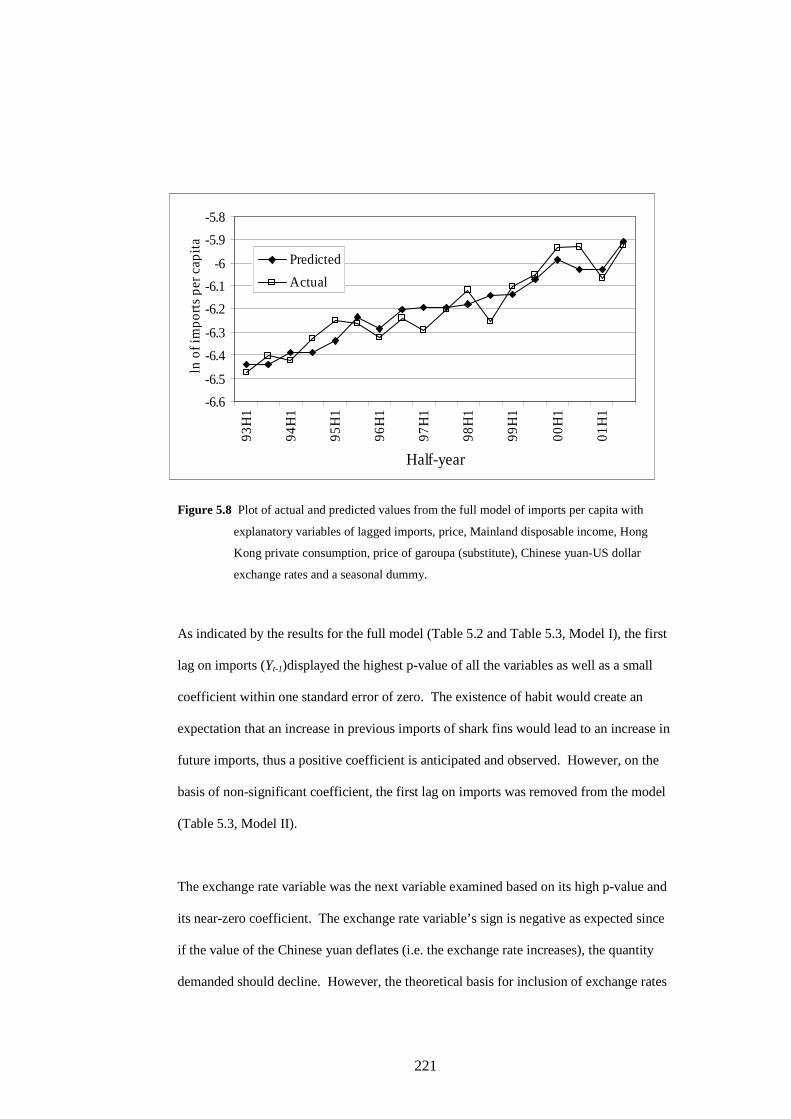
Figure 5.2 Quarterly imports of unprocessed shark fins to Hong Kong, 1992-2001, with
adjustments for double counting (Adjustment 1) and water content (Adjustment 2).
Date
0
500
1000
1500
2000
2500
3000
3500
11992
2 3 4 11993
2 3 4 11994
2 3 4 11995
2 3 4 11996
2 3 4 11997
2 3 4 11998
2 3 4 11999
2 3 4 12000
2 3 4 12001
2 3 4
mt
Unadjusted
Adjustment 1
Adjustment 2
208
In contrast to the annual data analysis presented in Chapter 4, when plotted on a quarterly
basis, these adjustments did not change the trends in the data. The quarterly data series
also differs from the annual series in displaying considerable short-term variability. This
variability could potentially arise from seasonal patterns of shark fishing (i.e. market
supply), spikes in demand preceding Chinese holidays such as the New Year festival, or
other factors.
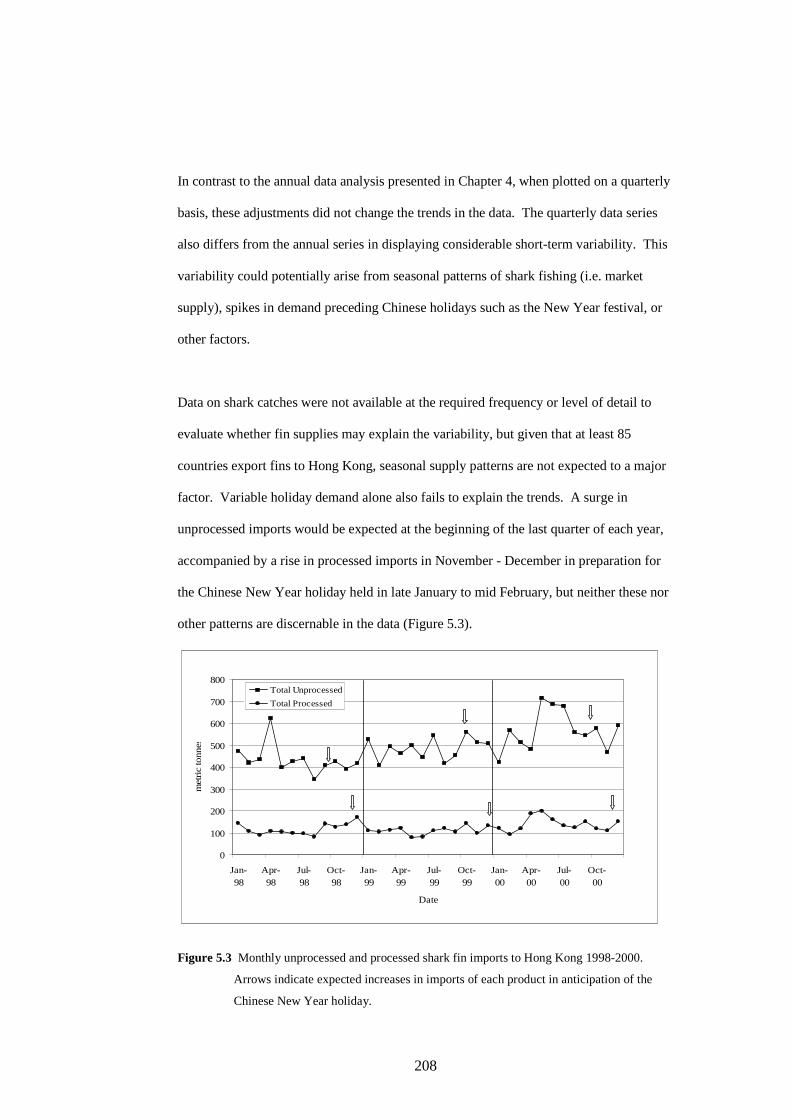
Data on shark catches were not available at the required frequency or level of detail to
evaluate whether fin supplies may explain the variability, but given that at least 85
countries export fins to Hong Kong, seasonal supply patterns are not expected to a major
factor. Variable holiday demand alone also fails to explain the trends. A surge in
unprocessed imports would be expected at the beginning of the last quarter of each year,
accompanied by a rise in processed imports in November - December in preparation for
the Chinese New Year holiday held in late January to mid February, but neither these nor
other patterns are discernable in the data (Figure 5.3).
0
100
200
300
400
500
600
700
800
Jan-98
Apr-98
Jul-98
Oct-98
Jan-99
Apr-99
Jul-99
Oct-99
Jan-00
Apr-00
Jul-00
Oct-00
Date
metric
tonnes
Total Unprocessed
Total Processed
Figure 5.3 Monthly unprocessed and processed shark fin imports to Hong Kong 1998-2000.
Arrows indicate expected increases in imports of each product in anticipation of the
Chinese New Year holiday.
209
Other factors contributing to variability may include customs enforcement. For example,
the particularly large variability in the second and third quarters of 2001 (Figure 5.2) is
known from interviews with traders to be the result of increased enforcement of customs
duties by Mainland officials in the first and second quarters, causing a backlog of
unprocessed fins in Hong Kong, and thereby slowing imports. By the third quarter,
traders reported they had re-opened channels for re-export of unprocessed fins to the
Mainland and resumed imports, possibly even increasing shipments to compensate as
indicated by the data. An additional erratic factor driving import patterns may be
weather. Shark fins require thorough sun-drying before shipment (if shipped in dried
form) and/or prior to processing (for both dried and frozen forms) therefore weather may
influence the quantities of fins available for shipment and ability of warehouses to
accommodate product stocks.
This variability in the regressand introduced by the use of quarterly data was initially a
concern since the regressors would not be expected to reflect any of the factors believed
to contribute to the variability. In such cases, dummy variables can be introduced to the
model if the variability follows a cyclic or otherwise distinct pattern, but apparent
patterns on which to base dummy variables were lacking. Therefore, further
agglomeration of the data to remove unnecessary noise in the trend was considered. Half-
yearly values were selected as the best option to balance the dampening of short-term
variation and the maintenance of sufficient degrees of freedom for the model.
Agglomeration from quarterly to half-yearly values followed the same guidelines
articulated above for compiling quarterly data from monthly data.
All financial data reported in nominal prices were adjusted for inflation using consumer
price indices (CPIs) with a common base year (1990). This technique sets the CPI in
1990 at a value of 100 and reflects all values in subsequent time periods as a proportional
210
change from the value in 1990. The figures representing proportional change are used as
deflators according to the following formula:
( ) tt
t ovdeflator
dv ×=100
1 (Eq. 5.2)
where dv is the deflated value,
ov is the original value, and
t is the time period.
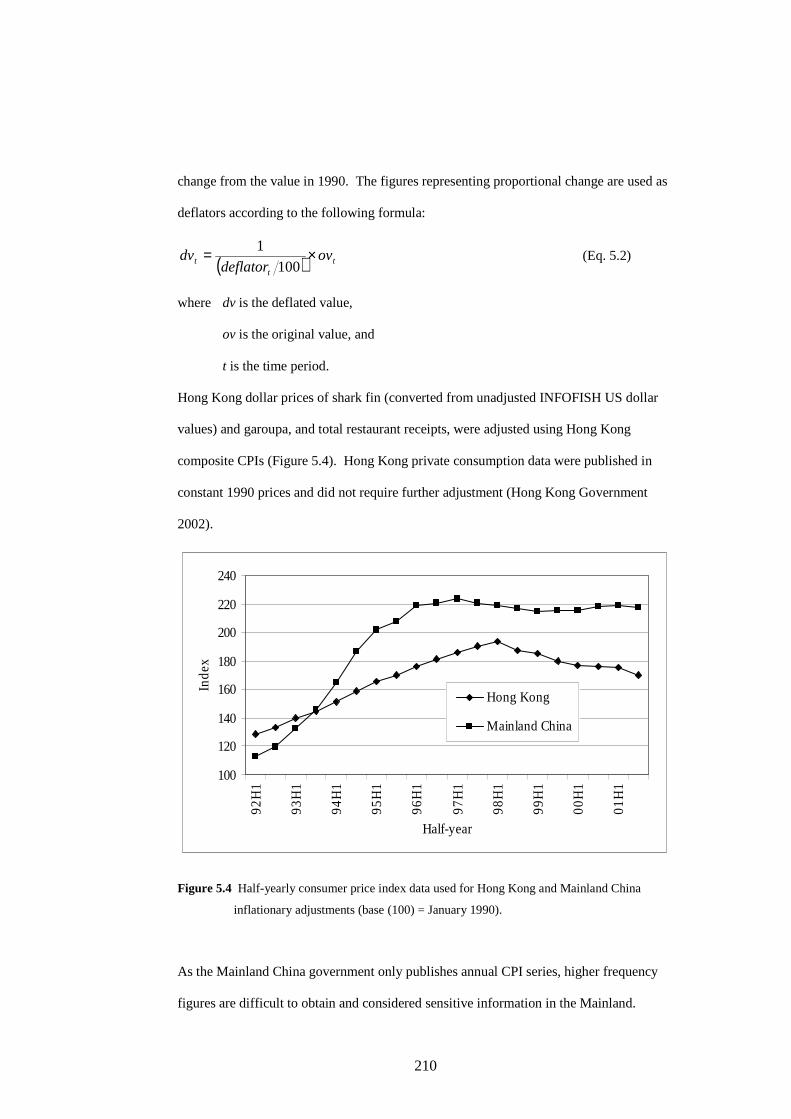
Hong Kong dollar prices of shark fin (converted from unadjusted INFOFISH US dollar
values) and garoupa, and total restaurant receipts, were adjusted using Hong Kong
composite CPIs (Figure 5.4). Hong Kong private consumption data were published in
constant 1990 prices and did not require further adjustment (Hong Kong Government
2002).
100
120
140
160
180
200
220
240
92
H1
93
H1
94
H1
95
H1
96
H1
97
H1
98
H1
99
H1
00
H1
01
H1
Half-year
Ind
ex
Hong Kong
Mainland China
Figure 5.4 Half-yearly consumer price index data used for Hong Kong and Mainland China
inflationary adjustments (base (100) = January 1990).
As the Mainland China government only publishes annual CPI series, higher frequency
figures are difficult to obtain and considered sensitive information in the Mainland.
211
Inflation indices for Chinese yuan prices in this study are based on unpublished data
obtained from a major international financial organization on a confidential basis (Figure
5.4). Adjustments were applied to Mainland per capita disposable income and food
services receipts according to Equation 5.2. The substantial rise in the Mainland China
consumer price index between 1994 and 1996 corresponds to a period of structural
inflation and monetary crisis led by food price increases, producing inflationary effects
common in transitional economies (Chang and Hou 1997).
A final adjustment was applied to convert some data series to per capita units. This
adjustment was necessary to standardize those Hong Kong and Mainland China variables
which were expected to trend upwards with increasing population, and to provide an
equal basis for comparison with Mainland China disposable income data that are reported
in per capita units. Private consumption and restaurant receipts for Hong Kong, and retail
food expenditures in the Mainland, were converted to per capita values using Hong Kong
or Mainland China (i.e. People’s Republic of China excluding Hong Kong) population
Figure 5.5 Half-yearly adjusted imports of unprocessed shark fin to Hong Kong in grams per
capita.
0
0.5
1
1.5
2
2.5
3
92H
1
93H
1
94H
1
95H
1
96H
1
97H
1
98H
1
99H
1
00H
1
01H
1
g pe
r ca
pita
Half-year
212
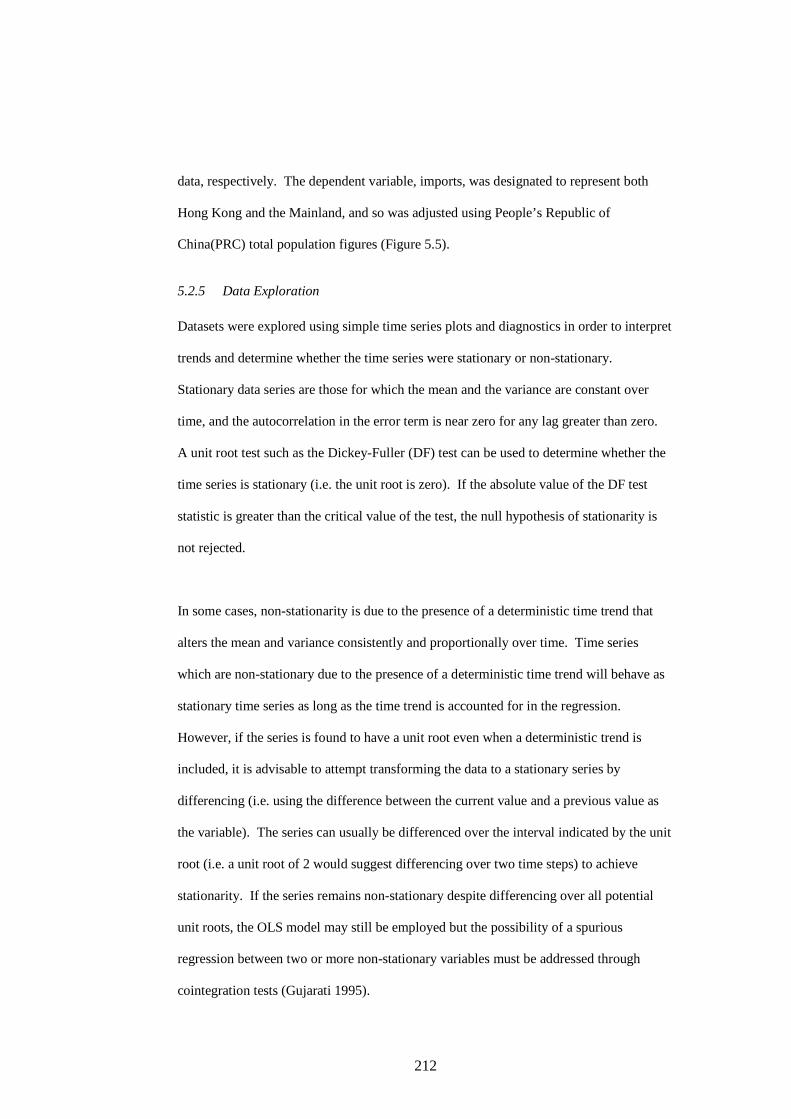
data, respectively. The dependent variable, imports, was designated to represent both
Hong Kong and the Mainland, and so was adjusted using People’s Republic of
China(PRC) total population figures (Figure 5.5).
5.2.5 Data Exploration
Datasets were explored using simple time series plots and diagnostics in order to interpret
trends and determine whether the time series were stationary or non-stationary.
Stationary data series are those for which the mean and the variance are constant over
time, and the autocorrelation in the error term is near zero for any lag greater than zero.
A unit root test such as the Dickey-Fuller (DF) test can be used to determine whether the
time series is stationary (i.e. the unit root is zero). If the absolute value of the DF test
statistic is greater than the critical value of the test, the null hypothesis of stationarity is
not rejected.
In some cases, non-stationarity is due to the presence of a deterministic time trend that
alters the mean and variance consistently and proportionally over time. Time series
which are non-stationary due to the presence of a deterministic time trend will behave as
stationary time series as long as the time trend is accounted for in the regression.
However, if the series is found to have a unit root even when a deterministic trend is
included, it is advisable to attempt transforming the data to a stationary series by
differencing (i.e. using the difference between the current value and a previous value as
the variable). The series can usually be differenced over the interval indicated by the unit
root (i.e. a unit root of 2 would suggest differencing over two time steps) to achieve
stationarity. If the series remains non-stationary despite differencing over all potential
unit roots, the OLS model may still be employed but the possibility of a spurious
regression between two or more non-stationary variables must be addressed through
cointegration tests (Gujarati 1995).
213
The time series for the dependent variable, imports per capita (Figure 5.5), was non-
stationary in log form based on the Dickey-Fuller (DF) test for time series with and
without trends and up to four lags (unit root of order 4) (DF test statistic of |-1.29| < DF
critical value of |-3.08| for no trend and DF test statistic of |-3.52| < DF critical value of |-
3.76| for trended). Differencing was explored for this and all other non-stationary time
series identified below, but a clear unit root could not be identified for any of the non-
stationary series, and stationarity could not be achieved.
The explanatory variables representing income and spending were also examined (Figure
5.6). Mainland disposable income per capita, which shows anomalously high values in
January or February each year due to Chinese New Year bonuses when plotted on a
monthly or quarterly basis, showed a more stable upward trend when plotted on a half-
yearly basis. Hong Kong private consumption data indicates that spending is highest in
the fourth quarter of each year contributing to higher half-yearly values in the second half
of each year, perhaps reflecting anticipation of the Lunar New Year holiday. Mainland
retail food expenditure data were not available prior to 1994 but also showed higher
second half spending possibly resulting from restaurant closures during the Chinese New
Year affecting first half receipts. The value of Hong Kong restaurant receipts declined
during the period without demonstrating seasonal trends. In both of the Hong Kong
datasets, the effects of the Asian financial crisis are visible beginning in early 1998. The
Asian financial crisis did not exert as strong an influence on the Mainland economy
(Wang 1999) and its effects are not apparent in either of the Mainland datasets.
In terms of stationarity, the Mainland disposable income data series was stationary in log
form when a trend was included (|-8.18| > |-3.76|), as was the log form of the Mainland
food expenditure time series (|-8.56| > |-3.76|). Hong Kong private consumption and
Hong Kong restaurant receipts in log form were non-stationary both with (|-2.82| < |-3.76|
214
and |-2.31| < |-3.76|) and without a trend (|-2.93| < |-3.08| and |-2.92| < |-3.08|),
respectively.
Figure 5.6 Time series for Hong Kong and Mainland variables relating to income and consumer
spending at half-yearly intervals. All data are in constant 1990 prices. Mainland data
were compiled for urban areas only.
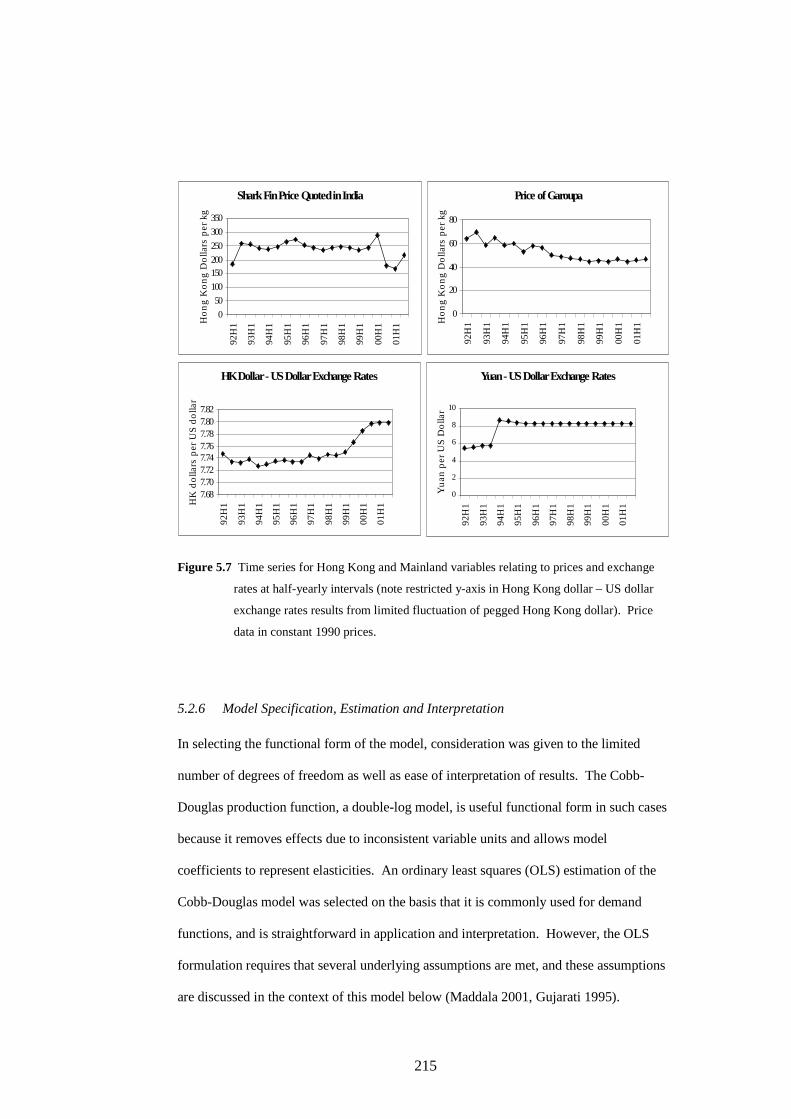
Plots of the other explanatory variables illustrate less strongly trended time series (Figure
5.7). Prices of shark fin show no clear time trend and cannot be interpreted using existing
information. The price data series is non-stationary in log form (DF of |-2.34| < |-3.08|
with no trend). Chinese yuan to United States (US) dollar exchange rates exhibit a step
function reflecting China’s scrapping of separate foreign exchange currency in January
1994 (Kaye 1994) and are stationary (DF of |-6.08| < |-3.76| with no trend). Prices of the
substitute good, garoupa, decline with time and are non-stationary in log form (DF of |-
1.55| < |-3.76| with a trend, DF of |-2.34| < |-3.08| with no trend). Hong Kong dollar to
US dollar exchange rates show a pronounced increase over the period 1999-2000,
however the net change is very small due to a peg between the two currencies (Kueh and
Ng 2002) and the series is non-stationary (DF of |-1.24| < |-3.76| with a trend, DF of
|-0.56| < |-3.08| with no trend).
Mainland Disposable Income
0
0.5
1
1.5
2
2.5
92
H1
93
H1
94
H1
95
H1
96
H1
97
H1
98
H1
99
H1
00
H1
01
H1
'000
Yu
an
pe
r C
ap
ita p
er
Ha
lf-Ye
ar
Mainland Retail Food Expenditure
0
20
40
60
80
100
94
H1
95
H1
96
H1
97
H1
98
H1
99
H1
00
H1
01
H1
Yua
n p
er
Ca
pita
pe
r H
alf-
Ye
ar
Hong Kong Private Consumption
25
30
35
40
45
92
H1
93
H1
94
H1
95
H1
96
H1
97
H1
98
H1
99
H1
00
H1
01
H1
HK
$ '0
00 p
er
Ca
pita
pe
r H
alf-
Yea
r
Hong Kong Restaurant Receipts
1.5
2
2.5
3
3.5
92
H1
93
H1
94
H1
95
H1
96
H1
97
H1
98
H1
99
H1
00
H1
01
H1
'000
HK
$ p
er
Ca
pita
pe
r H
alf-
Yea
r
215
Figure 5.7 Time series for Hong Kong and Mainland variables relating to prices and exchange
rates at half-yearly intervals (note restricted y-axis in Hong Kong dollar – US dollar
exchange rates results from limited fluctuation of pegged Hong Kong dollar). Price
data in constant 1990 prices.
5.2.6 Model Specification, Estimation and Interpretation
In selecting the functional form of the model, consideration was given to the limited
number of degrees of freedom as well as ease of interpretation of results. The Cobb-
Douglas production function, a double-log model, is useful functional form in such cases
because it removes effects due to inconsistent variable units and allows model
coefficients to represent elasticities. An ordinary least squares (OLS) estimation of the
Cobb-Douglas model was selected on the basis that it is commonly used for demand
functions, and is straightforward in application and interpretation. However, the OLS
formulation requires that several underlying assumptions are met, and these assumptions
are discussed in the context of this model below (Maddala 2001, Gujarati 1995).
Shark Fin Price Quoted in India
0
50
100
150200
250
300
350
92H
1
93H
1
94H
1
95H
1
96H
1
97H
1
98H
1
99H
1
00H
1
01H
1Ho
ng
Ko
ng
Do
llars
pe
r kg
Price of Garoupa
0
20
40
60
80
92H
1
93H
1
94H
1
95H
1
96H
1
97H
1
98H
1
99H
1
00H
1
01H
1Ho
ng
Ko
ng
Do
llars
pe
r kg
HK Dollar - US Dollar Exchange Rates
7.687.707.727.747.767.787.807.82
92
H1
93
H1
94
H1
95
H1
96
H1
97
H1
98
H1
99
H1
00
H1
01
H1H
K d
olla
rs p
er
US
do
llar
Yuan - US Dollar Exchange Rates
0
2
4
6
8
10
92
H1
93
H1
94
H1
95
H1
96
H1
97
H1
98
H1
99
H1
00
H1
01
H1
Yu
an
pe
r U
S D
olla
r
216
OLS models require that all variables must be exogenous, or independent of each other.
This is considered to be true for price variables utilised in this study on the basis that the
shark fin market fits the definition of a perfectly competitive market2, and thus prices are
neither determined by, nor a determinant of, other variables. The shark fin market is also
small in scale relative to the economy of Hong Kong and the Mainland; it is thus not
expected to influence measures of consumer spending such as restaurant receipts,
disposable income or private consumption.
Another concern when using an OLS model is that there is no autocorrelation (serial
correlation) between the explanatory variables and the error term of the model. This is
particularly important in autoregressive specifications (i.e. where a lagged value of the
dependent variable is used as an explanatory variable) and special tests are required to
distinguish this form of autocorrelation. If such a correlation is observed, the OLS model
cannot be validly applied. Since most economic time series exhibit a high degree of
correlation between successive values, autocorrelation within individual time series is
often another major concern.
Perhaps the most critical assumption of the OLS estimation is that the data series are
stationary. If the data series are non-stationary, the regression may be spurious due to
violation of the OLS assumption of homoscedasticity of variance. It is, however, possible
to apply non-stationary variables in the regression model as long as the residuals of the
model are stationary. In this case, the regression is considered to be cointegrated and not
spurious.
2 A market is considered to be perfectly competitive when four conditions hold: 1) there are many buyers and sellers; 2) there are no different product brands; 3) there is free entry and exit; and 4) consumers and sellers are considered to have perfect information about the product and the market price (Eastwood 1985).
217
The theoretical model defined in Equation 5.1 was specified using the OLS estimation of
the Cobb-Douglas model, and the available datasets, as follows:
utttttttttt eDESCIPYYY 108764321
210βββββββββ −−= (Eq. 5.3)
where Y is per capita imports of adjusted unprocessed shark fin to Hong Kong,
P is price of shark fin delivered to Hong Kong,
I is Mainland disposable income per capita,
C is Hong Kong private consumption per capita
S is the retail price of garoupa in Hong Kong,
E is the exchange rate for Chinese yuan against the US dollar,
D is a seasonal dummy for the first half of each year,
e is the base of the natural logarithm,
u is the stochastic disturbance term,
subscript t indicates the time period, and
� represents constants such as the intercept and variable coefficients.
Log-transforming this model gives the functional form applied here:
tttt
tttttt
uDES
CIPYYY
+++++++++= −−
876
54322110
)ln(
)ln()ln()ln()ln()ln(ln
βββββββββ
All variables were transformed by natural logarithm except for exchange rates (E), which
already represent rates, and the dummy variable (D) which is a constant (0 or 1). The
coefficients of E and D therefore represent semi-elasticities rather than elasticities.
This approach begins with a general model which is iteratively simplified until only
essential explanatory variables remain. This model does not, however, specify lags on all
variables due to the potential for double-counting the effects of a single explanatory
(Eq. 5.4)
218
variable by including it more than once in the general model. First and second order lags
on imports (Y) were however specified, based on theory, to account for the potential
effects of consumer purchasing habits, or trader stocking contracts or routines. Based on
the observed rapid turn-over of inventory in the shark fin market, and the half-yearly
periodicity of the data, two lags on imports (Y) were considered sufficient.
This model assigns separate variables to represent income or spending in Mainland China
(I) and Hong Kong (C). The use of these variables and also restaurant receipts in either
economy would violate economic theory, as well as the assumption of exogeneity, due to
double-counting of spending and an expected correlation between income/spending and
restaurant spending. Therefore, only Mainland disposable income and Hong Kong
private consumption were selected for the model as they better represent broad economic
trends and are available for the full period 1992-2001. Although one variable is a
measure of income (I) and the other is a measure of spending (C), they are indicators in
separate economies and are not expected to be correlated. The dummy variable (D) was
included in the model to account for observed seasonal cycles in Mainland disposable
income and Hong Kong private consumption.
Single price variables for shark fin (P) and the substitute (S) were specified since there is
considered to be a single supply chain for these products extending through Hong Kong
and the Mainland. However, to allow for potential disparities in purchasing power
between the two economies, a variable representing exchange rates was included in the
model (E). Given the currency peg between the US dollar and the Hong Kong dollar, it
was considered that fluctuations between these two currencies need not be accounted for,
therefore only Chinese yuan to US dollar exchange rates were included in the model.
219
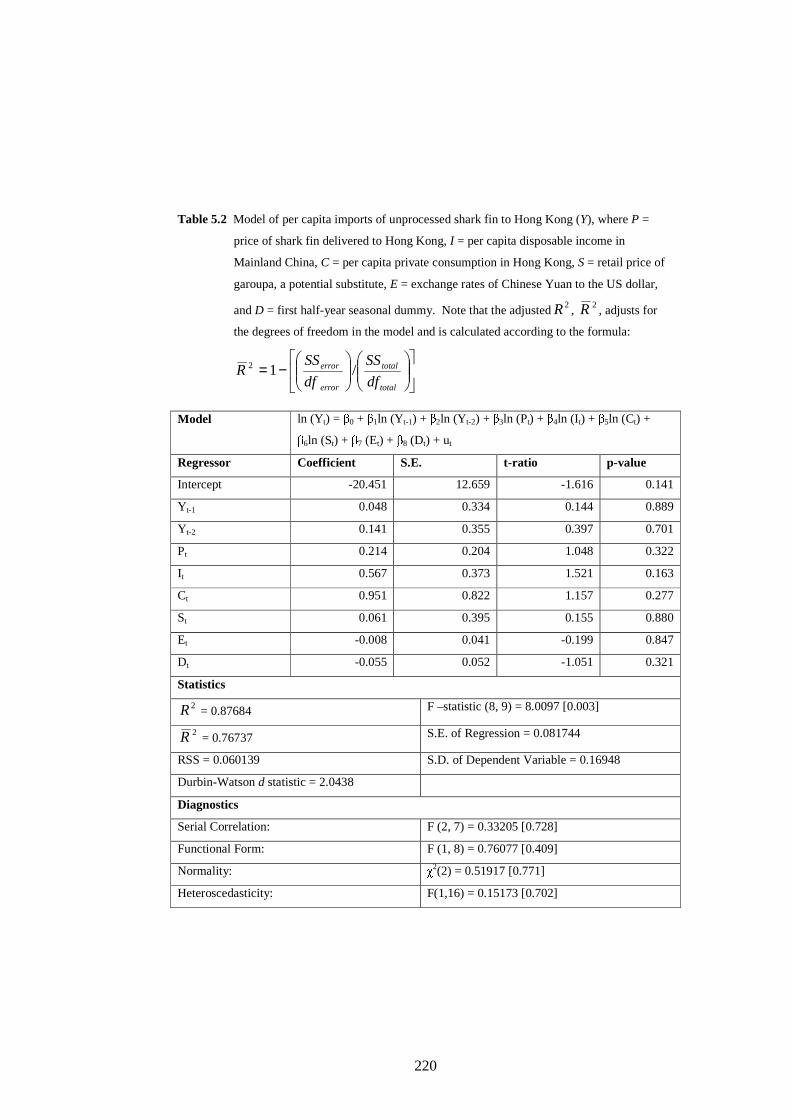
This model was tested against the data using Microfit (v. 4.0) software (Pesaran and
Pesaran 1997). The results indicated the model was significant and demonstrated no
misspecification errors (Table 5.2). A plot of actual and predicted values indicates that
the model fits the long-term trend in the data but does not always predict the short-term
variations in demand (Figure 5.8). The difference between the r-squared (0.88) and
adjusted r-squared (0.77) values indicates that this general model is over parameterized,
since the goodness of fit statistic decreases when the degrees of freedom in the model is
taken into account.
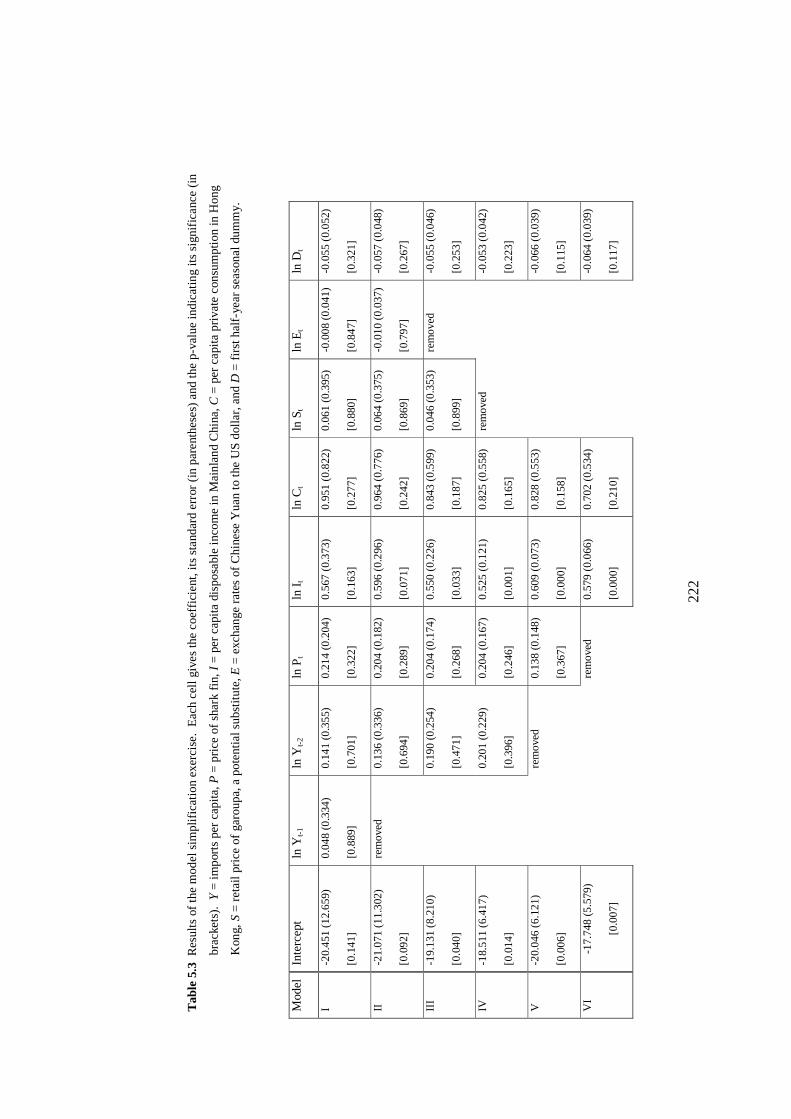
None of the coefficients in the model are statistically significant (Table 5.2). This result
suggests that either none of the explanatory variables are informative, or unnecessary
variables in the model are obscuring the influence of actual determinants. The latter
possibility was investigated by iteratively removing variables with large (non-significant)
probabilities, small coefficients, and/or for which the theoretical basis for variable
inclusion was weak, following a modified Hendry approach (Hendry and Richards 1983).
After each iteration, the model was re-tested for validity and misspecification errors using
F-tests for serial correlation, functional form, and heteroscedasticity, and �2 tests for
normality. Durbin’s h test was also applied to test for serial correlation between the
dependent variable and its lags, which if present would violate the assumption of
exogeneity. The model simplification exercise did not proceed if any of the tests
indicated significant violations of the assumptions.
220
Table 5.2 Model of per capita imports of unprocessed shark fin to Hong Kong (Y), where P =
price of shark fin delivered to Hong Kong, I = per capita disposable income in
Mainland China, C = per capita private consumption in Hong Kong, S = retail price of
garoupa, a potential substitute, E = exchange rates of Chinese Yuan to the US dollar,
and D = first half-year seasonal dummy. Note that the adjusted 2R , 2R , adjusts for
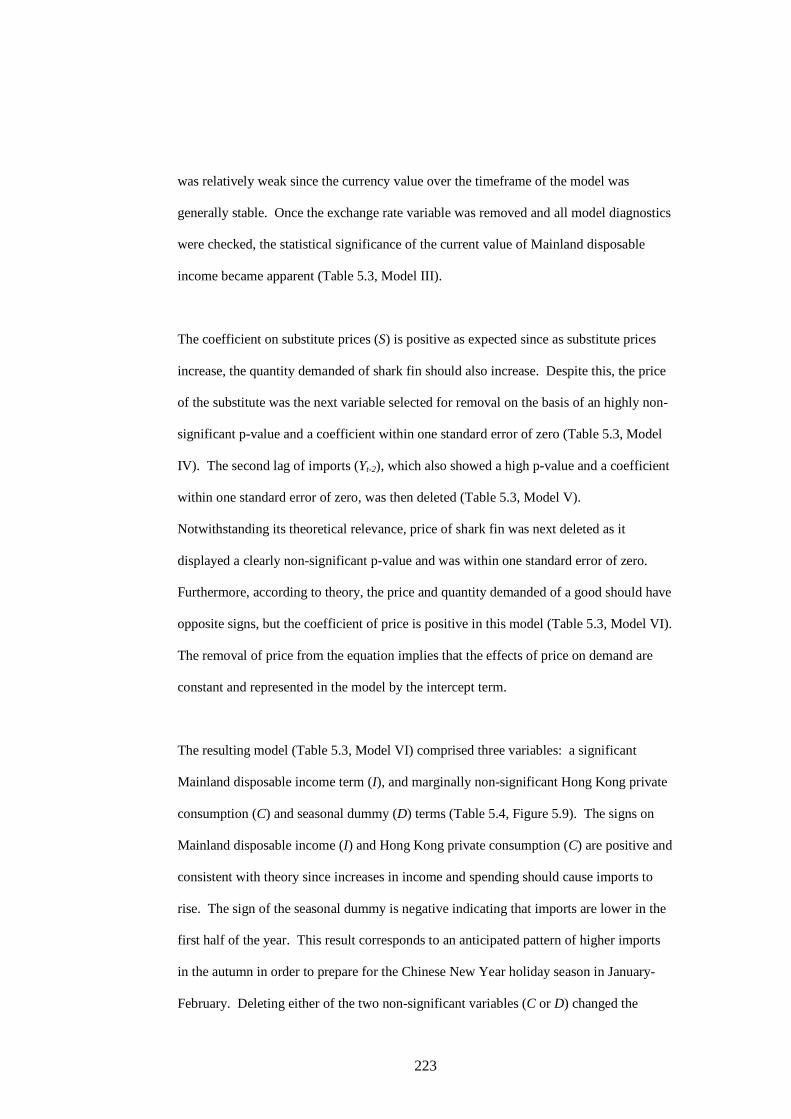
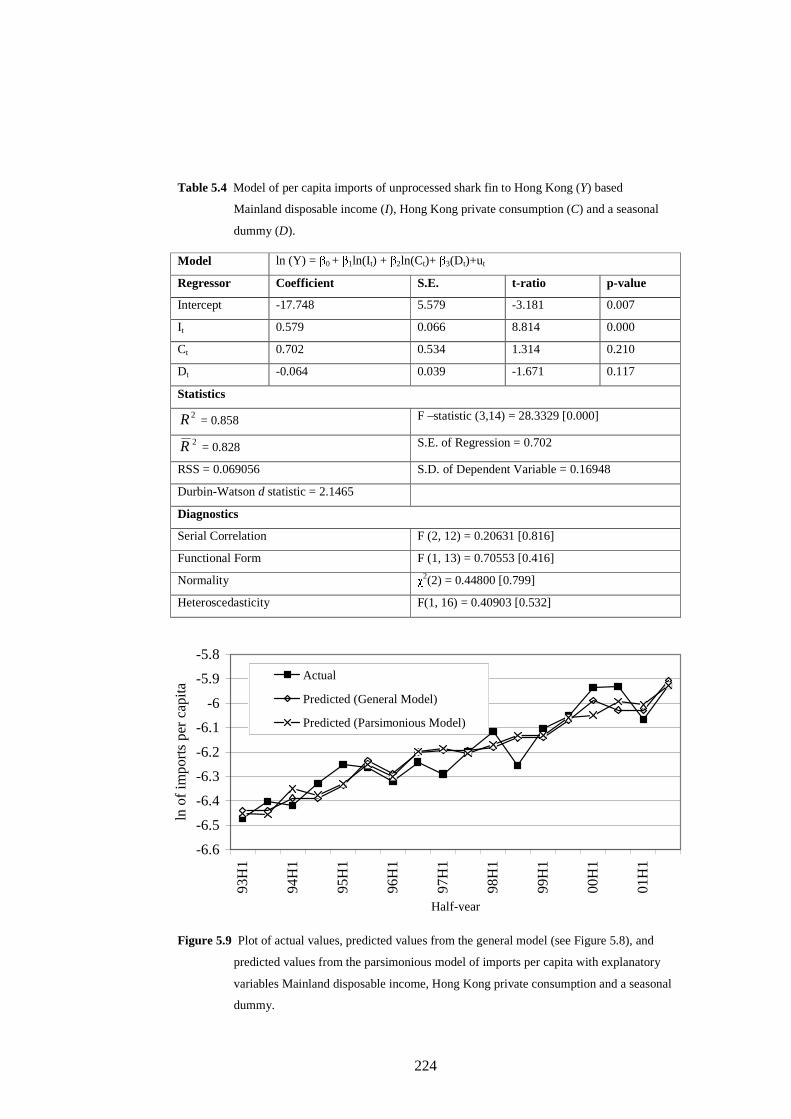
the degrees of freedom in the model and is calculated according to the formula: