122 5 EQ1: Production and supply to / demand from dairies Raw milk production represents the first stage of the dairy supply chain (see section 4.2). It is used by all the other parts of the chain and hence is affected indirectly by all factors that affect one or another part of the supply chain. The evaluation of the impact of CAP measures on raw milk production and supply takes into account policies that targeted raw milk production directly (for example, expansion of production quotas for milk deliveries) but also policies that were directed to other downstream segments of the supply chain. A. EQ1a: Production and supply to / demand from dairies (market balance) To what extent have the CAP measures applicable to the dairy sector contributed to balancing supply and demand for milk? 5.1 Interpretation and comprehension of the key terms of the EQ1a The key terms in this evaluation question are supply, demand and balance. We interpret supply as milk that leaves the farm, that is milk production minus on-farm use and losses, which is equivalent to the sum of the volumes delivered to dairies and sold directly off farms. The demand for milk is a derived demand − it depends on the demand for the dairy products that has been obtained from the milk and is properly assessed at the moment where it is demanded by an end-user − the final consumer. We interpret ‘demand for milk’ as the demand for the final consumption of milk as embodied in all its derived products, and at the point where it becomes final domestic consumption or export use. In a managed market, balance can be defined in different ways, which require careful definition. ‘Structural balance’ holds when the quantity supplied is matched by the amounts demanded for final use by consumers and export markets without any policy measures being required to stimulate or create this demand. Clearly, the concept of an absolute level of structural balance has no sense, since both sides of the balance are responsive to price. In the case of the EU market for milk, as long as the quantity supplied is – more or less - fixed by quota and imports under TRQs, and if prices are not perfectly free to adjust to clear markets without government assistance, then it is quite possible to have a structural imbalance, leading to a structural excess supply. A second concept of balance, market balance, is achieved when no aids to final demand and no policy- managed stocking or de-stocking are needed to maintain an acceptable price level in the short term. The market surplus is defined as the structural surplus plus the net change in stocks used for the purpose of smoothing prices. Stock changes temporarily remove or re-supply products from and to the market so that it balances at a more stable price than would otherwise be the case, but they are not part of final demand. Over a period of years, the underlying trends in structural excess supply and market surplus are the same. The analysis below focuses on the concepts of structural balance and structural excess supply. Their exact definitions are given in the following section.
Transcript
122
5 EQ1: Production and supply to / demand from dairies
Raw milk production represents the first stage of the dairy supply chain (see section 4.2). It is used by
all the other parts of the chain and hence is affected indirectly by all factors that affect one or another
part of the supply chain. The evaluation of the impact of CAP measures on raw milk production and
supply takes into account policies that targeted raw milk production directly (for example, expansion of
production quotas for milk deliveries) but also policies that were directed to other downstream segments
of the supply chain.
A. EQ1a: Production and supply to / demand from dairies (market balance)
To what extent have the CAP measures applicable to the dairy sector contributed to balancing supply and
demand for milk?
5.1 Interpretation and comprehension of the key terms of the EQ1a
The key terms in this evaluation question are supply, demand and balance. We interpret supply as milk
that leaves the farm, that is milk production minus on-farm use and losses, which is equivalent to the
sum of the volumes delivered to dairies and sold directly off farms. The demand for milk is a derived
demand − it depends on the demand for the dairy products that has been obtained from the milk and is
properly assessed at the moment where it is demanded by an end-user − the final consumer. We
interpret ‘demand for milk’ as the demand for the final consumption of milk as embodied in all its derived
products, and at the point where it becomes final domestic consumption or export use.
In a managed market, balance can be defined in different ways, which require careful definition.
‘Structural balance’ holds when the quantity supplied is matched by the amounts demanded for final use
by consumers and export markets without any policy measures being required to stimulate or create this
demand. Clearly, the concept of an absolute level of structural balance has no sense, since both sides of
the balance are responsive to price. In the case of the EU market for milk, as long as the quantity
supplied is – more or less - fixed by quota and imports under TRQs, and if prices are not perfectly free to
adjust to clear markets without government assistance, then it is quite possible to have a structural
imbalance, leading to a structural excess supply.
A second concept of balance, market balance, is achieved when no aids to final demand and no policy-
managed stocking or de-stocking are needed to maintain an acceptable price level in the short term. The
market surplus is defined as the structural surplus plus the net change in stocks used for the purpose of
smoothing prices. Stock changes temporarily remove or re-supply products from and to the market so
that it balances at a more stable price than would otherwise be the case, but they are not part of final
demand. Over a period of years, the underlying trends in structural excess supply and market surplus
are the same.
The analysis below focuses on the concepts of structural balance and structural excess supply. Their
exact definitions are given in the following section.
123
5.2 Methodology used for answering EQ1a: market balance
As explained in Chapter 4, balance between supply and demand is established more or less automatically
in a market with perfect competition where prices and quantities are free to adjust. However, if prices
and quantities are not free to adjust, then imbalances are very likely to occur.
Structural balance for EU raw milk is given by equation (1):
Total supply onto the EU market on the left-hand side of equation (1) depends on policy measures
affecting the domestic supply of milk (or its constituents) such as the milk quota ceiling, while imports
also depend on trade policies (see also discussion in the Theoretical analysis, Chapter 1). Although there
is hardly any trade in raw milk, all processed dairy products are traded on international markets.
Without demand management policies, total supply has to be absorbed spontaneously by final demand
outlets. This occurs if the pressure of supply is allowed to drive prices down, thereby inducing an
increase in demand (and/or a decrease in supply if supply is not fixed), until demand absorbs the supply
that is offered.30 Given the current milk-producing capacity in the EU and current demand levels,
achieving structural balance without changing the left-hand side of (1) would mean a substantial
lowering of the level of market price.31 If this is considered to be unacceptable, policy measures can be
used that boost the demand side of (1).
CAP policies to increase market off-take influence various segments of dairy demand. They are:
• domestic consumption aid programmes for dairy products (for example, disposal aid for butter,
school milk programme32)
• subsidies on exports
All these measures play a role in determining the structural excess supply of milk. This is summarised in
equation (2):
In addition, some CAP measures withhold products from the market temporarily, namely
• net intervention (public) stocks and subsidised private storage
30 This is a medium-term concept, since the first three terms are fairly stable over time. Demand for unsubsidised exports may be more variable, given exchange rate variations and so on. Therefore, a public stockholding facility that buys on the domestic market if price dips and sells when it is restored, may be used to smooth fluctuations in domestic price. The use of such a mechanism is compatible with medium-term structural balance as long as the average level of stocks is constant over the medium term (and net stock changes average to zero in the medium term. 31 This statement assumes that demand conditions (on EU and world markets) remain unchanged. During 2007-2008 world market demand temporarily increased dramatically, forcing up the world market price and the EU price also, so that even with higher prices the structural excess supply fell. In the longer term, with population growth and hence growing internal demand, reducing the structural surplus can be achieved without lowering prices as much as with no internal demand growth. In both these example, the price increase is demand-led. 32 The school milk programme is not under evaluation in this report.
Structural balance occurs when
EU domestic supply + imports = unsubsidised EU consumption + unsubsidised exports (1)
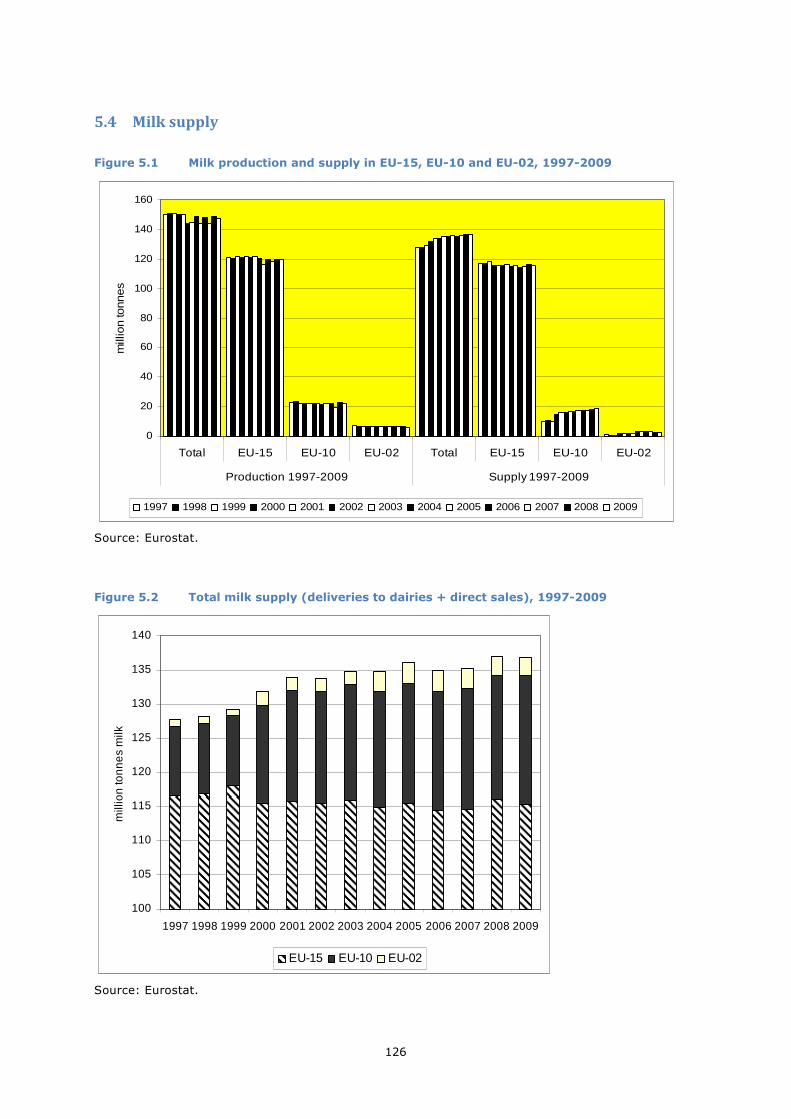
Figure 5.1 shows the evolution of domestic milk production and supply in the different parts of the EU. It
should be borne in mind when interpreting the amounts shown as ‘total’ (the sum of quantities over the
three country groups) that the countries of EU-10 entered the Union only in 2004 and those of EU-02 in
2007. Their participation in the CAP dates from the year of their accession, and prior to their entry their
production and supply were not part of the respective EU totals. The figures for their production and
supply are shown for the entire period in order to provide a perspective.
From 2004 onwards, EU-15 production and supply were on average about 2.2 million tonnes and 1.2
million tonnes lower, respectively, than in the 7-year period before 2004. The increasing supply of the
accession countries from 1997 onwards is due to the decline in subsistence milk production and the
increasing integration of milk production in these countries into organised supply chains.
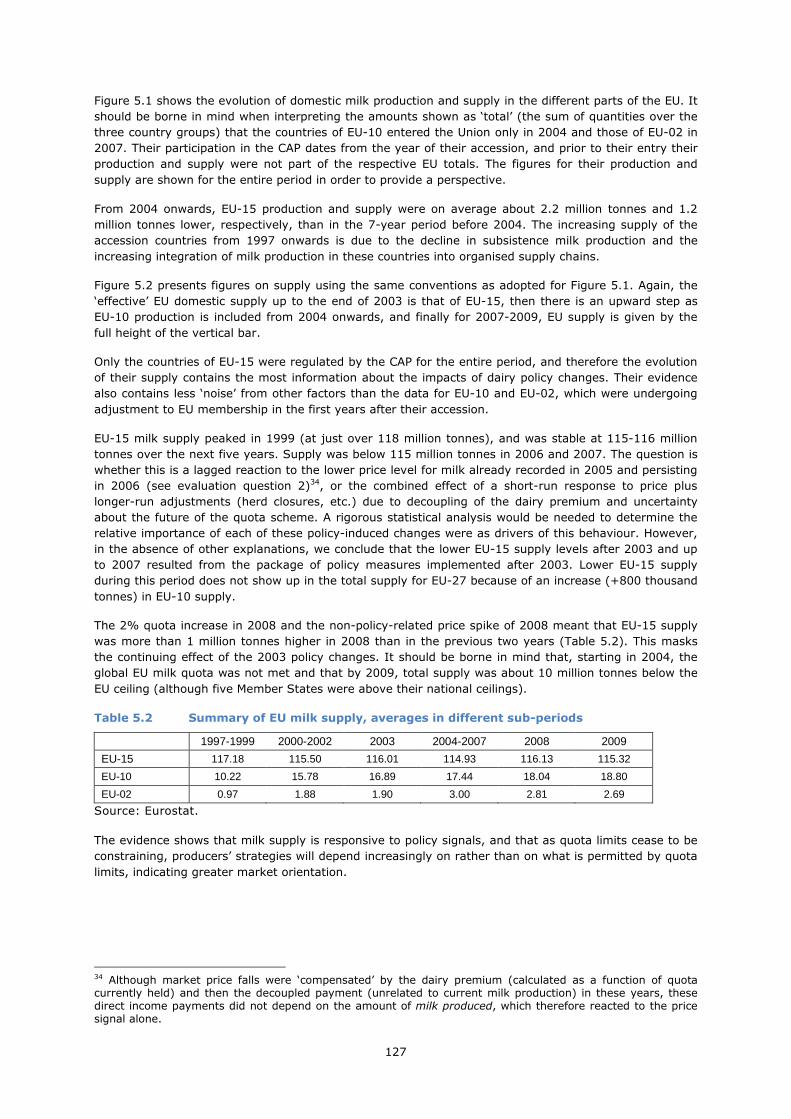
Figure 5.2 presents figures on supply using the same conventions as adopted for Figure 5.1. Again, the
‘effective’ EU domestic supply up to the end of 2003 is that of EU-15, then there is an upward step as
EU-10 production is included from 2004 onwards, and finally for 2007-2009, EU supply is given by the
full height of the vertical bar.
Only the countries of EU-15 were regulated by the CAP for the entire period, and therefore the evolution
of their supply contains the most information about the impacts of dairy policy changes. Their evidence
also contains less ‘noise’ from other factors than the data for EU-10 and EU-02, which were undergoing
adjustment to EU membership in the first years after their accession.
EU-15 milk supply peaked in 1999 (at just over 118 million tonnes), and was stable at 115-116 million
tonnes over the next five years. Supply was below 115 million tonnes in 2006 and 2007. The question is
whether this is a lagged reaction to the lower price level for milk already recorded in 2005 and persisting
in 2006 (see evaluation question 2)34, or the combined effect of a short-run response to price plus
longer-run adjustments (herd closures, etc.) due to decoupling of the dairy premium and uncertainty
about the future of the quota scheme. A rigorous statistical analysis would be needed to determine the
relative importance of each of these policy-induced changes were as drivers of this behaviour. However,
in the absence of other explanations, we conclude that the lower EU-15 supply levels after 2003 and up
to 2007 resulted from the package of policy measures implemented after 2003. Lower EU-15 supply
during this period does not show up in the total supply for EU-27 because of an increase (+800 thousand
tonnes) in EU-10 supply.
The 2% quota increase in 2008 and the non-policy-related price spike of 2008 meant that EU-15 supply
was more than 1 million tonnes higher in 2008 than in the previous two years (Table 5.2). This masks
the continuing effect of the 2003 policy changes. It should be borne in mind that, starting in 2004, the
global EU milk quota was not met and that by 2009, total supply was about 10 million tonnes below the
EU ceiling (although five Member States were above their national ceilings).
Table 5.2 Summary of EU milk supply, averages in different sub-periods
1997-1999 2000-2002 2003 2004-2007 2008 2009
EU-15 117.18 115.50 116.01 114.93 116.13 115.32
EU-10 10.22 15.78 16.89 17.44 18.04 18.80
EU-02 0.97 1.88 1.90 3.00 2.81 2.69
Source: Eurostat.
The evidence shows that milk supply is responsive to policy signals, and that as quota limits cease to be
constraining, producers’ strategies will depend increasingly on rather than on what is permitted by quota
limits, indicating greater market orientation.
34 Although market price falls were ‘compensated’ by the dairy premium (calculated as a function of quota currently held) and then the decoupled payment (unrelated to current milk production) in these years, these direct income payments did not depend on the amount of milk produced, which therefore reacted to the price signal alone.
128
5.5 Structural excess supply and market surplus for fat, protein and other non-
fat solids
Table 5.3 presents the structural excess supply in terms of fat, protein and other non-fat solid
components and in raw milk equivalent.
Table 5.3 Market and structural excess supply for the milk components and milk equivalents, EU-15/25/27, 2000-2009, 1,000 t
SES as % of total supply 10.9 8.4 11.1 10.3 9.7 8.9 6.9 2.0 0.1 3.6
Notes: 1) For 2000-2003: EU-15, for 2004-2006: EU-25, and for 2007-2009: EU-27. 2) The data used for the calculations are presented in Table 2.49 for the disposal aid of butter, Figure 2.8 for the closing (public) intervention stocks. The change in private stocks aided by the EU for butter and SMP are taken from DG AGRI (various years). The subsidised exports refer to calendar years (DG AGRI, unpublished). The fat and protein composition of those products is taken from Eurostat. The non-fat solid composition is taken from IDF (2004).
129
Table 5.3 shows that the structural excess supply was positive in all years between 2000 and 2009 both
in milk equivalent and for fat, protein and other non-fat solids. Thus, given the level of policy-maintained
price support, the EU was producing more milk, and more of all the main milk components, than the
domestic and world market could absorb without the use of subsidies. The milk equivalent structural
excess supply peaked in 2002, but by 2004-2005 it was back at its 2000 level of between 8 and 9 million
tonnes. In 2006, structural excess supply of milk equivalent was lower than it had been since the
beginning of the decade, in 2007 it stood at less than 2 million tonnes, and was just 60 thousand tonnes
in 2008. Despite a considerable rise in 2009, this was the second-lowest level of the structural excess
supply in milk equivalent of the ten years shown. The changes after 2006 were primarily because of
changes in the structural excess supply of fat, and this was because of the higher unsubsidised
consumption and unsubsidised exports of butter.
Figure 5.3 Structural excess supply of fat, protein, other non-fat solids and milk-equivalent as % of total supply, 2000-2009
0
2
4
6
8
10
12
14
16
18
2000 2001 2002 2003 2004 2005 2006 2007 2008 2009
per
cent
Fat Protein Other non-fat solids Milk equivalent
Source: see footnote to Table 5.3.
Figure 5.3 emphasises that, relative to a situation of structural balance, fat is the milk component whose
structural excess supply relative to total supply was the greatest for most of the period. Its highest value
occurred in 2002, at over 16% of total supply. Other non-fat solids had consistently the smallest excess
structural supply relative to a situation of balance throughout the period. It is stressed that structural
excess supply must not be interpreted as showing an excess over self-sufficiency levels. Rather, they
reflect the excess over what the domestic and international markets can absorb without the use of
disposal measures.
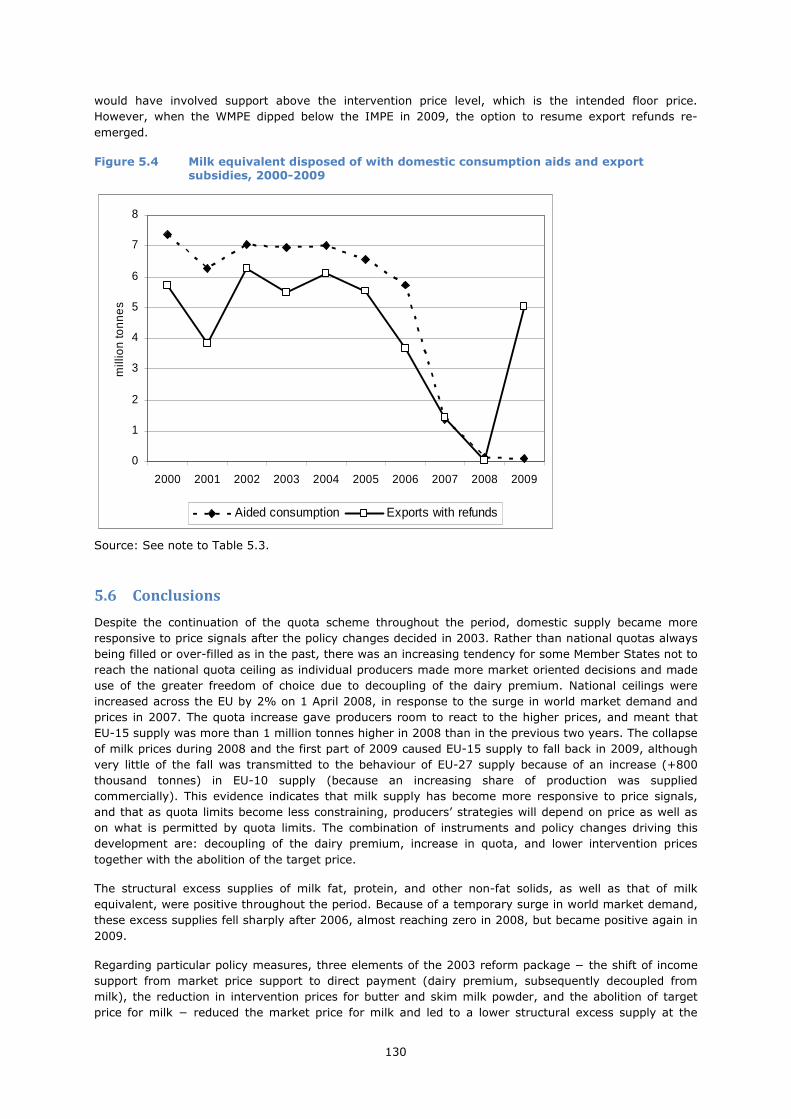
Up to 2006, aid to domestic consumption was used to dispose of larger quantities of the excess supply
than export refunds, and its year to year use was more stable than that of export refunds (Figure 5.4).
Use of both these measures was at historically very low levels in 2007 and 2008, whereas in 2009 aid to
domestic consumption remained low (only 81 thousand tonnes of milk equivalent)35, whereas export
refunds were again quite extensively used (5 million tonnes of milk equivalent). Evidence presented in
evaluation question 2 shows that in 2007 and 2008 the world milk price equivalent (WMPE) (calculated
on the basis of world market prices for butter and SMP) was higher than the EU’s intervention milk price
equivalent (IMPE). Therefore, export refunds on butter and SMP were suspended, since to pay them
35 Disposal aid for butter and cream for use in manufacturing and for direct consumption was abolished in the Health Check (Regulation (EC) 72/2009).
130
would have involved support above the intervention price level, which is the intended floor price.
However, when the WMPE dipped below the IMPE in 2009, the option to resume export refunds re-
emerged.
Figure 5.4 Milk equivalent disposed of with domestic consumption aids and export subsidies, 2000-2009
0
1
2
3
4
5
6
7
8
2000 2001 2002 2003 2004 2005 2006 2007 2008 2009
mill
ion
ton
ne
s
Aided consumption Exports with refunds
Source: See note to Table 5.3.
5.6 Conclusions
Despite the continuation of the quota scheme throughout the period, domestic supply became more
responsive to price signals after the policy changes decided in 2003. Rather than national quotas always
being filled or over-filled as in the past, there was an increasing tendency for some Member States not to
reach the national quota ceiling as individual producers made more market oriented decisions and made
use of the greater freedom of choice due to decoupling of the dairy premium. National ceilings were
increased across the EU by 2% on 1 April 2008, in response to the surge in world market demand and
prices in 2007. The quota increase gave producers room to react to the higher prices, and meant that
EU-15 supply was more than 1 million tonnes higher in 2008 than in the previous two years. The collapse
of milk prices during 2008 and the first part of 2009 caused EU-15 supply to fall back in 2009, although
very little of the fall was transmitted to the behaviour of EU-27 supply because of an increase (+800
thousand tonnes) in EU-10 supply (because an increasing share of production was supplied
commercially). This evidence indicates that milk supply has become more responsive to price signals,
and that as quota limits become less constraining, producers’ strategies will depend on price as well as
on what is permitted by quota limits. The combination of instruments and policy changes driving this
development are: decoupling of the dairy premium, increase in quota, and lower intervention prices
together with the abolition of the target price.
The structural excess supplies of milk fat, protein, and other non-fat solids, as well as that of milk
equivalent, were positive throughout the period. Because of a temporary surge in world market demand,
these excess supplies fell sharply after 2006, almost reaching zero in 2008, but became positive again in
2009.
Regarding particular policy measures, three elements of the 2003 reform package − the shift of income
support from market price support to direct payment (dairy premium, subsequently decoupled from
milk), the reduction in intervention prices for butter and skim milk powder, and the abolition of target
price for milk − reduced the market price for milk and led to a lower structural excess supply at the
131
intended market price level in 2005-2006. This was the impact intended by the policy changes, and can
be attributed to them.
In 2007-2008, world market demand surged. The consequences were that, at first, maintaining internal
price levels resulted in a much smaller structural excess supply, and in the latter part of this episode,
when EU structural excess supply was almost zero, internal prices rose in response to rising domestic
prices and the 2% quota expansion. However, the movement in structural excess supply during 2007-
2009 was driven by external market forces, not EU policy changes, and should not be attributed to the
2003 reform package.
During 2000-2009, the structural excess supply was managed by domestic consumption aids and export
refunds. Therefore, the use of these policy measures follows very closely the evolution of the structural
excess supply. The use of these measures fell during 2005-2008, and rose again in 2009. Following the
above reasoning, the trend in the use of these measures during 2005-2006 can be attributed to the 2003
policy reforms, whereas during 2007-2008 it was the result of world market-induced developments. In
addition to these measures, public and private stockholding played a minor role in managing the market
surplus.
Summary of findings for each indicator, EQ1a
Indicator Expected result Evidence found
Milk production, supply Decoupling of the dairy premium, increase in quota, lower intervention prices and abolition of the target price would make supply more responsive to price signals. National quotas may not always be filled.
The expected effects were observed, earlier in some Member States than others, becoming generally visible by 2008-2009.
Structural excess supply (SES) for fat, protein and other non-fat solids
SES was expected to fall for all three milk components. Since the fall in the butter intervention price was greater than that for SMP, the SES for fat may fall relatively more.
The expected effects were found, starting in 2004. The SES of all components reacted with similar declines. It was not possible to observe the continuation of this process while holding other things constant, due to the disruption to markets in 2007-2009.
Structural excess supply for milk equivalent
SES for milk equivalent was expected to fall.
The expected effects were found, starting in 2004. It was not possible to observe the continuation of this process while holding other things constant, due to the disruption to markets in 2007-2009.
132
B. EQ1b: Production and supply to / demand by dairies (structural change)
To what extent have the CAP measures applicable to the dairy sector led to production restructuring?
5.7 Interpretation and comprehension of key terms of EQ1b
The ‘structure of milk production’ has various dimensions: (a) the way total milk output is allocated over
herds of different sizes, (b) the breakdown of herds according to whether they are located on farms that
specialise in milk production or on farms with a more diverse portfolio of production activities, and the
share of total milk output that comes from specialist dairy farms (c) the geographical distribution of
herds and milk output across the EU by Member State, and (d) the geographical distribution and extent
of regional concentration of herds and milk production within Member States. This evaluation question
examines whether any of these dimensions of production structure has changed as a result of the policy
changes under review. The following paragraphs briefly review the reasons why these aspects of
production structure are relevant to policy objectives, and to the performance of the dairy sector.
Herd size and economies of scale
It is well documented in the empirical economics literature that there are significant economies of scale
(declining unit production cost) in EU milk production up to herd sizes of 60-80 cows.36 To a large extent,
this is due to higher output per unit of fixed labour and, to a lesser extent, fixed capital. Thereafter, with
further scale expansion, unit costs fall much more slowly, then remain constant and – depending on the
study – may eventually start to rise very slowly.37 Therefore, structural change that leads to fewer,
larger herds and hence to a larger share of sectoral milk output being produced by these larger herds
lowers the average production cost across the sector, and improves its general economic performance.
There is a broad consensus that this process is slowed down by farm-level milk quotas when farms have
to obtain additional quota to expand (see, Rasmussen and Nielsen, 1985; Hennessy, 1995). A sectoral
quota ceiling means that individual farm growth is possible only if some farmers quit milk production
thereby freeing quota that permits other active dairy farms to grow (see Hüttel and Jongeneel, 2011).
As well as policy constraints, expansion can be limited by investment constraints. Generally, higher dairy
profit and a low-risk outlook for dairying facilitate herd expansion.
Specialist and non-specialist milk production
A ‘specialist dairy farm’ is defined in the EU Farm Typology Classification System as one for which two
thirds or more of the standard gross margins comes from the dairy activity. These farms generally
devote the greater part of their agricultural area to feed and fodder crops for the dairy enterprise, and/or
to grazing pasture. Management expertise is concentrated in milk production, which is also more likely to
be the priority activity for farm investment. Specialist dairy farmers, being less diversified, are less likely
to abandon milk production in the short run. Finally, specialist dairy farms are often in areas that do not
support other viable (non-livestock) farming activities, with the result that the continuation of farming in
the locality may well depend on the resilience of these farms as dairy farms. This combination of farming
and behavioural characteristics makes specialist dairy farms a core target group of EU dairy policy.
Geographical distribution of milk production between and within Member States
Over many decades, the geographical location of milk production has been the result of a compromise
between the advantages of proximity to local (liquid) milk markets and those of comparative advantage
36 See for example Burrell, 1990; Mukhtar and Dawson, 1990; Alvarez and Arias, 2003. 37 When more intensive production systems than are customary in Europe are used, economies of scale may still be available from expansion well beyond 1000 cows (this phenomenon is found, for example, in California).
133
in production due to agro-climatic conditions or to lower competition for land from other farming
activities. Already in the late 1990s, it was noted that over half of the EU-15 milk was produced in just
ten regions (Eck et al., 1996), including the Asturias and Galicia, Lower Normandy, Brittany, the
Netherlands, Lower Saxony, Denmark, Ireland and western England. These regions are situated in the
agro-climatic zone known as Atlantic (CEAS, 2000). Another 30% of milk production came from within
the so-called Continental zone (eastern France, central and southern Germany, the southern tip of
Sweden, northern Italy, and Austria). These two zones enjoy comparative advantage in milk production.
The evolution of modern road networks and refrigerated chains from the dairy parlour to the processing
dairy has greatly reduced the need for production to remain close to consumption centres. As a result,
the trade-off between proximity to the market and location where production costs are favourable has
not remained static.
However, the milk quota system has frozen production shares between Member States and, depending
on the national rules for quota reallocation, has tended – to a greater or lesser degree – to inhibit the
relocation of production within Member States. To the extent that this has happened, it has slowed down
structural change in general – both the shift of production from smaller to larger herds, and the
continuing concentration of production in specific geographic areas. There may, however, have been
environmental benefits from less production mobility, both when dairying has been retained in areas
where it can make a positive environmental contribution (such as in Less Favoured Areas) and when
more intense concentration of dairying (with the associated environmental problems of manure disposal,
heavy metal build up in soil and so on) has been avoided (see Baldock et al., 2008).
The dynamics of structural adjustment
Structural change usually occurs gradually. In the long run it is largely driven by external factors such as
technological change and the adaptation of structures to best exploit the advantages of new
technologies, cost and price developments in other competing sectors, and the general level of economic
development, which determine job and investment opportunities outside agriculture.
When structural change involves changes in the farm’s land holding, on-farm adjustments will depend on
land availability, which might be related to neighbouring farms going out of business. Moreover, exit
decisions are for the most part not reversible. Once milk production is abandoned, the probability of re-
entering milk production is low. Reversibility is costly because milking equipment is very specific, and
because it takes many years to rebuild a high performance herd. According to economic theory, firms
exit only when returns can no longer cover variable costs in the medium term. This means that it may be
economically rational for farms to continue for some years making negative net profit, but at the expense
of below-market returns to their owned assets (land and family labour). The literature suggests that the
closing down of a herd is also often prompted by factors like age, illness or absence of a successor etc.
5.8 Methodology used for answering the EQ1b: production restructuring
The methodology for addressing this evaluation question consists in choosing empirical indicators related
to each aspect of structural change identified above, and examining their evolution over time before and
after the 2003 reform. Changes in trends that occurred after 2003, or sudden discontinuities coinciding
with the introduction of a particular policy measure, will be interpreted as evidence of a policy-induced
impact. The basic steps in the methodology are defined below.
Most of the indicators are taken from official statistical collections (EU-FADN and Eurostat’s FSS).
However, we also exploit information gathered from the milk producers’ survey conducted in 13 case
study areas, in order to gain additional insights into the structural change process.
The information from the own survey is used merely to complement the official statistics, given the non-
representativeness and the small size of the samples involved. When answers within and across samples
tend to converge, this can be taken as providing meaningful information to support conclusions drawn
from the statistics. However, when respondents’ opinions are divided, the proportions given by the
survey replies should not be taken as representing the breakdown of views in the sector as a whole. All
that can be concluded is that there was no consensus among respondents.
134
5.9 Judgement criteria, indicators and information sources used for each
indicator
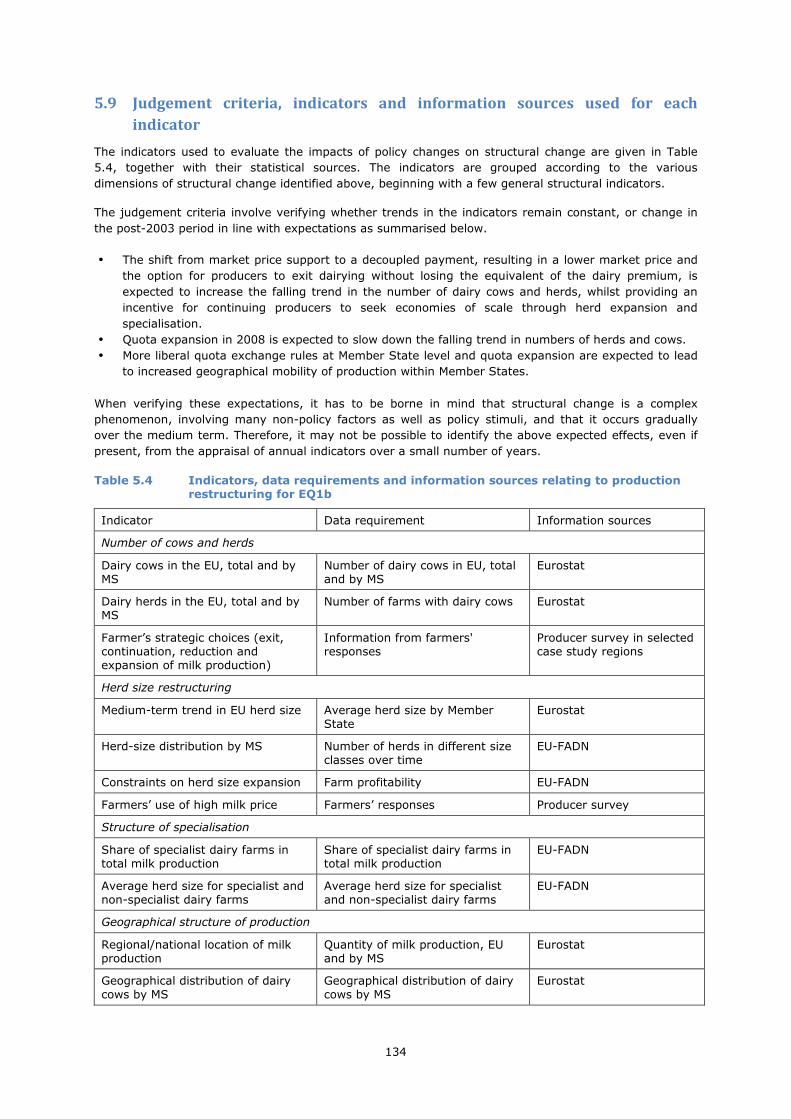
The indicators used to evaluate the impacts of policy changes on structural change are given in Table
5.4, together with their statistical sources. The indicators are grouped according to the various
dimensions of structural change identified above, beginning with a few general structural indicators.
The judgement criteria involve verifying whether trends in the indicators remain constant, or change in
the post-2003 period in line with expectations as summarised below.
• The shift from market price support to a decoupled payment, resulting in a lower market price and
the option for producers to exit dairying without losing the equivalent of the dairy premium, is
expected to increase the falling trend in the number of dairy cows and herds, whilst providing an
incentive for continuing producers to seek economies of scale through herd expansion and
specialisation.
• Quota expansion in 2008 is expected to slow down the falling trend in numbers of herds and cows.
• More liberal quota exchange rules at Member State level and quota expansion are expected to lead
to increased geographical mobility of production within Member States.
When verifying these expectations, it has to be borne in mind that structural change is a complex
phenomenon, involving many non-policy factors as well as policy stimuli, and that it occurs gradually
over the medium term. Therefore, it may not be possible to identify the above expected effects, even if
present, from the appraisal of annual indicators over a small number of years.
Table 5.4 Indicators, data requirements and information sources relating to production restructuring for EQ1b
Indicator Data requirement Information sources
Number of cows and herds
Dairy cows in the EU, total and by MS
Number of dairy cows in EU, total and by MS
Eurostat
Dairy herds in the EU, total and by MS
Number of farms with dairy cows Eurostat
Farmer’s strategic choices (exit, continuation, reduction and expansion of milk production)
Information from farmers' responses
Producer survey in selected case study regions
Herd size restructuring
Medium-term trend in EU herd size Average herd size by Member State
Eurostat
Herd-size distribution by MS Number of herds in different size classes over time
EU-FADN
Constraints on herd size expansion Farm profitability EU-FADN
Farmers’ use of high milk price Farmers’ responses Producer survey
Structure of specialisation
Share of specialist dairy farms in total milk production
Share of specialist dairy farms in total milk production
EU-FADN
Average herd size for specialist and non-specialist dairy farms
Average herd size for specialist and non-specialist dairy farms
EU-FADN
Geographical structure of production
Regional/national location of milk production
Quantity of milk production, EU and by MS
Eurostat
Geographical distribution of dairy cows by MS
Geographical distribution of dairy cows by MS
Eurostat
135
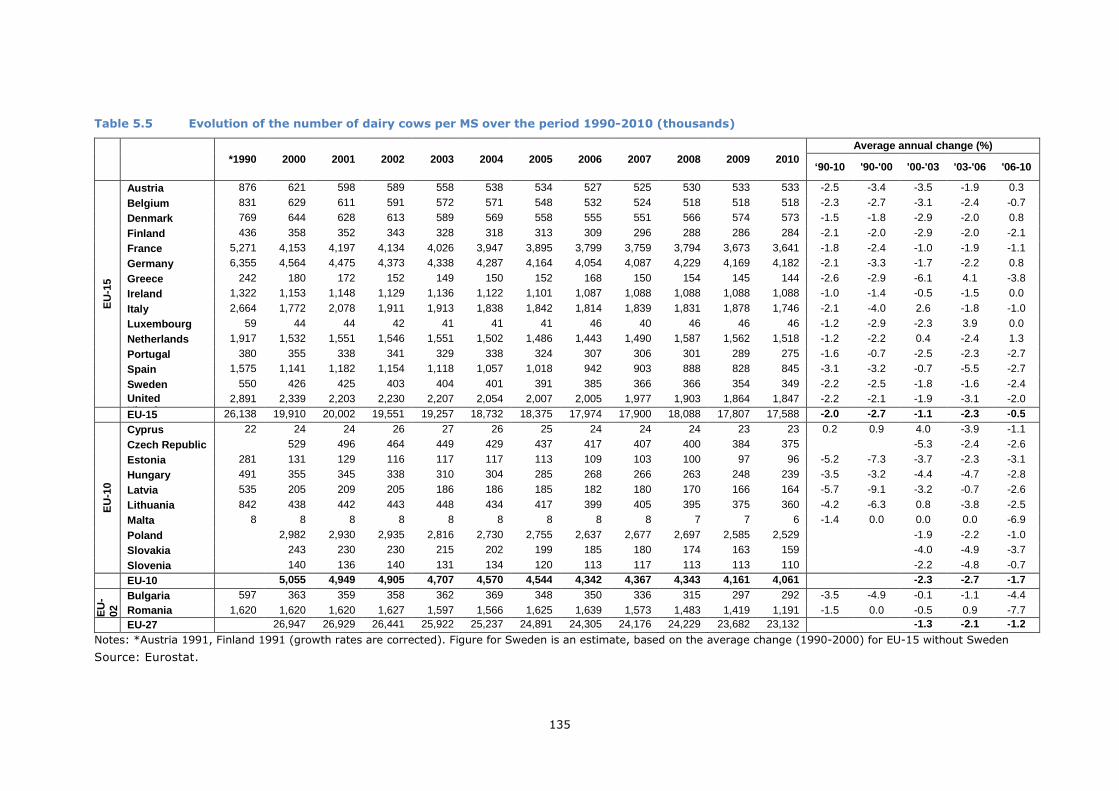
Table 5.5 Evolution of the number of dairy cows per MS over the period 1990-2010 (thousands)
Notes: *Austria 1991, Finland 1991 (growth rates are corrected). Figure for Sweden is an estimate, based on the average change (1990-2000) for EU-15 without Sweden
Source: Eurostat.
136
5.10 Evolution of dairy cow numbers and dairy herds in the EU
Dairy cow numbers
Table 5.5 shows the evolution of the number of dairy cows by EU Member States during the period 1990-
2010. The total decline over the period 1990-2010 is nearly 33% for EU-15. The smallest average rates
of decline are registered for Denmark, France, Ireland, the Netherlands and Portugal. Over the period
2000-2010, the declines are 12% (EU-15), 20% (EU-10) and 14% (EU-27). The average annual rates of
decline per sub-period show that cow numbers fell less steeply after 2000 than before 2000 in EU-15.
However, the rate of just over 1% per year in 2000-2003 and 2006-2010 doubled in the three years
immediately after the 2003 reform. The slowdown in the rate of decline between 2006 and 2010 is what
would be expected given the very high prices of 2007-8 and the 2008 increase in quota, but this is
insufficient to establish causality.
The rate of decline in cow numbers was generally steeper in EU-10 after 2000 than in EU-15. However, it
must be borne in mind that the impact of accession (either in anticipation of accession or after accession
occurred) also plays a strong role in these developments.
Dairy herd numbers
Between 2000 and 2007, herd numbers fell in EU-15 from 715.7 thousand to 480.5 thousand (-33%).
The declines for individual Member States are shown in Figure 5.5. The largest falls occurred in Portugal
(59%), Spain and Denmark (52%), and Sweden (49%).
Figure 5.5 Herd numbers in EU-15, 2000 and 2007
0
20
40
60
80
100
120
140
160
Bel
gium
Den
mar
k
Ger
man
y
Gre
ece
Spa
in
Fra
nce
Irel
and
Ital
y
Luxe
mbo
urg
Net
herla
nds
Aus
tria
Por
tuga
l
Fin
land
Sw
eden
Uni
ted
Kin
gdom
thou
sand
her
ds
2000 2007
Source: Eurostat.
137
Figure 5.6 Number of dairy herds in seven countries of EU-10, 2003 and 2007
0
5
10
15
20
25
Cyprus CzechRepublic
Estonia Hungary Malta Slovakia Slovenia
tho
usa
nd
he
rds
2003 2007
Source: Eurostat.
Figures 5.6 and 5.7 show the changes in herd size for the Member States of EU-10 and EU-02. Because
of the large differences in scale, these figures are presented in two different graphs. Despite the larger
scale in Figure 5.6, it is still too small to show the changes in Cyprus and Malta (from 250 for 240 herds
in Cyprus, and from 170 to 190 herds in Malta). The number of dairy herds increased in both Malta and
Slovenia between 2003 and 2007. In all other New Member States , the number of herds fell steeply over
this period. This should be interpreted as a general effect of adoption of the CAP and of becoming subject
to EU policies in all sectors (or, for Bulgaria and Romania, anticipation of membership), as well as the
effects of technological change and the incentive to achieve economies of size, and not as specifically due
to dairy policy. The largest falls in herd numbers in the New Member States between 2003 and 2007
occurred in Estonia and Hungary (declines of 51% and 45%, respectively).
Figure 5.7 Number of dairy herds in five countries of EU-10 and EU-02, 2003 and 2007
0
200
400
600
800
1,000
1,200
Latvia Lithuania Poland Bulgaria Romania
thou
sand
her
ds
2003 2007
Source: Eurostat.
138
The statistics show that 713 thousand dairy herds disappeared during the period 2003-2007 in EU-27, or
on average 489 herds per day. For specialist dairy farms, the rate is much lower, but nonetheless in the
period 2003-2007 about 14,600 per year disappeared in EU-27.
Decision to quit
For this evaluation, case studies were conducted for 13 regions in the EU-27, in total involving 393 active
milk producers and 50 milk producers who ceased dairy activity. In order to get more insight into the
reasons for farm exits, the farmers in the case study regions were asked whether they had seriously
considered quitting since 2003, and why.
Table 5.6 focuses on the reasons that caused respondents to seriously consider stopping milk production
at some time after 2003. It is important to note that about two-thirds of respondents stated they had
never in that period considered stopping milk production. Of the remainder (who did consider stopping
but without doing so), four of the five most frequently cited reasons are economically oriented (milk and
quota prices, price variability and lack of opportunity to grow – hence, to improve profitability). Dairy
policy is a major factor determining these economic signals (see EQ2 for the evidence on the link
between policy and prices). Environmental regulations, which was the second most frequent answer
given, are also driven by policy but not specifically dairy policy.
Table 5.6 Reasons why milk producers have seriously considered stopping milk production at some time since 2003
...alternative farm activities became more profitable
1 1 3 2 2 9 9
...changes in quota regulation
1 1 1 2 5 10
Never considered stopping 18 24 27 19 22 22 18 18 23 25 18 24 12 270
Notes: The case study areas were: A, Austria; F-B, France, Bretagne; F-FC, France, Franche-Comté; D-B, Germany, Bavaria; D-L, Germany, Lower Saxony; IE, Ireland; IT-ER, Italy, Emilia Romagna; IT-L, Italy, Lombardy; LV, Latvia, NL, Netherlands; PL, Poland; ES, Spain; UK, United Kingdom. The empty cells denote that no respondent chose this answer.
Bearing in mind the caveats expressed above about the small and unrepresentative national samples in
the producer survey, one should be cautious about interpreting most of these answers (based on the
139
pooled sample) as reliable evidence of policy impacts. At most, it can be said that there is consistent
evidence across nearly all the case study areas that low milk prices were seen as a significant ‘push-
factor’.38 The only exception to this was among the producers surveyed in Franche-Comté. However, it
must be borne in mind that in this particular sample, over half the dairy farms were cooperatively owned,
nearly all of them produced milk for a quality-label cheese, and for more than two-thirds of them, LFA
payments were seen as important or very important. Producers in the two French case study samples,
the Dutch one and the one in Spain stand out as being the most likely not to have considered
abandoning milk production since 2003. By contrast, this option was considered by over half the
respondents in the UK sample.
Impact of policy changes on milk production strategy
Table 5.7 shows that the impact of policy changes on farmers’ incentives to increase or reduce the scale
of their milk production, or to quit, was mixed. On the one hand, for four of the policy changes
mentioned, about half or more of the respondents considered that the policy changes were not relevant
and therefore had no impact on their strategic production decisions. On the other hand, other changes
affected behaviour more. The 2003 decision to maintain the quota scheme until 2015, and the later
decision to increase quota by annual amounts, provided incentives to expand for a significant share of
producers. The various policy payments had an expansionist effect for a smaller share of producers. The
switch from price support to a dairy premium to a decoupled payment (merged with the Single Farm
Payment) was seen by the majority of respondents either as irrelevant or simply as an incentive to
continue production unchanged. The decision to quit dairying was not made more attractive by any of the
policy changes for nearly all producers. However, it must be stressed that these respondents are
producers who did not quit.
Table 5.7 Effect of various policy changes on the incentive to decrease, continue, or expand dairy production (number of answers)
Policy/Policy change Number of
answers out of 393
not relevant stop decrease
continue at current level
increase
Decision taken in 2003 to maintain milk quotas until 2015 387 154 4 2 123 104
Introduction of dairy premium 390 190 2 3 130 65
Introduction of Single Farm Payments 389 165 3 2 150 69
Decoupling of dairy premium 389 226 6 4 113 40
Confirmation in 2008 to abolish milk quotas in 2015 357 167 10 4 92 84
Rural Development Aids 383 198 1 2 88 94
State Aids 386 208 3 0 99 76
Annual quota expansion 341 118 4 0 56 163
5.11 Herd size restructuring
Herd size
Figure 5.8 shows the average number of dairy cows per herd (all dairy herds) for EU-15 Member States
from 1991 to 2007.
38 This was also confirmed in the interviews with producers who had stopped. However, these samples of former milk producers are so small that they have anecdotal value only.
140
Figure 5.8 Average herd size, EU-15 Member states, 1991-2007
0
20
40
60
80
100
120
Aus t
ria
Belg
ium
Den
mar k
Germ
any
Spai
n
Fin
land
Fr a
nc e
Gre
ec e
I rela
nd
I ta l
y
Lux
em
bou
r g
Net
herlan
ds
Portuga
l
Sw
eden
Uni
ted K
ingdom
ave
rage n
um
ber of d
airy
cow
s
1991 1993 1995 1997 2000 2003 2005 2007
Source: Eurostat (FSS).
The strongest growth in herd size occurred in Denmark, from 40 cows over herd to 102 cows per herd.
the Netherlands, which also had 40 cows per herd in 1991, reached an average of 61 cows in 2007. In
the UK, which had the largest herds in EU-15 in 1991 (average 63 cows), average herd size peaked at 78
cows in 2003 but ended the period shown at just 70 cows. This indicates that some very large herds
were abandoned or broken up in the period 2003 to 2007, and possibly that new small herds were
started.
Table 5.8 Growth in average herd size (% per year), EU-15, 1991-2007, and sub-periods
1991-2010 1991-2000 2000-2003 2003-2005 2005-2007
Austria 2.2 4.6 2.7
Belgium 1.8 2.5 -0.1 1.5 2.9
Denmark 5.1 4.2 8.7 4.3 6.8
Germany 4.6 6.3 6.0 1.9 2.3
Spain 5.9 6.7 14.3 3.1 0.3
Finland 4.1 3.0 3.7
France 2.1 2.0 2.5
Greece 7.7 12.0 6.9 4.1 2.5
Ireland 3.9 4.4 3.7 4.6 3.3
Italy 4.4 6.0 9.3 2.1 -1.0
Luxembourg 0.9 1.4 3.8 2.3 -4.5
Netherlands 2.1 0.7 12.4 0.6 -1.3
Portugal 9.7 11.9 4.1 18.9 3.5
Sweden 10.8 3.2 4.1
United Kingdom 0.6 1.7 2.1 -0.8 -2.7 Source: Eurostat.
Table 5.8 shows the growth in average herd size for the Member States of EU-15, during the period
1991-2007, and for sub-periods thereof. There is no consistent pattern. Most Member States had a lower
growth in herd size in 2005-2007 than in 2000-2003 (Denmark, Germany, Spain, Greece, Ireland, Portugal,
Sweden) or even negative growth in the last period (Italy, Luxembourg, the Netherlands and the UK), but
this was not true for Austria, Belgium and France. It is not possible to discern a change in these trends
beginning around 2003-4 that could be attributed to the 2003 policy reforms.
141
Baldock et al. (2008, p.102) present a regression showing that 86% of the differences between Member
States in the growth of average herd size between 1989 and 2005 can be explained by just two factors:
the average herd size at the start of the period, and the degree of the restrictiveness of the quota
transfer regime operated by the respective Member State. The smaller the herd size at the start of the
period, and the more market-oriented the quota transfer regime, the larger the increase in average herd
size. This indicates that the more restrictive rules for quota transferability operated by some Member
States did indeed slow down the rate of herd size expansion. It follows that, when quota restrictions
become less constraining (because ceilings are raised, or are no longer binding) and providing producers
expect this situation to continue, herd size expansion should increase. As Figure 2.7 shows, from 2004/5
onwards, the quota ceiling at EU level was not met, and from 2006/7 quota was increased for some
Member States. Therefore, the period 2005-2007 could be characterised as one in which quota limits
became less restrictive.
The expectation of faster herd expansion after 2004/5 is not supported by the evidence: rates of herd
expansion were lower in 2005-2007 than in 2003-2005 in nine EU-15 Member States, and four of them
had contractions in herd size (Table 5.7). This result is explained by the fact that other factors occurring
at the same time – dairy policy changes (decoupling, lower prices), but also higher crop prices (which
increase dairy costs and the opportunity cost of remaining in dairy farming) - were working in an
opposite direction. Without a true counterfactual to indicate what the growth rate of herd size would
have been while keeping these other factors constant, it is impossible to conclude that quota constraints
did not dampen herd-size expansion in the first part of the decade. This analysis remains inconclusive.
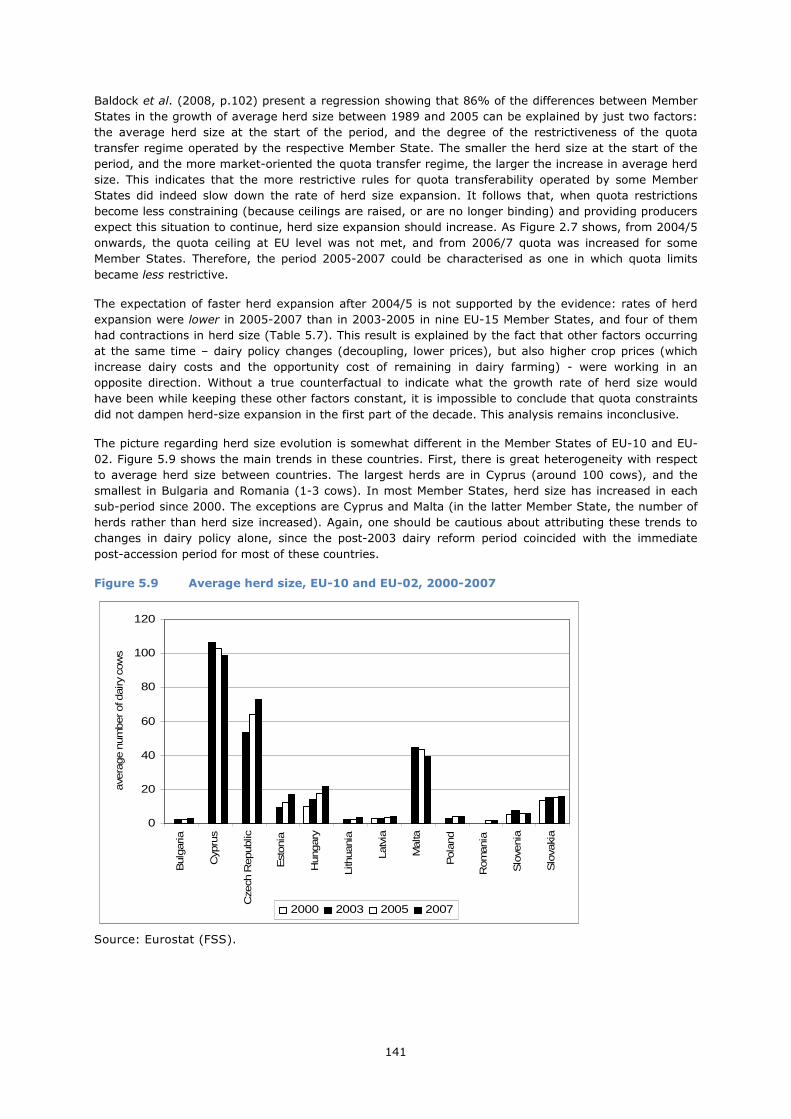
The picture regarding herd size evolution is somewhat different in the Member States of EU-10 and EU-
02. Figure 5.9 shows the main trends in these countries. First, there is great heterogeneity with respect
to average herd size between countries. The largest herds are in Cyprus (around 100 cows), and the
smallest in Bulgaria and Romania (1-3 cows). In most Member States, herd size has increased in each
sub-period since 2000. The exceptions are Cyprus and Malta (in the latter Member State, the number of
herds rather than herd size increased). Again, one should be cautious about attributing these trends to
changes in dairy policy alone, since the post-2003 dairy reform period coincided with the immediate
post-accession period for most of these countries.
Figure 5.9 Average herd size, EU-10 and EU-02, 2000-2007
0
20
40
60
80
100
120
Bulg
aria
Cyp
rus
Cze
ch R
epublic
Est
onia
Hungary
Lith
uania
Latv
ia
Malta
Pola
nd
Rom
ania
Slo
venia
Slo
vaki
a
ave
rage n
um
ber of d
airy
cow
s
2000 2003 2005 2007
Source: Eurostat (FSS).
142
Herd size distribution
Figure 5.10 Number of cows per size class in EU-15, 2000 and 2007
0
1
2
3
4
5
6
7
1-2 3-9 10-19 20-29 30-49 50-99 100−
mill
ion
da
iry
cow
s
2000 2007
Source: Eurostat (FSS).
Figure 5.11 Number of cows per size class in EU-10, 2003 and 2007
0
0.5
1
1.5
2
2.5
3
1-2 3-9 10-19 20-29 30-49 50-99 100−
mill
ion
da
iry
cow
s
2003 2007
Source: Eurostat (FSS).
Figures 5.10 and 5.11 show the shape and change in the herd size distribution over the period 2000-
2007 for the EU-15 and EU-10, respectively (for details at the Member State level see also section 2.3).
The majority of EU-15 dairy cows were kept in herds of 50 dairy cows and larger. In a striking contrast,
in the EU-10 most of the dairy cows were in herds of 10 dairy cows or less, even though the number of
dairy cows kept in relatively small herds declined substantially over time. In the EU-10 the herd size
distribution has a bimodal character. This is because many very small dairy herds are kept for the
purposes of the farm household’s own dairy consumption, either on subsistence farms or on farms that
143
are commercial farms with respect to other commodities, but which keep a few dairy cows for their own
consumption.
Between 2000 and 2007, only the largest herd size group (≥100 cows) in EU-15 acquired more cows. By
contrast, between 2003 and 2007, in EU-10 the total number of cows in all herd size groups with more
than 10 cows increased whereas the smallest herd sizes experienced a net reduction in cow numbers.
Tables 2.31 and 2.32 provide data on this process at Member State level. Regarding the distribution of
herds, in 2007 at least 25% of all herds in Denmark, Cyprus and the UK had 100 cows and more
although only 2% of all EU dairy herds had more than 100 cows or more. By contrast, more than 95% of
all dairy herds in Lithuania and Romania had fewer than 10 dairy cows. The points in the size distribution
where herd numbers are growing depend on the current (average) size of herds. For example, in the
Netherlands, where herds are already on average quite large, growth in herd numbers occurred only for
the largest size group (> 100 cows). By contrast, in Austria, the size group 30-49 cows was the smallest
to register a net increase in herd numbers. Regarding the distribution of dairy cows across size classes,
in 2007 51% of the EU dairy cow population was kept in herds of at least 50 head. In 2000 this share
was only 41%. Cyprus, Czech Republic, Denmark, Slovakia and the United Kingdom all had at least 90%
of their dairy cows in herds of 50 cows or more in 2007. By contrast, in Austria, Bulgaria, Lithuania,
Poland, Romania and Slovenia more than 60% of the dairy cow population was kept in herds of 19 or
fewer dairy cows.
Table 5.9 Share (%) of all farms with dairy cows having a positive net profit
2000 2001 2002 2003 2004 2005 2006 2007
Belgium 54 60 49 55 54 65 69 77
Denmark 16 8 12 12 10 19 28 46
Germany 22 22 18 17 33 43 44 65
Greece 45 46 54 57 73 85 83 92
Spain 53 67 65 65 55 61 61 59
France 33 34 46 40 43 48 45 54
Ireland 36 37 36 43 40 42 31 47
Italy 31 32 33 30 33 39 36 43
Luxembourg 49 55 42 54 57 67 57 71
Netherlands 32 37 33 29 30 43 40 57
Austria 26 34 30 20 26 34 34 41
Portugal 28 40 48 46 54 54 71 63
Finland 16 23 23 22 16 18 13 20
Sweden 5 5 8 8 0 7 8 18
United Kingdom 20 38 21 29 32 38 36 57
EU-15 30 34 34 32 37 44 43 53
Czech Republic 39 34 37 55
Estonia 48 40 33 43
Hungary 47 23 36 30
Lithuania 70 53 46 45
Latvia 44 52 43 45
Malta 0 42 50 48
Poland 26 26 29 33
Slovakia 52 37 18 39
Slovenia 27 14 14 22
EU-10 30 28 30 35
Bulgaria 67
Romania 20
EU-02 24
Source: EU-FADN.
144
The evidence on profitability presented in Table 5.9 sheds some light on the incidence of financial
constraints on herd size expansion. Following 2004, there was a marked increase in the share of EU-15
FADN farms with dairy herds that earned a positive net economic profit. This can be interpreted as an
indicator of the proportion of dairy herds that did not face severe financial constraints. However, this
increase could well be the effect of the larger than usual exit of farms in EU-15 during these years,
assuming that those leaving would have been mainly the less profitable herds. Moreover, it has to be
borne in mind that EU-FADN is not a fully representative sample, as it does not cover farms below the
minimum economic size threshold (which varies between Member States, tending to be higher in Member
States with larger average herd sizes) and is designed to reflect population shares according to the
dimensions ‘region’, ‘type of farming’ and ‘economic size class’ only.
The producer survey asked respondents how they used the extra revenue earned during the period of
high milk prices in 2007-2008. In particular, producers were asked whether the revenue was used
(among other options) for herd expansion (animals), to buy more quota and/or to finance investments
allowing expansion. The same questions were asked regarding any future hypothetical windfall returns
due to high prices. No clear picture emerges across the own survey. It is certainly not warranted to
conclude from respondents’ answers that producers were already expansion-minded and seized, or would
in the future seize, such a windfall opportunity to finance herd expansion.
5.12 Structure of specialisation
Figure 5.12 ranks Member States according to the share of total milk output coming from specialist dairy
farms.
Figure 5.12 Share (%) of total delivered milk coming from specialist dairy farms (2007) by Member State and change in this share (measured in percentage points), 2001-2007
0
20
40
60
80
100
Por
tuga
lM
alta
Fin
land
Irel
and
Net
herla
nds
Den
mar
kU
nite
d K
ingd
omS
pain
Ital
yS
wed
enE
ston
iaG
erm
any
Slo
veni
aLu
xem
bour
gB
ulga
riaF
ranc
eB
elgi
umR
oman
iaG
reec
eLa
tvia
Pol
and
Aus
tria
Lith
uani
aH
unga
ryC
zech
Rep
ublic
Slo
vaki
a
% s
ha
re o
f milk
-10
-5
0
5
10
15
pe
rce
nta
ge
po
ints
% of total milk output from specialised dairy farms, 2007 % change 2001-2007
Source: EU-FADN.
For 9 out of 27 Member States, more than 90% of the raw milk produced comes from specialist dairy
farms. In sixteen Member States, the share of specialist dairy farms increased between 2001 and 2007,
145
and the two largest increases (Austria and Lithuania) occurred where the share was still relatively small
in 2007. In six other Member States, there was no change in the share. However, four Member States
(Hungary, Slovenia, Slovakia and Sweden) had negative rates of change in specialisation, implying that
their dairy farm sector shows a tendency to de-specialise. Thus, there is a trend towards more
specialisation across the EU, but with some exceptions at Member State level.39
Table 5.10 shows that herds on specialist dairy farms are in general larger than those on non-specialist
dairy farms everywhere in the EU, but the absolute sizes of both categories are much smaller in EU-10
and EU-02. More disaggregated information by Member States can be found in Table 2.35. About 87% of
total milk production in EU-15 comes from specialist dairy farms, and for the EU-10 this share is 56%. As
is shown in Section 2.3, average numbers hide a pattern of structural change that is more complex: the
number of relatively small herds tends to decline, whereas the larger herds tend to increase.
Table 5.10 Average number of dairy cows per specialist and non-specialist dairy farm in the EU-15, EU-10, EU-02 and EU-27 for the period 2000-2007
2000 2001 2002 2003 2004 2005 2006 2007
EU
-15 specialist 41 41 44 46 47 48 51 51
non-specialist 25 25 27 28 27 25 24 25
EU
-10 specialist 18 17 18 18
non-specialist 8 8 7 8
EU
-02 specialist 5
non-specialist 3
EU
-27 specialist 31
non-specialist 10
Source: EU-FADN.
Between 2000 and 2004, specialist herds in the EUR-15 EU-FADN sample had on average 64-74% more
dairy cows than non-specialist dairy herds (Table 5.10). However, after 2004, this gap became greater:
92% in 2005, 113% in 2006, and 104% in 2007.
Whilst it is important not to draw conclusions about trends from the EU-FADN sample (whose
composition changes every year) or from just four years’ data, this apparent acceleration in expansion of
specialist dairy herds compared with herds on non-specialist dairy farms raises the question of whether
any of the policy changes happening at that time could have triggered such a development. The clear
guidelines on future dairy policy trends given in the 2003 reform, together with the commitment of these
specialist dairy producers to a long-term future in dairying, may have triggered a burst of herd expansion
that was not shared by the more diversified, arguably less committed milk producers. By contrast, the
size of herds on both specialist and non-specialist dairy farms remained more or less constant in EU-10
for the post-accession years.
Table 5.11 Milk yield evolution for specialist and non-specialist dairy farms in EU-15, EU-10, EU-02 and EU-27, kg/cow
39 Note that, for Italy, the results in this figure contradict the evidence reported in the case study analysis, which comes from the national authorities and is not based on Eurostat’s FSS.
146
Table 5.11 shows that the milk yields of herds on specialist dairy farms in the EU-FADN database are
consistently above those of herds on non-specialist dairy farms (around 12% higher on average in EU-
15, 18% higher in EU-10 and nearly 20% higher in EU-02). This finding highlights a major reason why
the share of herds on specialist dairy farms matter for the performance of the sector. Although measured
yield growth is slightly higher for non-specialist dairy herds, the difference is so small that this gap will
remain more or less constant in coming years.
5.13 Geographical structure of production
Since 1984, the milk quota scheme has fixed national quota ceilings on milk deliveries and direct sales
off farms. These ceilings have remained very stable over the years, with some occasional adjustments at
the same rate for all Member States accommodate enlargements, or for particular Member States for
exceptional reasons. Table 2.38 sets out the national quota ceilings for each year since 2000/1 up to
2014/15, when the quota scheme will end.
The structure of milk supply and of dairy herds at Member State level, which depends strongly on these
quota limits, has also been very stable. Table 5.12 shows the evolution of milk production shares at
Member State level. There is more movement in these shares in the post-reform period. However, it is
impossible to discern any regional bias. For example, Italy’s share increases but that of the other three
Mediterranean countries remains stable. The share of France trends down a little, but that of Germany
increases.
In 2009, 81% of EU-27 milk was produced in EU-15, about 15% in EU-10, and about 4% in EU-02.
Figure 5.13 shows the geographical distribution of dairy cows between EU-15, EU-10 and EU-02. The
impact of two enlargements is clear: initially there is a jump in cow numbers, but with increasing yields –
especially among the lower-yielding herds in new member countries - and with quota limits unchanged,
EU total cow numbers begin to fall again.
Figure 5.13 Number of dairy cows in EU regions, 2000-2010
Geographical mobility of quota within Member States has continued throughout recent decades, despite
some regional barriers to quota transferability between regions of certain Member States. Evidence
reported in Baldock et al. (2008) up to 2005/6 shows that regional reallocation was generally accompanied
by increases in average herd size in all regions, both those regions receiving a net gain in quota and
those with a net decline, but that there was usually a decline in herd numbers in those regions that lost
quota (and sometimes even in gaining regions). This emphasises that regional mobility is closely
associated with herd-size restructuring. Data could not be found for this report on the most recent trends
in regional shifts in the location of production. However, given that quota is now more mobile than it was
at the start of the century (because of a relaxation of regional restrictions, as for example in Germany,
or because it is now cheaper or ‘free’ on the market because national ceilings are no longer binding), we
can conclude that the regional shares of herds and production have become more dynamic because of
the policy changes.
Table 2.36 provides information about the geographical distribution of dairy cows over LFA and non-LFA
areas. In the period 2003-2007 the share of dairy cows in the total number of dairy cows that is kept in
LFA areas has increased for Bulgaria, Czech Republic, Estonia, Hungary, Lithuania, Poland, Romania,
Slovakia and Slovenia. Member States having a relatively large share of their dairy cow population in
mountainous LFS areas are Finland (76%), Austria (66%), Slovenia (50%) and Slovakia (46%). All of
Luxembourg is classified as a LFA.
148
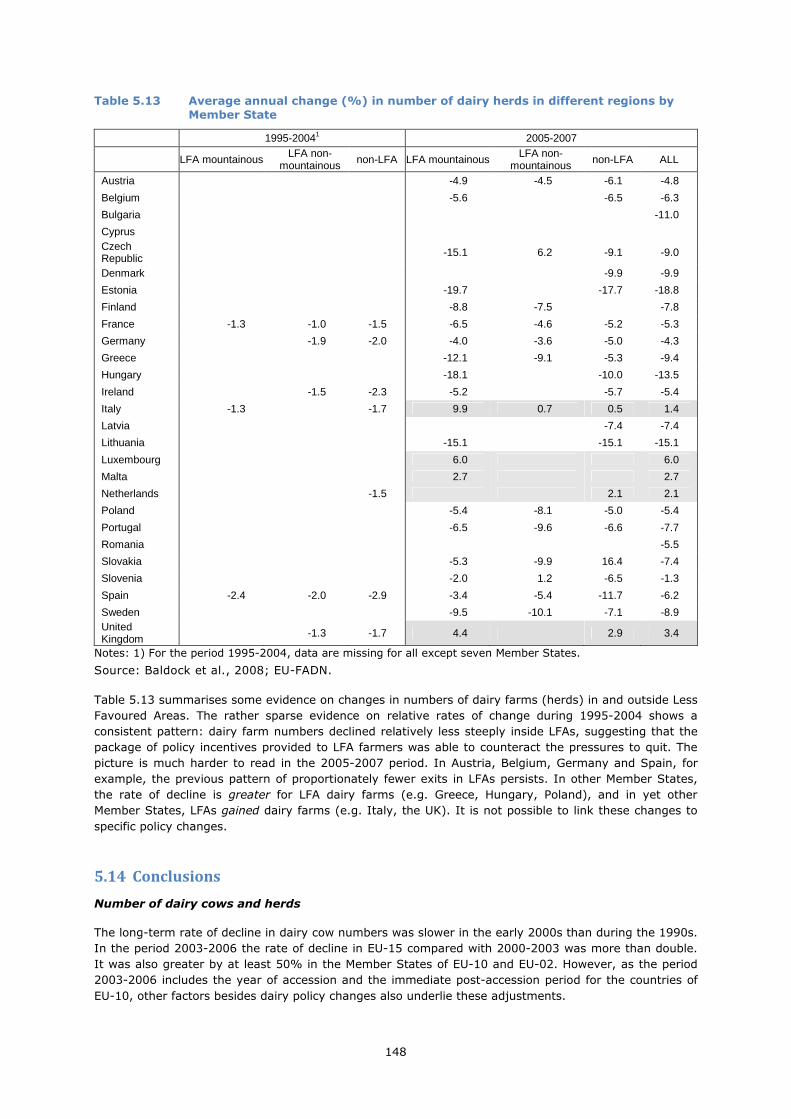
Table 5.13 Average annual change (%) in number of dairy herds in different regions by
Member State
1995-20041 2005-2007
LFA mountainous LFA non-
mountainous non-LFA LFA mountainous LFA non-
mountainous non-LFA ALL
Austria -4.9 -4.5 -6.1 -4.8
Belgium -5.6 -6.5 -6.3
Bulgaria -11.0
Cyprus Czech Republic -15.1 6.2 -9.1 -9.0
Denmark -9.9 -9.9
Estonia -19.7 -17.7 -18.8
Finland -8.8 -7.5 -7.8
France -1.3 -1.0 -1.5 -6.5 -4.6 -5.2 -5.3
Germany -1.9 -2.0 -4.0 -3.6 -5.0 -4.3
Greece -12.1 -9.1 -5.3 -9.4
Hungary -18.1 -10.0 -13.5
Ireland -1.5 -2.3 -5.2 -5.7 -5.4
Italy -1.3 -1.7 9.9 0.7 0.5 1.4
Latvia -7.4 -7.4
Lithuania -15.1 -15.1 -15.1
Luxembourg 6.0 6.0
Malta 2.7 2.7
Netherlands -1.5 2.1 2.1
Poland -5.4 -8.1 -5.0 -5.4
Portugal -6.5 -9.6 -6.6 -7.7
Romania -5.5
Slovakia -5.3 -9.9 16.4 -7.4
Slovenia -2.0 1.2 -6.5 -1.3
Spain -2.4 -2.0 -2.9 -3.4 -5.4 -11.7 -6.2
Sweden -9.5 -10.1 -7.1 -8.9 United Kingdom -1.3 -1.7 4.4 2.9 3.4
Notes: 1) For the period 1995-2004, data are missing for all except seven Member States.
Source: Baldock et al., 2008; EU-FADN.
Table 5.13 summarises some evidence on changes in numbers of dairy farms (herds) in and outside Less
Favoured Areas. The rather sparse evidence on relative rates of change during 1995-2004 shows a
consistent pattern: dairy farm numbers declined relatively less steeply inside LFAs, suggesting that the
package of policy incentives provided to LFA farmers was able to counteract the pressures to quit. The
picture is much harder to read in the 2005-2007 period. In Austria, Belgium, Germany and Spain, for
example, the previous pattern of proportionately fewer exits in LFAs persists. In other Member States,
the rate of decline is greater for LFA dairy farms (e.g. Greece, Hungary, Poland), and in yet other
Member States, LFAs gained dairy farms (e.g. Italy, the UK). It is not possible to link these changes to
specific policy changes.
5.14 Conclusions
Number of dairy cows and herds
The long-term rate of decline in dairy cow numbers was slower in the early 2000s than during the 1990s.
In the period 2003-2006 the rate of decline in EU-15 compared with 2000-2003 was more than double.
It was also greater by at least 50% in the Member States of EU-10 and EU-02. However, as the period
2003-2006 includes the year of accession and the immediate post-accession period for the countries of
EU-10, other factors besides dairy policy changes also underlie these adjustments.
149
Between 2000 and 2007, 33% of dairy herds disappeared in EU-15. In Spain, Portugal, Sweden and
Denmark the loss was around 50% or more. Between 2003 and 2007, 713 thousand dairy herds ceased
operation in EU-27. This represents a massive restructuring and concentration of EU milk production. The
issue is whether it can be linked to the policy changes under review.
The producer survey (among producers still active in early 2011) indicated that about two-thirds of them
had not considered stopping milk production in the period since 2003, and those who had given this
option serious consideration tended to cite economic factors (in particular low milk prices) rather than
specific policy changes as the reason. The reduction in intervention prices, as decreed in the 2003
reform, was accompanied by a gradual lowering of milk prices during 2004-2006, and this lower level
reappeared in 2009 after the price spike due to high world demand in 2007-8. However, other factors
that the producers surveyed considered to be incentives for stopping production were environmental
regulations, insufficient potential to grow and greater volatility in milk prices.
In conclusion, structural evolution with respect to numbers of cows and herds was greater in the three
years 2004-2006 than in 2000-2003 in EU-15. The decline in EU-15 cow numbers almost ceased
between 2006 and 2010; data on the evolution of herd numbers for this latest period are not available.
Structural change is a complex and gradual process. The observed changes cannot be linked directly to
policy measures or policy changes.
Herd size restructuring
Rates of herd-size increase vary greatly between Member States. Many Member States in EU-15 had
lower growth in average herd size in 2005-2007 than 2000-2003, indicating that the higher rate of herd
decline in that sub-period was balanced by a higher rate of decline in cow numbers. There is no clear-cut
evidence linking these developments to specific policy changes. Prior empirical evidence of the effect of
quota restrictiveness on herd-size growth created the expectation that average herd size would increase
faster from 2004-2005 onwards, when quotas became less restrictive for a variety of reasons. However,
this expectation is not strongly supported by the data.
Herd sizes in EU-10 and EU-02 are generally much smaller than EU-15. The post-2003 period in these
countries is marked by a number of adjustments due to adopting the CAP as a whole and the pressures
of the single European market. Therefore, no conclusions about the impacts of specific dairy policy
changes can be based on the structural developments observed in the dairy sectors of these countries.
Structure of specialisation
After the 2003 reform, herds on specialist dairy farms in EU-15 continued to expand in size faster than
herds on other types of farm. Several factors contributed to this different trend. Among these factors is
the clarity about future dairy policy changes and the long-term horizon for the dairy sector that was set
out in the 2003 reform. Given the commitment of specialist dairy producers to a long-term future in
dairying, this perspective together with the fall in quota prices supported a faster rate of herd expansion
for specialist dairy herds than was observed for the more diversified, arguably less committed milk
producers on other types of farm. In EU-10, the size of herds on both specialist and non-specialist dairy
farms remained more or less constant. The share of total milk supply coming from specialist dairy farms
varies greatly across EU-27.
Geographical relocation of production
National quota ceilings establish upper limits to milk deliveries and therefore to production capacity, and
the shares of Member States national quota in the whole have changed only marginally. Since 2004/5,
there has been a little movement in national shares of milk supply, with a slight increases in Germany
and the Netherlands, slight falls in the UK over the period and in France in 2009-2010, but no clear
trends for EU-10 Member States.
A certain degree of geographical mobility of milk production and dairy capacity within Member States has
been maintained throughout the quota period. The lack of regional data makes it impossible to examine
whether this process has accelerated or become more responsive to market and policy signals since the
2003 reforms and their implementation. However, data on the percentage decline in dairy herds from
LFAs and non-LFAs suggest that the tendency, observed over 1995-2004, for dairy herds in LFAs to quit
150
less readily than those in non-LFAs appears to have been disrupted in the mid-2000s, leading to quite
heterogeneous patterns across Member States. It must be stressed that the data assembled here are
rather patchy for the earlier period, and that if there is a real change in the pattern, it is not necessarily
related to or solely due to the dairy policy changes under review here, although hypotheses to support
this view could be constructed.
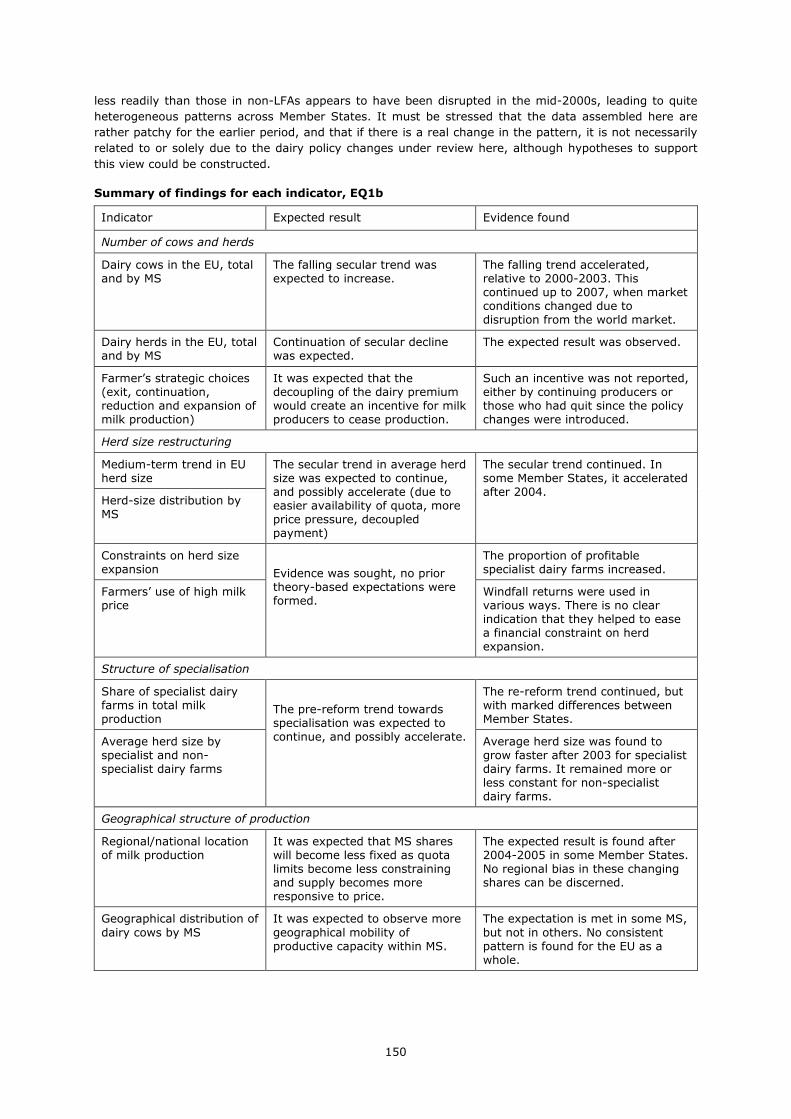
Summary of findings for each indicator, EQ1b
Indicator Expected result Evidence found
Number of cows and herds
Dairy cows in the EU, total and by MS
The falling secular trend was expected to increase.
The falling trend accelerated, relative to 2000-2003. This continued up to 2007, when market conditions changed due to disruption from the world market.
Dairy herds in the EU, total and by MS
Continuation of secular decline was expected.
The expected result was observed.
Farmer’s strategic choices (exit, continuation, reduction and expansion of milk production)
It was expected that the decoupling of the dairy premium would create an incentive for milk producers to cease production.
Such an incentive was not reported, either by continuing producers or those who had quit since the policy changes were introduced.
Herd size restructuring
Medium-term trend in EU herd size
The secular trend in average herd size was expected to continue, and possibly accelerate (due to easier availability of quota, more price pressure, decoupled payment)
The secular trend continued. In some Member States, it accelerated after 2004.
Herd-size distribution by MS
Constraints on herd size expansion
Evidence was sought, no prior theory-based expectations were formed.
The proportion of profitable specialist dairy farms increased.
Farmers’ use of high milk price
Windfall returns were used in various ways. There is no clear indication that they helped to ease a financial constraint on herd expansion.
Structure of specialisation
Share of specialist dairy farms in total milk production
The pre-reform trend towards specialisation was expected to continue, and possibly accelerate.
The re-reform trend continued, but with marked differences between Member States.
Average herd size by specialist and non-specialist dairy farms
Average herd size was found to grow faster after 2003 for specialist dairy farms. It remained more or less constant for non-specialist dairy farms.
Geographical structure of production
Regional/national location of milk production
It was expected that MS shares will become less fixed as quota limits become less constraining and supply becomes more responsive to price.
The expected result is found after 2004-2005 in some Member States. No regional bias in these changing shares can be discerned.
Geographical distribution of dairy cows by MS
It was expected to observe more geographical mobility of productive capacity within MS.
The expectation is met in some MS, but not in others. No consistent pattern is found for the EU as a whole.