+ All Categories
Home > Documents > 5 Major Sites, 4 Separate Disciplines, 5,221 Engineers, … · collect costs for Work Breakdown...

5 Major Sites, 4 Separate Disciplines, 5,221 Engineers, … · collect costs for Work Breakdown...

Date post: 30-Aug-2018
Category:
Upload: vanmien
View: 217 times
Download: 0 times
Share this document with a friend
26
5 Major Sites, 4 Separate Disciplines, 5,221 Engineers, 1 Data Repository: Having data you can actually use – Priceless! Copyright © 2007 Raytheon Company. All rights reserved. Customer Success Is Our Mission is a trademark of Raytheon Company.
Transcript

5 Major Sites, 4 Separate Disciplines,

5,221 Engineers, 1 Data Repository:

Having data you can actually use – Priceless!

Copyright © 2007 Raytheon Company. All rights reserved.Customer Success Is Our Mission is a trademark of Raytheon Company.

26 July 2007 Page 2

Outline

n Introduction to Raytheonn Measurement-related Goalsn Measurement Process Overviewn Best Practices

– Measurement Definition– Measurement Collection– Measurement Analysis– Tooling/Automation

n Future Opportunitiesn Resultsn Q & A

26 July 2007 Page 3

Introduction to Raytheon and NCSn Raytheon is an industry leader in defense and government

electronics, space, information technology, and technical services

n Network Centric Systems (NCS) develops and produces mission solutions for networking, command and control, battle space awareness, homeland security and air traffic management

26 July 2007 Page 4

Major NCS Sites and Overall Goal

Marlborough, MA

St. Petersburg, FL

Ft. Wayne, IN

McKinney, TXFullerton, CA

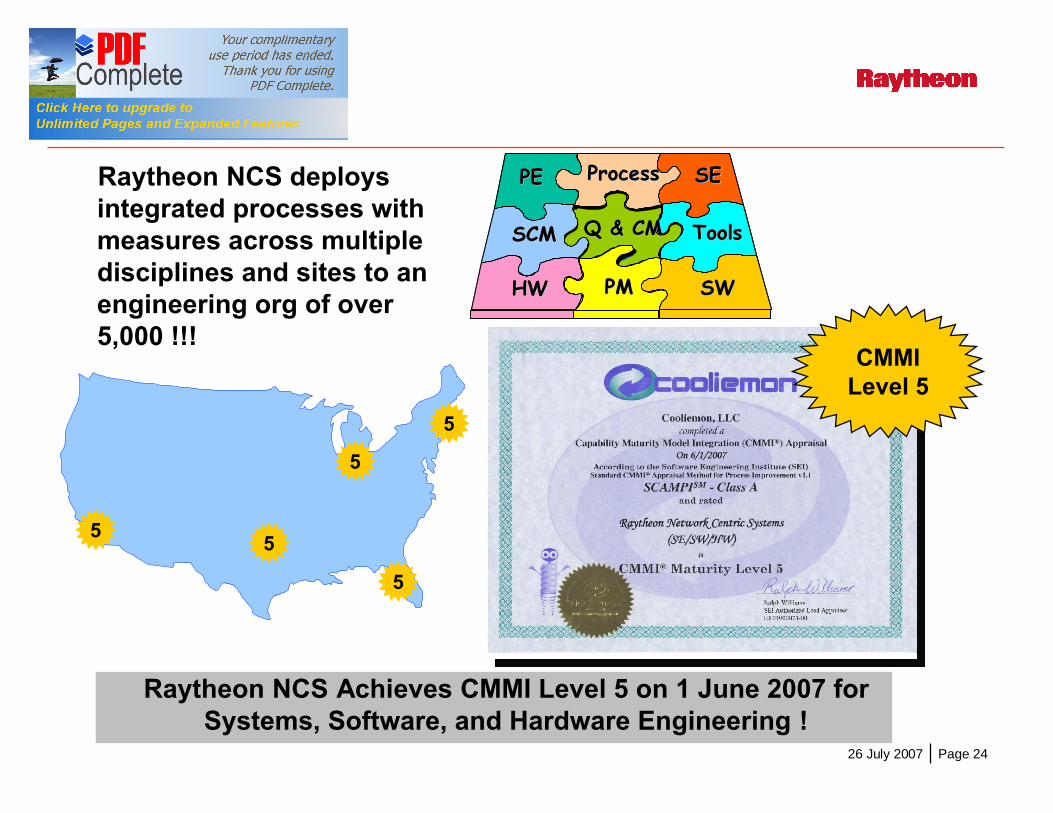
• NCS Engineering Organization = Over 5,000 individuals • Number of programs to appraise = 33 (CA 8, TX 4, IN 9 , FL 4, MA 8)• Various levels of CMMI maturity at the project onset

NCS Goal:Achieve NCSCMMI Level 5

for SE, SW, and HW

NCS Goal:Achieve NCSCMMI Level 5

for SE, SW, and HW

26 July 2007 Page 5

n Establishing a Common Measurement Program– All major NCS sites and engineering disciplines– Common plans and work instructions that support CMMI Level 5– Common process and tooling

n Consistent Approach– Define core set of engineering measures– Define analysis that should occur at various levels– Define measures roll-up as related to NCS goals– Define a set of CMMI Level 4 Sub-process approaches

n Have a “one company” look to our customers– Accurate historical data and consistent estimates across sites– Support Mission System Integrator (MSI) role– Support multi-site bids and work transfers between sites

NCS Process Improvement Journey:Measurement-Related Goals

26 July 2007 Page 6

Measurement Process Overview

Organization / Program

MeasurementsDefinition

Program

MeasurementsCollection

Program

Measurements Analysis

Common NCS ReportsCustom Program Reports

Program

ManagementReviews

OrganizationOrganizational

ProcessPerformance

Organization

CostEstimation

Common CoreMeasuresProgram Measures

26 July 2007 Page 7

§ Cost and Schedule Measures§ Defect Containment§ Staffing Profile§ Measurement Compliance§ Change Management§ Peer Review§ Requirements Volatility§ Design Margin Index (DMI)§ Size § Productivity

Best Practice – Definition:Core Engineering Measures

There were many more measures, but

Engineering started with a list of core

measures

There were many more measures, but

Engineering started with a list of core

measures

26 July 2007 Page 8

Best Practice – Definition:Use Common Cost Collection Scheme

n Aligns disciplines and activities

n Used to identify and collect costs for Work Breakdown Structure (WBS) elements

n Scheme is aligned with Cost Estimation

n Facilitates collection of consistent historical data

n Defect data can be collected in these bins

Gen

eral

H

ardw

are

Ana

log

Dig

ital

FPG

A

Mec

hani

cal

PROJECT PLANNING & MANAGEMENT

Planning and Management

Quality Engineering

Configuration Management

REQUIREMENTS DEVELOPMENT

System Requirements Definition

System Design & Architecture

Product Requirements Definition

Product Design & Architecture

Component Requirements Definition

PRODUCT DESIGN & DEVELOPMENT

Requirements Management

Simulation and Modeling

Preliminary Design

Detailed Design

Implementation

Integration

SYSTEM INTEGRATION & VALIDATION

Product Verification & Validation

System Integration

System Acceptance Test

System Field Test

ACTIVITY TITLE PE SE SW

HW

Sets the foundation for CMMI Level 5 by aligning cost, schedule, and quality data

26 July 2007 Page 9

Best Practice – Definition:All Size Measures have Consistent Elementsn Size measures were defined for Systems Engineering (SE), Software (SW),

Hardware (HW)-Electrical, HW-FPGA (Field-Programmable Gate Array), and HW-Mechanical disciplines

n Sizes for each discipline were defined to have the capability to be converted to equivalent size units, where equivalent means equivalent to requiring the same amount of effort as developing it from scratch

n Each discipline’s size data includes these elements– Reused – Modified– New – Reuse Factor (FR)– Modified Factor (FM)

Equivalent = New + (Modified * FM) + (Reused * FR)

26 July 2007 Page 10

§ Raytheon created the SECOST tool, which aids deployment and company calibration with the Constructive Systems Engineering Cost Model (COSYSMO)

§ NCS System Engineering sizes are aligned with COSYSMO sizes§ For each system of interest these are collected to compute equivalent

requirements (EREQ):§ System requirements§ System interfaces§ System algorithms§ System scenarios

§ For a complete SE size set of requirements data, additional NCS SE size measures include:§ Software product requirements§ Hardware product requirements§ Hardware component requirements

Best Practice – Definition:Align SE Size Measures with

26 July 2007 Page 11

Best Practice – Definition:Specify SE Productivity Activities

Business Strategy

Integration, Verification& Validation

Production Ops. &Support

Design & Development

Requirement & Architecture Development

Planning & Management

SE Full Life Cycle Productivity

Product Requirements

Definition

Component Requirements

DefinitionSystem

Design & Architecture

System Requirements

Definition

Product Design &

Architecture

SE Specific Life Cycle Stage Productivities

Specific cost collection codes are used to capture hours for Productivity measures

26 July 2007 Page 12

Best Practice – Definition:Align SW Size Measures with Cost Modelsn Raytheon has used parametric SW models such

as COCOMO, COCOMO II, REVIC, Price-S, and SEER-SEM for many years

n Specific alignment was made to the SEER-SEM SW Application types to allow stratification of data such as productivity

n NCS SW Size measures support these models with parameters of Source Lines of Code (SLOC) categorized by Reused, Modified, and New, with Reuse and Modified Factors

n A standard NCS software line counting tool was deployed across all sites so that sizes are measured consistently and with automation

26 July 2007 Page 13

Best Practice – Definition:Specify SW Productivity Activities

Prelim.Design

DetailedDesign

Implement-ation

IntegrationRqmts & Arch. Devel.

Verification& Validation

Production Ops. &Support

SW Development Productivity Stages

Specific cost collection codes are used to capture hours for Productivity measures

26 July 2007 Page 14

HW Sub-Discipline Size Unit Definition of Size Unit

Electrical Terminations Termination count is the sum of all external physical leads

FPGA FPGA Lines of Code

Lines of Code - like software engineering

Mechanical Square Feet of Drawing

The square feet of drawings required to document the design

Best Practice – Definition:HW Size Measures

Hardware Size Units are an indication of which hardwaresub-discipline is producing this data

26 July 2007 Page 15

Best Practice – Definition:Specify HW Productivity Activities

Prelim.Design

DetailedDesign

Implement-ation

IntegrationReqs & Architecture

Devel.

Verification& Validation

Production Ops. &Support

HW Development Productivity Stages

Collected separately for:• Electrical• FPGA, and • Mechanical

Collected separately for:• Electrical• FPGA, and • Mechanical

26 July 2007 Page 16

PCAT:Cost, DPMO

Design for Cost /Design for Producibility

Best Practice – Quantitative Analysis: Integrate Org & Program Activities

CPI SPIDefect

Containment Productivity

Standard Process, Tools, Enablers, Technology

Inspection Calculator:Peer Review Defect DensityReview / Development Stage

Price-H:AUPC

Design for Cost

ASENT/Block SIM:MTBF

Requirements Analysis/Design for Reliability

SECOST:Effort hours by stageDevelopment Stage

Legend• Tool• Measure• Sub-process

Programs have a variety of tools and models to use for statistical control

MTBF – Mean Time Between Failures

AUPC – Average Unit Production Cost

DPMO – Defective Parts per Million Opportunities

26 July 2007 Page 17

Best Practice – Analysis: Establish Org Baselines - Peer Review Example

§Programs use latest org baselines and program/product line baselines§Baselines are recalculated periodically and then fed back to programs §Peer review tools are updated to include new org norms

SE

SW

HW

Programs record Peer Review data in review tools

Measurement Repository

SW Preliminary Design

0

10

20

30

40

50

0.0 to <=1.33

1.33 to <=2.66

2.66 to <=4.0

4.0 to <=5.33

5.33 to <=6.66

6.66 to <=7.99

7.99 to <=9.32

13.32 to <=14.65

Class

# O

bser

vatio

ns

W eibull Dis tribution A lpha = 1.1575B eta = 2.1368K S Test p-value = .2521

Software Detailed Design

0

5

10

15

20

25

30

35

40

0.0 to <=0.588

0.588 to <=1.176

1.176 to <=1.765

1.765 to <=2.353

2.353 to <=2.941

2.941 to <=3.529

3.529 to <=4.118

4.118 to <=4.706

4.706 to <=5.294

5.294 to <=5.882

Class

# O

bser

vatio

ns

W eibull Dis tribution Alpha = 1.4833Beta = 1.6688KS Test p-value = .1434

Software Implementati on

0

10

20

30

40

50

60

70

80

0.0 to<=

0.401

0 .401to <=0 .801

0 .801to <=1 .202

1 .202to <=1 .603

1 .603to <=2 .003

2 .003to <=2 .404

2 .404to <=

2 .804

2 .804to <=

3 .205

3 .205to <=

3 .606

3 .606to <=

4 .006

4 .006to <=

4 .407

4.407to <=4.808

4.808to <=5.208

5.208to <=5.609

6 .41 to<=

6.811

6 .811to <=7 .212

Class

# O

bser

vatio

ns

Weibu ll Dis tribution Alpha = 1.1791Be ta = 1 .4287KS Tes t p -va lue = .0812

Establish Org Baselines

Programs select baselines, use control charts, and analyze capability monthly

Program Execute Peer Reviews

•••iMetrics

DB

u Char t

UCL=17.012

LCL=0. 0

CEN =5.778

-1 0

-5

0

5

1 0

1 5

2 0

2 5

3 0

156 157 158 159 160 161 162 163 164 165 1 66 167 168 16 9 172 17 4 175 1 77 182 183 18 5 191 193 195 196Inspect ion N umber

(def ect s detec ted) / (KSLOC Inspect ed)

Program Baseline

Org Baseline

26 July 2007 Page 18

KPP

TPMS

TPMP

KPCC

CustomerReq’t

System

Product

Component

SystemsReports DMI

HWReports DMI

~

~

~

KPCC

~

TPMP

TPMS

KPCC

Pro

gra

m

Best Practice – Analysis:Allocate TPMs to Architecture

§KPPs are decomposed into objectives and managed at lower levels to ensure program success§DMI is an index used to measure the design margin§DMI is a useful measure for assessing “over” design and “under” design

KPP - Key Performance Parameters are system level attributes

KPP - Key Performance Parameters are system level attributes

TPM - Technical Performance Measures are functions of Key Product Characteristics

TPM - Technical Performance Measures are functions of Key Product Characteristics

KPC – Key Product Characteristics can significantly affect a TPM or KPP

KPC – Key Product Characteristics can significantly affect a TPM or KPP

26 July 2007 Page 19

Requirements DefinitionRequirements Decomposition

Predict“Current Cpk”

(CpkP)

Design

µ Pσ P

LS Lµ P

σ PLS L

U SLµ P

σ PU SL

µ Pσ P

U SLµ P

σ PL SL U SL

µ Pσ P

L SL

U SLµ P

σ PU SL

µ Pσ P

Measure“Actual Cpk”

(CpkM)

Mfg/Test

µMσM

LSLµM

σMLSL

USLµM

σMUSL

µMσM

USLµ M

LSLσM

USLµ M

LSLσM

USLµM

σMUSL

µMσM

Allocate“Cpk Target”

(CpkT)

USLUSL

CpkT

Form, Fit, orFunctional

Limit(s)

USLUSL

Allocate D

MUSLUSL

CpkT

USLUSL

Allocate D

M

LSL USLLSL USL

CpkT

LSL USLLSL USL

Allocate D

M

LSLLSL

CpkT

LSLLSL

CustomerRequirement

System

Product(i.e. Line replac-able units,Subsystems,Etc.)

Component(i.e. CircuitCards,Cables, etc.) ~

KPP

TPMS

TPMP

KPCC KPCC

~

TPMP

~

TPMS

KPCC

~

Best Practice – Analysis:Manage KPPs over Program Life Cycle

§TPMs are used for quantitative management and statistical control§This gives the programs added value and can help significantly reduce program costs

26 July 2007 Page 20

Best Practice – Analysis & Review:Involve Quantitative Management Stakeholders

NCS Engineering Process Steering Team

Engineering Councils

Engineering ManagementSite Measurement Teams

Program Engineer and Discipline Teams

NCS Measurement Council

§High level teams and managers were very interested is analyzing and reviewing measurement data§This created a positive “pull” for information across NCS

26 July 2007 Page 21

Best Practice – Analysis & Review:Define Analysis and Review Flow

Org Measurement

Repository

Org Measurement

Repository

Site Rolls-up

& Analyzes Data

Org Rolls-up

and Analyzes Data Review with

NCS Mgmt& Engr

Councils

Review with Site

Engr Mgmt

Review withProgram

Mgmt

Analysis comments,Baselines,PredictiveModels

Generates reportsfor reviews

Trends,Baselines,& Analysis Results

Trends, Baselines,& Analysis Results

OrganizationalFeedback

SiteFeedback

A

A

Management Reports

Prog Engr LeadsPerform Analysis

SE Analysis

SW Analysis

HW Analysis

PE Analysis

Coo

rdin

ate

Dat

a &

A

ssum

ptio

ns

Management Reports

Analysis comments,Baselines,PredictiveModels

Analysis comments,Baselines,PredictiveModels

Consistent flow across NCS sites and disciplines

26 July 2007 Page 22

iMetricsDB

iMetricsDB

FinancialDatabaseFinancialDatabase

Defect DatabaseDefect

Database

ChangeMgmt DB

ChangeMgmt DB

CPI / SPI

Peer Review

Automation allows repeatable quick entry of data tools to supply measurement data!

Requirements VolatilityReq’s

DatabaseReq’s

Database

Defect Containment

Change Management

Standard Reports

Standard Reports

Best Practice – Tooling:Integrate & Automate Databases and Tools

Manual entry of any data

Automated Data Entry

ExcelTemplateExcel

Template

26 July 2007 Page 23

Future Opportunitiesn Increase the coverage and use of common cost collection

codes to more disciplines and activities

n Extend use of measurement database to other roll-up management measures such as Oregon Productivity Matrixes (OPMs)

n Incorporate statistical and textual analysis capability into themeasurement reporting automation

n Improve alignment of financial processes and tooling with the common cost collection codes

n Define collection scheme for the Incremental Development life cycle model

n Continue to broaden the scope of automation that supports collection and reporting or measures

26 July 2007 Page 24

ResultsRaytheon NCS deploys integrated processes with measures across multiple disciplines and sites to an engineering org of over 5,000 !!!

CMMI Level 5

Raytheon NCS Achieves CMMI Level 5 on 1 June 2007 for Systems, Software, and Hardware Engineering !

ToolsToolsSCMSCM

PMPM

Q & CMQ & CM

SESE

HWHW

ProcessProcess

SWSW

PEPE

ToolsToolsSCMSCM

PMPM

Q & CMQ & CM

SESE

HWHW

ProcessProcess

SWSW

PEPE

5

5

5

55

26 July 2007 Page 26

Contact Information

Chris Angermeier (NCS TX Measurement Lead)

– 972.952.3679– [email protected]

Jill Brooks (NCS TX SW Process Technical Director)

– 972.344.3022– [email protected]


Recommended