MONETARY AND FINANCIAL DEVELOPMENTS • Overview • Monetary Developments • Financial Sector Developments Information Box 5.1 - E-Wallet Redefining the Way to Pay Feature Article 5.1 - Bursa Malaysia-i : The World’s First Shariah-Compliant Investment Platform • Prospects for 2018 5
Transcript
MONETARY AND FINANCIAL DEVELOPMENTS
• Overview
• Monetary Developments
• Financial Sector Developments
Information Box 5.1 - E-Wallet Redefining theWayto Pay
Th e m o n e t a r y p o l i c y s t a n c e r e m a i n s accommodative while ensuring price stability
despite uncertainties in the external environment. These uncertainties include the prospect of increasing monetary policies divergence between the US and other major economies which could lead to tighter financial market conditions. Although several major economies shifted their monetary stances to withstand these uncertainties, the domestic monetary policy continues to support the Malaysian economy. In this respect, the Monetary Policy Committee (MPC) kept the Overnight Policy Rate (OPR) unchanged in the first seven months of 2017. Meanwhile, the ringgit appreciated following encouraging domestic economic developments. Stronger ringgit was also supported by various measures taken by the Financial Markets Committee (FMC), particularly on enhancing liquidity in the bond market and allowing for greater hedging flexibility in the onshore market. The Malaysian banking system remains strong and well-supported by sound institutions and sustained confidence in the financial system. As at end-July 2017, the banking system was well-capitalised with more than 75% of high quality capital. The quality of loan portfolio remained steady at 1.2% of Net Impairment Ratio to total loans. Profitability of the banking system remained sound supported by efficiency gains from the adoption of new technologies and optimisation of workforce.
The domestic capital market continues to grow and plays a vital role in the economy. In the first seven months of 2017, the capital market was supported by financial market development measures and sustained domestic institutional investors’ demand. The overall size of the capital market grew to RM3.1 trillion during the same period. In response to the global needs for sustainable and responsible financing, Malaysia issued the world’s first green sukuk on 27 July 2017 with a value of RM250 million. This effort is in line with Malaysia’s pioneering role in strengthening Islamic capital market.
In addition, the growth of digital finance is changing the landscape of the global financial market. Digital finance has led to the introduction of new business models and solutions for greater efficiency
and better risk management. In this regard, the Government has provided a supportive regulatory environment to promote financial technology (fintech) to modernise and increase the efficiency of the financial sector. In the meantime, the Government is also emphasising the importance of financial inclusion by implementing several initiatives and awareness programmes. This has led to the improvement in the Financial Inclusion Index from 0.77 in 2011 to 0.90 in 2016.
Monetary Developments
Monetary Policy
Monetary policy remains accommodative
Monetary policy in 2017 continues to focus on supporting the sustainable growth of the Malaysian economy while maintaining price stability. In the first seven months of 2017, the OPR and Statutory Reserve Requirement (SRR) were held steady at 3.00% and 3.50%, respectively. At the current level of the OPR, monetary policy remains accommodative to balance the risks of domestic growth and inflation prospects. The economy is expected to expand between 5.2% – 5.7% with inflation at 3% – 4% in 2017.
Steady interest rates
Interest rates in the banking system remained stable in the first seven months of 2017 in line with the unchanged OPR since July 2016. The weighted Base Rate (BR) of commercial banks stood at 3.62% as at end-July 2017 (end-July 2016: 3.83%). The weighted Average Lending Rate (ALR) was at 5.20% (end-July 2016: 5.27%). Meanwhile, interest rate on savings deposit of commercial banks decreased by two basis points to 0.96% as at end-July 2017 (end-July 2016: 0.98%). The interest rates on fixed deposits of 1-month to 12-month maturities were stable ranging between 2.88% and 3.10% (end-July 2016: 2.90%; 3.06%).
Monetary aggregates expanded further
Monetary aggregates continued to expand during the first seven months of 2017. M1 or narrow money grew 10.9% to RM392.8 billion as at end-July 2017 (end-July 2016: 2%; RM354.2 billion), mainly supported by higher demand deposits, which increased 11% (end-July 2016: -0.1%). Similarly,
Chapter 5.indd 99 10/21/17 12:00 AM
100 economic report 2017/18
M3 or broad money, rose 4.8% to RM1,675 billion (end-July 2016: 2.3%; RM1,597.8 billion) driven by net portfolio inflows during the second quarter of 2017. The higher net claims on Government and extension of credit to the private sector also contributed to the growth, particularly through corporate bonds during the first half of 2017.
Financial Sector Developments
Banking System Performance
Vibrant banking system
Banking system remains vibrant as all financing indicators expanded during the first seven months of 2017, following strong economic performance. Loan applications, approvals and loan disbursements rebounded 4.1%, 11.2% and 10% to RM477.5 billion, RM212.2 billion and RM632.5 billion, respectively (January – July 2016: 0.5%, -15.4%, -2.7%; RM458.9 billion, RM190.7 billion, RM574.8 billion). Total loans outstanding grew 5.6% to RM1,549.4 billion as at end-July 2017 (end-July 2016: 5.9%; RM1,467.3 billion).
During the same period, business loan approvals rebounded 10.4% to RM86.9 billion (January – July 2016: -11.6%; RM78.7 billion) and loan disbursements grew 14.3% to RM416.4 billion (January – July 2016: -2.3%; RM364.5 billion). The manufacturing sector continued to account for most of the loans disbursed by the banking system at 19.4%, followed by the wholesale and retail trade, restaurants and hotels sector at 18.7%. Meanwhile, loan applications decreased 1.4% to RM189 billion (January – July 2016: -0.2%; RM191.7 billion), mainly by small and medium enterprises. Business sector loans outstanding increased 6.7% to RM567.4 billion as at end-July 2017 (end-July 2016: 5%; RM531.9 billion).
Financing to small and medium enterprises (SMEs) registered a strong growth with loans disbursed increasing significantly by 13.4% to RM160.7 billion (January – July 2016: -3.8%; RM141.7 billion). Total loans outstanding rose 8.1% to RM292 billion, accounting for 51.5% of total business loans outstanding as at end-July 2017 (end-July 2016: 9.8%; RM270.2 billion; 50.8%). The bulk of loans outstanding were for working capital (43.9%) and purchase of landed properties (36.2%). However, loan applications and approvals declined 3.5% and 3.3% to RM97.5 billion and RM34.4 billion, respectively (January – July 2016: -9.1%, -7.3%; RM101 billion, RM35.5 billion).
Change (RM billion)
2016 2017M3 3.2 31.1Net claims on Government -4.6 25.3Claims on private sector 37.7 46.4
Loans 30.4 25.6Securities 7.4 20.9
Net foreign assets -18.9 -3.0Bank Negara Malaysia1 -17.6 3.2Banking system -1.3 -6.2
Other influences -11.0 -37.6
1 Includes exchange rate revaluation losses/gains.Source: Bank Negara Malaysia.
Table 5.1. Factors Affecting M3January – July
Ringgit advanced against the greenback
The ringgit, along with most major and regional currencies ended firmer against the US dollar in the first eight months of 2017. The appreciation of the ringgit was underpinned by resumption of non-resident inflows into Malaysia’s financial markets fo l lowing encouraging domest ic macroeconomic conditions. In particular, the measures announced by the FMC in December 2016 and April 2017 further buoyed the positive ringgit sentiment. Some of the measures announced were the promotion of foreign exchange hedging within the domestic foreign exchange market and non-deliverable forward (NDF). Other measures are the requirement of conversion of foreign currency export proceeds into ringgit and further liberalisation of the bond market. As at end-August 2017, the ringgit saw a year-to-date increase of 5.1% against the US dollar.
2015 2016 2017
-2
0
2
4
6
8
10
12
M3
M1
J1JMDSJMDSJM
Figure 5.1. Monetary Aggregates(% change)%
1 End-July 2017.Source: Bank Negara Malaysia.
EuroAustralian dollar100 Thai baht100 Korean wonSingapore dollar100 Japanese yenChinese renminbiPound sterling100 Indonesian rupiah US dollar100 Philippine peso
-9 -6 -3 0 3 6 9
End-2016 — End-August 2017
Figure 5.2. Performance of Ringgit AgainstSelected Currencies(% change)
1 Include foreign entities, other domestic entities, Government and others.2 As at end-period.Note: Total may not add up due to rounding.Source: Bank Negara Malaysia.
Table 5.2. Banking System: Loan IndicatorsJanuary – July
SMEs financing was also supplemented by BNM’s special revolving funds1 that provides financing at a reasonable cost. Through the funds, more than 75,000 SMEs have been assisted since its establishment, with total financing approvals of RM30.1 billion as at end-July 2017, reflecting an average utilisation rate of 75.8% (end-July 2016: 69,274 SMEs; RM28.6 billion; 76.2%). During the first seven months of 2017, total financing approved amounted to RM0.7 billion for 3,242 SMEs (January – July 2016: RM1.2 billion; 3,144 SMEs).
In order to meet the demand for financing from SMEs, BNM has consolidated Fund for Small and Medium Industries 2, New Entrepreneurs Fund 2, Fund for Food, Micro Enterprise Fund and Disaster Relief Facility into an omnibus fund called BNM’s Special Funds for SMEs, effective 19 June 2017. Features of the fund were enhanced to enable SMEs with difficulties in obtaining financing from banks such as start-up companies and entrepreneurs without established records or collateral. Access points have been increased to include all licensed banks and prescribed development financial institutions. Meanwhile,
1 Special revolving funds consist of the Fund for Food which was established in 1993; Fund for Small and Medium Industries 2 (2000); New Entrepreneurs Fund 2 (2001); Micro Enterprise Fund (2008); Bumiputera Entrepreneurs Projects Fund – Islamic (2009); and Special Relief Facility (2015). Special Relief Facility (reclassified as Disaster Relief Facility) was closed for new applications on 30 June 2015 and will be made available upon activation by BNM.
1 Non-SMEs refers to large corporations, include foreign entities, other domestic entities, Government and others.2 Total = Business + Households + Other sectors.Note: Total may not add up due to rounding.Source: Bank Negara Malaysia.
Table 5.3. Banking System: Loans Outstanding by Sector(End-July)
another special fund, the Bumiputera Entrepreneurs Project Fund – Islamic is implemented through the Credit Guarantee Corporation Malaysia Berhad.
Financial institutions also provide financing to micro-enterprises under the Micro Financing Scheme. Currently, seven banking institutions and three development financial institutions are providing financing to micro-entrepreneurs through both conventional and Islamic products via more than 2,000 access points. During the first seven months of 2017, total financing approved under the scheme amounted to RM223.5 million for 8,984 accounts. Since its inception in 2006 until July 2017, more than RM3.6 billion financing to 209,954 accounts have been approved.
Chapter 5.indd 101 10/21/17 12:00 AM
102 economic report 2017/18
Lending to households remained steady with loan applications, approvals and disbursements increased significantly by 11.9%, 14.1% and 4.2% to RM270.9 billion, RM114.9 billion and RM169.3 billion respectively, in the first seven months of 2017 (January – July 2016: -2.4%, -20.7%, -7.9%; RM242.2 billion, RM100.6 billion, RM162.5 billion). Loans disbursed to households are predominantly for consumption credit totalling RM79.1 billion or 46.7% of total loans disbursed to households (January – July 2016: RM76.6 billion; 47.2%). This was followed by loans for purchases of residential properties at RM44.3 billion or 26.1% (January – July 2016: RM44.7 billion; 27.5%). Meanwhile, as at end-July 2017, total households loans outstanding grew 5.1% or RM883.8 billion, accounting for 57% of total loans outstanding in the banking system (end-July 2016: 5.7%; RM841.2 billion; 57.3%).
Total household debt2 continued to moderate since 2012. As at end-July 2017, total household debt grew 5.1% to RM1,111.9 billion (end-July 2016: 5.8%; RM1,057.8 billion), mainly driven by loans for residential properties which expanded 8.8%. Total household debt accounted for 85.6% of GDP as at second quarter of 2017 (end-2016: 88.4%). The bulk of household debt was for wealth accumulation with 63% secured by properties and principal-guaranteed investments. The moderating growth trend in household debt was mainly attributed to a series of prudential measures introduced by the Government since 2010 to rein in debt accumulation by households. Households are also more cautious in acquiring debt and are mindful of their ability to pay.
Overall, household debt repayment capacity remains strong in the first seven months of 2017, supported by steady income growth and stable labour market conditions. Total household financial assets grew 8.1% to RM2,339.4 billion (end-July 2016: 4.4%; RM2,164.5 billion). Deposits and deposit-like instruments continued to form the major component (43.2%) of household financial assets, providing households with access to quick liquidity to meet any increase in expenditure. Meanwhile, household delinquencies and impairment for total loans remained low at 1.4% and 1.7%, respectively (end-July 2016: 1.5%; 1.7%).
Well-capitalised banking system
The capacity of the banking system to absorb losses remains strong, supported by high levels of capitalisation. As at end-July 2017, the banking system remained well-capitalised with common
equity tier 1 capital, tier 1 capital and total capital ratios at 13.3%, 14.2% and 17.5%, respectively, well above Basel III minimum regulatory levels (end-2016: 13.1%; 14%; 16.5%). More than 75% of banks’ total capital consists of high quality capital comprising retained earnings, paid-up capital and reserves. The total capital buffer in excess of minimum regulatory requirement was sustained at above RM138.9 billion (end-2016: RM124.5 billion).
Performance of the banking system remained sound supported by efficiency gains from the adoption of new technologies and optimisation of workforce. The pre-tax profit of the banking system increased 4.2% at RM19.8 billion for the first seven months of 2017 due to increase in income from intermediation and fee-based activities (January – July 2016: 11.9%; RM19 billion). As a result, return on assets and equity of banks remained stable at 1.4% and 12.4%, respectively (end-2016: 1.3%; 12.8%).
Loan quality of the banking system continued to remain sound throughout the period with stable Net Impaired Loans Ratio of 1.2% as at end-July 2017 (end-2016: 1.2%). Loan Loss Coverage Ratio of the banking system stood at 81.4% (end-2016: 86.5%). Taking into account regulatory reserves for loans and financing, the banking system maintained sufficient buffers for potential credit losses.
Banking system liquidity remained sufficient with surplus ringgit placed with BNM at RM180 billion (end-2016: RM184.5 billion). This amount can be released into the financial system to meet liquidity needs. The banking system’s Liquidity Coverage Ratio (LCR) stood at 137.1% (end-2016: 124.3%), with almost all banks recording LCR of higher than 100%. The improvement in LCR is due to higher holding of high quality liquid assets by banks, notably in the form of Government securities.
2 Comprising loans provided mainly by the banking system, DFIs and Public Sector Home Financing Board (LPPSA).
The modes of payment for business transactions in Malaysia have evolved from paper-based to card-based and mobile-based in the last four decades in line with advancements in technology. With the advent of Industrial Revolution 4.0, mobile-based applications are dominating lifestyles, including daily purchase of goods and services. Apart from using credit cards online, the use of electronic wallet (e-wallet) has gained popularity and is expanding fast. In particular, global mobile wallet transactions were valued approximately at USD594 billion in 2016 and are expected to reach USD3.1 trillion by 2022, growing at a compound annual growth rate of 32% between 2017 and 2022.1
What is E-Wallet?
E-wallet is essentially a digitalised version of the physical wallet where it stores users’ information such as identity, email and home address, multiple credit cards and bank account numbers, as well as gift and loyalty cards in a secured environment. Besides being preloaded with currency, e-wallet is designed to be more convenient as compared with physical wallets by providing better manageability of payments and accounts. E-wallet allows users to receive offers and alerts from merchants, storing digital receipts and warranty information. Examples of global e-wallet providers are Alipay, Paytm, Samsung Pay, Apple Pay, Android Pay and PayPal. As of July 2017, e-wallet providers in Malaysia, which subjected to the Financial Services Act 2013 and Islamic Financial Services Act 2013, are Alipay, Visa Checkout, Masterpass, CIMB Pay and Samsung Pay.
E-Wallet Operation
The operation of e-wallet will depend mainly on the type of wallet, technology and users’ device, specification and arrangement between provider and agent or settlement banks. The fund for e-wallet may come from various sources such as debit or credit card, prepaid card, bank account, virtual currency,2 or any other stores of value. For example, Samsung Pay and CIMB Pay e-wallets link credit cards and debit cards to fund the payment transactions while PayPal and Alipay Malaysia account holders may transfer funds from their bank accounts into their e-wallets to make payment. Generally, the operation of e-wallet is as illustrated in Figure 5.1.1.
Evolution of Electronic Payment in Malaysia
The emergence of e-wallet contributes to the further development of e-commerce and enhances retail payment system by offering fast, easy and secured payment process. It promotes the usage of electronic payment (e-payment) system, which supports the global move towards cashless societies. Digitalisation of money will enhance financial inclusion, as it is more effective to provide infrastructure to make e-wallet accessible in remote areas. In addition, it also provides more secure and reliable transactions, improves the overall efficiency of the payment system as well as provides cost savings and efficiency to the entire economy.
1 Global Mobile Wallet Market Report 2016 – 2022 (2016). Zion Market Research.2 Virtual currency is a digital representation of value that is neither issued by a central bank or a public authority, nor necessarily attached to a fiat currency, but is accepted as a means of payment and can be transferred, stored or traded electronically. Source: Opinion on virtual currencies (2014). European Banking Authority.
To embrace digital economy, Malaysia has made considerable progress in accelerating the transition from paper-based payments to electronic payments. The launching of Digital Free Trade Zone (DFTZ) on 22 March 2017 and the entry of global electronic wallet (e-wallet) providers are expected to transform the payment system landscape in Malaysia. Furthermore, the migration from signature-based payment cards
to PIN-based payments was enforced on 1 July 2017 to enhance the security of payment cards. In addition, to enhance financial inclusion, several initiatives were introduced. These include widening the outreach of agent banking and organising Finance Carnival. This has led to significant improvement in Financial Inclusion Index, which increased to 0.90 in 2016 from 0.77 in 2011.
Chapter 5.indd 103 10/21/17 12:00 AM
104 economic report 2017/18
Under the Bank Negara Malaysia’s (BNM) Financial Sector Blueprint 2011 – 2020 (FSBP), one of its key objectives is to achieve greater economic efficiency through e-payment. BNM has undertaken efforts to promote e-payment such as formulating an E-Payments Roadmap in the FSBP and creating an enabling environment to spur the adoption of e-payments. These include pricing reforms; expansion in access points; enhancements in the quality and security features; and instilling greater awareness and confidence in the use of e-payments. As of 2016, the average e-payment transactions for individuals stood at 97 compared with 49 in 2011.3
The launching of Digital Free Trade Zone (DFTZ) in 2017 witnessed significant development in Malaysia’s e-wallet market. This includes collaboration of Ant Financial Services Group, the operator for Alipay, with Touch ‘n Go which is expected to transform the payment system landscape in Malaysia. The entry of global players into the Malaysian market will drive competition and encourage more players to participate in the e-wallet segment.
Conclusion
As the e-wallet segment evolves, enhancements and innovations are expected, particularly in the technological front, such as possibilities of e-wallet analytics. E-wallet providers could leverage on data analytics and data mining for targeted marketing, given their ability to capture data by tracking and connecting users’ actions across different services and retailers. This would allow retailers to give the relevant mobile offers and coupons to their customers. In addition, e-wallet providers could offer small credit or financing to the users, given their ability to assess consumers’ creditworthiness and their consumption patterns. Adoption of data analytics will change the marketing strategy for businesses in the future.
3 Financial Stability and Payment System Report (2016). Bank Negara Malaysia.
Closed Wallet: Money kept in the issuing merchant’s account.
Semi-Closed Wallet: Money managed by payment company, kept in an escrow account.
Open Wallet: Money kept in agent bank’s account.
What happen to the money inside the wallet?
Use for transactions at selected merchants,
depending on wallet type
Payment settlement and amount
deducted from e-wallet
User creates e-wallet account or download and
install e-wallet apps
User makes payment
Payment information transmitted to the provider
Provider transfer payment into merchant’s account
Load e-wallet
with funds
Wallet Types
Closed Wallet: Exclusive issuance by a company for its customers to be used at merchant’s store.
Semi-Closed Wallet: Wallet can be used for purchases of goods and services, including financial transactions at participating merchants.
Open Wallet: Similar to semi-closed wallet with an additional feature of cash withdrawal.
Figure 5.1.1. E-Wallet Operation
Chapter 5.indd 104 10/21/17 12:00 AM
105economic report 2017/18
Favourable growth in DFIs
The development financial institutions (DFIs) continue to support the economy as reflected by favourable growth in financing. Following the Development Financial Institutions (Amendment) Act 2015, prudential measures have been enhanced to improve the resilience and effectiveness of DFIs, particularly in the areas of corporate governance, related party transactions and internal audit. As at end-July 2017, DFIs’ total financing outstanding grew 4.2% to RM143.7 billion (end-July 2016: 4.6%, RM138 billion) supported by the growth in the households, construction and agricultural sectors. Financing disbursed by DFIs to SMEs rebounded 28.3% to RM4.3 billion in the first seven months of 2017 (January – July 2016: -10.6%; RM3.3 billion). Meanwhile, financing approved to SMEs recorded RM4.2 billion (January – July 2016: RM5.9 billion). As at end-July 2017, DFIs’ financing outstanding to SMEs totalled RM13.7 billion (end-July 2016: RM14.7 billion), mainly to the primary agriculture; wholesale and retail trade, restaurants and hotels; and construction sectors.
an increase of 9.5% to reach RM783 billion (end-July 2016: 9.8%; RM714.8 billion), representing 28.8% of total banking system assets (end-July 2016: 27.3%). Total financing rose 12% to RM578.4 billion, accounting for 34.2% of total loans in the banking system (end-July 2016: 10.4%; RM516.2 billion; 32.6%), reflecting sustained demand for Shariah-compliant financial solution.
The growth in total financing was supported by increased disbursements to businesses at 16.3% and households 9.4% (end-July 2016: 12%; 9.5%). More than half of the total financing was extended to the households sector (60.4%) totalling RM349.5 billion as at end-July 2017. This was followed by the finance, insurance business services and real estate sector, accounting for 11.2% or RM64.6 billion as well as the construction sector at 4.8% or RM27.9 billion. Total deposits and investment accounts grew 10.3% to RM640 billion and comprised 33.4% of total deposits in the banking system (end-July 2016: 9.6%; RM580.5 billion; 31.7%). During the period, total amount of funds mobilised through investment accounts increased to RM74.8 billion (end-July 2016: RM68.3 billion).
Malaysia remains at the forefront of Islamic finance innovation with the establishment of Investment Account Platform (IAP) in February 2016. IAP utilises financial technology to provide an efficient intermediation to customers. Financing raised via the IAP in the first half of 2017 recorded more than tripled to RM72 million (end-June 2016: RM20 million). The types of businesses listed on the IAP are diverse, which include cooperatives, SMEs and established companies. Financing raised by businesses are particularly for working capital and project financing, with the size of financing between RM5 million to RM10 million. Most of the financing was for a period of between one to three years.
The Shariah non-compliance risk in the Malaysian Islamic finance sector is relatively low, given various safeguards to mitigate such risk. This includes providing greater clarity on each Shariah contractual requirement to support innovation and mitigate risks in the industry. During the first half of 2017, policy document on wa’d (promise) were issued. The finalised policy document on rahn (collateral) and bai al-sarf (currency exchange) which will be issued by the end of 2017, will mark the completion of the compendium of Shariah regulatory standards that are widely applied in Islamic finance industry.
Note: DFIs refer to Bank Kerjasama Rakyat Malaysia Bhd, Bank Pembangunan Malaysia Bhd, Bank Pertanian Malaysia Bhd, Bank Perusahaan Kecil & Sederhana Malaysia Bhd, Bank Simpanan Nasional and Export-Import Bank of Malaysia Bhd. Total may not add up due to rounding.Source: Bank Negara Malaysia.
Table 5.4. Development Financial Institutions: Direction of Lending by Sector(End-July)
3 Refers to Islamic banks and DFIs offering Islamic banking products.
Sustained demand for Islamic banking
The Islamic banking3 industry continued to expand in terms of assets, deposits and financing. As at end-July 2017, total assets of Islamic banks and DFIs offering Islamic banking products recorded
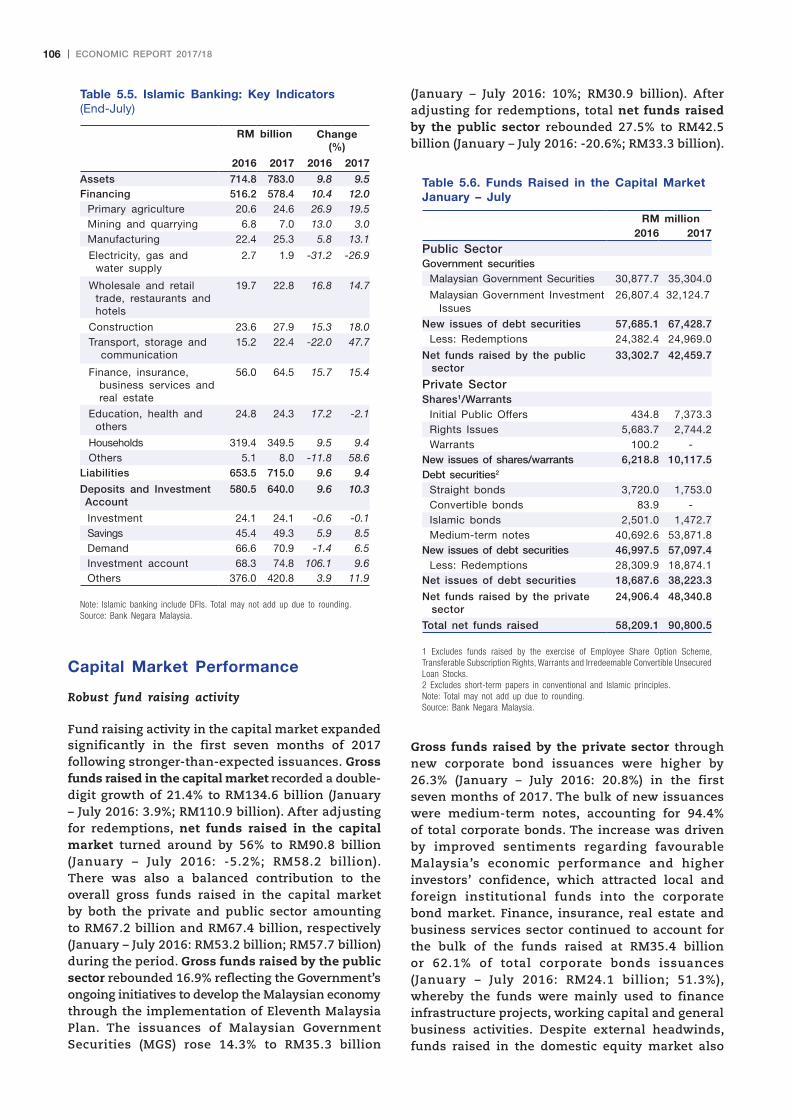
New issues of debt securities 46,997.5 57,097.4Less: Redemptions 28,309.9 18,874.1
Net issues of debt securities 18,687.6 38,223.3
Net funds raised by the private sector
24,906.4 48,340.8
Total net funds raised 58,209.1 90,800.5
1 Excludes funds raised by the exercise of Employee Share Option Scheme, Transferable Subscription Rights, Warrants and Irredeemable Convertible Unsecured Loan Stocks.2 Excludes short-term papers in conventional and Islamic principles.Note: Total may not add up due to rounding.Source: Bank Negara Malaysia.
Table 5.6. Funds Raised in the Capital MarketJanuary – July
Capital Market Performance
Robust fund raising activity
Fund raising activity in the capital market expanded significantly in the first seven months of 2017 following stronger-than-expected issuances. Gross funds raised in the capital market recorded a double-digit growth of 21.4% to RM134.6 billion (January – July 2016: 3.9%; RM110.9 billion). After adjusting for redemptions, net funds raised in the capital market turned around by 56% to RM90.8 billion (January – July 2016: -5.2%; RM58.2 billion). There was also a balanced contribution to the overall gross funds raised in the capital market by both the private and public sector amounting to RM67.2 billion and RM67.4 billion, respectively (January – July 2016: RM53.2 billion; RM57.7 billion) during the period. Gross funds raised by the public sector rebounded 16.9% reflecting the Government’s ongoing initiatives to develop the Malaysian economy through the implementation of Eleventh Malaysia Plan. The issuances of Malaysian Government Securities (MGS) rose 14.3% to RM35.3 billion
Gross funds raised by the private sector through new corporate bond issuances were higher by 26.3% (January – July 2016: 20.8%) in the first seven months of 2017. The bulk of new issuances were medium-term notes, accounting for 94.4% of total corporate bonds. The increase was driven by improved sentiments regarding favourable Malaysia’s economic performance and higher investors’ confidence, which attracted local and foreign institutional funds into the corporate bond market. Finance, insurance, real estate and business services sector continued to account for the bulk of the funds raised at RM35.4 billion or 62.1% of total corporate bonds issuances (January – July 2016: RM24.1 billion; 51.3%), whereby the funds were mainly used to finance infrastructure projects, working capital and general business activities. Despite external headwinds, funds raised in the domestic equity market also
(January – July 2016: 10%; RM30.9 billion). After adjusting for redemptions, total net funds raised by the public sector rebounded 27.5% to RM42.5 billion (January – July 2016: -20.6%; RM33.3 billion).
Chapter 5.indd 106 10/21/17 12:00 AM
107economic report 2017/18
strong demand by domestic institutional investors kept yields at low levels despite non-residents unwinding their holdings of MGS.
MGS yields began to decline in April 2017 amid the resumption of non-resident inflows into the Government bonds across all tenures. The declining trend partly reflected positive developments arising from FMC’s second initiatives announced on 13 April 2017 where registered investors were able to conduct full dynamic hedging and resident investors are allowed to do short-selling for MGS. As at end-July 2017, yields on 3-year and 10-year MGS saw a year-to-date decline of 11 and 24 basis points, respectively, while yields on 5-year notes remained unchanged during the period. Non-resident holdings of Government bonds fell to 25.4% of total Government bonds outstanding as at end-July 2017 (end-July 2016: 34.1%). In the MGS market, non-resident investors sold RM19.6 billion of MGS in the first seven months of 2017 (January – July 2016: +RM23.2 billion), bringing the share of non-resident holdings down to 40.1% of total outstanding MGS (end-July 2016: 51.9%).
Finance, insurance, real estate and business services
24,121.3 35,447.4 51.3 62.1
Government and other services
10,179.7 6,747.9 21.7 11.8
Wholesale and retailtrade, restaurants and hotels
150.2 89.4 0.3 0.2
Total 46,997.5 57,097.4 100.0 100.0
Note: Includes corporate bonds issued by Cagamas and non-resident corporations. Total may not add up due to rounding.Source: Bank Negara Malaysia.
Table 5.7. New Issuance of Corporate Bonds by Sector January – July
%
20142013 2015 2016 2017
2.5
3.0
3.5
4.0
4.5
5.0
J1JMDSJMDSJMDSJMDSJM
Figure 5.4. Malaysian Government SecuritiesIndicative Yields(End - period)
1 End-July 2017.Source: Bank Negara Malaysia.
10-year5-year
3-year1-year
%
240
280
320
360
400
440
J1JMDSJMDSJM35
40
45
50
55
60
20162015 2017
Figure 5.5. Share of Foreign Holdings in Total MGSOutstanding(End - period)
1 End-July 2017.Source: Bank Negara Malaysia.
RM billion
Total MGS outstandingShare of foreign holdings (right scale)
During the first seven months of 2017, Government bond yields were broadly on a declining trend. However, yields of short-term notes moved upward at the beginning of the year until March following expectation of US Federal Reserve’s (Fed) interest rate hike in March 2017. Yields remained high during the period as investor sentiment were dragged lower following uncertainties in the external environment. These include the US policy reforms and the phase of the Fed’s interest rate normalisation coupled with Brexit and the elections in EU countries. Nevertheless, the sustained and
In the corporate bond market, yields of the higher-rated notes also continued to benefit from the demand by domestic institutional investors. Investors’ confidence was also boosted by strengthening ringgit and strong economic growth owing to healthy domestic demand and firm exports. Yields also were lower as demand for Malaysian bonds was driven by BNM’s initiative to liberalise capital market regulations for foreign investors effective 2 May 2017. As at end-July 2017, the yields on the 5-year AAA-rated, AA-rated and A-rated corporate bonds recorded a year-to-date decline of 11, 13 and four basis points, respectively.
Corporate bond credit spreads narrowed in the first seven months of 2017, reflecting continued demand in the corporate bond market. Credit spreads also were tighter as investors bought corporate bonds in the first half of this year due to improved risk
increased significantly with 10 initial public offerings (IPOs) worth RM7.4 billion recorded in the first seven months of 2017 (January – July 2016: 7 IPOs; RM0.4 billion) in tandem with improving domestic economy.
Chapter 5.indd 107 10/21/17 12:00 AM
108 economic report 2017/18
appetite and better credit conditions. As a result, the 5-year corporate bond credit spreads for AAA-rated, AA-rated and A-rated debt narrowed by 10, 12 and four basis points, respectively. Likewise, the MGS term spreads also narrowed by 18 basis points during the same period.
on the back of the Organization of Petroleum Exporting Countries (OPEC) production cut. Investors’ confidence remained upbeat with the FBM KLCI surpassing the 1,700 level on 13 February 2017. Furthermore, strong foreign funds inflow helped to lift the local bourse in March and April 2017.
The FBM KLCI closed at a year-to-date high of 1,792.35 points on 14 June 2017. The positive sentiment was largely driven by optimism over global trade and economic growth. The market also increased on the back of improvements in domestic corporate earnings coupled with the stabilisation of the global crude oil prices following OPEC’s announcement on the extension of its production cut into 2018. The active participation of foreign funds also played an important role in the market’s performance whereby cumulative foreign buying surged substantially in the first half of 2017, the highest among its ASEAN peers.
However, the FBM KLCI retraced to the 1,750 level beginning July 2017 amid anticipation of tighter monetary policies following the statement of major central banks. Investors also remained on the side lines, weighed down by geopolitical concerns. Nevertheless, the FBM KLCI recovered to 1,760.03 points towards the end of July 2017 after the IMF revised its forecast on Malaysia’s economic growth from 4.5% to 4.8% for 2017. The market continued its positive momentum in August as investor sentiment was boosted by the announcement of June’s higher domestic trade surplus. The FBM KLCI continued to close higher after crude oil prices bounced from its three-week low in mid-August 2017. The market performance was also driven by better-than-expected second quarter GDP growth, strengthening ringgit and improved corporate earnings. As at end-August 2017, the FBM KLCI gained 8% year-to-date or 131.4 points to close at 1,773.16 points (end-August 2016: -0.9%; -14.5 points; 1,678.06 points).
Value of transaction (RM)Total transaction (units)
PointsBillion
Composite Index1 (right scale)
1 As at end-period.2 End-August 2017.Source: Bursa Malaysia.
%
2013 2014 2015 2016 2017
3456789
101112 BBB
A
AA
AAAJ1JMDSJMDSJMDSJMDSJM
Figure 5.6. 5-Year Corporate Bond Yields(End - period)
1 End-July 2017.Source: Bank Negara Malaysia.
Steady uptrend in the FBM KLCI
The Financial Times Stock Exchange (FTSE) Bursa Malaysia Kuala Lumpur Composite Index (FBM KLCI) was on a gradual uptrend in the first eight months of 2017 in line with other regional bourses. The equity market commenced the year on a positive note, particularly due to improving sentiment following the US pro-growth policies and China’s strong economic performance. The market also rose amid recovery in crude oil prices
Chapter 5.indd 108 10/21/17 12:00 AM
109economic report 2017/18
There has been a significant improvement in trading activities in the first eight months of 2017 compared with the preceding period. Total market transactions on Bursa Malaysia surged 40.4% to 427.6 billion units (January – August 2016: -5.9%; 304.5 billion units). Likewise, total market transacted value rose 25.1% to RM406.3 billion (January – August 2016: -3.4%; RM324.7 billion). Average daily trading volume and value increased to 2.6 billion units and RM2.5 billion, respectively (end-August 2016: 1.9 billion units; RM2 billion). As at end-August 2017, the market capitalisation increased 9% to RM1,847.3 billion (end-August 2016: 8.9%; RM1,694.4 billion). Market velocity was sustained at 32%, while market volatility was lower at 4.3% (January – August 2016: 27.7%; 7.1%). Meanwhile, foreign shareholdings based on market capitalisation in the local bourse climbed to 23.4% as at end-August 2017 (end-August 2016: 23%).
Slower trading in the derivatives market
The derivatives market declined 1.5% to 9.4 million contracts in the first eight months of 2017 (January – August 2016: 4.2%; 9.6 million contracts). Total volumes traded on the derivatives market were muted as regulatory changes as well as geopolitical tensions affected investor’s interest. The crude palm oil futures (FCPO) remains the key driver for the market during the period, accounting for 84.7% of total contracts traded, while other derivative instruments added only a small contribution to the trading.
Trading volume of FCPO increased 4.4% to 8 million contracts (January – August 2016: 6.1%; 7.7 million contracts) attributed to investors’ expectation of higher crude palm oil (CPO) prices arising from lower inventory and production. Average prices of the benchmark 3-month CPO rose to RM2,667 per tonne (January – August 2016: RM2,520 per tonne) in line with the decline of CPO stocks and increase in the crude oil prices. However, trading volume
of FBM KLCI futures (FKLI) recorded a decline of 25.3% to 1.4 million contracts (January – August 2016: -2.6%; 1.9 million contracts), weighed down by the extremely low volatility of the underlying equity index. Meanwhile, the performance of Options on FKLI (OKLI) showed significant improvement with 14,980 contracts traded in the first eight months of 2017 (January – August 2016: 5,544 contracts) on the back of positive impact from the OKLI Development Plan 2016/2017.4 In contrast, trading in Options on FCPO (OCPO) declined to 22,849 contracts during the same period (January – August 2016: 26,720 contracts).
In terms of participation, domestic investors in the Malaysian derivatives market stood at 60% in the first eight months of 2017, while foreign players made up the remaining 40%. To further enhance the attractiveness and competitiveness of the Malaysian derivatives market, the clearing for securities and derivatives was introduced on 23 June 2017 as a new regulated activity. This structure enables large and well-capitalised financial institutions to come into the market as stand-alone clearing participants and provide third party clearing, which in turn promotes accessibility of the market to traders globally.
Vibrant unit trust industry
Unit trust funds have become popular assets among Malaysian investors. During the first seven months of 2017, an additional 16 new funds were launched bringing the total number of unit trust funds to 639, comprising 433 conventional funds and 206 Islamic funds (end-July 2016: 7 new funds; 623 funds; 425 conventional funds; 198 Islamic funds). Total units in circulation rose
4 Bursa Malaysia Derivatives Berhad introduced the one-year OKLI Development Plan 2016/2017 on 1 July 2016 to expand the trading volume of OKLI.
JapanUKThailandMalaysiaChina (Shanghai) IndonesiaUS (Dow Jones)Singapore PhilippinesRepublic of KoreaViet NamIndiaUS (Nasdaq)Hong Kong
0 4 8 12 16 20 24 28
Figure 5.8. Performance of Selected Stock Markets(% change)
Source: Bloomberg.
End-2016 — End-August 2017
2016 2017
Number of management companies 35 36Number of funds launched 623 639
Conventional 425 433Shariah-compliant 198 206
Units in circulation (billion) 474.4 540.1Number of accounts (million) 18.3 18.8NAV (RM billion) 352.7 413.3
Note: Total may not add up due to rounding.Source: Securities Commission Malaysia.
Table 5.9. Unit Trust Industry: Selected Indicators(End–July)
Chapter 5.indd 109 10/21/17 12:00 AM
110 economic report 2017/18
Key Capital Market Measures Several measures were undertaken in the first eight months of 2017 to further
enhance liquidity and efficiency in the capital market. These include the following:
20 March
13 April
29 August
23 June
25 May
27 February
21 March
9 May
15 June
27 July
Green Lane Incentive to Top 30 CompaniesThe Green Lane Policy (GLP) incentive was implemented to the top 30 listed companies based on their good standard of corporate governance conduct and disclosure practices. The GLP grants certain privileges to these listed companies including faster issuance of circulars to shareholders.
Amendments of Regulatory Framework to Include Clearing as a New Regulated ActivityThe new amendments will decouple clearing and trading functions into two distinct regulated activities, allowing intermediaries to specialise in their niche services. The entrance of new stand-alone execution and clearing intermediaries, which include foreign owned entities, will transform the competitive dynamics of the capital market and enhance cost efficiency for trading and clearing activities.
The MidS Research SchemeThe Mid and Small Cap (MidS) Research Scheme was initiated with the primary objective of creating better value recognition of mid- and small-cap companies as they formed an important segment of the listed equity asset class within the overall capital market. Under this Scheme, an inaugural batch of 100 mid- and small-cap public listed companies (PLCs) will receive independent analyst coverage by licensed research houses.
New Guideline to Allow the RSS of Corporate BondsPrincipal Dealers are now permitted to conduct RSS based on the new Guideline on Regulated Short Selling of Corporate Bonds. The Guideline aims to provide certainty to the parties who would be permitted to conduct short selling of corporate bonds as well as the requirements involved.
New Framework for Listing of MOG CorporationsAmendments were made to the Equity Guidelines, Prospectus Guidelines and Asset Valuation Guidelines. The amended guidelines aim to provide clarity on the types of Mineral, Oil and Gas (MOG) businesses considered suitable and eligible for listing on Main Market, particularly for those engaged in early stage exploration and extraction of MOG resources.
BMDC Implements Settlement via RENTASWith the adoption of RENTAS, Bursa Malaysia
Derivatives Clearing Berhad (BMDC) can now use the system to collect settlement obligations from
clearing participants before the start of the morning trading session. The change to RENTAS will ensure greater efficiency and resilience of the
settlement payments mechanism.
New Listing Requirements and Various Amended Rules for the LEAP Market
The Leading Entrepreneur Accelerator Platform (LEAP) Market complements both the Main Market and ACE Market to address the funding gap faced
by SMEs. It also enhances the existing SME funding ecosystem and addresses the
over-dependency of these SMEs on financialinstitutions by providing them access to the
capital market. The new rules are premised onthree key underlying principles, namely cost
efficiency, balanced and proportionate regulationas well as a qualified market for
Sophisticated Investors.
Digital Investment Management Framework Digital Investment Management Framework sets out licensing and conducts requirements for the offering
of automated discretionary portfolio management services to investors. Digital investment management
is a fund management business which incorporates innovative technologies into discretionary portfolio
management services.
ISSB-NT FrameworkThe introduction of the Islamic Securities Selling
and Buying Negotiated Transaction (ISSB-NT) Framework aims to provide a Shariah-compliant alternative to the SBL-NT Framework, to further grow the Shariah-compliant securities.
Tick Rule on RSS and the SBL-NT Failed Trade Proposal Frameworks
The revised Tick Rule on Regulated Short Selling (RSS) and the Securities Borrowing and Lending -
Negotiated Transactions (SBL-NT) Failed Trade Proposal Frameworks were implemented to create a
more efficient marketplace for price discovery and trading.
Chapter 5.indd 110 10/21/17 12:00 AM
111economic report 2017/18
13.8% to 540.1 billion units, while the number of accounts increased 3.2% to 18.8 million (end-July 2016: 5%, 474.4 billion units; 2.3%, 18.3 million accounts). The size of unit trust industry in terms of total net asset value (NAV) turned around 17.2% to RM413.3 billion as at end-July 2017 (end-July 2016: -1.2%; RM352.7 billion) equivalent to 22.4% of market capitalisation on Bursa Malaysia (end-July 2016: 21.1%).
As at end-July 2017, wholesale funds contracted to 303 following maturity or termination of funds (end-July 2016: 313 funds). As a result, the total NAV of wholesale funds declined 14% to RM83.3 billion (end-July 2016: 30%; RM96.9 billion). Meanwhile, 26 new global funds were launched for investment in foreign markets amounting to RM1.3 billion during the period (end-July 2016: 28 new funds; RM0.9 billion). Overall, a total of 328 funds have invested in foreign markets, recording a total investment of RM41.6 billion (end-July 2016: 306 funds; RM29.1 billion). However, foreign exposure risks remained minimal at 7.4% of the total NAV (end-July 2016: 5.1%).
The total market capitalisation of the Real Estate Investment Trusts (REITs) increased to RM44.1 billion as at end-July 2017 (end-July 2016: RM41.8 billion). The trading volume increased 23.2% to 1.9 billion units valued at RM3.6 billion (January – July 2016: 11.1%; 1.5 billion units; RM3 billion). To date, there are 18 listed REITs on the Main Market of Bursa Malaysia, of which four are Shariah-compliant. The portfolio of the REITs is predominantly in healthcare, commercial, offices, retail, industrial and hospitality properties.
Exchange-traded funds (ETFs) were introduced to provide investors with an option to trade in a basket of stocks, bonds or other instruments through a tracking of underlying indices. ETFs continued to experience slower growth due to lack of awareness and understanding of the product among investors. The number of ETFs listed on the Main Market of Bursa Malaysia stood at eight with lower total market capitalisation of RM1.9 billion as at end-July 2017 (end-July 2016: 8 ETFs; RM2.5 billion). Thus, the ETFs-Taskforce was formed on 17 May 2017 to enhance greater institutional and retail investors’ participation in the Malaysian capital market. The taskforce proposed several recommendations to improve the ecosystem and further drive growth of the ETF industry in Malaysia
while at the same time promotes more inclusive participation in the domestic capital market. The recommendations include, facilitating issuances and investments, enabling product innovation and intensifying investor engagements.
Higher participation in Private Retirement Scheme
The Private Retirement Scheme (PRS) enables adequate savings for future retirement. To inculcate the culture of retirement savings among youth, the Government introduced a one-off increase on the existing RM500 incentive to RM1,000 to PRS contributors with a minimum accumulated investment of RM1,000. The incentive is for a period of two years from 2017 until 2018. This has led to the significant increase in the participation rate by 27.4% to 253,611 members as at end-July 2017 (end-July 2016: 30.4%; 199,033 members). Likewise, funds improved further with total NAV reaching RM1.8 billion, of which 33.3% were Islamic PRS funds (end-July 2016: RM1.3 billion; 34.4%).
Fund raising platform for SMEs
Leading Entrepreneur Accelerator Platform or known as LEAP is Bursa Malaysia’s latest listing platform launched on 25 July 2017. Currently, 96% of SMEs source their funding through banking institutions, while the remaining 4% from the capital market. Therefore, the LEAP Market will help to address the funding gap faced by the SMEs through providing an alternative fund raising platform other than the existing Main Market and ACE5 Market and to reduce dependency of local SMEs on financial institutions. SMEs that plan to list on LEAP are only required to furnish information memorandum6
instead of a prospectus. However, trading on the LEAP Market is limited to qualified investors or known as Sophisticated Investors.7 On 3 October 2017, an IT solution provider became the first company listed on the LEAP Market. Meanwhile, two new indices, namely the FTSE Bursa Malaysia MidS Cap Index and FTSE Bursa Malaysia MidS Cap Shariah Index were introduced on 25 May 2017, to track performance and generate more interest for capital market products for this segment.
Islamic capital market sustains its leadership position
Malaysia’s Islamic capital market (ICM) sustained its leadership position in the global market supported by an extensive and facilitative regulatory and
5 The Malaysian Exchange of Securities Dealing and Automated Quotation (MESDAQ) Market was transformed into an alternative market known as the Access, Certainty and Efficiency (ACE) Market effective 3 August 2009.6 Refers to documents containing information relating to investment policies, types and users of assets, redemptions policies under normal and unusual circumstances, valuation, custodial details, administrative and risk management procedures as well as fees, charges and expenses relating to investments.7 Sophisticated Investor as per Schedule 6 and 7 of Capital Market Services Act refers to accredited investors; high net-worth entities; and high net-worth individuals.
Key Capital Market Measures Several measures were undertaken in the first eight months of 2017 to further
enhance liquidity and efficiency in the capital market. These include the following:
20 March
13 April
29 August
23 June
25 May
27 February
21 March
9 May
15 June
27 July
Green Lane Incentive to Top 30 CompaniesThe Green Lane Policy (GLP) incentive was implemented to the top 30 listed companies based on their good standard of corporate governance conduct and disclosure practices. The GLP grants certain privileges to these listed companies including faster issuance of circulars to shareholders.
Amendments of Regulatory Framework to Include Clearing as a New Regulated ActivityThe new amendments will decouple clearing and trading functions into two distinct regulated activities, allowing intermediaries to specialise in their niche services. The entrance of new stand-alone execution and clearing intermediaries, which include foreign owned entities, will transform the competitive dynamics of the capital market and enhance cost efficiency for trading and clearing activities.
The MidS Research SchemeThe Mid and Small Cap (MidS) Research Scheme was initiated with the primary objective of creating better value recognition of mid- and small-cap companies as they formed an important segment of the listed equity asset class within the overall capital market. Under this Scheme, an inaugural batch of 100 mid- and small-cap public listed companies (PLCs) will receive independent analyst coverage by licensed research houses.
New Guideline to Allow the RSS of Corporate BondsPrincipal Dealers are now permitted to conduct RSS based on the new Guideline on Regulated Short Selling of Corporate Bonds. The Guideline aims to provide certainty to the parties who would be permitted to conduct short selling of corporate bonds as well as the requirements involved.
New Framework for Listing of MOG CorporationsAmendments were made to the Equity Guidelines, Prospectus Guidelines and Asset Valuation Guidelines. The amended guidelines aim to provide clarity on the types of Mineral, Oil and Gas (MOG) businesses considered suitable and eligible for listing on Main Market, particularly for those engaged in early stage exploration and extraction of MOG resources.
BMDC Implements Settlement via RENTASWith the adoption of RENTAS, Bursa Malaysia
Derivatives Clearing Berhad (BMDC) can now use the system to collect settlement obligations from
clearing participants before the start of the morning trading session. The change to RENTAS will ensure greater efficiency and resilience of the
settlement payments mechanism.
New Listing Requirements and Various Amended Rules for the LEAP Market
The Leading Entrepreneur Accelerator Platform (LEAP) Market complements both the Main Market and ACE Market to address the funding gap faced
by SMEs. It also enhances the existing SME funding ecosystem and addresses the
over-dependency of these SMEs on financialinstitutions by providing them access to the
capital market. The new rules are premised onthree key underlying principles, namely cost
efficiency, balanced and proportionate regulationas well as a qualified market for
Sophisticated Investors.
Digital Investment Management Framework Digital Investment Management Framework sets out licensing and conducts requirements for the offering
of automated discretionary portfolio management services to investors. Digital investment management
is a fund management business which incorporates innovative technologies into discretionary portfolio
management services.
ISSB-NT FrameworkThe introduction of the Islamic Securities Selling
and Buying Negotiated Transaction (ISSB-NT) Framework aims to provide a Shariah-compliant alternative to the SBL-NT Framework, to further grow the Shariah-compliant securities.
Tick Rule on RSS and the SBL-NT Failed Trade Proposal Frameworks
The revised Tick Rule on Regulated Short Selling (RSS) and the Securities Borrowing and Lending -
Negotiated Transactions (SBL-NT) Failed Trade Proposal Frameworks were implemented to create a
more efficient marketplace for price discovery and trading.
Chapter 5.indd 111 10/21/17 12:00 AM
112 economic report 2017/18
tax framework, strong Shariah governance and diverse participation of service providers. The wide ranges of Shariah-compliant products and services which promote good socio-economic values have contributed to its greater demand. As at end-July 2017, a total of 678 Shariah-compliant securities were listed on Bursa Malaysia, representing 75.1% of total listed securities. Meanwhile, the Shariah market capitalisation makes up 60.7% of the total market capitalisation of RM1.8 trillion (end-July 2016: 62.4%; RM1.7 trillion).
On 5 September 2016, Bursa Malaysia-i was introduced as the world’s first end-to-end Shariah-compliant investing platform. Although RM1,587 million of Shariah Average Daily Trading Value (ADV) transacted, only 3.7% (RM58.8 million) were traded on Bursa Malaysia-i as at end-July 2017. To further promote Bursa Malaysia-i, several awareness programmes were conducted involving more than 20,000 retail and institutional investors.
Another Shariah-compliant platform is Bursa Suq Al-Sila’ (BSAS) which facilitates commodity trading for murabahah8 and tawarruq9 transactions. To expand BSAS, Bursa Malaysia has engaged various commodity suppliers to increase the supply base of the market. It has also engaged with potential financial institutions to enhance participation. Currently, there were 136 participants comprising 104 local and 32 foreign participants. As at end-July 2017, BSAS recorded a strong growth of 9.8% in ADV to reach RM18.5 billion with RM1.2 trillion commodities offered and RM2.6 trillion traded. This signifies the growing acceptance of BSAS as a global platform to facilitate murabahah and tawarruq transactions. Leveraging global acceptance of BSAS, ICM will continue its focus on expanding the supply of commodities and enhancing the BSAS infrastructure.
Malaysia also retains its leadership position as the premier sukuk listing destination. Total sukuk issuances in the domestic market accounted for
8 Sale contract with a disclosure of the asset cost price and profit margin to the buyer.9 Purchasing an asset with deferred price, either on the basis of musawamah (sale contract without the disclosure of the asset cost price and profit margin to the buyer) or murabahah, then selling it to a third party to obtain cash.
Feature Article 5.1
Islamic capital market (ICM) in Malaysia has more than doubled between 2006 and 2016. During the period, ICM which comprises of the market capitalisation of Shariah-compliant equities and the value of sukuk outstanding expanded 9.3%.1 Malaysia’s ICM reached RM1.8 trillion, accounting for 59.2% of the total size of the domestic capital market as at end-July 2017. In terms of global Islamic funds, Shariah-compliant assets were previously concentrated in the Middle East. Currently, the economy of other Islamic countries, including Malaysia is also growing and the markets are opening up, contributing to the fast-expanding investor base. As at end-July 2017, Malaysia holds 34% of global Islamic asset under management2
from the total of USD74.6 billion and has the largest number of funds globally, representing 28% of total global number of funds.
1 Compound Annual Growth Rate (CAGR).2 An estimate of funds managed by mutual funds, hedge funds, money management, investment management, wealth management, and private banking businesses. 3 The practice of investing in companies whose business is not considered harmful to society or the environment. Cambridge University Press 2017. Retrieved August 29, 2017, from http://dictionary.cambridge.org.
Bursa Malaysia-i: The World’s First Shariah-Compliant Investment Platform
Introduction
Bursa Malaysia-i, the world’s first end-to-end Shariah investment platform, was launched on 5 September 2016. The overriding goal is to make Malaysia a vibrant trading centre for Islamic-based financial offerings by strengthening ICM products and services and providing a conducive market place for Shariah investing community. In addition, it attracts domestic, regional and global Islamic as well as ethical investments,3 while promoting cross border activities. Bursa Malaysia-i offers a fully integrated Islamic securities exchange platform with a comprehensive range of exchange-related facilities including listing, trading, clearing, settlement and depository services. It leverages existing Bursa Malaysia infrastructure and incorporates Shariah-compliant features.
Chapter 5.indd 112 10/21/17 12:00 AM
113economic report 2017/18
Islamic Participating Organisations
Investors will be able to access Shariah-compliant securities4 listed on the Main Market and ACE Market through the Islamic Participating Organisations (POs). The Islamic POs play an important role in managing funds which are segregated from conventional funds and placed into Shariah-compliant accounts. As at end-July 2017, about 75% of 903 securities on Bursa Malaysia were Shariah-compliant. At the same time, the Shariah market made up 60.7% of the total market capitalisation of RM1.8 trillion. Currently, there are 13 Islamic POs carrying out Islamic stockbroking services, of which 30 POs are registered with Bursa Malaysia Securities.
Shariah Screening
Shariah-compliant securities has to meet parameters established by the Shariah Advisory Council under the Securities Commission Malaysia. Essentially, the screening process of public listed companies is based on two broad categories. These are the core business of the underlying company and its financing structure.
Trading Facilities
Under Bursa Malaysia-i, the trading of the securities should apply the buy-and-sell mechanism according to Shariah principles. The investor is also allowed to execute trading transactions using margin financing provided that the financing structure is Shariah-compliant. In addition, the trade and post-trade services needs to be Shariah-compliant. Unlike conventional platform where funds are parked under an interest bearing mechanism, the settlement is done through Islamic financial institutions. Finally, Muslim investors are obligated to perform zakat from profits derived from Shariah-compliant trading activities.
Bursa Malaysia-i has received numerous global recognition, including the Global Banking and Finance Review Awards for the “Most Innovative Global End-to-End Shariah-Compliant Investing Platform Asia 2017.” In addition, Bursa Malaysia-i was awarded the Gold Award for the “Most Innovative Non-Food and Services Category” during the 2017 Malaysia
International Halal Showcase (MIHAS). Despite these acknowledgements, the volume and value of trades on Bursa Malaysia-i platform remained low. Although RM1,681 million of Shariah-compliant securities Average Daily Trading Value (ADV) was transacted, only 3.6% (RM60 million) were traded on Bursa Malaysia-i as at end-August 2017.
Performance of Bursa Malaysia-i
Interface with brokers(direct or online)
Interface with brokers(direct or online)
All Type ofInvestors
ShariahInvestorsPO Islamic PO
Securities Listed on theMain Market & ACE Market
Shariah Screening
Trading Facilities on Trading Facilities on
FinancialInstitutions
Islamic FinancialInstitutions
Trading
Clearing
Depository
Settlement
Trading
Clearing
Depository
Settlement
Conventional
Shariah
Figure 5.1.1. Shariah Investing Landscapeon Bursa Malaysia-i
Source: Bursa Malaysia.
Chapter 5.indd 113 10/21/17 12:00 AM
114 economic report 2017/18
The low performance of Bursa Malaysia-i is mainly attributed to several factors including:
• Most retail and institutional investorsinvest based on performance of securities, irrespective of Shariah-compliant or conventional. Furthermore, institutional investors do not see the benefits of investing in Shariah-compliant counters through Bursa Malaysia-i platform;
• Islamic POs only concentrate in thedomestic market while foreign markets have not been tapped; and
Table 5.1.1. Shariah-Compliant Securities Listed on Bursa Malaysia
Source: Bursa Malaysia.
i-Indices
FTSE Bursa Malaysia EMAS Shariah IndexFTSE Bursa Malaysia Hijrah Shariah IndexFTSE Bursa Malaysia Small Cap Shariah IndexFTSE Bursa Malaysia MidS Cap Shariah Index
MyETF Dow Jones Islamic Market Malaysia Titans 25 First DanaInfra ETBSMyETF MSCI Malaysia Islamic Dividend Second DanaInfra ETBSMyETF MSCI South East Asia Islamic Dividend Third DanaInfra ETBSMyETF Thompson Reuters Asia Paci�c ex-Japan Agribusiness
Four business activity – based of5%,10%, 20% and 25% benchmarks
Two business activity – based of5% and 20% benchmarks
Public perception or imageImage of the company’s activities
Public perception or imageImage of the company’s activities
Financial ratio of 33% benchmarks- Cash over total assets- Debt over total assets
• Low retail participation of Musliminvestors due to lack of awareness on investment in stock market.
Current Initiatives to Create a Vibrant Bursa Malaysia-i
Various initiatives are being undertaken to increase the participation of both retail and institutional investors on Bursa Malaysia-i. Since the launch of Bursa Malaysia-i, 70 direct engagements have been conducted with market participants including fund managers, institutional investors and more than 20,000 individual retail investors. To further promote Bursa Malaysia-i, Bursa Malaysia has also participated in international roadshows and forums in Beijing, Jakarta, London and Shanghai, among others. In addition, social media engagements via Twitter, Facebook and Instagram were targeted to attract young investors, particularly the Gen-Y or millennial by providing the latest updates and development on Shariah investing and Bursa Malaysia-i.
Conclusion
Bursa Malaysia-i, the world’s first end-to-end Shariah investment platform provides opportunities for investment in Shariah-compliant securities. The low participation signifies the need for a more intensive promotion of Bursa Malaysia-i through creating greater
0
20
40
60
80
100%
Shariah ADV traded on conventional platform
Shariah ADV traded on Bursa Malaysia-i platform
Aug
-17
Jul-1
7
Jun-
17
May
-17
Apr
-17
Mar
-17
Feb-
17
Jan-
17
Dec
-16
Nov
-16
Oct
-16
Sep
-16
Figure 5.1.3. ADV of Bursa Malaysia-i comparedwith Shariah-Compliant Securities
Source: Bursa Malaysia.
Chapter 5.indd 114 10/21/17 12:00 AM
115economic report 2017/18
awareness and enhancing knowledge on capital market products. The biggest impact in terms of participation would be from the domestic institutional investors. In this respect, continuous engagements with the domestic institutional investors to promote Bursa Malaysia-i are being undertaken. Bursa Malaysia also continues to look for opportunities to grow Bursa Malaysia-i and is working
RM83.9 billion or 50.7% of the total bond issuances in the first seven months of 2017. In terms of sukuk outstanding, the sukuk market stood at RM719.5 billion accounting for 57.1% of the total bonds outstanding as at end-July 2017. In terms of global position, total new sukuk issuances in the first seven months increased 47% to USD66.8 billion (January – July 2016: 1.1%; USD45.4 billion) due to higher issuances from Saudi Arabia and Qatar. Malaysia held 26.4% of the market share for new
sukuk issuances or USD17.7 billion (January – July 2016: 47.3%; USD21.5 billion). During the same period, Malaysia continued to maintain its leading position for sukuk outstanding accounting for 50.1% or USD192.2 billion (end-2016: 52.5%; USD182.7 billion). In response to the global needs for green financing, Malaysia issued the world’s first green sukuk on 27 July 2017 with a value of RM250 million. This effort is in line with Malaysia’s pioneering role in innovative Shariah-compliant products.
closely with Islamic POs and other industry players to create and increase awareness on Shariah investing through various education programmes nationwide. Ultimately, these efforts will result in greater participation in Bursa Malaysia-i, providing opportunities for investors to trade in a comprehensive range of exchange-related facilities in accordance with Shariah principles.
End-July 2017
Figure 5.9. Global Sukuk Outstanding by Country(% share)
1Others include Oman; Pakistan; Hong Kong; Bangladesh; Kuwait; Luxembourg; Singapore; UK; US; Ivory Coast; South Africa; Senegal; Brunei; Mauritius; Nigeria; Jordan; Gambia;
Maldives and France.Note: Total may not add up due to rounding. Source: Malaysia International Islamic Financial Centre.
End-2016 Malaysia52.5%
Others4.8%
Saudi Arabia16.3%
Bahrain2.0%
Qatar5.1%
Turkey3.0%
Indonesia7.4%
United ArabEmirates
8.9%
Malaysia50.1%
Others1
4.8%
Saudi Arabia18.4%
Bahrain1.7%
Qatar5.4%
Turkey3.3%
Indonesia8.1%
United ArabEmirates
8.1%
The Islamic fund management industry is vital in sustaining Malaysia as the global leader in Islamic finance. In this regard, on 12 January 2017, the 5-Year Islamic Funds and Wealth Management Blueprint was launched to leverage Malaysia’s well-developed ICM ecosystem to establish Malaysia as a leading international centre for Islamic fund and wealth management. As at end-July 2017, the industry comprised of 20 Islamic fund management companies, with 206 Islamic unit trust funds and 86 Islamic wholesale funds (end-July 2016: 20 companies; 198 funds; 97 funds). The total
NAV of Islamic unit trust funds grew 27.7% to RM70.1 billion (end-July 2016: 11.4%; RM54.9 billion) while the Islamic wholesale funds declined 4.9% to RM35.6 billion (end-July 2016: 64.1%; RM37.5 billion). As at end-July 2017, market capitalisation of four listed Islamic REITs (i-REITs) was recorded at RM17.6 billion (end-July 2016: RM17.2 billion), while market capitalisation of four Islamic ETFs (i-ETFs) stood at RM429.2 million (end-July 2016: RM419.9 million). Islamic assets under management (AUM) accounted for 21.2% or RM160.7 billion of the industry’s total AUM at RM756.8 billion.
Chapter 5.indd 115 10/21/17 12:00 AM
116 economic report 2017/18
Insurance and Takaful IndustryPerformance
Resilient insurance industry
The insurance industry remained resilient in the first seven months of 2017, with strong capitalisation and improved profitability, mainly driven by the life insurance sector. The Capital Adequacy Ratio (CAR) remained firm at 238.5% above the minimum requirement of 130% (January – July 2016: 234.9%). Total capital buffers rose to RM33 billion (January – July 2016: RM29.8 billion).
Total assets of the insurance industry continued to expand to RM253.5 billion as at end-July 2017 (end-July 2016: RM238.3 billion). Total assets for life insurance sector increased 6.6% to RM220.7 billion and remained concentrated in corporate debt securities, accounting for 67.2% of total life insurance assets. The general insurance sector assets also increased 4.5% to RM32.7 billion. Cash and deposits continued to account for the largest asset class held by the general insurers at 22.1% of their total assets.
Life insurance sector recorded a growth of 23.1% in excess of income over outgo, amounting to RM9.8 billion for the first seven months of 2017 (January – July 2016: 22.3%; RM8 billion) on account of higher net capital gains of RM3.2 billion (January – July 2016: RM2.3 billion). The life insurance claims rose 6.3% to RM12.9 billion (January – July
2016: 2.3%; RM12.1 billion). Furthermore, new business premiums grew 6.9% to RM5.9 billion (January – July 2016: 5.9%; RM5.5 billion), which was supported by growth of investment-linked policies. However, new business premiums for ordinary life policies declined 5.5% (January – July 2016: 10.9%). Meanwhile, the life insurance market penetration rate10 stood at 39.4% (January – July 2016: 40.1%) during the period.
10 Measured by the ratio of total number of life insurance and family takaful policies in force to total population.
Figure 5.10. Life and General Insurance Assets(% share)
Life Insurance
End-July 2017
General Insurance
Other assets2
18.5%
Otherinvestment1
28.0%
Cash and deposits22.1%
Loans0.2%
Government securities
10.5%
Corporatesecurities
(equity and debt)20.8%
Otherassets2
6.8%
Other investment1 5.1%
Cash and deposits5.6%
Loans5.9%
Governmentsecurities
9.3%
Corporatesecurities
(equityand debt)
67.2%
1Other investments = Government guaranteed loans + investment properties + others.2Other assets = Property, plant and equipment + foreign assets + others.Source: Bank Negara Malaysia.
2016 2017Life Insurance (RM billion)New business1
Number of policies (units) 14,078,295 8,755,691Sums insured 247.7 257.2Total premiums 5.5 5.9
Business in force2
Number of policies (units) 19,771,533 18,000,789Sums insured 1,507.7 1,548.0Annual premiums 29.6 31.8
Gross direct premiums 10.7 10.6Net premiums 7.5 7.7
Reinsurance placed outside Malaysia
0.6 0.9
Retention ratio3 (%) 70.5 72.6
1 Excludes data for reinsurers.2 As at end-June. Data updated on quarterly basis.3 Proportion of premiums retained in the country.Note: Total may not add up due to rounding.Source: Bank Negara Malaysia.
Table 5.10. Life and General Insurance BusinessJanuary – July
Chapter 5.indd 116 10/21/17 12:00 AM
117economic report 2017/18
During the first seven months of 2017, operating profit of the general insurance sector was lower at RM1.3 billion due to higher claims (January – July 2016: RM1.6 billion). Overall claim ratio stood at 57.3% mainly attributed to higher claim ratio in the motor segment at 71.8% (January – July 2016: 54.1%; 65.7%). At the same time, gross direct premiums also decreased marginally by 0.2% to RM10.6 billion due to lower new subscriptions from the energy segment (January – July 2016: 0.8%; RM10.7 billion). However, gross direct premiums for the motor segment grew 2.2% (January – July 2016: -0.5%), in tandem with the increase in new car sales.
Takaful industry grew further
Takaful industry expanded further during the first seven months of 2017, with assets increasing by 6.8% to RM28.1 billion (January – July 2016: 9%; RM26.3 billion). Islamic debt securities as well as cash and deposits remained the largest asset component, accounting for 54.6% and 15.8% (January – July 2016: 55.1%; 15.9%) of total assets, respectively. The capital position of the takaful industry remained stable with a CAR of 211.4% in the second quarter of 2017.
Family takaful sector recorded a growth of 9.4% or RM1.4 billion in excess of income over outgo during the first seven months of 2017 (January – July 2016: 11.9%, RM1.3 billion). The new family takaful business recorded higher gross contributions of 9.8% amounting to RM2.5 billion (January – July 2016: 7.4%; RM2.3 billion). Ordinary life segment improved 9.9% partly due to increasing awareness
on the need for takaful protection among consumers, while the investment-linked takaful business grew 9.2%. The market penetration rate of family takaful stood at 14.6% during the period (January – July 2016: 14.4%).
The general takaful sector grew 6.8% to RM1.5 billion in gross contributions during the first seven months of 2017 (January – July 2016: 1.9%; RM1.4 billion). Motor and fire classes continued to be the key segments underwritten by the industry. These segments accounted for 58.4% and 22.2% of total gross contributions, respectively. Meanwhile, the operating profit of the sector was lower at RM89.4 million (January – July 2016: RM186.4 million).
New policies and initiatives uplift the industry
The first phase of the Liberalisation of the Motor Tariff and Fire Tariff was introduced on 1 July 2016. Since its introduction until the first half of 2017, insurers and takaful operators were given the flexibility to offer new motor products and add-on covers at market-based pricing. The second phase of the liberalisation which commenced on 1 July 2017 allows insurers and takaful operators to offer Motor Comprehensive and Motor Third Party Fire and Theft products at market pricing. Meanwhile, Third Party product remains tariffed until a review is undertaken in 2019. The premium or contribution will take into account broader risk factors that will drive fairer pricing; greater innovation on new products tailored to consumer needs with improved services; and sustainable protection for consumers over the long-term at competitive prices.
2016 2017Family Takaful (RM billion)New business1
Number of certificates (units) 399,549 385,387Sums covered 190.0 193.8Total contributions 2.3 2.5
Business in force2
Number of certificates (units) 4,545,054 4,678,911Sums covered 632.4 714.2Annual contributions 3.6 4.1
General Takaful (RM billion)Gross direct contributions 1.4 1.5Net contributions 1.1 1.1
Retakaful placed outside Malaysia
0.2 0.2
Retention ratio3 (%) 85.5 84.8
1 Excludes data for retakaful.2 As at end-June. Data updated on quarterly basis.3 Proportion of contributions retained within the takaful operator in the country.Note: Total may not add up due to rounding.Source: Bank Negara Malaysia.
Table 5.11. Family and General Takaful BusinessJanuary – July
2016 2017
Number of insurance companies and takaful operators
Table 5.12. Insurance and Takaful BusinessJanuary – July
Chapter 5.indd 117 10/21/17 12:00 AM
118 economic report 2017/18
Prospects for 2018
Given the open nature of the economies and the increasingly interconnected financial markets, the transmission of global monetary conditions to Malaysia is unavoidable. Despite the heightened uncertainties in the global market, Malaysia’s capability and resilience in managing these challenges have been fortified given the strong economic fundamentals as well as a more diversified and well-developed financial market. These advantages will enhance the ability of the financial system to absorb capital inflows and outflows, while ensuring that these capital flows can be effectively intermediated to support the economy.
Domestic financial sector continues to provide conducive environment that encourages innovation in the financial industry. Malaysia continues to strengthen regulatory framework by adopting the principles of transparency, accountability and good governance to manage with the increasing complexity of the financial market. Furthermore, leveraging its leading role in the sukuk market and pioneer in innovative products, Malaysia is well-placed to remain ahead in Islamic finance.