HP-PURDUE-CONFIDENTIAL Final Exam May 16th 2008 Slide No. 1
Outline
Motivations
Analytical Model of Skew Effect and its Compensation in Banding and MTF Characterization
Moiré Artifact Prediction and Reduction in a Variable Data Printing Environment
Conclusions
References
HP-PURDUE-CONFIDENTIAL Final Exam May 16th 2008 Slide No. 2
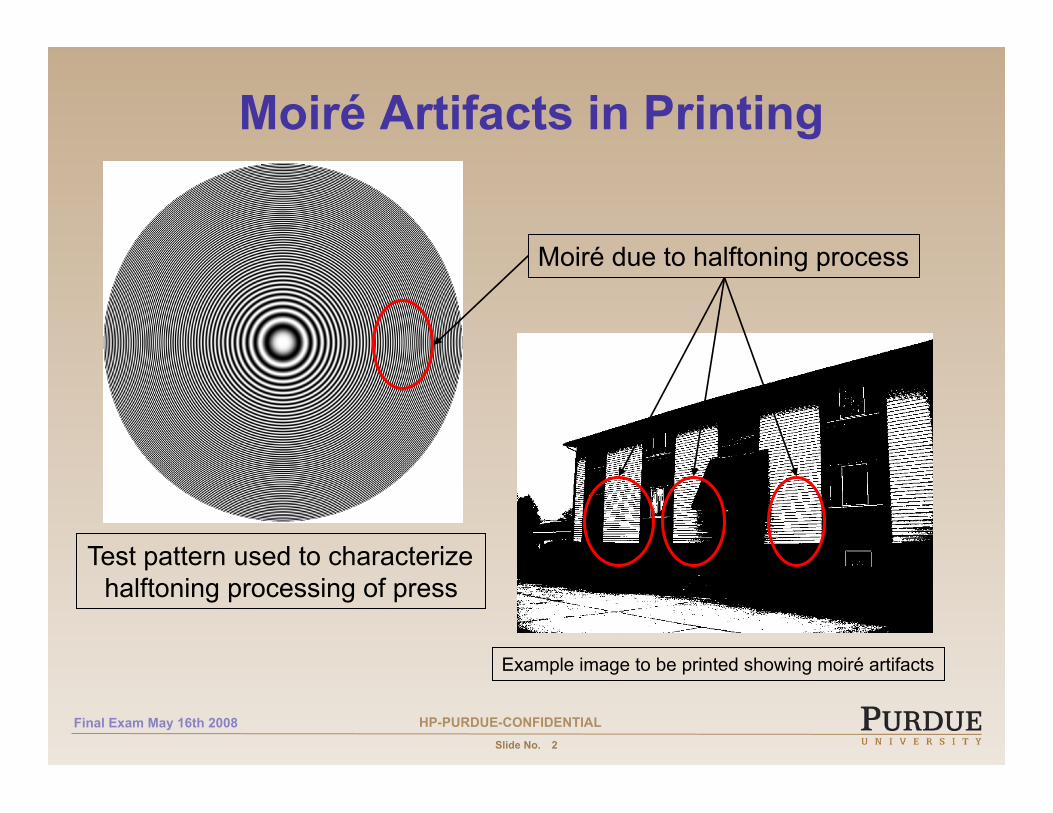
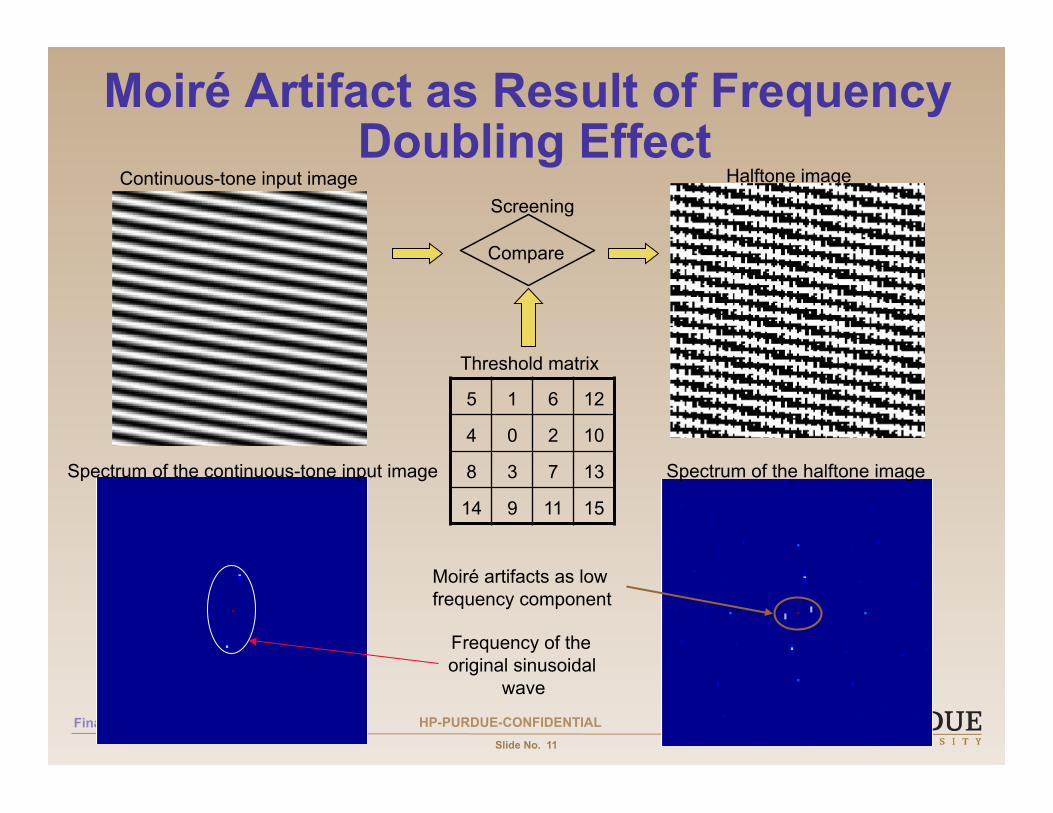
Moiré Artifacts in Printing
Moiré due to halftoning process
Test pattern used to characterize halftoning processing of press
Example image to be printed showing moiré artifacts
HP-PURDUE-CONFIDENTIAL Final Exam May 16th 2008 Slide No. 3
Quality of Embedded Images Example: Moiré Artifact
Business Week, April 30, 2007 p.56
HP-PURDUE-CONFIDENTIAL Final Exam May 16th 2008 Slide No. 4
Document Composition Affects Artifact Perceptibility
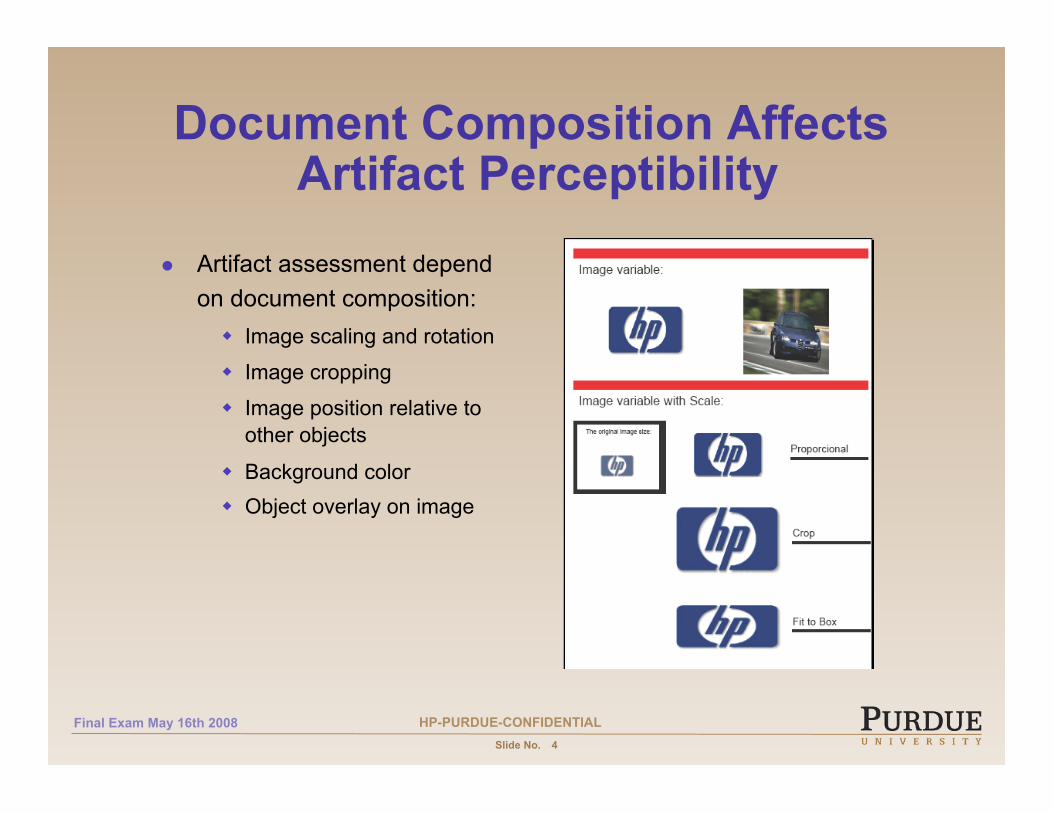
Artifact assessment depend on document composition:
Image scaling and rotation
Image cropping
Image position relative to other objects
Background color Object overlay on image
HP-PURDUE-CONFIDENTIAL Final Exam May 16th 2008 Slide No. 5
Causes and Difficulties to Detect Moiré Artifacts in VDP
Halftone screen pattern interacts with digital image
Clustered dot profile
Limited spatial resolution of the digital press
Typical digital press :
180 line-per-inch
In digital publishing environment with variable data printing
Inspecting each printed page is not cost efficient
Moiré artifacts are image content dependent
Moiré artifacts vary with the printing device
HP-PURDUE-CONFIDENTIAL Final Exam May 16th 2008 Slide No. 6
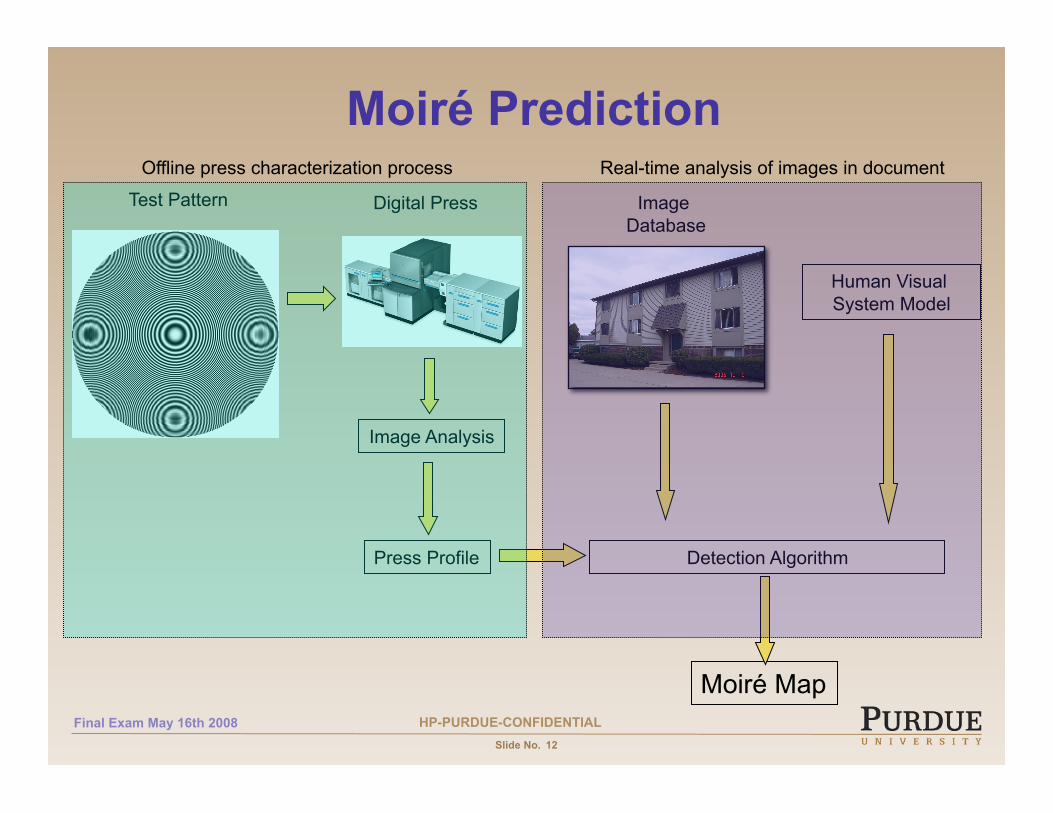
Phases and Components of Automatic Workflow[3]
HP-PURDUE-CONFIDENTIAL Final Exam May 16th 2008 Slide No. 7
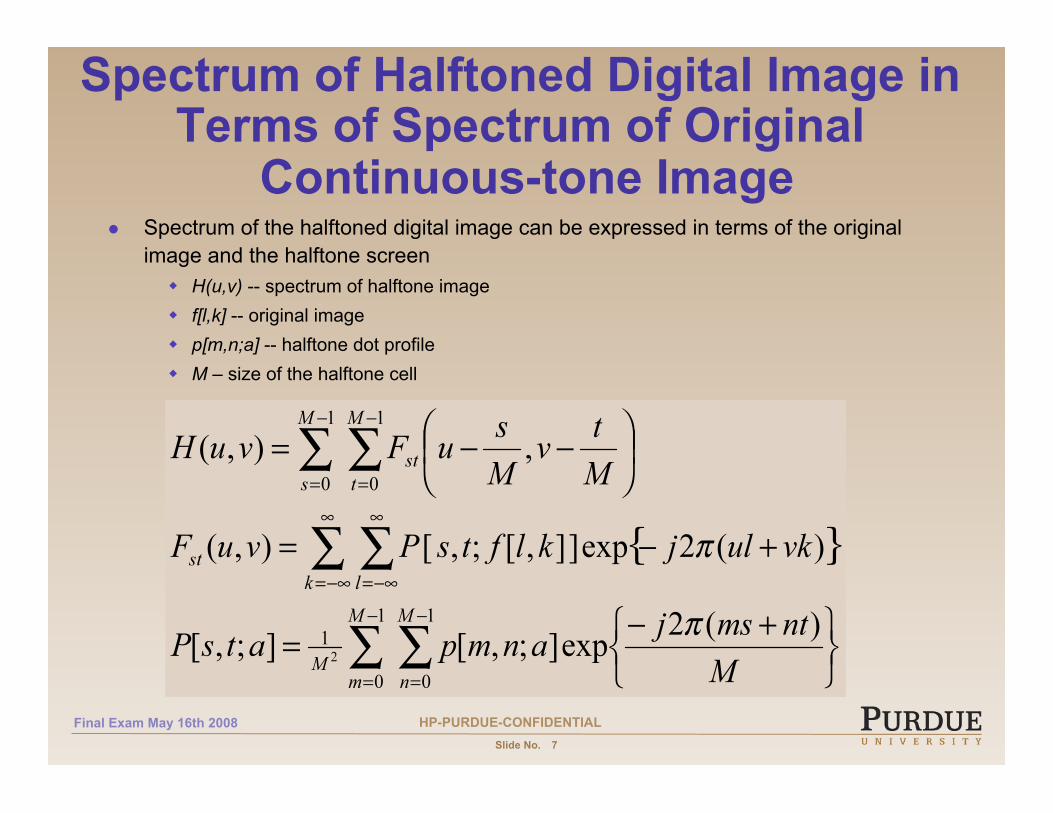
Spectrum of Halftoned Digital Image in Terms of Spectrum of Original
Continuous-tone Image Spectrum of the halftoned digital image can be expressed in terms of the original
image and the halftone screen H(u,v) -- spectrum of halftone image f[l,k] -- original image p[m,n;a] -- halftone dot profile M – size of the halftone cell
HP-PURDUE-CONFIDENTIAL Final Exam May 16th 2008 Slide No. 8
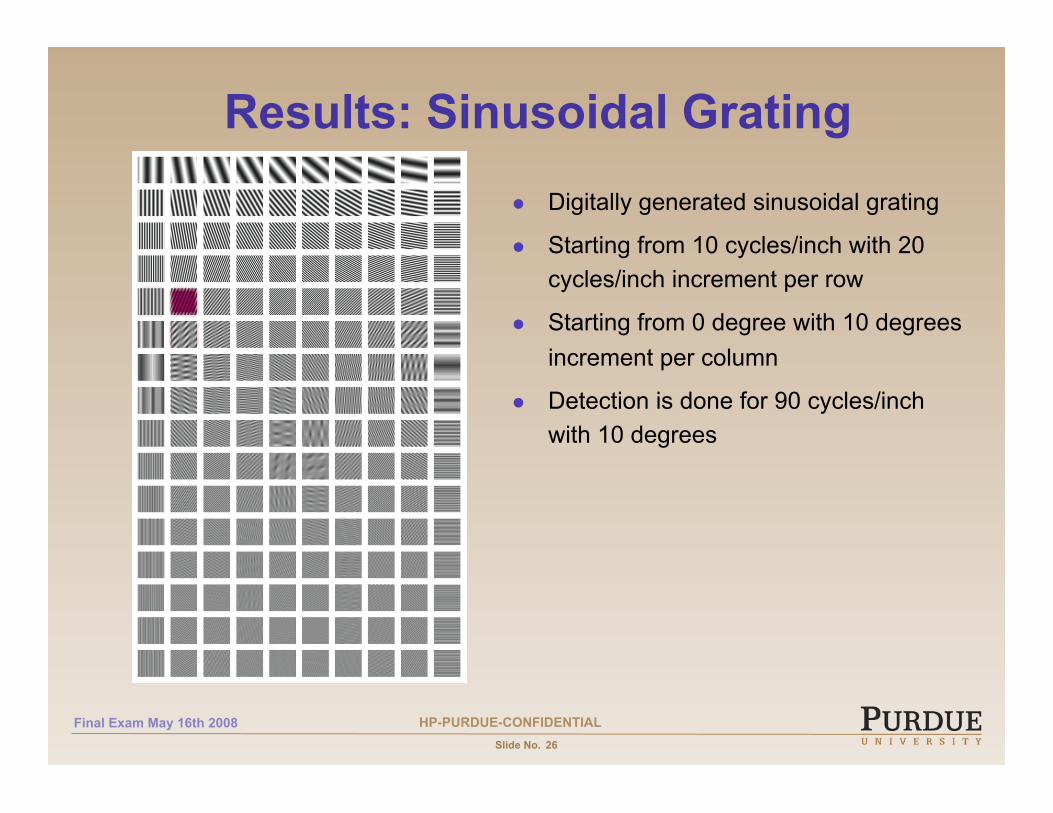
Illustration of Halftone Spectrum for a Sine Wave Image
Continuous-tone input image Halftone image Screening Compare
5 1 6 12
4 0 2 10
8 3 7 13
14 9 11 15
Threshold matrix
Spectrum of the continuous-tone input image Spectrum of the halftone image
Frequency doubling effect
Frequency of the original sinusoidal
wave
HP-PURDUE-CONFIDENTIAL Final Exam May 16th 2008 Slide No. 9
Nonlinear Transformation Due to Halftone
|P[0,0;a]| |P[0,1;a]|
|P[0,2;a]|
|P[1;a]|
f[l]
a
l
l
P[1;f[l]]
1
T
T
0
A B C
A’ B’
C’
HP-PURDUE-CONFIDENTIAL Final Exam May 16th 2008 Slide No. 10
Frequency Doubling Effect Due to Nonlinear Transformation
The frequency doubling effect is due to the non-linear transform caused by the screening process
Clustered halftone dot profile that is used in laser printing is likely to cause this frequency doubling effect
HP-PURDUE-CONFIDENTIAL Final Exam May 16th 2008 Slide No. 11
Moiré Artifact as Result of Frequency Doubling Effect
Continuous-tone input image Halftone image Screening Compare
5 1 6 12
4 0 2 10
8 3 7 13
14 9 11 15
Threshold matrix
Spectrum of the continuous-tone input image Spectrum of the halftone image
Moiré artifacts as low frequency component
Frequency of the original sinusoidal
wave
HP-PURDUE-CONFIDENTIAL Final Exam May 16th 2008 Slide No. 12
Moiré Prediction
Image Database
Press Profile Detection Algorithm
Human Visual System Model
Moiré Map
Image Analysis
Test Pattern Digital Press
Real-time analysis of images in document Offline press characterization process
HP-PURDUE-CONFIDENTIAL Final Exam May 16th 2008 Slide No. 13
Digital Press Characterization
Use Bullseye test pattern Sweep of signal at all angles Spatial frequency at each
location is proportional to its distance to the center
Bullseye test pattern is printed using target digital press
Moiré inducing frequency (MIF) generates low frequency moiré that forms secondary bullseye pattern on the print
After scanning the printout, we detect the secondary bullseye pattern to locate MIF Halftone bullseye test pattern with moiré artifacts
HP-PURDUE-CONFIDENTIAL Final Exam May 16th 2008 Slide No. 14
Moiré Inducing Frequency (MIF) Detection on Test Page
This test pattern shows multiple moiré artifacts patterns
Each moiré artifact exhibits a pattern of concentric circles
The xy coordinates of the center of each pattern of concentric circles correspond to a frequency that may cause moiré artifacts in the printed image
moiré artifacts
HP-PURDUE-CONFIDENTIAL Final Exam May 16th 2008 Slide No. 15
Bullseye pattern halftoned with 150 cycles/inch, 0 degree screen; printed at 600 dpi and scanned at 600 dpi. The red dots indicate detected MIF’s
Symmetry of the Secondary Bullseye Artifacts
The secondary bullseye artifacts are symmetric to the center of the test page
Each secondary bullseye artifact forms concentric circles
Some pairs of secondary bullseye artifacts that are symmetrical to the center show different gray levels
HP-PURDUE-CONFIDENTIAL Final Exam May 16th 2008 Slide No. 16
1-D illustration Image: 5 cycles per inch Screen: 10 cycles per inch
Average: 0.375
Average: 0.4667
Same frequency
HP-PURDUE-CONFIDENTIAL Final Exam May 16th 2008 Slide No. 17
Anisotropy Measurements on Scanned Bullseye Pattern[4]
Each image pixel’s anisotropy measurement is calculated based on a disk area
Image pixels within the disk is divided into annuli
The width of each annulus is delta, ∆
Image pixels are sorted into annulus (bins) based on their distance to the center of the region
Mean and variance are calculated for each bin
Calculate Anisotropy for each bin
HP-PURDUE-CONFIDENTIAL Final Exam May 16th 2008 Slide No. 18
Modified Anisotropy Measurement Secondary Bullseye Artifacts
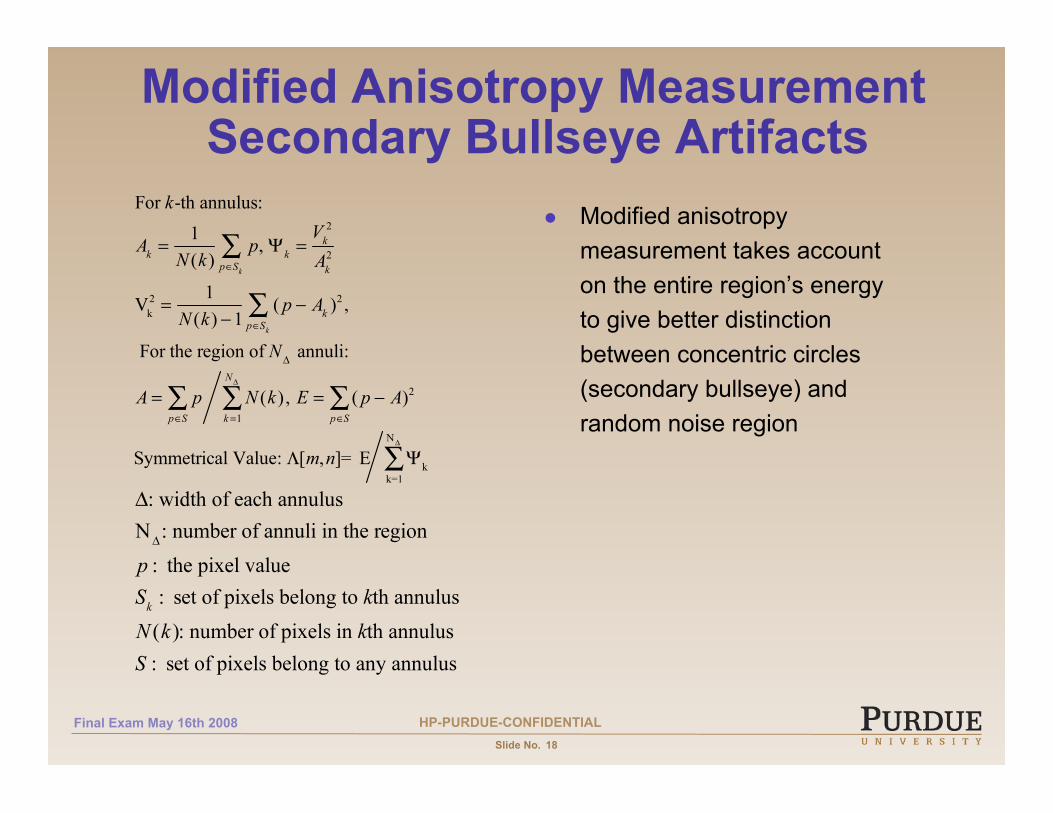
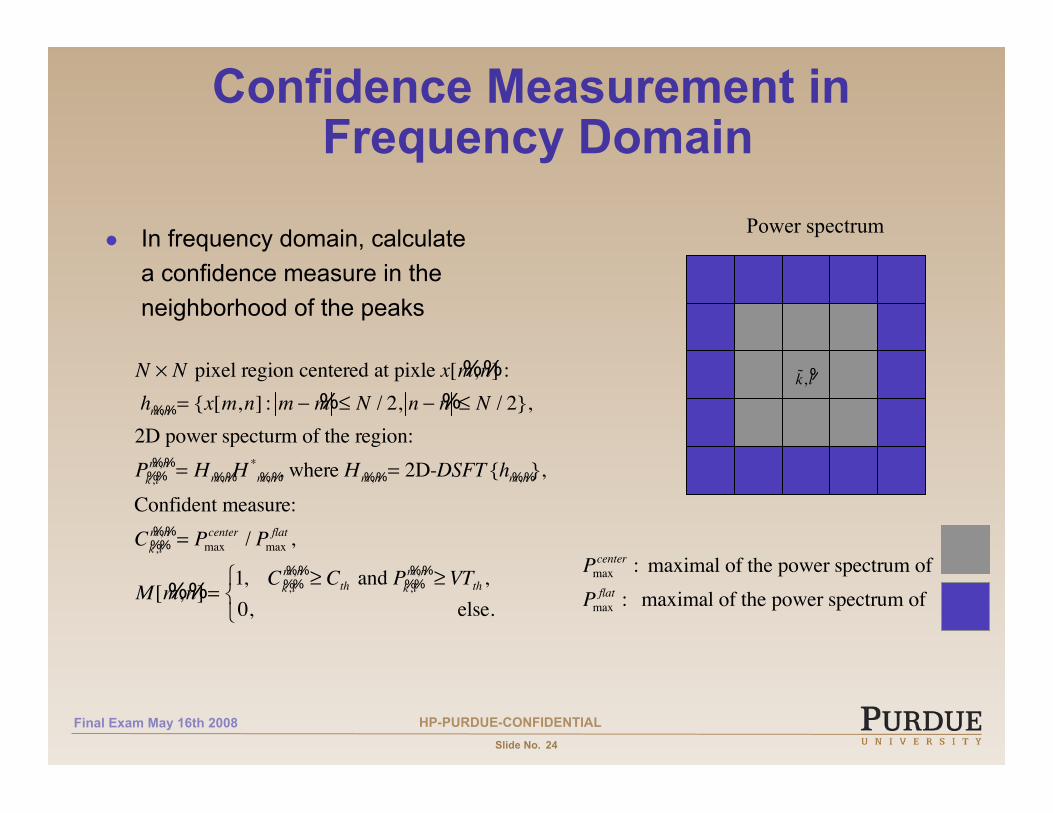
Modified anisotropy measurement takes account on the entire region’s energy to give better distinction between concentric circles (secondary bullseye) and random noise region
HP-PURDUE-CONFIDENTIAL Final Exam May 16th 2008 Slide No. 19
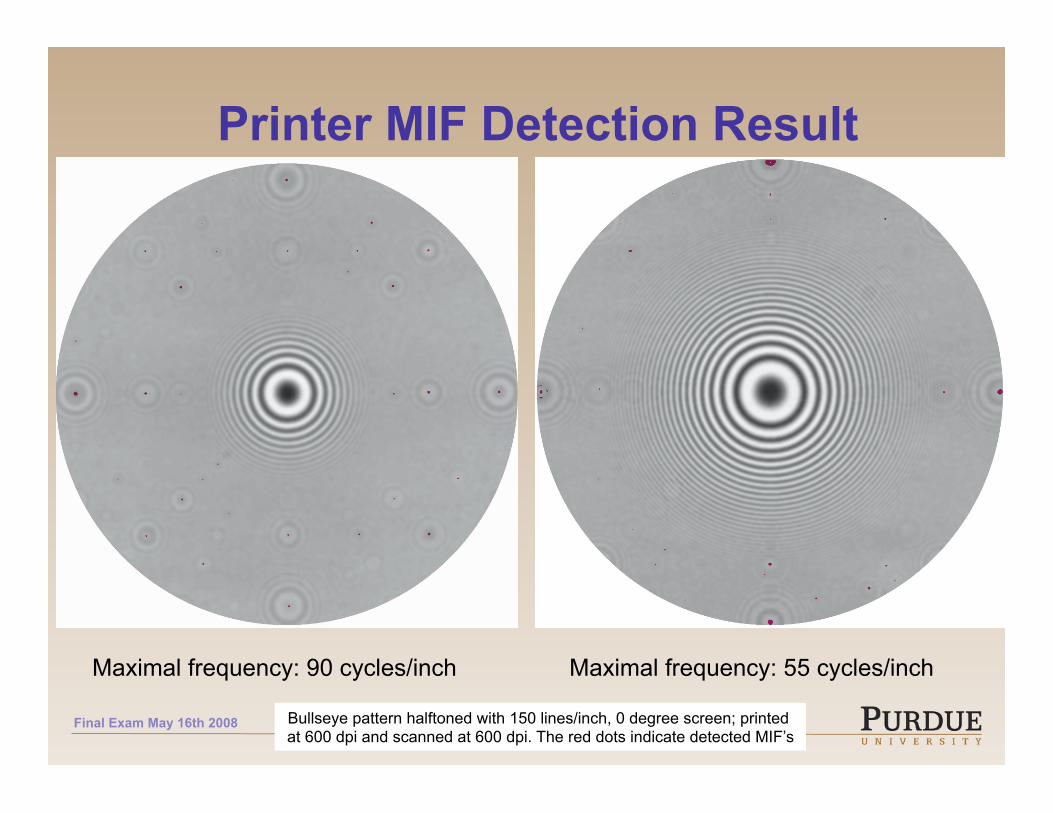
Bullseye pattern halftoned with 150 lines/inch, 0 degree screen; printed at 600 dpi and scanned at 600 dpi. The red dots indicate detected MIF’s
Printer MIF Detection Result
Maximal frequency: 90 cycles/inch Maximal frequency: 55 cycles/inch
HP-PURDUE-CONFIDENTIAL Final Exam May 16th 2008 Slide No. 20
MIF Detection on Test Page Radial Frequency
(cycles per inch)
Angle
(degrees)
37 ±90
50 ±90
75 ±90
57 ±64
67 ±64
75 ±64
50 ±45
72 ±45
75 ±45
57 ±26
67 ±26
75 ±26
37 0
45 0
75 0
HP-PURDUE-CONFIDENTIAL Final Exam May 16th 2008 Slide No. 21
MIF detection in the continuous-tone input image
Based on press profile, measure the energy of MIF in power spectrum of the digital image
Find peaks in the spectrum of the continuous-tone image that corresponding to MIF frequency
In frequency domain, calculate a confidence measure in the neighborhood of the peaks
Calculate the size of each detected region to eliminate false alarms due to strong edge components
HP-PURDUE-CONFIDENTIAL Final Exam May 16th 2008 Slide No. 22
MIF Detection on Digital Images
Sampling frequency of the digital image on print-out:
Image Metadata in PPML or XML Dimension: image width/height size
Position: Determined by the attribute “Position” in MARK and OBJECT elements
Transform Matrix: provides various image properties such as scale, skew, and translation
Clipping size: determined by the attribute “Rectangle” in CLIP_RECT element
HP-PURDUE-CONFIDENTIAL Final Exam May 16th 2008 Slide No. 23
Indices Representing MIF in Frequency Domain
Check for MIF on the 2D-DSFT of the digital image:
HP-PURDUE-CONFIDENTIAL Final Exam May 16th 2008 Slide No. 24
Confidence Measurement in Frequency Domain
In frequency domain, calculate a confidence measure in the neighborhood of the peaks
Power spectrum
HP-PURDUE-CONFIDENTIAL Final Exam May 16th 2008 Slide No. 25
Confidence Measure
Strong peak in power spectrum at the MIF location means perceptible moiré is likely to occur in printing
Confidence measure helps to reduce misclassification
Power Spectrum
HP-PURDUE-CONFIDENTIAL Final Exam May 16th 2008 Slide No. 26
Results: Sinusoidal Grating Digitally generated sinusoidal grating
Starting from 10 cycles/inch with 20 cycles/inch increment per row
Starting from 0 degree with 10 degrees increment per column
Detection is done for 90 cycles/inch with 10 degrees
HP-PURDUE-CONFIDENTIAL Final Exam May 16th 2008 Slide No. 27
Misclassification Due to Strong Edges
HP-PURDUE-CONFIDENTIAL Final Exam May 16th 2008 Slide No. 28
Measure Length and Width of Each Detected Region
Project each region to the horizontal and vertical axis of the image plan
Count the number of pixels on each horizontal and vertical position
Regions with maximal length or width less than 2N (N: the 2D DSFT window size) will be removed from mask.
Projection to obtain width
region identified in moiré mask
HP-PURDUE-CONFIDENTIAL Final Exam May 16th 2008 Slide No. 29
Misclassification Regions Removed
HP-PURDUE-CONFIDENTIAL Final Exam May 16th 2008 Slide No. 30
Adaptive Scaling to Reduce Moiré
For each image identified with moiré we scaled the image to reduce moiré artifacts in print-out
Each region on the moiré mask is analyzed to obtain a scale factor
Global scale factor is the maximal of all the regional scale factors
Entire image is scaled by the global factor
HP-PURDUE-CONFIDENTIAL Final Exam May 16th 2008 Slide No. 31
Results: Shirt
Printed using HP LaserJet 5500 with 600 dpi and 150 lpi halftone
Visible moiré artifacts on the shirt region
Successful detection of using the printer profile
HP-PURDUE-CONFIDENTIAL Final Exam May 16th 2008 Slide No. 32
Results: Hotel Original digital image
Moiré mask
Scan of the original image print-out
Scan of the scaled image print-out
HP-PURDUE-CONFIDENTIAL Final Exam May 16th 2008 Slide No. 33
Results: Kodak Window Original digital image
Moiré mask
Scan of the original image print-out
Scan of the scaled image print-out
HP-PURDUE-CONFIDENTIAL Final Exam May 16th 2008 Slide No. 34
Summary
Analyze the relationship between the spectrum of halftone image and that of the original image
Use bullseye pattern to characterize printer
Identified moiré inducing frequency
Predict moiré artifacts based on the image content, image pixel size, and actual printed size
Adaptive image scaling to resize the image so that the new image will not induce moiré artifacts