Page 1
Occurrences of Extreme Weather Events and its..... 200
5.1 FLOODS IN RAJASTHAN
The state of Rajasthan is popularly known as the Desert State of India is
largely water deficit yet there are incidents of flood in that state and there are flood
prone regions as well. The term "flood" relates to two events in Rajasthan firstly,
flooding of river and its catchment under the influence of excessive rainfall depending
on the topography of the regions through which the rivers flows. The second event is
related to the cloudburst that might happen in a specific area.
The floods in rivers mostly occur either due to very heavy rainfall for a few
days concentrated in a specific catchment or due to the obstructions that are caused
either because of human interference by bridges or embankments that restrict the
flow of the river or natural choking of river bed. Other than these the flooding in
urban areas occurs usually because lack of proper planning, choking of damage
systems and unplanned growth of the settlements during monsoons.
It is seen that most of the floods in India occur during the south-west
monsoon season. The State Water Resource Plan enlists 14 river basins in the state
along with an „outside basin‟ which includes the areas not covered under any river
basin. There are 59 sub-basins of these 14 main basins.
FLOOD PRONE REGIONS OF RAJASTHAN
The flood prone regions in the state lie in of Ajmer, Alwar, Baran, Barmer,
Bharatpur, Bundi, Chittorgarh, Ganganagar, Jaipur, Jalore, Jhalawar, Jodhpur, Kota,
Nagaur, Pali, Sirohi and Udaipur districts. These regions spread across the Basins
and Sub-Basins of the rivers Banas, Banganga, Chambal, Ghaggar, Luni, Mahi,
Page 2
Occurrences of Extreme Weather Events and its..... 201
Sabi, Shekhawati, Sukli and West Banas. Flood prone districts and areas in the State
as listed in the Flood Manual of Rajasthan are as follows:
1. River Banas: This River floods at Uniara and Khasoli at the Bundi district.
The flooding in Udaipur City region is because of River Banas.
2. River Bandi: This River flows in the Sub-Basin of Luni River and brings
floods to Pandiv and Jadwal regions in Sirohi district and Siynna and Bagra
of Jalore district.
3. River Bundh Hemawas: the flooding at Pali District‟s Pali city, Kharchi and
Gurwara is done by River Bundh Hemawas flowing in the Sub-Basin of
River Luni.
4. River Banganga: River Banganga floods the Kaman, Pahi, Deeg, Bayana,
Roopwas and Bharatpur City of the Bharatpur District.
5. River Berach: the flooding at the Chittorgarh city and Sambhurpura of the
Chittorgarh District happens due to the action of River Berach which flows
in the Sub-Basin of River Banas.
6. River Chambal: Kathun and Kota city get flooded due to the River Chambal
swelling in this region.
7. River Ghaggar: River Ghaggar floods the regions of Pilibangan, Suratgarh,
Jetsar and Srivijaynagar of SriGanganagar district and some region of
Hanumangarh town as well.
8. River Jawai: River Jawai flows in the Luni‟s Sub-Basin and floods the Ahore
and Jalore city regions of Jalore district.
Page 3
Occurrences of Extreme Weather Events and its..... 202
9. River Jojri: The flooding at Jodhpur District‟s Benar, Barliya and
Kalyanpura is done by River Jojri‟s action in the Sub-Basin of River Luni.
10. River Kalisindh: River Kalisindh flows in the Sub-Basin of River Chambal.
This river floods in Kota district at Khajuri and Sangod and in Jhalawar
district at Jhalawar City and Richwa.
11. River Luni: The River Luni creates flooding in the Ajmer city; Barmer
District‟s Balotra and Sindri, Gudha; Jodhpur District‟s Bilara, Kakelav,
Kankani and Dudiya; and Jalore District‟s Chitalwana and Bhawatra.
12. River Mashi: The Bichun region of Jaipur district gets flood affected due to
the action of River Mashi, which flows in the Sub-Basin of River Banas.
13. River Mej: The tributary of River Chambal, River Mej floods the areas of
Bundi City.
14. River Mehdha: River Mehdha which flows in the Sub-Basin of River
Shekhawati floods at Kuchaman of Nagaur District.
15. River Morel: The flooding in Sanganer Region of Jaipur district is because of
River Morel, which flows in Sub-Basin of River Banas.
16. River Parwan: River Parwan, a tributary of river Chambal brings floods in
Manohar Thana of Jhalawar district.
17. River Parwati: It is a tributary of River Chambal, which brings floods at
Chhabra, Parlee and Keralahr of Jhalawar district. The River also floods in
the Baran City of Baran district.
Page 4
Occurrences of Extreme Weather Events and its..... 203
18. River Sabi: River Sabi floods in the Kotkasim, Tapukara and Patiabad
regions of Alwar district.
19. River Sagi: Nimbawas and Jaswantpura of the Jalore district get flooded due
to River Sagi which flows in the Sub-Basin of River Luni.
20. River Som: Chiliwod and Jhadol region of Udaipur district experience
flooding due to River Som, which flows in the Sub-Basin of River Mahi.
21. River Sukli: The River Sukli floods at Karaunti of Sirohi district.
22. River Sukri: This river flowing in the Sub-Basin of the Luni river floods in
the Rani and Chanod regions of Pali District; and Bhavrani, Rama and
Debawas of Jalore district.
23. River West Banas: The Abu Road town gets flooded due to river west Banas
in the Sirohi district.
Page 5
Occurrences of Extreme Weather Events and its..... 204
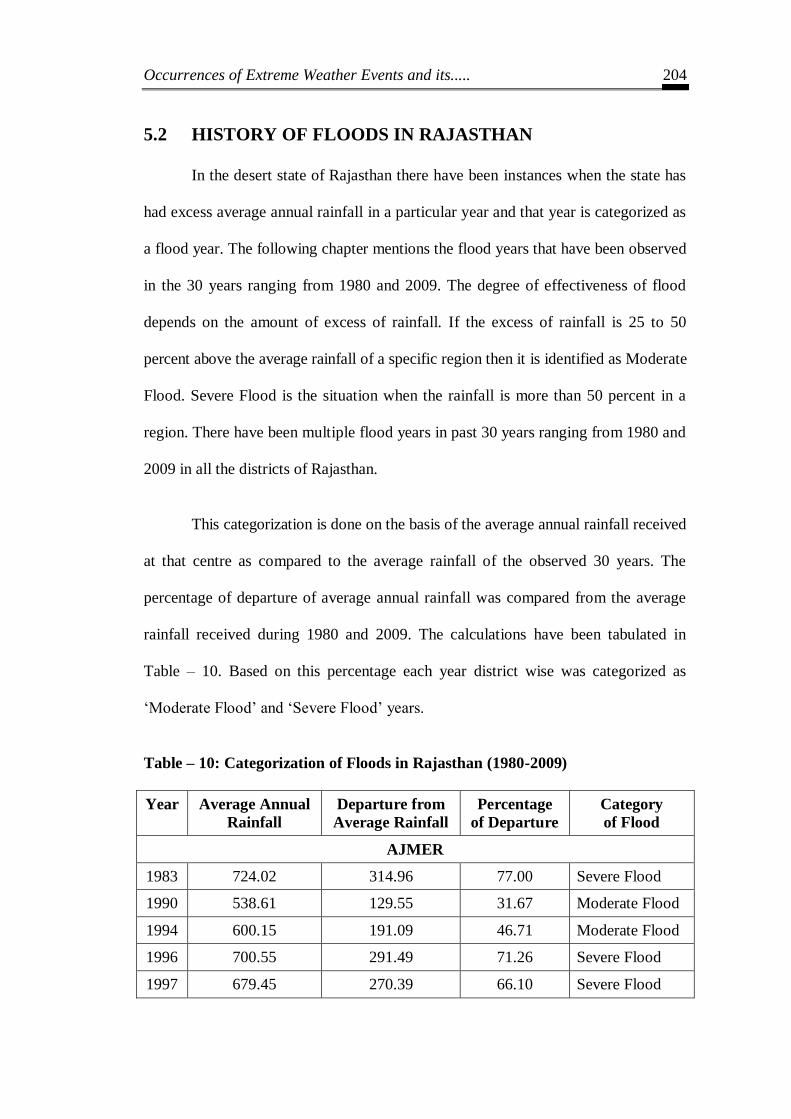
5.2 HISTORY OF FLOODS IN RAJASTHAN
In the desert state of Rajasthan there have been instances when the state has
had excess average annual rainfall in a particular year and that year is categorized as
a flood year. The following chapter mentions the flood years that have been observed
in the 30 years ranging from 1980 and 2009. The degree of effectiveness of flood
depends on the amount of excess of rainfall. If the excess of rainfall is 25 to 50
percent above the average rainfall of a specific region then it is identified as Moderate
Flood. Severe Flood is the situation when the rainfall is more than 50 percent in a
region. There have been multiple flood years in past 30 years ranging from 1980 and
2009 in all the districts of Rajasthan.
This categorization is done on the basis of the average annual rainfall received
at that centre as compared to the average rainfall of the observed 30 years. The
percentage of departure of average annual rainfall was compared from the average
rainfall received during 1980 and 2009. The calculations have been tabulated in
Table – 10. Based on this percentage each year district wise was categorized as
„Moderate Flood‟ and „Severe Flood‟ years.
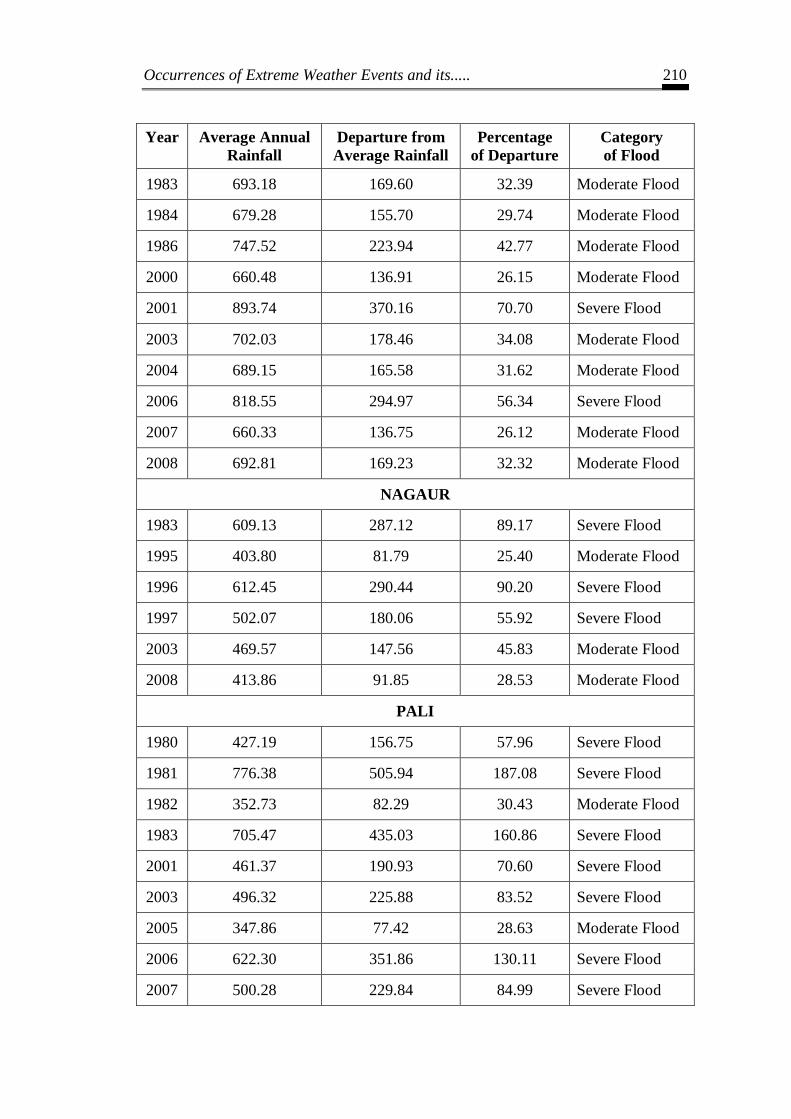
Table – 10: Categorization of Floods in Rajasthan (1980-2009)
Year Average Annual
Rainfall
Departure from
Average Rainfall
Percentage
of Departure
Category
of Flood
AJMER
1983 724.02 314.96 77.00 Severe Flood
1990 538.61 129.55 31.67 Moderate Flood
1994 600.15 191.09 46.71 Moderate Flood
1996 700.55 291.49 71.26 Severe Flood
1997 679.45 270.39 66.10 Severe Flood
Page 6
Occurrences of Extreme Weather Events and its..... 205
Year Average Annual
Rainfall
Departure from
Average Rainfall
Percentage
of Departure
Category
of Flood
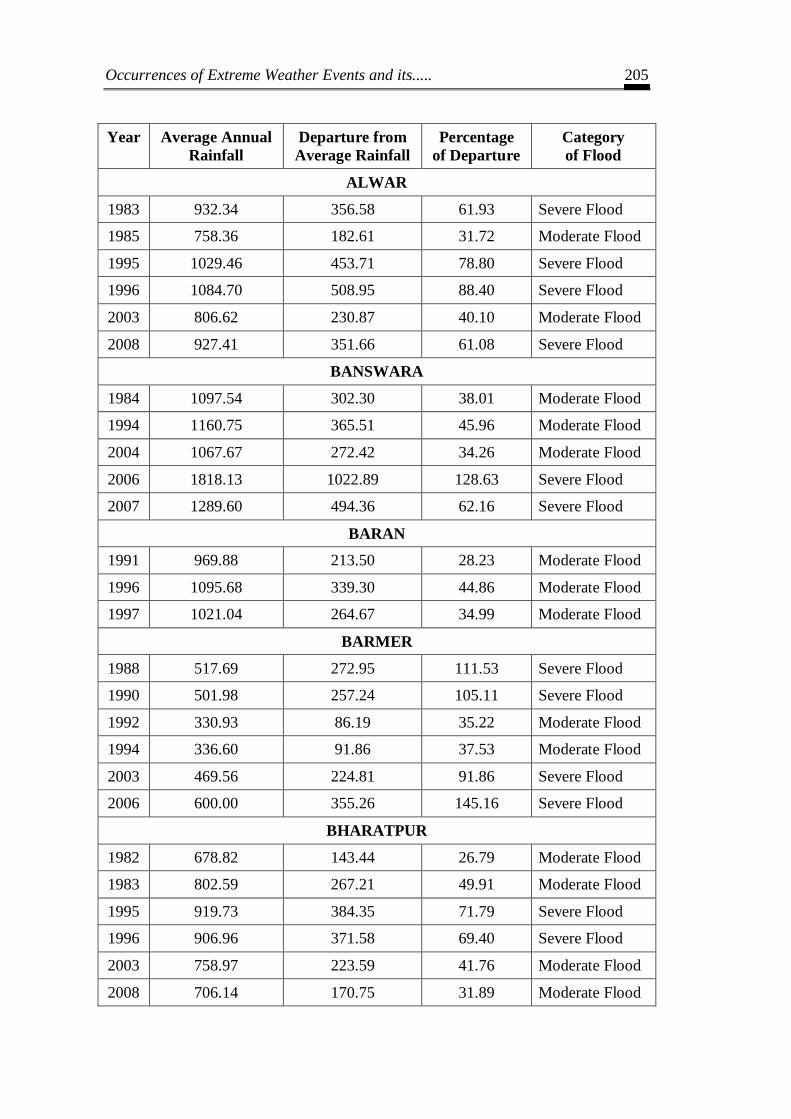
ALWAR
1983 932.34 356.58 61.93 Severe Flood
1985 758.36 182.61 31.72 Moderate Flood
1995 1029.46 453.71 78.80 Severe Flood
1996 1084.70 508.95 88.40 Severe Flood
2003 806.62 230.87 40.10 Moderate Flood
2008 927.41 351.66 61.08 Severe Flood
BANSWARA
1984 1097.54 302.30 38.01 Moderate Flood
1994 1160.75 365.51 45.96 Moderate Flood
2004 1067.67 272.42 34.26 Moderate Flood
2006 1818.13 1022.89 128.63 Severe Flood
2007 1289.60 494.36 62.16 Severe Flood
BARAN
1991 969.88 213.50 28.23 Moderate Flood
1996 1095.68 339.30 44.86 Moderate Flood
1997 1021.04 264.67 34.99 Moderate Flood
BARMER
1988 517.69 272.95 111.53 Severe Flood
1990 501.98 257.24 105.11 Severe Flood
1992 330.93 86.19 35.22 Moderate Flood
1994 336.60 91.86 37.53 Moderate Flood
2003 469.56 224.81 91.86 Severe Flood
2006 600.00 355.26 145.16 Severe Flood
BHARATPUR
1982 678.82 143.44 26.79 Moderate Flood
1983 802.59 267.21 49.91 Moderate Flood
1995 919.73 384.35 71.79 Severe Flood
1996 906.96 371.58 69.40 Severe Flood
2003 758.97 223.59 41.76 Moderate Flood
2008 706.14 170.75 31.89 Moderate Flood
Page 7
Occurrences of Extreme Weather Events and its..... 206
Year Average Annual
Rainfall
Departure from
Average Rainfall
Percentage
of Departure
Category
of Flood
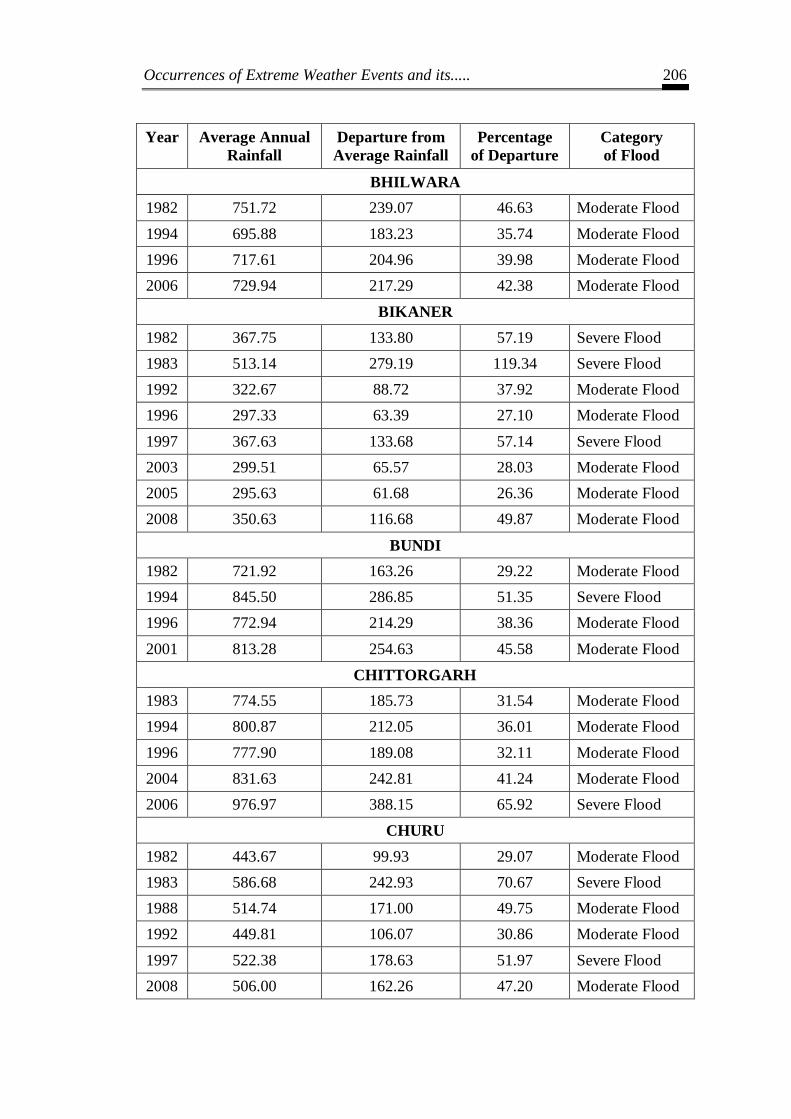
BHILWARA
1982 751.72 239.07 46.63 Moderate Flood
1994 695.88 183.23 35.74 Moderate Flood
1996 717.61 204.96 39.98 Moderate Flood
2006 729.94 217.29 42.38 Moderate Flood
BIKANER
1982 367.75 133.80 57.19 Severe Flood
1983 513.14 279.19 119.34 Severe Flood
1992 322.67 88.72 37.92 Moderate Flood
1996 297.33 63.39 27.10 Moderate Flood
1997 367.63 133.68 57.14 Severe Flood
2003 299.51 65.57 28.03 Moderate Flood
2005 295.63 61.68 26.36 Moderate Flood
2008 350.63 116.68 49.87 Moderate Flood
BUNDI
1982 721.92 163.26 29.22 Moderate Flood
1994 845.50 286.85 51.35 Severe Flood
1996 772.94 214.29 38.36 Moderate Flood
2001 813.28 254.63 45.58 Moderate Flood
CHITTORGARH
1983 774.55 185.73 31.54 Moderate Flood
1994 800.87 212.05 36.01 Moderate Flood
1996 777.90 189.08 32.11 Moderate Flood
2004 831.63 242.81 41.24 Moderate Flood
2006 976.97 388.15 65.92 Severe Flood
CHURU
1982 443.67 99.93 29.07 Moderate Flood
1983 586.68 242.93 70.67 Severe Flood
1988 514.74 171.00 49.75 Moderate Flood
1992 449.81 106.07 30.86 Moderate Flood
1997 522.38 178.63 51.97 Severe Flood
2008 506.00 162.26 47.20 Moderate Flood
Page 8
Occurrences of Extreme Weather Events and its..... 207
Year Average Annual
Rainfall
Departure from
Average Rainfall
Percentage
of Departure
Category
of Flood
DAUSA
1981 927.93 316.88 51.86 Severe Flood
1983 820.05 208.99 34.20 Moderate Flood
1992 818.05 206.99 33.87 Moderate Flood
1995 1248.40 637.34 104.30 Severe Flood
1996 1607.00 995.94 162.99 Severe Flood
2008 804.33 193.28 31.63 Moderate Flood
DHOLPUR
1992 695.78 164.33 30.92 Moderate Flood
1995 716.83 185.38 34.88 Moderate Flood
1996 796.58 265.13 49.89 Moderate Flood
2008 964.98 433.52 81.57 Severe Flood
DUNGARPUR
1984 893.72 239.13 36.53 Moderate Flood
1990 838.54 183.96 28.10 Moderate Flood
1994 1081.03 426.45 65.15 Severe Flood
2006 1365.18 710.60 108.56 Severe Flood
GANGANAGAR
1982 288.58 123.73 75.05 Severe Flood
1983 369.05 204.20 123.87 Severe Flood
1984 232.90 68.04 41.28 Moderate Flood
1985 233.27 68.42 41.51 Moderate Flood
1996 689.79 524.94 318.43 Severe Flood
2003 259.39 94.54 57.35 Severe Flood
2006 209.67 44.82 27.19 Moderate Flood
2007 329.22 164.37 99.71 Severe Flood
2008 310.33 145.48 88.25 Severe Flood
Page 9
Occurrences of Extreme Weather Events and its..... 208
Year Average Annual
Rainfall
Departure from
Average Rainfall
Percentage
of Departure
Category
of Flood
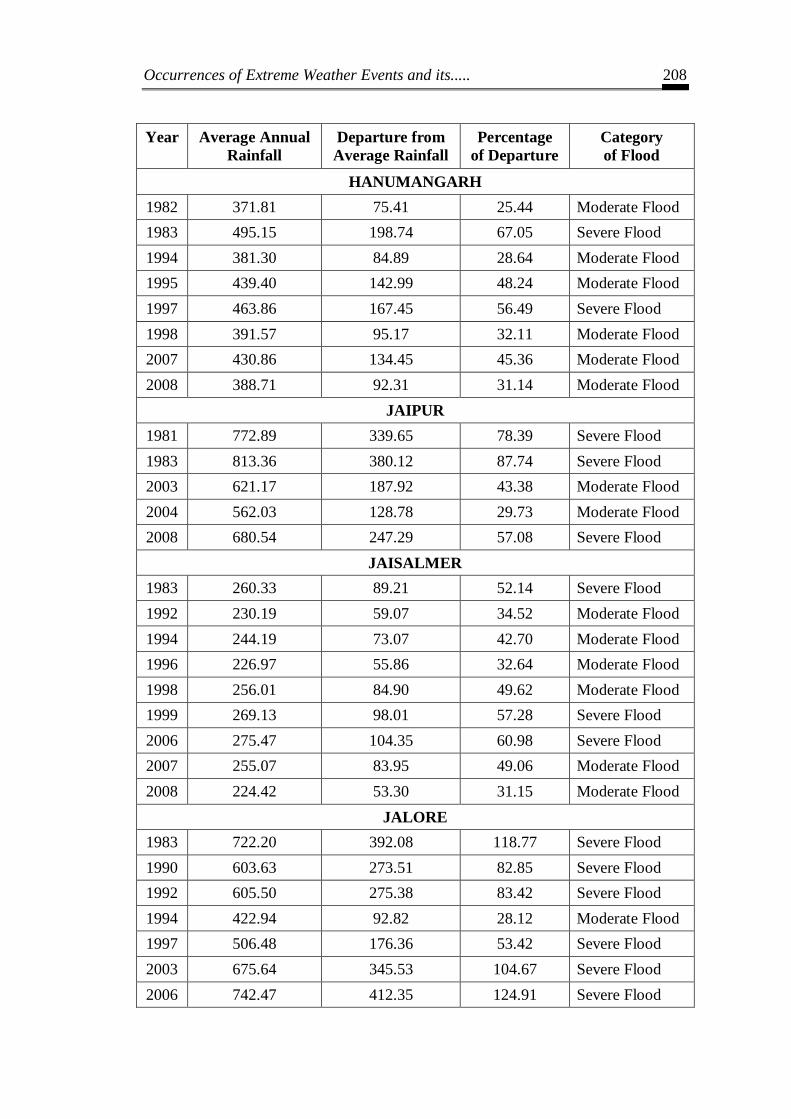
HANUMANGARH
1982 371.81 75.41 25.44 Moderate Flood
1983 495.15 198.74 67.05 Severe Flood
1994 381.30 84.89 28.64 Moderate Flood
1995 439.40 142.99 48.24 Moderate Flood
1997 463.86 167.45 56.49 Severe Flood
1998 391.57 95.17 32.11 Moderate Flood
2007 430.86 134.45 45.36 Moderate Flood
2008 388.71 92.31 31.14 Moderate Flood
JAIPUR
1981 772.89 339.65 78.39 Severe Flood
1983 813.36 380.12 87.74 Severe Flood
2003 621.17 187.92 43.38 Moderate Flood
2004 562.03 128.78 29.73 Moderate Flood
2008 680.54 247.29 57.08 Severe Flood
JAISALMER
1983 260.33 89.21 52.14 Severe Flood
1992 230.19 59.07 34.52 Moderate Flood
1994 244.19 73.07 42.70 Moderate Flood
1996 226.97 55.86 32.64 Moderate Flood
1998 256.01 84.90 49.62 Moderate Flood
1999 269.13 98.01 57.28 Severe Flood
2006 275.47 104.35 60.98 Severe Flood
2007 255.07 83.95 49.06 Moderate Flood
2008 224.42 53.30 31.15 Moderate Flood
JALORE
1983 722.20 392.08 118.77 Severe Flood
1990 603.63 273.51 82.85 Severe Flood
1992 605.50 275.38 83.42 Severe Flood
1994 422.94 92.82 28.12 Moderate Flood
1997 506.48 176.36 53.42 Severe Flood
2003 675.64 345.53 104.67 Severe Flood
2006 742.47 412.35 124.91 Severe Flood
Page 10
Occurrences of Extreme Weather Events and its..... 209
Year Average Annual
Rainfall
Departure from
Average Rainfall
Percentage
of Departure
Category
of Flood
JHALAWAR
1982 990.04 227.85 29.89 Moderate Flood
1985 1127.26 365.07 47.90 Moderate Flood
1999 986.90 224.71 29.48 Moderate Flood
2006 1315.85 553.66 72.64 Severe Flood
JHUNJHUNU
1983 546.38 125.76 29.90 Moderate Flood
1988 625.76 205.14 48.77 Moderate Flood
1995 598.63 178.00 42.32 Moderate Flood
1996 713.38 292.75 69.60 Severe Flood
1997 624.13 203.50 48.38 Moderate Flood
JODHPUR
1982 345.43 107.81 45.37 Moderate Flood
1983 445.06 207.44 87.30 Severe Flood
1990 350.01 112.38 47.29 Moderate Flood
1994 299.84 62.22 26.18 Moderate Flood
1996 311.26 73.63 30.99 Moderate Flood
2001 326.38 88.76 37.35 Moderate Flood
KARAULI
1982 813.48 277.52 51.78 Severe Flood
1983 869.40 333.44 62.21 Severe Flood
1998 816.03 280.07 52.26 Severe Flood
2003 739.50 203.54 37.98 Moderate Flood
2008 717.24 181.28 33.82 Moderate Flood
KOTA
1981 714.91 191.33 36.54 Moderate Flood
1982 792.08 268.50 51.28 Severe Flood
Page 11
Occurrences of Extreme Weather Events and its..... 210
Year Average Annual
Rainfall
Departure from
Average Rainfall
Percentage
of Departure
Category
of Flood
1983 693.18 169.60 32.39 Moderate Flood
1984 679.28 155.70 29.74 Moderate Flood
1986 747.52 223.94 42.77 Moderate Flood
2000 660.48 136.91 26.15 Moderate Flood
2001 893.74 370.16 70.70 Severe Flood
2003 702.03 178.46 34.08 Moderate Flood
2004 689.15 165.58 31.62 Moderate Flood
2006 818.55 294.97 56.34 Severe Flood
2007 660.33 136.75 26.12 Moderate Flood
2008 692.81 169.23 32.32 Moderate Flood
NAGAUR
1983 609.13 287.12 89.17 Severe Flood
1995 403.80 81.79 25.40 Moderate Flood
1996 612.45 290.44 90.20 Severe Flood
1997 502.07 180.06 55.92 Severe Flood
2003 469.57 147.56 45.83 Moderate Flood
2008 413.86 91.85 28.53 Moderate Flood
PALI
1980 427.19 156.75 57.96 Severe Flood
1981 776.38 505.94 187.08 Severe Flood
1982 352.73 82.29 30.43 Moderate Flood
1983 705.47 435.03 160.86 Severe Flood
2001 461.37 190.93 70.60 Severe Flood
2003 496.32 225.88 83.52 Severe Flood
2005 347.86 77.42 28.63 Moderate Flood
2006 622.30 351.86 130.11 Severe Flood
2007 500.28 229.84 84.99 Severe Flood
Page 12
Occurrences of Extreme Weather Events and its..... 211
Year Average Annual
Rainfall
Departure from
Average Rainfall
Percentage
of Departure
Category
of Flood
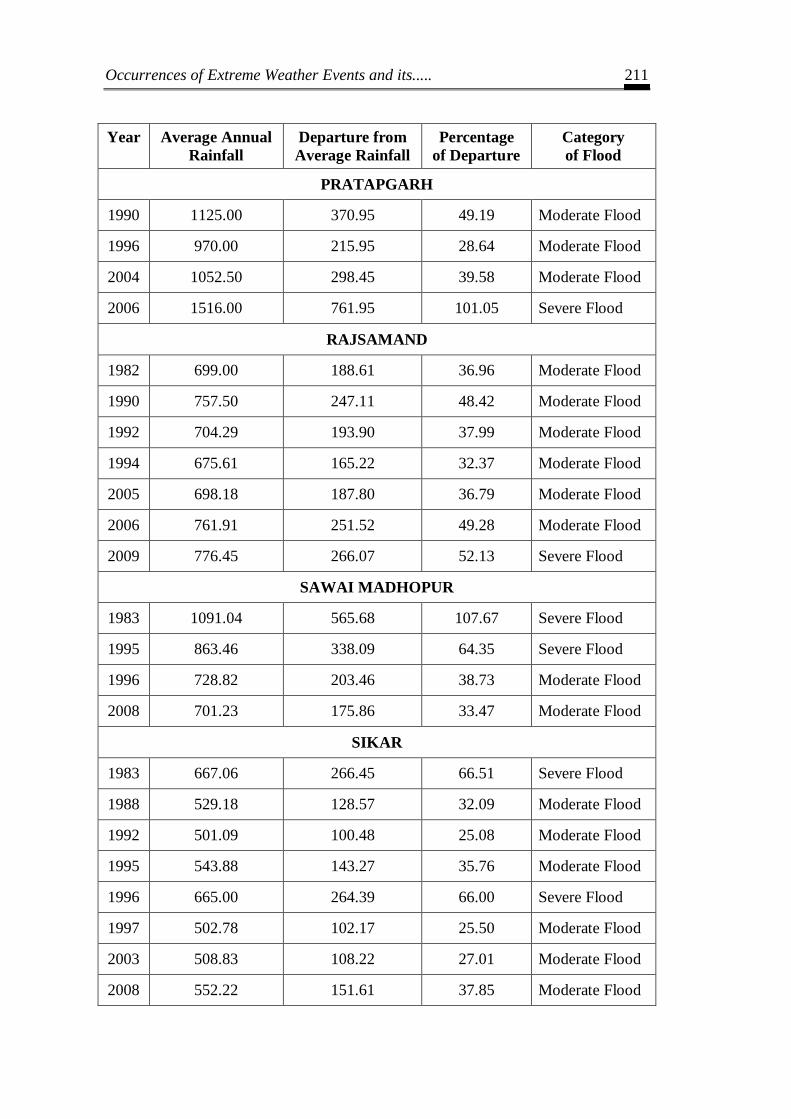
PRATAPGARH
1990 1125.00 370.95 49.19 Moderate Flood
1996 970.00 215.95 28.64 Moderate Flood
2004 1052.50 298.45 39.58 Moderate Flood
2006 1516.00 761.95 101.05 Severe Flood
RAJSAMAND
1982 699.00 188.61 36.96 Moderate Flood
1990 757.50 247.11 48.42 Moderate Flood
1992 704.29 193.90 37.99 Moderate Flood
1994 675.61 165.22 32.37 Moderate Flood
2005 698.18 187.80 36.79 Moderate Flood
2006 761.91 251.52 49.28 Moderate Flood
2009 776.45 266.07 52.13 Severe Flood
SAWAI MADHOPUR
1983 1091.04 565.68 107.67 Severe Flood
1995 863.46 338.09 64.35 Severe Flood
1996 728.82 203.46 38.73 Moderate Flood
2008 701.23 175.86 33.47 Moderate Flood
SIKAR
1983 667.06 266.45 66.51 Severe Flood
1988 529.18 128.57 32.09 Moderate Flood
1992 501.09 100.48 25.08 Moderate Flood
1995 543.88 143.27 35.76 Moderate Flood
1996 665.00 264.39 66.00 Severe Flood
1997 502.78 102.17 25.50 Moderate Flood
2003 508.83 108.22 27.01 Moderate Flood
2008 552.22 151.61 37.85 Moderate Flood
Page 13
Occurrences of Extreme Weather Events and its..... 212
Year Average Annual
Rainfall
Departure from
Average Rainfall
Percentage
of Departure
Category
of Flood
SIROHI
1980 572.55 133.97 30.55 Moderate Flood
1981 616.25 177.67 40.51 Moderate Flood
1982 585.42 146.84 33.48 Moderate Flood
1983 1033.59 595.01 135.67 Severe Flood
1984 699.35 260.77 59.46 Severe Flood
1985 593.00 154.42 35.21 Moderate Flood
1992 649.92 211.34 48.19 Moderate Flood
2003 735.45 296.87 67.69 Severe Flood
2005 666.89 228.31 52.06 Severe Flood
2006 1172.08 733.50 167.25 Severe Flood
2007 652.44 213.86 48.76 Moderate Flood
TONK
1981 611.32 195.92 47.16 Moderate Flood
1983 747.60 332.20 79.97 Severe Flood
1995 571.47 156.07 37.57 Moderate Flood
2003 534.80 119.40 28.74 Moderate Flood
UDAIPUR
1980 585.02 143.53 32.51 Moderate Flood
1981 633.12 191.64 43.41 Moderate Flood
1982 797.91 356.43 80.73 Severe Flood
1984 655.59 214.10 48.50 Moderate Flood
1985 591.66 150.18 34.02 Moderate Flood
2004 599.61 158.12 35.82 Moderate Flood
2005 631.92 190.43 43.14 Moderate Flood
2006 1119.79 678.31 153.64 Severe Flood
2007 598.76 157.28 35.62 Moderate Flood
2008 571.55 130.06 29.46 Moderate Flood
2009 579.73 138.25 31.31 Moderate Flood
Source: http://waterresources.rajasthan.gov.in/Daily_Rainfall_Data/Rainfall_Index.htm
Page 14
Occurrences of Extreme Weather Events and its..... 213
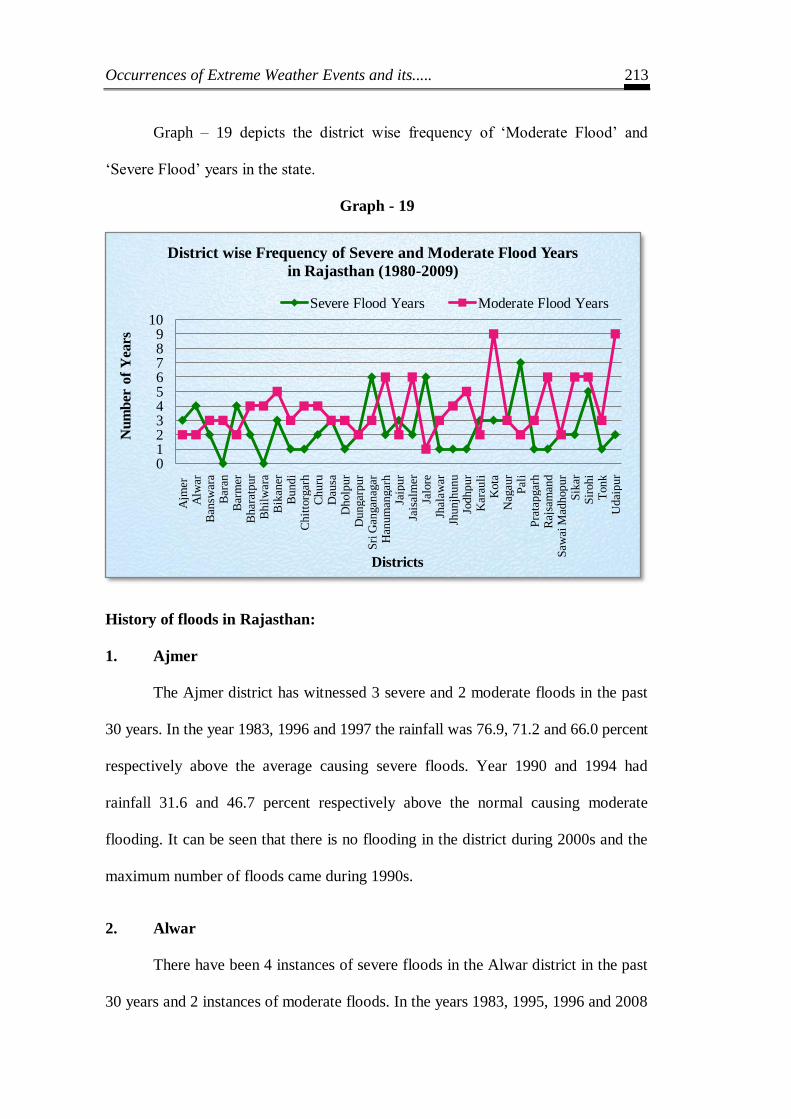
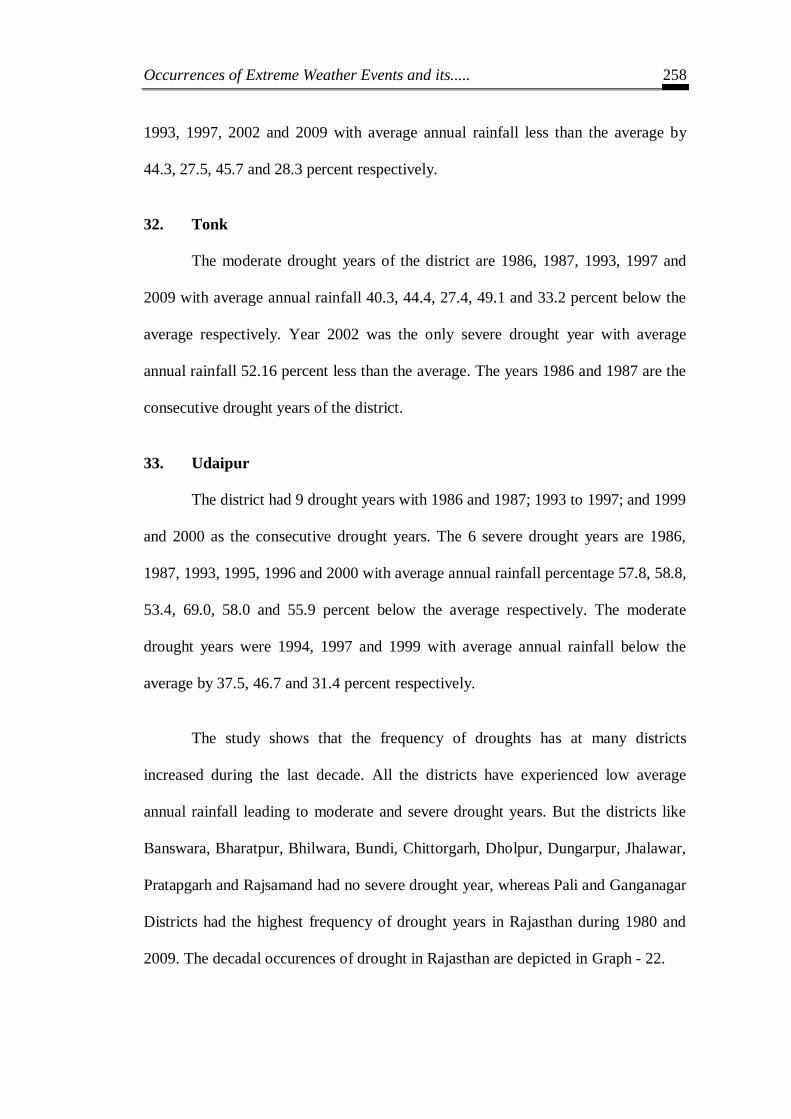
Graph – 19 depicts the district wise frequency of „Moderate Flood‟ and
„Severe Flood‟ years in the state.
Graph - 19
History of floods in Rajasthan:
1. Ajmer
The Ajmer district has witnessed 3 severe and 2 moderate floods in the past
30 years. In the year 1983, 1996 and 1997 the rainfall was 76.9, 71.2 and 66.0 percent
respectively above the average causing severe floods. Year 1990 and 1994 had
rainfall 31.6 and 46.7 percent respectively above the normal causing moderate
flooding. It can be seen that there is no flooding in the district during 2000s and the
maximum number of floods came during 1990s.
2. Alwar
There have been 4 instances of severe floods in the Alwar district in the past
30 years and 2 instances of moderate floods. In the years 1983, 1995, 1996 and 2008
0123456789
10
Ajm
er
Alw
arB
answ
ara
Bar
anB
arm
erB
har
atpu
rB
hil
war
aB
ikan
erB
undi
Chit
torg
arh
Churu
Dau
saD
holp
ur
Dungar
pur
Sri
Gan
gan
agar
Han
um
angar
hJa
ipur
Jais
alm
erJa
lore
Jhal
awar
Jhunjh
unu
Jodhpur
Kar
auli
Kota
Nag
aur
Pal
iP
rata
pgar
hR
ajsa
man
dS
awai
Mad
hopur
Sik
arS
irohi
Tonk
Udai
pur
Nu
mb
er o
f Y
ears
Districts
District wise Frequency of Severe and Moderate Flood Years
in Rajasthan (1980-2009)
Severe Flood Years Moderate Flood Years
Page 15
Occurrences of Extreme Weather Events and its..... 214
the percentage of rainfall was 61.9, 78.8, 88.3 and 61.0 percent respectively more
than the average making them severe flood years. 1985 and 2003 are moderate flood
years having rainfall 31.7 and 40.0 percent respectively more than the average. Here
1995 and 1996 are 2 consecutive severe rainfall years.
3. Banswara
Year 1984, 1994 and 2004 have been the years of moderate floods in the
Banswara district. During these years the rainfall has been 38.0, 45.9 and 34.2
percent respectively more than the district average of last 30 years ranging from
1980 to 2009. Severe flood was witnessed during 2006 and 2007 when the rain was
128.6 percent and 62.1 percent respectively. It can be seen that every 10th
year the
district has had the occurrence of moderate flood in the district.
4. Baran
The district had no instances of severe flooding during the observed years,
whereas, there are 3 occurrences of moderate floods. In 1991 the rainfall was 28.2
percent respectively above the average. Year 1996 and 1997 had consecutive
flooding for 2 years when the rainfall was 44.8 percent and 34.9 percent respectively
above the average.
5. Barmer
The desert district of Barmer has experienced flood situation for 6 years. The
flood occurred during alternate years from 1988 to 1994, i.e. 1988, 1990, 1992 and
1994 when the rainfall was above the average rainfall by 111.5, 105.1, 35.2 and 37.5
percent respectively. Year 2003 and 2006 experienced severe floods and the rainfall
exceeded 91.8 and 145.1percent respectively from the average rainfall mark.
Page 16
Occurrences of Extreme Weather Events and its..... 215
6. Bharatpur
The Bharatpur district had consecutive moderate floods during 1982-1983
when the rainfall was 26.7 and 49.9 percent respectively above the average. The
year 2003 had 41.7 percent rainfall above the average and 2008 had 31.8 percent
above the average rainfall classifying these years as moderate flood years.
7. Bhilwara
The Bhilwara had 4 occurrences of moderate floods and no severe flood
year. Year 1982, 1994, 1996 and 2006 received rainfall 46.6, 35.7, 39.9 and 42.3
percent respectively above the average. Here the alternate years 1994 and 1996 were
classified as flood years.
8. Bikaner
In the year 1981, 1982 and 1997 received rainfall 57.1, 119.3 and 57.1 percent
respectively above the average. Hence, these years are classified as severe rainfall years.
The years 1992, 1996, 2003, 2005 and 2008 are moderate flood years where the rainfall
was 37.9, 27.0, 28.0, 26.3 and 49.8 percent respectively above the average. Here, 1981
and 1982; 1996 and 1997 are consecutive and 2003 and 2005 are alternate flood years.
9. Bundi
The only year which has been classified as severe flood year in the district is
1994 when the rainfall was 51.3 percent above the average. The years 1982, 1996
and 2001 have been classified as moderate drought years as the rainfall received in
these years has been 29.2, 38.3 and 45.5 percent respectively.
10. Chittorgarh
In 2006 the rainfall exceeded the average rainfall by 65.9 percent and hence
the year is classified as severe flood year of Chittorgarh district. Years 1983, 1994,
Page 17
Occurrences of Extreme Weather Events and its..... 216
1996 and 2004 had rainfall 31.5, 36.0, 32.1 and 41.2 percent respectively above the
average. Here, 1994, 1995, 2004 and 2006 are alternate flood years.
11. Churu
Years 1983 and 1997 have been the 2 severe flood years in the district in the
observed 30 years when the rainfall was 70.6 and 51.9 percent respectively above
the average rainfall of the district. Moderate flood years were 1982, 1988, 1992 and
2008 as the annual rainfall received was 29.0, 49.7, 30.8 and 47.2 percent respectively
above the average. Here 1982 and 1983 were 2 consecutive flood years.
12. Dausa
There are 3 occurrences of both moderate and severe floods in the district.
Year 1981, 1995 and 1996 are severe flood years where the rainfall was 51.8, 104.3
and 162.9 percent respectively above the average. Years 1983, 1992 and 2008 had
rainfall of 34.2, 33.8 and 31.6 percent respectively above the average; hence, these 3
years are classified as moderate flood years.
13. Dholpur
Year 2008 is the only year of severe floods in the Dholpur district when the
annual average rainfall was 81.5 percent more than the average. The 1990 decade saw
3 moderate flood years in the district. Here, in 1992, 1995 and 1996 the average
annual rainfall was 30.9, 34.8 and 49.8 percent respectively above the average rainfall
of the district. Here 1995 and 1996 are 2 consecutive flood years in the district.
14. Dungarpur
The district had 2 each, moderate and severe flood years in the district. In
1984 and 1990 the annual average rainfall was 36.5 and 28.1 percent respectively
above the average hence these 2 years have been classified as moderate flood years.
Page 18
Occurrences of Extreme Weather Events and its..... 217
Years 1994 and 2006 are the severe flood years where the average annual rainfall
was 65 percent and 108.5 percent respectively above the district average.
15. Ganganagar
In the Ganganagar district the years 1982, 1983, 1984 and 1985 and years
2006, 2007 and 2008 are consecutive flood years in the district. Years 1982, 1983,
1996, 2003, 2007 and 2008 are classified as severe flood years as the annual average
rainfall received in these years was 75.0, 123.8, 318.4, 57.3, 99.7 and 88.2 percent
respectively above the average rainfall of the year. The moderate flood years are
1984, 1985 and 2006 as the average annual rainfall was 41.2, 41.5 and 27.1 percent
respectively above the average rainfall of Ganganagar district.
16. Hanumangarh
There have been 6 occurrences of moderate and 2 of severe flooding in the
Hanumangarh district in the observed 30 years. It has been seen that there is
consecutive occurrence flood of years in the district, i.e. 1982 and 1983; 1994 and
1995; 1997 and 1998; 2007 and 2008. Here the years 1982, 1994, 1995, 1998, 2007
and 2008 are considered as moderate flood years as the annual average rainfall was
25.4, 28.6, 48.2, 32.1, 45.3 and 31.1 percent respectively above the average rainfall
of the district respectively. The years 1983 and 1997 were severe rainfall years with
rainfall exceeding the average by 67.0 and 56.4 percent respectively.
17. Jaipur
There have been 3 occurrences of severe and 2 moderate flood years in the
district in the observed time span. Year 1981 and 1983 saw alternate severe floods
along with 2008. Here the annual average rainfall was 78.3, 87.7 and 57.07 percent
Page 19
Occurrences of Extreme Weather Events and its..... 218
respectively above the average rainfall of the district. Years 2003 and 2004
consecutively received rainfall 43.3 and 29.7 percent respectively above the average
hence these years are considered as moderate flood years.
18. Jaisalmer
There have been 3 severe and 6 moderate flood years in the Jaisalmer district
from 1980 to 2009. Years 1983, 1999 and 2006 received rainfall 52.1, 57.2 and 60.9
percent respectively above the average and therefore these years are considered as
severe flood years. Years 1992, 1994, 1996, 1998, 2007 and 2008 are the moderate
flood years as the rainfall was 34.5, 42.7, 32.6, 49.6, 49.0 and 31.1 percent
respectively above the average. Here, 1992, 1994, 1996, 1998, 1999, 2006, 2007 and
2008 are consecutive flood years.
19. Jalore
At Jalore district only the year 1994 is considered as moderate rainfall year
as the rainfall received was 28.1 percent above the average. Here, there are 6 severe
flood years i.e. 1983, 1990, 1992, 1997, 2003 and 2006 where the rainfall was 118.7,
82.85, 83.4, 53.4, 104.6 and 124.9 percent respectively above the average. Here,
1990, 1992 and 1994 are alternate flood years.
20. Jhalawar
The district has 2006 as only severe flood year as the rainfall exceeded the
average rainfall by 72.6 percent. The moderate flood years were 1982, 1985 and 1999
where the rainfall was 29.8, 47.8 and 29.4 percent respectively above the average.
Page 20
Occurrences of Extreme Weather Events and its..... 219
21. Jhunjhunu
At Jhunjhunu district only 1996 have been classified as severe flood year
when the rainfall exceeded the average by 69.6 percent. Years 1983, 1988, 1995 and
1997 are moderate flood years with rainfall 29.8, 48.7, 42.3 and 48.3 percent
respectively above the average. It can be seen that 1995, 1996 and 1997 are
consecutive flood years in the district.
22. Jodhpur
At Jodhpur district too we have only one year as the severe flood year i.e.
1983 when it rained 87.2 percent above the district average. Year 1982, 1990, 1994,
1996 and 2001 received rainfall 45.3, 47.2, 26.1, 30.9 and 37.3 percent respectively
above the average and are hence classified as moderate rainfall years. It is also seen
that 1982 and 1983 are consecutive flood years.
23. Karauli
There are 3 severe and moderate flood years in the district during the observed
years. The years 1982, 1983 and 1998 received rainfall 51.7, 62.2 and 52.2 percent
respectively above the average and hence are classified as severe flood years. The
moderate flood years are 2003 and 2008 with rainfall exceeding the average by 37.9
and 33.8 percent respectively. Here 1982 and 1983 are consecutive flood years.
24. Kota
The Kota district had 3 occurrences of severe flood years during the observed
years in 1982, 2001 and 2006 when the rainfall exceeded the average rainfall of the
district by 51.2, 70.6 and 56.33 percent respectively. There are 9 years that are
classified as moderate flood years, they are 1981, 1983, 1984, 1986, 200, 2003,
Page 21
Occurrences of Extreme Weather Events and its..... 220
2004, 2007 and 2008. Here the rainfall was 36.5, 32.3, 29.7, 42.7, 26.1, 34.0, 31.6,
26.1 and 32.3 percent respectively above the average. It can also be observed that
the flood years are in clusters from 1981 to 1986 and 2000 to 2008.
25. Nagaur
Nagaur district had 3 occurrences of each moderate and severe flood years.
Year 1983, 1996 and 1997 had rainfall 89.1, 90.1 and 55.9 percent respectively
above the average and are hence considered as severe flood years. Years 1995, 2003
and 2008 had rainfall 25.3, 45.8 and 28.5 percent respectively above the average and
are categorized as moderate flood years. It is noted that 1995 to 1997 are 3
consecutive flood years in the district.
26. Pali
In the Pali district the flood years are concentrated between 1980 to 1983 and
2001 to 2007 only and before and after this period there are no flood years. Year 1980,
1981, 1983, 2001, 2003, 2006 and 2007 are severe flood years with rainfall exceeding
the average by 57.9, 187.0, 160.8, 70.5, 83.5, 130.1 and 84.9 percent respectively. The
moderate rainfall years are 1982 and 2005 with rainfall excess of 30.4 and 28.6.
27. Pratapgarh
The only occurrence of severe flood year in the district was during 2006
when the rainfall exceeded the average by 101.1 percent respectively. The moderate
flood years of the district during the observed years were 1990, 1996 and 2004 with
rainfall 49.1, 28.6 and 39.5 percent respectively above the average.
Page 22
Occurrences of Extreme Weather Events and its..... 221
28. Rajsamand
There has been only 1 occurrence of severe flood in the district in 2009 when
the rainfall exceeded the average by 52.1 percent. There are 6 moderate flood years
in the district i.e. 1982, 1990, 1992, 1994, 2005 and 2006 when the percentage of
rainfall exceeded the average rainfall by 36.9, 48.4, 37.9, 32.3 36.7 and 49.2
respectively. Here it is observed that during 1990 and 1994 flood years were alternate
years and 2005 and 2006 are consecutive flood years.
29. Sawai Madhopur
There have been 2 instances of each severe and moderate flood years in the
district during the observed years, where 1995 and 1996 were consecutive flood years.
Year 1983 and 1995 were severe flood years when the rainfall was 107.6 and 64.3
percent respectively above the average. The years 1996 and 2008 were moderate flood
years when the rainfall exceeded the average by 38.7 and 33.4 percent respectively.
30. Sikar
The Sikar district had 2 occurrences of severe flood years during 1983 and
1996, during these years the rainfall was 66.5 and 65.9 percent respectively above
the average rainfall of the district. Years 1988, 1992, 1995, 1997, 2003 and 2008 are
the moderate flood years when the rainfall was 32.0, 25.0, 35.7, 25.5, 27.0 and 37.8
percent above the average respectively.
31. Sirohi
At the Sirohi district year 1980 to 1985 are continuous flood years. 2003 and
2005 are alternate and 2005 to 2007 are again consecutive flood years. Here, during
the observed time span there were 6 moderate and 5 severe flood years.
Page 23
Occurrences of Extreme Weather Events and its..... 222
Year 1980, 1981, 1982, 1985, 1992 and 2007 received 30.5, 40.5, 33.4, 35.2,
48.1 and 48.7 percent respectively rainfall respectively above average and are
classified as moderate flood years whereas, 1983, 1984, 2003, 2005 and 2006 are
severe flood years with rainfall 135.6, 59.4, 67.6, 52.0 and 167.2 percent
respectively above the average.
32. Tonk
At the Tonk district only 1983 can be classified as severe flood year. Here
the rainfall was 79.9 percent above the district average. Year 1981, 1995 and 2003
are moderate flood years where the rainfall received was 47.1, 37.7 and 28.7 percent
above the average respectively.
33. Udaipur
The district had 2 severe and 9 moderate flood years in the observed 30
years. Years 1982 and 2006 were considered as severe flood years as they received
rainfall 80.7 and 153.6 percent respectively above the average. The years 1980,
1981, 1984, 1985, 2004, 2005, 2007, 2008 and 2009 are moderate flood years as the
rainfall received was 32.5, 43.4, 48.4, 34.0, 35.8, 43.1, 35.6 29.4 and 31.3 percent
respectively. Here it is interesting to note that from 1980 to 1985 and 2004 to 2009
are consecutive flood years.
The description shows that the frequency of floods has at many districts
increased during the last decade. All the districts have witnessed heavy rainfall
leading to moderate and severe flood years except Baran and Bhilwara district which
have no severe flood year during the observed 30 years. The decadal frequency of
floods in Rajasthan has been depicted in Graph - 20.
Page 24
Occurrences of Extreme Weather Events and its..... 223
Graph – 20
0
1
2
3
4
5
6
7
Ajm
er
Alw
ar
Bara
n
Barm
er
Bansw
ara
Bhara
tpu
r
Bhil
wara
Bik
aner
Bu
ndi
Chit
torg
arh
Chu
ru
Dau
sa
Dholp
ur
Dungarp
ur
Ganganagar
Hanu
mangarh
Jaip
ur
Jais
alm
er
Jalo
re
Jhala
war
Jhunjh
unu
Jodhp
ur
Kara
uli
Kota
Nagau
r
Pali
Pra
tap
garh
Rajs
am
and
Saw
ai M
adhop
ur
Sik
ar
Sir
ohi
Tonk
Udaip
ur
No. of
Occ
ura
nce
s
Districts
District-wise Decadal Frequency of Floods in Rajasthan (1980-2009)
1980-1989
1990-1999
2000-2009
Page 25
Occurrences of Extreme Weather Events and its..... 224
5.3 IMPACT OF FLOOD
In the Desert State of India i.e. Rajasthan flooding happens either due to
flooding of rivers due to excessive rainfall or due to cloudbursts. In many cases floods
occur due to human interference or lack of planning especially the urban floods.
The flood prone regions in the state lie in of Ajmer, Alwar, Baran, Barmer,
Bharatpur, Bundi, Chittorgarh, Ganganagar, Jaipur, Jalore, Jhalawar, Jodhpur, Kota,
Nagaur, Pali, Sirohi and Udaipur districts.
During the rural survey, the Sarkapaar Dhaani of the Kawas Village in the
Baaytu Block of Barmer district was covered to study flood impact. Figure – 4
shows the research scholar interviewing one of the families. This village had
witnessed floods during the monsoon season of 2006. These floods are believed to
be the worst floods to hit this desert region in over 300 years. Impact of floods was
suffered majorly by agriculture, livestock and humans.
Figure – 4 Surveyor interviewing a family at Sarkapaar
Dhaani of Kawas Village, Barmer
Page 26
Occurrences of Extreme Weather Events and its..... 225
Impact on Water Resources: During the flood the Sarkapaar Dhaani was
under 15 to 20 feet water. This negatively affected all the sources of clean or
drinkable water in the area. All the tanka, wells etc. were contaminated.
Cultivation: The entire dhaani was submerged in water and hence adversely
affected the agricultural as the entire monsoon crop was damaged.
Livestock: According to an estimate approximately 75,000 cattle had
perished during these floods.
Socio – Economic Issues: The biggest threat after flood was curbing the spread
of diseases like Diarrhea, Dysentery, Malaria, skin infections, Jaundice, Typhoid and
Cholera. Another major problem was that the road, electricity and communication
network were totally damaged. Also the rotting carcasses of the thousands of animals
had created the fears of water-borne diseases. The incidents of snake bite had
increased as the floodwaters forced them and the other rodents on to surface.
The impact on land use was that the entire cultivated area had turned barren.
Natural vegetation was completely spoiled. New species of tree locally known as
Jauda tree has been introduced in the region due to floods. The entire region turned
in to a lake and hence land use categories could not be differentiated. There was a
large scale loss of life property and infra structure. The government authorities along
with NGOs and other agencies tried to handle disaster in a manner that the losses
can be minimized and the lives of the people could be saved.
Page 27
Occurrences of Extreme Weather Events and its..... 226
5.4 FLOOD MANAGEMENT
In the previous topic we have seen that the state witnesses flood years and
there are regions which are flood prone in the state of Rajasthan. Hence it is crucial
that the state has a mechanism to reduce or prevent the detrimental effects of flood
waters. The Disaster Management and Relief Department of Government of Rajasthan
handle all the disasters in the state. The Flood Manual generated by Disaster
Management and Relief Department gives a complete description of the flood
response system of the state.
There are 14 river basins in the state which are further sub-divided into 59
sub-basins. The 14 major sub-basins are of the rivers- Shekhawati, Ruparail,
Banganga, Gambhiri, Parbati, Sabi, Banas, Chambal, Mahi, Sabarmati, Luni, West
Banas, Sukli, Other Nallas of Jalore and Areas of Western Rajasthan. A network of
Rain gauge stations, gauge discharge & meteorological observatories have been set-
up in these important river basin catchment areas to monitor any hydro-
meteorological event. The river-floods occur mostly due to silting of the river bed
due to which the capacity of rivers of containing water reduces significantly or due
to heavy rains in areas with poor drainage. In case of a silted bed the confluence
zone too gets congested and the waters tend to enter back into the tributary.
For effective flood management system the Disaster Management and Relief
Department works on multiple points so that both relief and rescue works can be
done effectively. The management relates to flood preparedness, flood forecasting
and warning, flood control and management, relief and rescue management,
assistance and rehabilitation of sufferers.
Page 28
Occurrences of Extreme Weather Events and its..... 227
A Rashtriya Barh Ayog (National Flood Commission) was set up by
Government of India in 1976 to review the flood protection measures and to
formulate comprehensive approach to deal with flood situation in the country. The
National Water Policy 2002, states that each flood prone basin in the country must
have a master plan for its flood control and management. It also states that that
physical flood protection works like embankments and dykes and water storage
projects should be meticulously planned in the flood prone areas and even non-
structural measures such as effective flood forecasting and warning and flood
proofing should be promoted to minimize losses.
The floods in the flood prone regions are easier to control but events of
cloud-burst are difficult to handle. Flood Preparedness is therefore a necessary
component of flood management. It includes forecasting, warning, capacity building
of the locals to form relief groups, preparing an operational plan, stockpiling of
supplies and proper utilization of funds. Also as a part of long term planning, long
range policies should be implemented in the fields of public works and urban
planning. The mitigation efforts help in prevention to a large degree.
The mitigation efforts include:
1. A review of daily reports on weather forecast
2. Constitution of a weather watch group to review weekly the weather
condition during the monsoon season i.e. during June and September
3. All the dams are inspected before the advent of monsoons
4. Every year in the month of May the State Advisory Committee would conduct
a meeting with the various departments to review the preparatory action
taken by them. The state machinery shall be equipped to meet any calamity
Page 29
Occurrences of Extreme Weather Events and its..... 228
5. Maintenance of the flood plain and not allowing any construction on it is
also very important as it helps to protect the environmental equilibrium of
the region and check the post flood destruction.
6. The Relief Department acts as a Nodal department in case of floods and it is
this department‟s responsibility to take preventive steps, Co-ordinate various
government/ non-government agencies, educate the masses and deal with all
the issues relating to the disaster. Also a list of important telephone numbers
also circulated to all concerned departments in the month of May every year
by the Relief Department.
7. Role and responsibilities of the various government departments like the
Meteorological Department, Local Bodies Department, Medical Department,
Police and Wireless Department, Irrigation Department, Fisheries Department,
Public Health and Engineering Department, Public Works Department, Power
Department, Animal Husbandry Department, Food Department, Relief
Department, Information and Public Relations Department and Department of
Information and Technology are well defined.
8. In the times of calamity these departments co-ordinate closely under the
Relief Department and perform all the functions like keeping weather
stations fully functional; identify vulnerable areas in each district and
formulate a plan of action to face the hazard; timely de-silting the drainage
system before rains; remove garbage, dead animals timely to prevent
diseases; to keep the medical mobile van and teams of doctors ready to go to
the affected areas with required medicines; to strictly enforce food and water
safety measures; to arrange sufficient food and other essential commodities
vulnerable areas and fodder and cattle feed; to quickly restore of water
Page 30
Occurrences of Extreme Weather Events and its..... 229
supply in case of floods; to keep prepared the resources like boats, life
jackets, expert fishermen and swimmers; identify high level areas for
rehabilitation camps in case of heavy rains, flash floods; etc.
9. A State level flood memorandum is prepared by the Irrigation Department
every year and supplied to all concerned departments containing all the
required information.
10. A Disaster contingent plan is prepared at each district by an Executive
Engineer i.e. the nodal officer which contains information about the location
of dams, identification of flood prone areas, alternate routes, location and
quantity of different emergency materials, list of divers etc.
The Executive Engineer of the Irrigation Department, Rajasthan at Jaipur
acts as the nodal officer. There are several constraints in providing cent percent
protection from the complex phenomena of flood. A combination of both structural
and non-structural strategies must be combined so as to achieve effective protection.
The flood management plans should be socially and economically viable with some
scientific or technological/engineering backing.
The various structural measures for flood control followed can be
categorized as follows:-
1. Repair/restoration and strengthening of existing structures (bunds, regulating
and control structures and waste weirs) including repair/restoration
/installation of gates and communication systems.
2. Restoration of design capacity of channels and removal of encroachments.
3. Repair/restoration of village/town protection bunds, and construction of new
ring bunds.
Page 31
Occurrences of Extreme Weather Events and its..... 230
4. Construction of river training works – revetments, spurs etc.
5. Construction of diversion structures (cross-regulators and channels)
6. Construction of auxiliary spillway and weirs and increasing the surplus
capacity of existing ones.
7. Construction of flood regulation anicuts.
8. Construction of cross regulators.
The various non-structural measures for flood control can be categorized as follows:
1. Flood plain zoning.
2. Flood estimation and forecasting.
3. Flood proofing.
4. Flood warning.
5. Flood fighting and operation plan (Disaster Management and Relief
Department, 2009).
The government also understands the importance regulating the flood plain
and the low-lying regions for protecting them from undesirable or unwise use. This
region should be construction free, have proper sewage systems and maybe utilized
for collection of storm water management. A map representing the past extent of
floodwaters, its depth and frequency in the last 20 years is also studied. Some of the
flood plains are acquired by the government on its development rights; this provides
long-term benefits of protection of natural resources and public use of the land along
with reduced floodplain losses.
The other measure to mitigate flood is through flood proofing. Flood proofing
is the use of permanent, contingent or emergency techniques to either prevent flood
waters from entering buildings or to minimize the damages from water that does get
Page 32
Occurrences of Extreme Weather Events and its..... 231
in. Some of the techniques involve using water tight seals, closures or barriers, using
water resistant materials, and temporarily relocating the contents of a building.
Elevating a structure means raising it on fill, piers, or pilings so that it is above
expected flood levels (Disaster Management and Relief Department, 2009).
Structural measures such as dams, dikes, reservoirs, floodwalls, storm water
management etc can be used for Modifying flooding so that deliberate changes in
the volume of run-off, extent of area flooded, velocity and depth of flood waters and
even the location of flooding can be achieved. These structural processes come
under floodplain management strategy. A regular maintenance of these flood control
structures is therefore one of the most important considerations.
Dams and Reservoirs should be constructed with such a plan that during the
event of flood they can help to limit the speed of the water and also limit the flooded
area. Hence they must be kept properly and reservoir sedimentation should be
cleared regularly.
Dikes, Levees and Flood walls should be of masonry or steel and efficiently
designed and regularly maintained. The areas around them should have regulated
development as well.
Channel Alterations by deepening or widening or straightening the channel,
removing debris, raising or enlarging bridges and culverts can be done to increase
the flow-carrying capacity of a stream which as a result reduces the height of a flood.
Stormwater Management is the removal of water that falls directly onto
properties, as opposed to flood water, that flows onto the property, from upstream
Page 33
Occurrences of Extreme Weather Events and its..... 232
sources or an ocean surge (Disaster Management and Relief Department, 2009). To
manage Storm-water natural drainage systems may be used along with the concrete
lined channels so that the surface run-off is channelized into them so that the urban
structures are protected against the localized flooding. Their regular expansion and
upkeep is required as with the expansion of an urban area the old structures might
become less useful.
The state authorities lay a lot of stress on effective Watershed Management
Sound watershed management through extensive soil conservation, catchment area
treatment, preservation of forests and increasing the forest area and construction of
check dams shall be promoted to reduce the intensity of floods
(http://waterresources.rajasthan.gov.in/5disaster.htm). Watershed management is
much popular in the agricultural areas. Here, the measures include maintaining trees
and vegetative covers, terrace farming, slope stabilization, structures to direct flood
or excess water. These measures improve rain water infiltration in the soil eventually
minimizing run-off. The emphasis is also laid to tackle water logging and salinity
problems. Such Watershed programs involve a very large scale planning.
When the flood occurs the relief and rescue management begins, which
involves the active participation and immediate action by the identified responsible
government authorities along with NGO‟s volunteers, home guards, charitable
institutions to tackle the situation efficiently. Relief camps are established and all the
required facilities and aid is provided. In these after flood management the role of
Administrative Arrangements; Duties of different Officers and Establishments and
the role of Armed Forces assume the greatest importance. Their effectiveness of the
relief management depends on their level of co-ordination.
Page 34
Occurrences of Extreme Weather Events and its..... 233
Losses of life and property are calculated and detailed report to the Government
is submitted. This report contains a complete description about the nature and cause
of the flood, loss of human and livestock, estimated damage to public and private
properties, agricultural land and crops, public utilities, etc. This helps in rendering
the destitute gratuitous relief immediately and in selecting the prompt measures that
must be taken for their rescue, evacuation, relief and rehabilitation operations.
The sufferers of the flood are provided with immediate aid by the Government
in form of medical aid, temporary shelter, clothing, cooked food for maximum period
of 15 days, and necessary household articles like utensil. Gratuitous relief may be in
the form of cash as well. The expenditure on grant in aid is provided under "2245-
Relief on account of Natural Calamities", in the budget.
Assistance is also provided to the agriculturists who suffer damage to their
crops, agricultural lands and houses as determined by the revenue Authorities on the
basis of eye estimate. Agriculturist whose sown area is completely inundated, whose
standing crop is completely washed away by floods or severely damaged or has
rendered the lands unfit for immediate cultivation are provided assistance in form of
seeds and restoring and de-silting the land etc. Repair and restoration of the rural
houses is also assisted by the relief authorities. Losses incurred on livestock are also
taken care by the government by reconstructing cattle sheds, providing cattle feed etc.
From the above description it can be seen that the flood management
machinery of the state is well planned. Each department or authority is fully
informed of the function it has to perform and the hierarchy that must be followed. It
should also be noted that if the flood forecasting and the flood mitigation is timely
and efficient in the state then the loss of life and property can be lessened.
Page 35
Occurrences of Extreme Weather Events and its..... 234
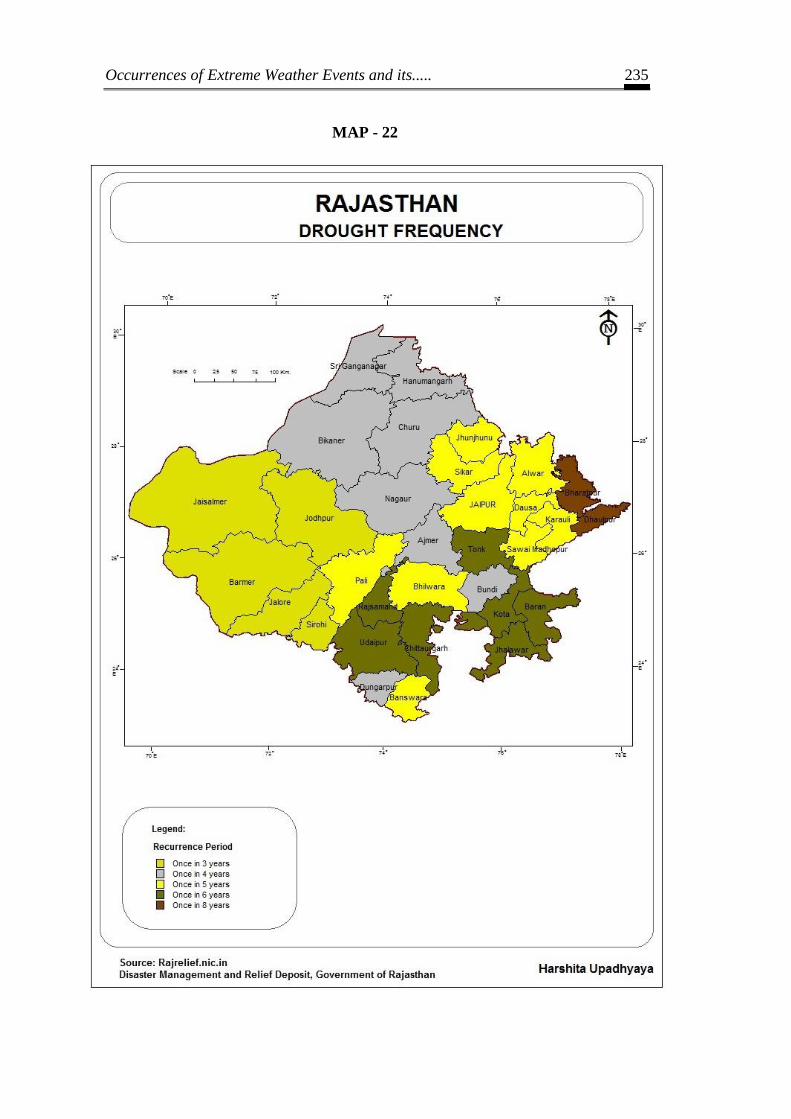
5.5 DROUGHTS IN RAJASTHAN
Rajasthan, the largest state has 10.41% total area containing 5% of total
population of the country but just 1% water resources. The western part of the
Aravallis falls in the arid region comprising of the Thar Desert region. The state has
low and erratic rainfall making the region vulnerable to drought. Based on historical
data the frequency of occurrence of droughts in the state is depicted in Map – 22.
Drought may be generally defined as a temporary reduction in water or
moisture availability significantly below the normal or expected amount for a
specified period (Disaster Management and Relief Department, 2009). Drought
occurs in all the districts of the state with varying intensities of moderate and severe.
The drought impacts the availability of food, fodder and water by creating their
shortage or discrepancies between supply and demand. Drought can have direct and
significant impact on the overall economy by affecting food and fodder production.
Drought is characterized by slow onset and its effects may accumulate over
time and may remain for many years. Because of this assessing the impact and
planning assistance becomes difficult for a drought situation. The degree of crop loss
in droughts is influenced by the moisture retention of soil and timing of the rains.
There are a few factors which contribute to vulnerability during droughts,
like more dependency on rain-fed agriculture; inability of farmers to adapt to
drought due to repeated crop failures; insufficient pastures for livestock-dependent
populations; acute drought may lead to famine and deaths; and in the areas with
inadequate assistance from government or other agencies vulnerability to death may
increase.
Page 36
Occurrences of Extreme Weather Events and its..... 235
MAP - 22
Page 37
Occurrences of Extreme Weather Events and its..... 236
Droughts may be classified in the following type:
1. The Meteorological drought results from a shortfall in precipitation. It is
measured by a relative comparison between the degrees of dryness and
normal or average amount of rainfall that should have been received. This
comparative study must be region specific and may be measured against
annual, monthly, seasonal or daily time scales of rainfall.
2. The Hydrological drought involves a reduction of water resources in
groundwater, streams, lakes and reservoirs. For its calculation data on
availability of water in these reservoirs and their use pattern (domestic,
industrial, irrigated agricultural, etc.) is studied.
3. The Agricultural drought studies the impact of meteorological and
hydrological droughts on crop and livestock production of a region. It occurs
when a plant's demand for water through soil moisture is insufficient to
maintain its average plant growth. The impact of agricultural drought is
difficult to measure as water requirement and supply depend on the type of
plant, its stage of growth and the properties of the soil. Also the quality of
seeds pests, weeds, low soil fertility and poor agricultural practices too affect
the growth factors of a plant.
4. The Famine drought is said to have occurred when the food, fodder and water
shortages are very severe due to the effect of metrological and hydrological
droughts, when large numbers of people become unhealthy or die. It can be
regarded as an extreme form of agricultural drought as well which might be
even due to wars and conflicts.
Page 38
Occurrences of Extreme Weather Events and its..... 237
5. The Socio-economic drought is a concept that recognizes the relationship
between drought and human activities. It is said to have occurred when the
poor socio-economic activities aggravate the impacts and vulnerability to
future droughts. It is usually seen in the regions where the supply of
important goods and services like water, fodder or electric power are weather
dependent and occurrence of a drought may cause significant shortages.
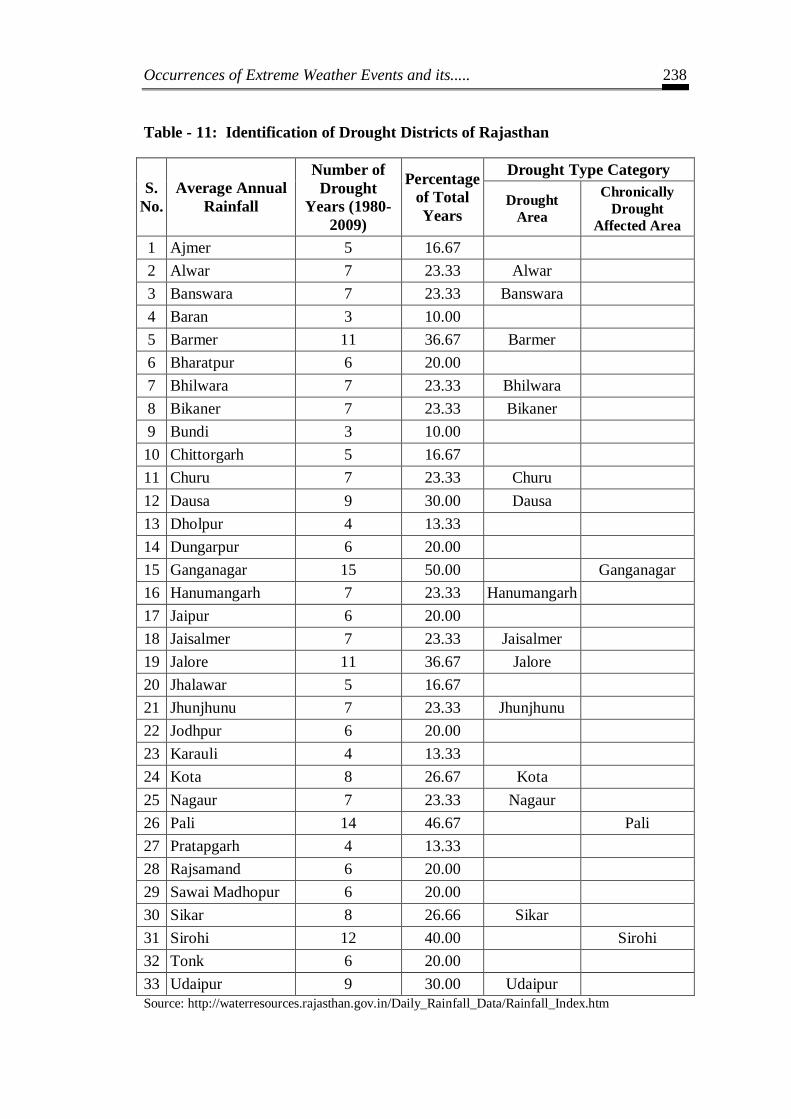
The drought prone areas of Rajasthan: The meteorological drought over an area or
place may be defined as a situation when annual rainfall over the area or place is less
than 75% of the normal. It is further classified as „moderate drought‟ if rainfall
deficit is between 25 to 50% and „severe drought‟ when it is more than 50%. Areas
where frequency of drought as defined above is 20% of the years examined are
classified as „drought areas‟ and areas having drought condition for more than 40%
of the years under consideration represent “chronically drought affected areas
(Indian Meteorological Department, 2010). Based on this the district wise rainfall
analysis was done. The annual average rainfall was compared to the average rainfall
of the studied period of 30 years i.e. from 1980 to 2009. And based on the
percentage of departure Moderate and Severe Drought years were categorized.
Further classification was done by calculating the frequency of meteorological
droughts and the districts were categorized as „Drought Areas‟ and “Chronically
Drought Affected Areas”. This classification has been tabulated in Table – 11. The
„Drought Areas‟ include Alwar, Banswara, Barmer, Bhilwara, Bikaner, Churu,
Dausa, Hanumangarh, Jaisalmer, Jalore, Jhunjhunu, Kota, Nagaur and Udaipur
districts. The „Chronically Drought Affected Areas‟ include Ganganagar, Pali and
Sirohi districts.
Page 39
Occurrences of Extreme Weather Events and its..... 238
Table - 11: Identification of Drought Districts of Rajasthan
S.
No.
Average Annual
Rainfall
Number of
Drought
Years (1980-
2009)
Percentage
of Total
Years
Drought Type Category
Drought
Area
Chronically
Drought
Affected Area
1 Ajmer 5 16.67
2 Alwar 7 23.33 Alwar
3 Banswara 7 23.33 Banswara
4 Baran 3 10.00
5 Barmer 11 36.67 Barmer
6 Bharatpur 6 20.00
7 Bhilwara 7 23.33 Bhilwara
8 Bikaner 7 23.33 Bikaner
9 Bundi 3 10.00
10 Chittorgarh 5 16.67
11 Churu 7 23.33 Churu
12 Dausa 9 30.00 Dausa
13 Dholpur 4 13.33
14 Dungarpur 6 20.00
15 Ganganagar 15 50.00
Ganganagar
16 Hanumangarh 7 23.33 Hanumangarh
17 Jaipur 6 20.00
18 Jaisalmer 7 23.33 Jaisalmer
19 Jalore 11 36.67 Jalore
20 Jhalawar 5 16.67
21 Jhunjhunu 7 23.33 Jhunjhunu
22 Jodhpur 6 20.00
23 Karauli 4 13.33
24 Kota 8 26.67 Kota
25 Nagaur 7 23.33 Nagaur
26 Pali 14 46.67
Pali
27 Pratapgarh 4 13.33
28 Rajsamand 6 20.00
29 Sawai Madhopur 6 20.00
30 Sikar 8 26.66 Sikar
31 Sirohi 12 40.00
Sirohi
32 Tonk 6 20.00
33 Udaipur 9 30.00 Udaipur
Source: http://waterresources.rajasthan.gov.in/Daily_Rainfall_Data/Rainfall_Index.htm
Page 40
Occurrences of Extreme Weather Events and its..... 239
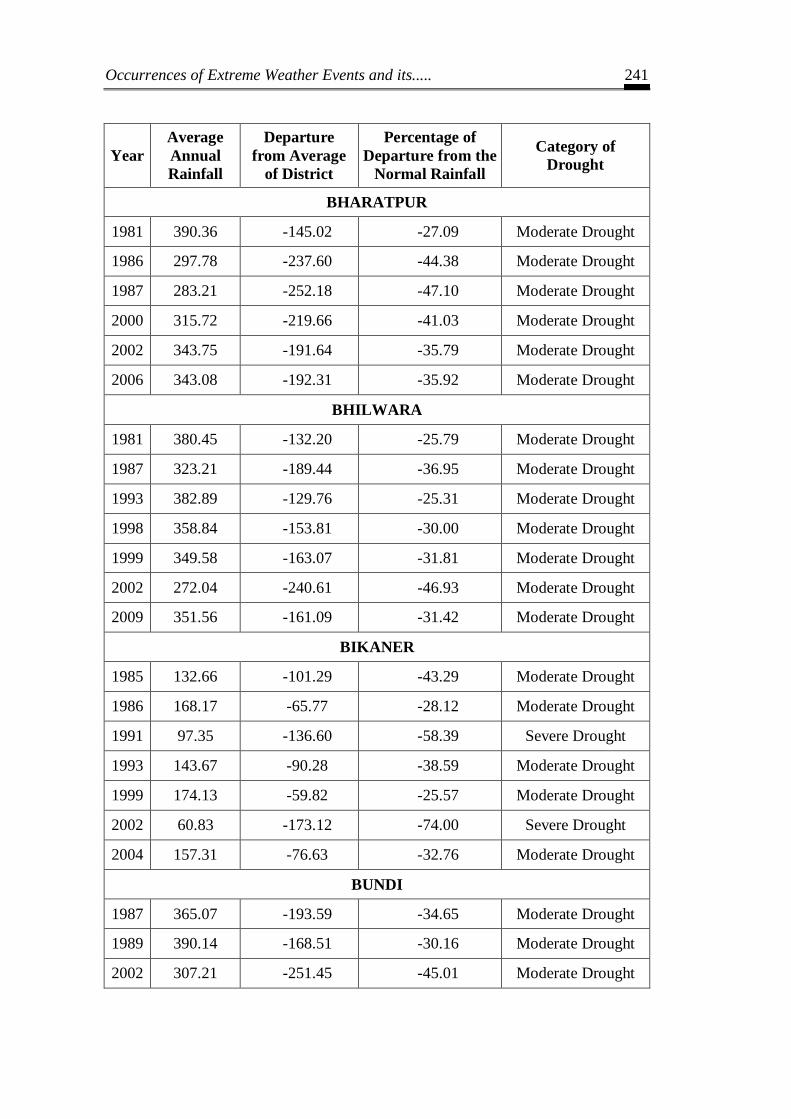
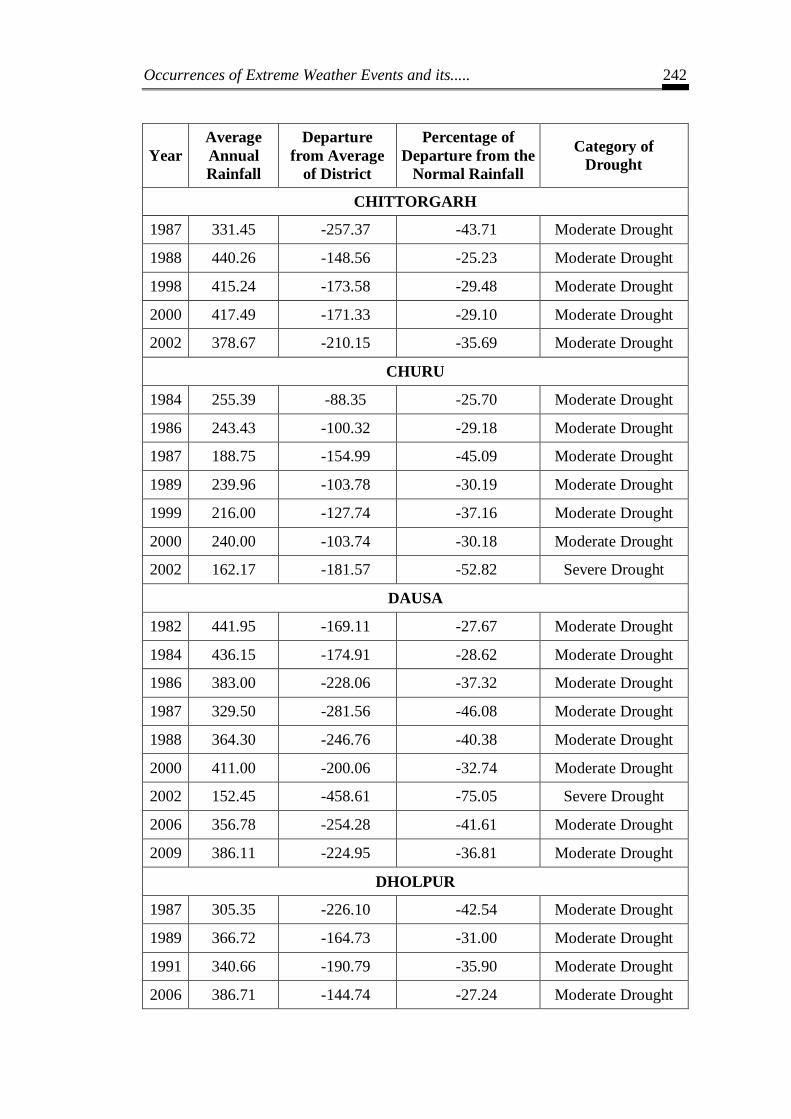
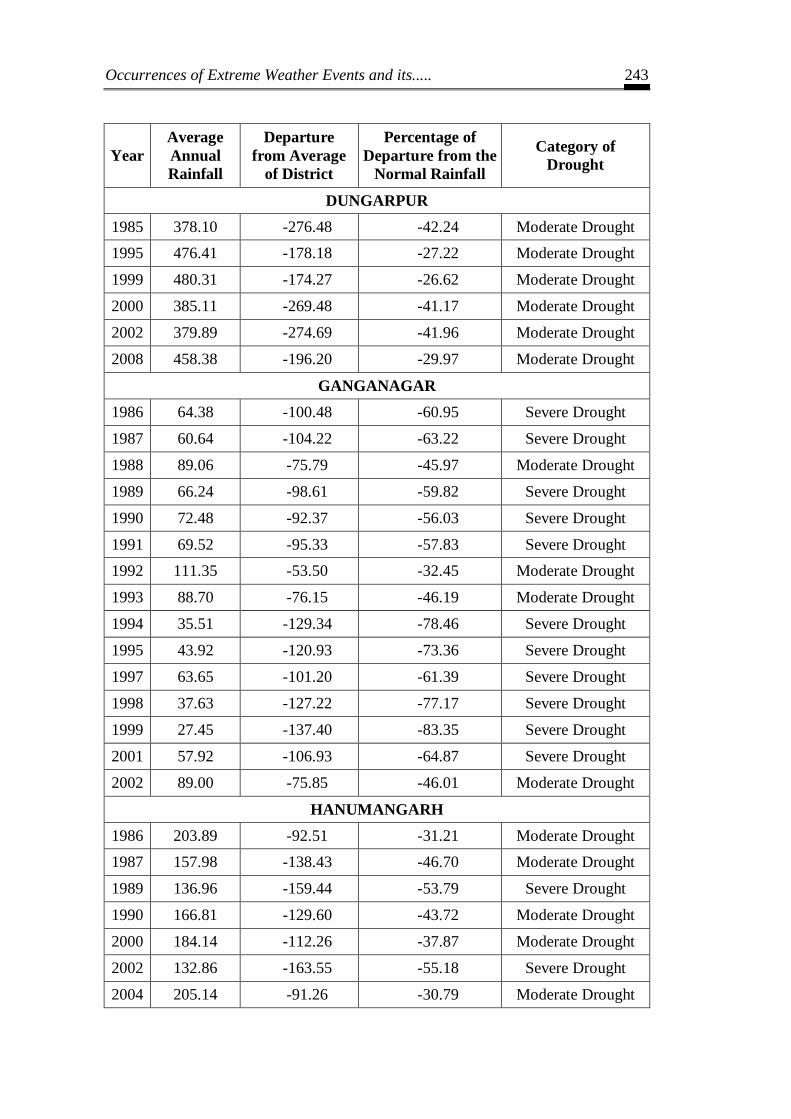
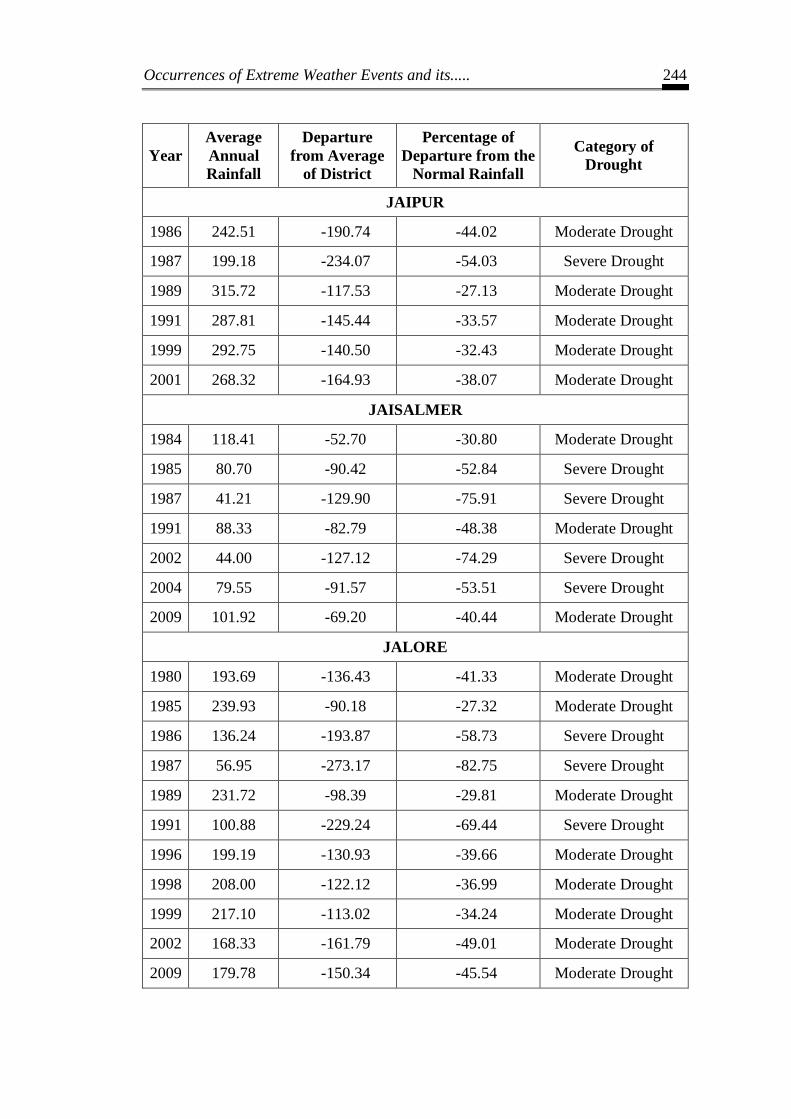
5.6 HISTORY OF DROUGHT
Rajasthan has had many drought years in the past and the region lying
towards the west of the Aravalli Range is an arid region. The degree of effectiveness
of drought depends on the amount of shortage of rainfall. The following chapter
mentions the drought years that have been observed in the 30 years ranging from
1980 and 2009.
For the same the average annual rainfall received at that district was
compared to the average rainfall of the observed 30 years. The percentage of
departure of average annual rainfall was compared from the average rainfall
received during 1980 and 2009. If during a year the average annual rainfall is
between 25 percent and 50 percent below the average of the district for a specific
year, then that is categorized as Moderate Drought Year and if the average annual
rainfall is below 50 percent then the year is categorized as Severe Drought Year.
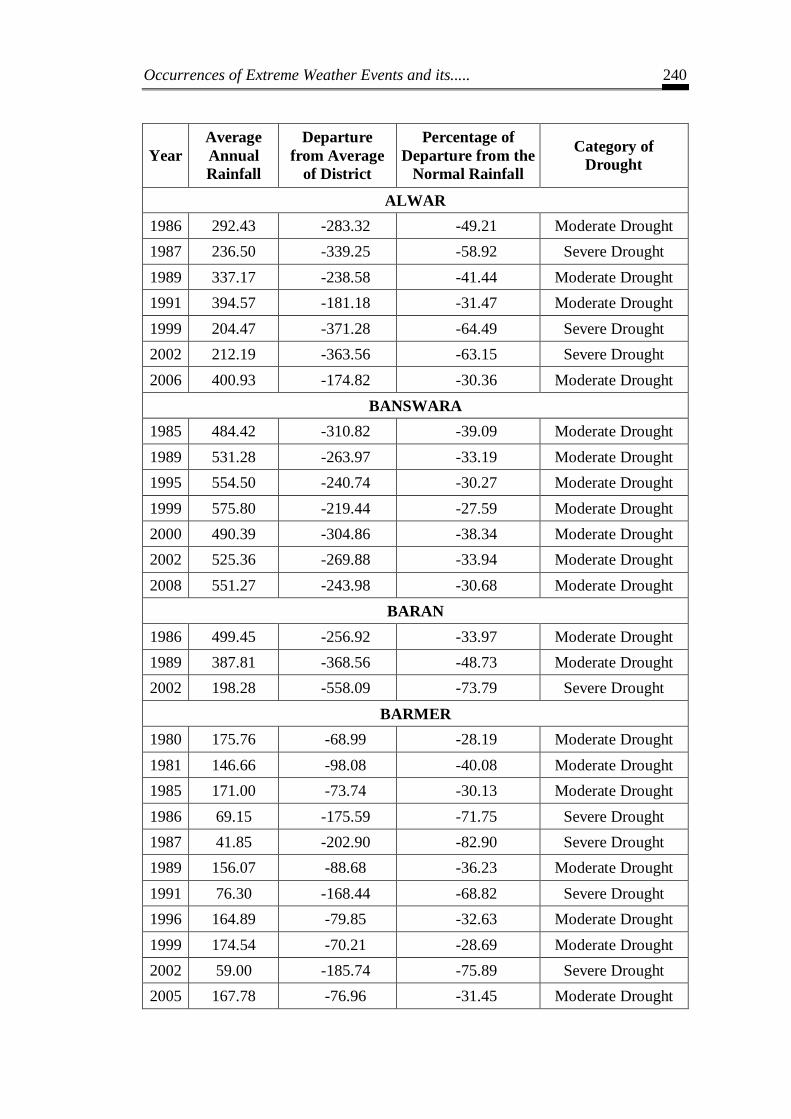
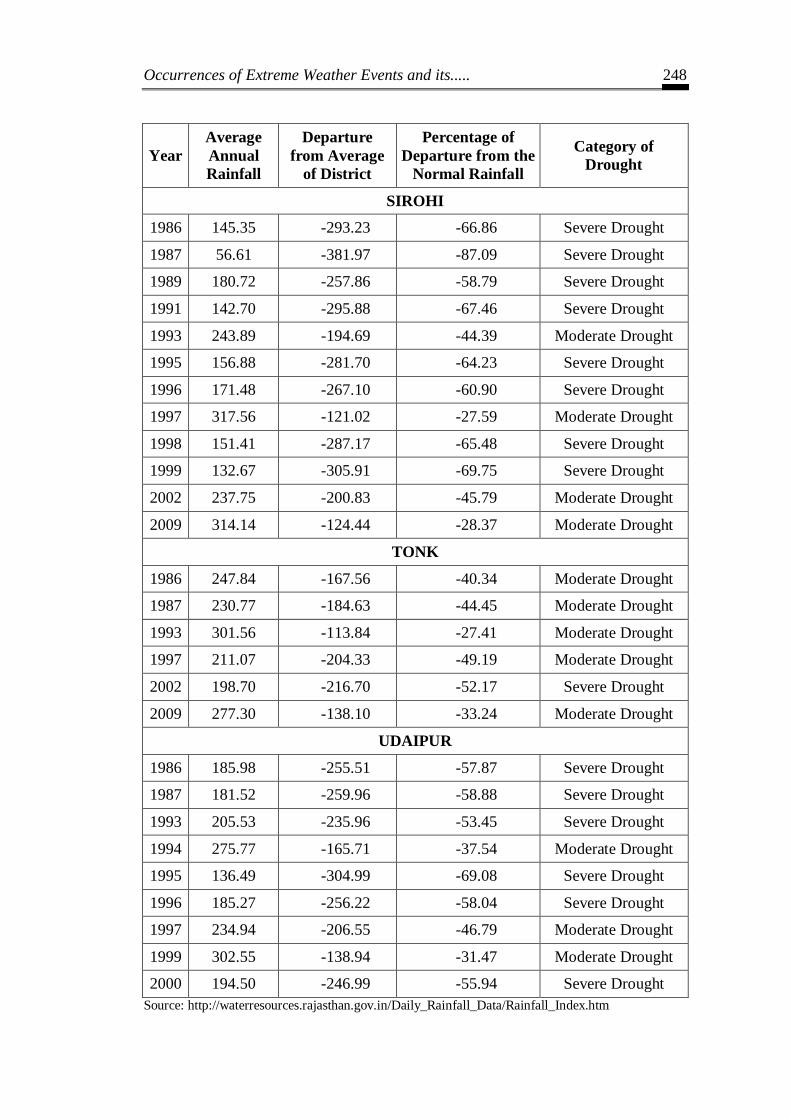
The detailed calculation has been tabulated in Table – 12 and Graph – 21
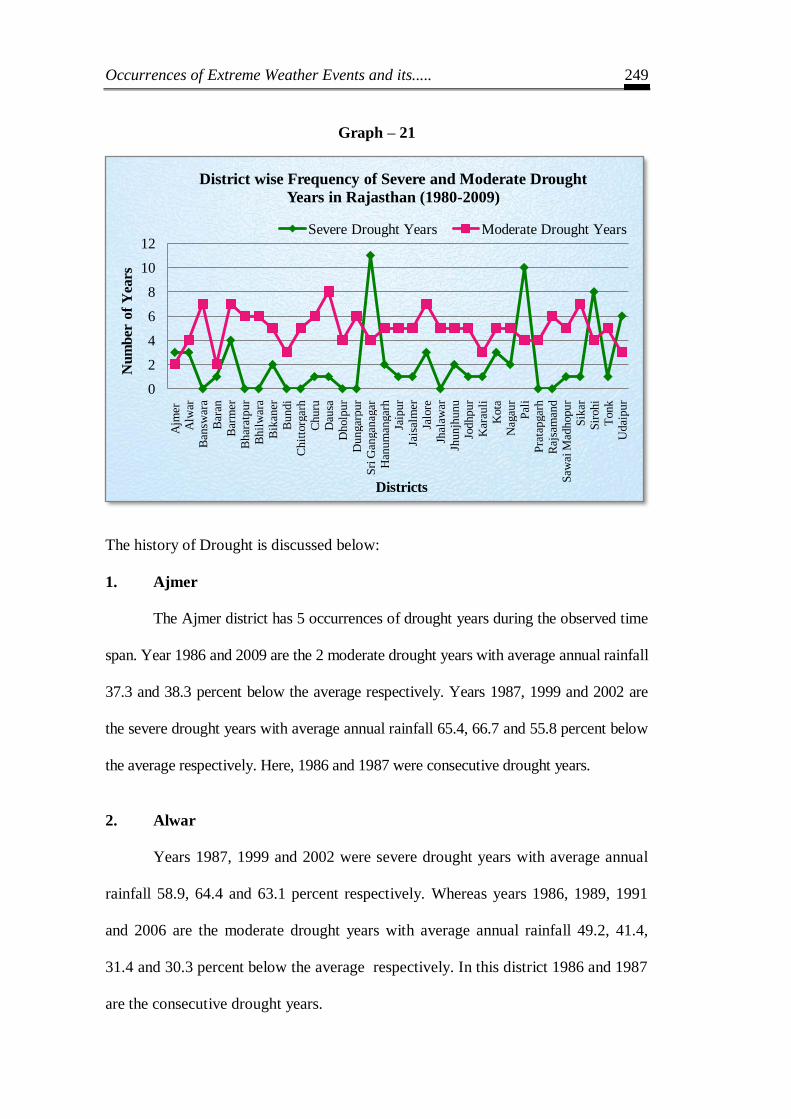
depicts the frequency of Moderate and Severe Drought Years in Rajasthan.
Table – 12 Categorization of Droughts in Rajasthan
Year
Average
Annual
Rainfall
Departure
from Average
of District
Percentage of
Departure from the
Normal Rainfall
Category of
Drought
AJMER
1986 256.38 -152.68 -37.32 Moderate Drought
1987 141.32 -267.74 -65.45 Severe Drought
1999 136.11 -272.95 -66.73 Severe Drought
2002 180.70 -228.36 -55.83 Severe Drought
2009 252.31 -156.75 -38.32 Moderate Drought
Page 41
Occurrences of Extreme Weather Events and its..... 240
Year
Average
Annual
Rainfall
Departure
from Average
of District
Percentage of
Departure from the
Normal Rainfall
Category of
Drought
ALWAR
1986 292.43 -283.32 -49.21 Moderate Drought
1987 236.50 -339.25 -58.92 Severe Drought
1989 337.17 -238.58 -41.44 Moderate Drought
1991 394.57 -181.18 -31.47 Moderate Drought
1999 204.47 -371.28 -64.49 Severe Drought
2002 212.19 -363.56 -63.15 Severe Drought
2006 400.93 -174.82 -30.36 Moderate Drought
BANSWARA
1985 484.42 -310.82 -39.09 Moderate Drought
1989 531.28 -263.97 -33.19 Moderate Drought
1995 554.50 -240.74 -30.27 Moderate Drought
1999 575.80 -219.44 -27.59 Moderate Drought
2000 490.39 -304.86 -38.34 Moderate Drought
2002 525.36 -269.88 -33.94 Moderate Drought
2008 551.27 -243.98 -30.68 Moderate Drought
BARAN
1986 499.45 -256.92 -33.97 Moderate Drought
1989 387.81 -368.56 -48.73 Moderate Drought
2002 198.28 -558.09 -73.79 Severe Drought
BARMER
1980 175.76 -68.99 -28.19 Moderate Drought
1981 146.66 -98.08 -40.08 Moderate Drought
1985 171.00 -73.74 -30.13 Moderate Drought
1986 69.15 -175.59 -71.75 Severe Drought
1987 41.85 -202.90 -82.90 Severe Drought
1989 156.07 -88.68 -36.23 Moderate Drought
1991 76.30 -168.44 -68.82 Severe Drought
1996 164.89 -79.85 -32.63 Moderate Drought
1999 174.54 -70.21 -28.69 Moderate Drought
2002 59.00 -185.74 -75.89 Severe Drought
2005 167.78 -76.96 -31.45 Moderate Drought
Page 42
Occurrences of Extreme Weather Events and its..... 241
Year
Average
Annual
Rainfall
Departure
from Average
of District
Percentage of
Departure from the
Normal Rainfall
Category of
Drought
BHARATPUR
1981 390.36 -145.02 -27.09 Moderate Drought
1986 297.78 -237.60 -44.38 Moderate Drought
1987 283.21 -252.18 -47.10 Moderate Drought
2000 315.72 -219.66 -41.03 Moderate Drought
2002 343.75 -191.64 -35.79 Moderate Drought
2006 343.08 -192.31 -35.92 Moderate Drought
BHILWARA
1981 380.45 -132.20 -25.79 Moderate Drought
1987 323.21 -189.44 -36.95 Moderate Drought
1993 382.89 -129.76 -25.31 Moderate Drought
1998 358.84 -153.81 -30.00 Moderate Drought
1999 349.58 -163.07 -31.81 Moderate Drought
2002 272.04 -240.61 -46.93 Moderate Drought
2009 351.56 -161.09 -31.42 Moderate Drought
BIKANER
1985 132.66 -101.29 -43.29 Moderate Drought
1986 168.17 -65.77 -28.12 Moderate Drought
1991 97.35 -136.60 -58.39 Severe Drought
1993 143.67 -90.28 -38.59 Moderate Drought
1999 174.13 -59.82 -25.57 Moderate Drought
2002 60.83 -173.12 -74.00 Severe Drought
2004 157.31 -76.63 -32.76 Moderate Drought
BUNDI
1987 365.07 -193.59 -34.65 Moderate Drought
1989 390.14 -168.51 -30.16 Moderate Drought
2002 307.21 -251.45 -45.01 Moderate Drought
Page 43
Occurrences of Extreme Weather Events and its..... 242
Year
Average
Annual
Rainfall
Departure
from Average
of District
Percentage of
Departure from the
Normal Rainfall
Category of
Drought
CHITTORGARH
1987 331.45 -257.37 -43.71 Moderate Drought
1988 440.26 -148.56 -25.23 Moderate Drought
1998 415.24 -173.58 -29.48 Moderate Drought
2000 417.49 -171.33 -29.10 Moderate Drought
2002 378.67 -210.15 -35.69 Moderate Drought
CHURU
1984 255.39 -88.35 -25.70 Moderate Drought
1986 243.43 -100.32 -29.18 Moderate Drought
1987 188.75 -154.99 -45.09 Moderate Drought
1989 239.96 -103.78 -30.19 Moderate Drought
1999 216.00 -127.74 -37.16 Moderate Drought
2000 240.00 -103.74 -30.18 Moderate Drought
2002 162.17 -181.57 -52.82 Severe Drought
DAUSA
1982 441.95 -169.11 -27.67 Moderate Drought
1984 436.15 -174.91 -28.62 Moderate Drought
1986 383.00 -228.06 -37.32 Moderate Drought
1987 329.50 -281.56 -46.08 Moderate Drought
1988 364.30 -246.76 -40.38 Moderate Drought
2000 411.00 -200.06 -32.74 Moderate Drought
2002 152.45 -458.61 -75.05 Severe Drought
2006 356.78 -254.28 -41.61 Moderate Drought
2009 386.11 -224.95 -36.81 Moderate Drought
DHOLPUR
1987 305.35 -226.10 -42.54 Moderate Drought
1989 366.72 -164.73 -31.00 Moderate Drought
1991 340.66 -190.79 -35.90 Moderate Drought
2006 386.71 -144.74 -27.24 Moderate Drought
Page 44
Occurrences of Extreme Weather Events and its..... 243
Year
Average
Annual
Rainfall
Departure
from Average
of District
Percentage of
Departure from the
Normal Rainfall
Category of
Drought
DUNGARPUR
1985 378.10 -276.48 -42.24 Moderate Drought
1995 476.41 -178.18 -27.22 Moderate Drought
1999 480.31 -174.27 -26.62 Moderate Drought
2000 385.11 -269.48 -41.17 Moderate Drought
2002 379.89 -274.69 -41.96 Moderate Drought
2008 458.38 -196.20 -29.97 Moderate Drought
GANGANAGAR
1986 64.38 -100.48 -60.95 Severe Drought
1987 60.64 -104.22 -63.22 Severe Drought
1988 89.06 -75.79 -45.97 Moderate Drought
1989 66.24 -98.61 -59.82 Severe Drought
1990 72.48 -92.37 -56.03 Severe Drought
1991 69.52 -95.33 -57.83 Severe Drought
1992 111.35 -53.50 -32.45 Moderate Drought
1993 88.70 -76.15 -46.19 Moderate Drought
1994 35.51 -129.34 -78.46 Severe Drought
1995 43.92 -120.93 -73.36 Severe Drought
1997 63.65 -101.20 -61.39 Severe Drought
1998 37.63 -127.22 -77.17 Severe Drought
1999 27.45 -137.40 -83.35 Severe Drought
2001 57.92 -106.93 -64.87 Severe Drought
2002 89.00 -75.85 -46.01 Moderate Drought
HANUMANGARH
1986 203.89 -92.51 -31.21 Moderate Drought
1987 157.98 -138.43 -46.70 Moderate Drought
1989 136.96 -159.44 -53.79 Severe Drought
1990 166.81 -129.60 -43.72 Moderate Drought
2000 184.14 -112.26 -37.87 Moderate Drought
2002 132.86 -163.55 -55.18 Severe Drought
2004 205.14 -91.26 -30.79 Moderate Drought
Page 45
Occurrences of Extreme Weather Events and its..... 244
Year
Average
Annual
Rainfall
Departure
from Average
of District
Percentage of
Departure from the
Normal Rainfall
Category of
Drought
JAIPUR
1986 242.51 -190.74 -44.02 Moderate Drought
1987 199.18 -234.07 -54.03 Severe Drought
1989 315.72 -117.53 -27.13 Moderate Drought
1991 287.81 -145.44 -33.57 Moderate Drought
1999 292.75 -140.50 -32.43 Moderate Drought
2001 268.32 -164.93 -38.07 Moderate Drought
JAISALMER
1984 118.41 -52.70 -30.80 Moderate Drought
1985 80.70 -90.42 -52.84 Severe Drought
1987 41.21 -129.90 -75.91 Severe Drought
1991 88.33 -82.79 -48.38 Moderate Drought
2002 44.00 -127.12 -74.29 Severe Drought
2004 79.55 -91.57 -53.51 Severe Drought
2009 101.92 -69.20 -40.44 Moderate Drought
JALORE
1980 193.69 -136.43 -41.33 Moderate Drought
1985 239.93 -90.18 -27.32 Moderate Drought
1986 136.24 -193.87 -58.73 Severe Drought
1987 56.95 -273.17 -82.75 Severe Drought
1989 231.72 -98.39 -29.81 Moderate Drought
1991 100.88 -229.24 -69.44 Severe Drought
1996 199.19 -130.93 -39.66 Moderate Drought
1998 208.00 -122.12 -36.99 Moderate Drought
1999 217.10 -113.02 -34.24 Moderate Drought
2002 168.33 -161.79 -49.01 Moderate Drought
2009 179.78 -150.34 -45.54 Moderate Drought
Page 46
Occurrences of Extreme Weather Events and its..... 245
Year
Average
Annual
Rainfall
Departure
from Average
of District
Percentage of
Departure from the
Normal Rainfall
Category of
Drought
JHALAWAR
1980 539.61 -222.57 -29.20 Moderate Drought
1989 482.83 -279.36 -36.65 Moderate Drought
1998 552.13 -210.06 -27.56 Moderate Drought
2002 515.88 -246.30 -32.32 Moderate Drought
2005 570.61 -191.58 -25.14 Moderate Drought
JHUNJHUNU
1981 304.08 -116.54 -27.71 Moderate Drought
1986 252.33 -168.29 -40.01 Moderate Drought
1987 204.62 -216.00 -51.35 Severe Drought
1989 241.62 -179.00 -42.56 Moderate Drought
1999 264.50 -156.12 -37.12 Moderate Drought
2002 148.13 -272.50 -64.78 Severe Drought
2009 291.71 -128.91 -30.65 Moderate Drought
JODHPUR
1986 146.72 -90.90 -38.26 Moderate Drought
1991 154.14 -83.48 -35.13 Moderate Drought
1993 161.11 -76.51 -32.20 Moderate Drought
1998 164.68 -72.94 -30.70 Moderate Drought
2002 86.54 -151.08 -63.58 Severe Drought
2009 131.13 -106.49 -44.82 Moderate Drought
KARAULI
1986 286.46 -249.50 -46.55 Moderate Drought
1987 346.98 -188.98 -35.26 Moderate Drought
1989 230.88 -305.08 -56.92 Severe Drought
2001 296.50 -239.46 -44.68 Moderate Drought
Page 47
Occurrences of Extreme Weather Events and its..... 246
Year
Average
Annual
Rainfall
Departure
from Average
of District
Percentage of
Departure from the
Normal Rainfall
Category of
Drought
KOTA
1987 275.08 -248.50 -47.46 Moderate Drought
1989 247.72 -275.86 -52.69 Severe Drought
1993 375.46 -148.12 -28.29 Moderate Drought
1997 231.02 -292.56 -55.88 Severe Drought
1998 124.01 -399.57 -76.32 Severe Drought
1999 341.81 -181.77 -34.72 Moderate Drought
2002 389.60 -133.98 -25.59 Moderate Drought
2005 383.37 -140.21 -26.78 Moderate Drought
NAGAUR
1984 207.90 -114.11 -35.44 Moderate Drought
1986 205.34 -116.67 -36.23 Moderate Drought
1987 132.52 -189.49 -58.85 Severe Drought
1989 213.75 -108.26 -33.62 Moderate Drought
1999 202.54 -119.47 -37.10 Moderate Drought
2002 144.33 -177.68 -55.18 Severe Drought
2009 176.27 -145.74 -45.26 Moderate Drought
PALI
1986 56.30 -214.13 -79.18 Severe Drought
1987 23.68 -246.76 -91.24 Severe Drought
1988 187.37 -83.07 -30.72 Moderate Drought
1989 72.23 -198.20 -73.29 Severe Drought
1990 152.01 -118.43 -43.79 Moderate Drought
1991 70.17 -200.27 -74.05 Severe Drought
1993 109.00 -161.44 -59.69 Severe Drought
1994 125.95 -144.49 -53.43 Severe Drought
1995 86.09 -184.35 -68.17 Severe Drought
1996 94.56 -175.88 -65.03 Severe Drought
1997 161.81 -108.63 -40.17 Moderate Drought
1998 60.66 -209.78 -77.57 Severe Drought
1999 100.53 -169.91 -62.83 Severe Drought
2002 147.43 -123.01 -45.48 Moderate Drought
Page 48
Occurrences of Extreme Weather Events and its..... 247
Year
Average
Annual
Rainfall
Departure
from Average
of District
Percentage of
Departure from the
Normal Rainfall
Category of
Drought
PRATAPGARH
1992 509.00 -245.05 -32.50 Moderate Drought
1998 392.00 -362.05 -48.01 Moderate Drought
2000 475.50 -278.55 -36.94 Moderate Drought
2002 524.00 -230.05 -30.51 Moderate Drought
RAJSAMAND
1984 360.34 -150.05 -29.40 Moderate Drought
1985 317.17 -193.22 -37.86 Moderate Drought
1987 260.72 -249.67 -48.92 Moderate Drought
1993 381.57 -128.82 -25.24 Moderate Drought
2000 292.00 -218.39 -42.79 Moderate Drought
2002 296.82 -213.57 -41.84 Moderate Drought
SAWAI MADHOPUR
1987 289.16 -236.20 -44.96 Moderate Drought
1989 343.34 -182.02 -34.65 Moderate Drought
1993 303.30 -222.07 -42.27 Moderate Drought
1997 393.00 -132.37 -25.20 Moderate Drought
2000 379.24 -146.13 -27.82 Moderate Drought
2002 195.82 -329.55 -62.73 Severe Drought
SIKAR
1984 288.78 -111.83 -27.92 Moderate Drought
1987 202.88 -197.73 -49.36 Moderate Drought
1989 274.75 -125.86 -31.42 Moderate Drought
1999 288.50 -112.11 -27.98 Moderate Drought
2000 281.36 -119.25 -29.77 Moderate Drought
2002 171.20 -229.41 -57.27 Severe Drought
2004 223.33 -177.28 -44.25 Moderate Drought
2009 225.11 -175.50 -43.81 Moderate Drought
Page 49
Occurrences of Extreme Weather Events and its..... 248
Year
Average
Annual
Rainfall
Departure
from Average
of District
Percentage of
Departure from the
Normal Rainfall
Category of
Drought
SIROHI
1986 145.35 -293.23 -66.86 Severe Drought
1987 56.61 -381.97 -87.09 Severe Drought
1989 180.72 -257.86 -58.79 Severe Drought
1991 142.70 -295.88 -67.46 Severe Drought
1993 243.89 -194.69 -44.39 Moderate Drought
1995 156.88 -281.70 -64.23 Severe Drought
1996 171.48 -267.10 -60.90 Severe Drought
1997 317.56 -121.02 -27.59 Moderate Drought
1998 151.41 -287.17 -65.48 Severe Drought
1999 132.67 -305.91 -69.75 Severe Drought
2002 237.75 -200.83 -45.79 Moderate Drought
2009 314.14 -124.44 -28.37 Moderate Drought
TONK
1986 247.84 -167.56 -40.34 Moderate Drought
1987 230.77 -184.63 -44.45 Moderate Drought
1993 301.56 -113.84 -27.41 Moderate Drought
1997 211.07 -204.33 -49.19 Moderate Drought
2002 198.70 -216.70 -52.17 Severe Drought
2009 277.30 -138.10 -33.24 Moderate Drought
UDAIPUR
1986 185.98 -255.51 -57.87 Severe Drought
1987 181.52 -259.96 -58.88 Severe Drought
1993 205.53 -235.96 -53.45 Severe Drought
1994 275.77 -165.71 -37.54 Moderate Drought
1995 136.49 -304.99 -69.08 Severe Drought
1996 185.27 -256.22 -58.04 Severe Drought
1997 234.94 -206.55 -46.79 Moderate Drought
1999 302.55 -138.94 -31.47 Moderate Drought
2000 194.50 -246.99 -55.94 Severe Drought
Source: http://waterresources.rajasthan.gov.in/Daily_Rainfall_Data/Rainfall_Index.htm
Page 50
Occurrences of Extreme Weather Events and its..... 249
Graph – 21
The history of Drought is discussed below:
1. Ajmer
The Ajmer district has 5 occurrences of drought years during the observed time
span. Year 1986 and 2009 are the 2 moderate drought years with average annual rainfall
37.3 and 38.3 percent below the average respectively. Years 1987, 1999 and 2002 are
the severe drought years with average annual rainfall 65.4, 66.7 and 55.8 percent below
the average respectively. Here, 1986 and 1987 were consecutive drought years.
2. Alwar
Years 1987, 1999 and 2002 were severe drought years with average annual
rainfall 58.9, 64.4 and 63.1 percent respectively. Whereas years 1986, 1989, 1991
and 2006 are the moderate drought years with average annual rainfall 49.2, 41.4,
31.4 and 30.3 percent below the average respectively. In this district 1986 and 1987
are the consecutive drought years.
0
2
4
6
8
10
12
Ajm
er
Alw
ar
Ban
swar
a
Bar
an
Bar
mer
Bhar
atpur
Bhil
war
a
Bik
aner
Bu
ndi
Chit
torg
arh
Churu
Dau
sa
Dholp
ur
Dungar
pur
Sri
Gan
gan
agar
Han
um
angar
h
Jaip
ur
Jais
alm
er
Jalo
re
Jhal
awar
Jhu
njh
unu
Jodhpur
Kar
auli
Kota
Nag
aur
Pal
i
Pra
tapgar
h
Raj
sam
and
Saw
ai M
adhopur
Sik
ar
Sir
ohi
Tonk
Udai
pur
Nu
mb
er o
f Y
ears
Districts
District wise Frequency of Severe and Moderate Drought
Years in Rajasthan (1980-2009)
Severe Drought Years Moderate Drought Years
Page 51
Occurrences of Extreme Weather Events and its..... 250
3. Banswara
There are 7 moderate drought years in the district with no severe drought
year. The years 1999 and 2000 saw consecutive droughts. Year 1985, 1989, 1995,
1999, 2000, 2002 and 2008 had average annual rainfall 39.0, 33.1, 30.2, 27.5, 38.3,
33.9 and 30.6 percent below the average respectively.
4. Baran
The district saw 2 moderate and 1 severe drought year during the observed
years. Year 2002 received 73.3 percent average annual rainfall below the average and
hence categorised as severe drought year. Years 1986 and 1989 had average annual
rainfall 33.9 and 48.7 percent below the average and are moderate drought years.
5. Barmer
There have been 11 instances of drought years in the Barmer district, with 4
severe drought years. Years 1980, 1981, 1985, 1986, 1987, 1989, 1991, 1996, 1999,
2002 and 2005 are classified as moderate average annual rainfall years as the average
annual rainfall received was 28.1, 40.0, 30.1, 36.2, 32.6, 28.6 and 31.4 below the
average respectively. The severe drought years were 1986, 1987, 1991 and 2002
with average annual rainfall 71.7, 82.9, 68.8 and 75.8 percent below the average
respectively. It can be seen that 1980-1981, 1985-1987 and 1999-2000 are consecutive
and 1987, 1989 and 1991 are alternate drought years of the district.
6. Bharatpur
There are no occurrences of severe drought in the district but moderate
drought years are 6 in number. They are year 1981, 1986, 1987, 2000, 2002 and
2006 when the average annual rainfall was 27.0, 44.3, 47.1, 41.0, 37.7 and 37.9
Page 52
Occurrences of Extreme Weather Events and its..... 251
below the average. Here 1986-1987 are consecutive and 200 and 2002 are alternate
drought years of the district.
7. Bhilwara
The years 1981, 1987, 1993, 1998, 1999, 2002 and 2009 are moderate
drought years with average annual rainfall 25.7, 36.9, 25.3, 30.0, 31.08, 46.9 and
31.4 percent below the average. Here 1998 and 1999 are consecutive drought years.
The Bhilwara district had no severe drought years during the observed time span.
8. Bikaner
The Bikaner district had 2 occurrences of severe drought years i.e. during
1991 and 2002 when the average annual rainfall was 58.3 and 74.0 percent below
the average. The moderate drought years are 1985, 1986, 1993, 1999 and 2004 when
the average annual rainfall was 43.2, 28.1, 38.5 25.5 and 32.7 respectively below the
average. It can be observed that 1985-1986 are consecutive and 1991, 1993 and
2002, 2004 are alternate drought years.
9. Bundi
There are 3 occurrences of moderate drought in the district during 1987,
1989 and 2002 when the average annual rainfall was 34.6, 30.1 and 45.0 percent
below the average respectively. Here, 1987 and 1989 are alternate drought years.
There is no severe drought year in the district during the observed time span.
10. Chittorgarh
The district has 5 moderate drought years i.e. 1987, 1988, 1998, 2000, and
2002 when the average annual rainfall was 43.7, 25.2, 29.4, 29.0 and 35.6 percent
below the average. Here 4987 and 1988 are consecutive and 2000 and 2002 are
alternate drought years.
Page 53
Occurrences of Extreme Weather Events and its..... 252
11. Churu
Churu district has 7 drought years where 1984 and 1986; 1987 and 1989; and
2000 and 2002 are alternate and 1986-1987 and 1999-2000 are consecutive drought
years. The moderate drought years are 1984, 1986, 1987, 1989, 1999 and 2000 with
average annual rainfall 25.7, 29.1, 45.0, 30.1, 37.1 and 30.1 percent below the
average respectively. The year 2002 is the only severe drought year with average
annual rainfall 52.8 percent below the average.
12. Dausa
The district had just 1 occurrence of severe drought year in the district during
2002 when the average annual rainfall was 75.05 percent below the average. The
moderate drought years are 1982, 1984, 1986, 1987, 1988, 2000, 2006 and 2009
with average annual rainfall 27.6, 28.6, 37.3, 46.0, 40.3, 32.7, 41.6 and 36.8 percent
below the average respectively. In Dausa district year 1982 and 1984; 2000 and
2002 are alternate drought years and 1986 to 1988 are consecutive drought years.
13. Dholpur
The Dholpur district had 4 occurrences of moderate drought years with 1987
and 1989 being the alternate drought years. Hence, during the years 1987, 1989,
1991 and 2006 the average annual rainfall was 42.5, 30.9, 35.8 and 27.2 percent
below the average.
14. Dungarpur
During the observed time span the district had 6 occurrences of moderate
droughts and no severe drought was seen during the observed years. Here, 1999 and
2000 are consecutive drought years and 2000 and 2002 alternate drought years. The
years 1985, 1995, 1999, 2000, 2002 and 2008 had average annual rainfall 42.2, 27.2,
26.6, 41.1, 41.9 and 29.9 percent below the average respectively.
Page 54
Occurrences of Extreme Weather Events and its..... 253
15. Ganganagar
The district had 15 years of drought during the observed 30 years. Years
1986 to 1995 are consecutive 10 years of meteorological drought followed by
drought during 1997 to 1999 and 2001 and 2002. The severe drought years were
1986, 1987, 1989, 1990, 1991, 1994, 1995, 1997, 1998, 1999 and 2001 with average
annual rainfall 60.9, 63.2, 59.8, 56.0, 57.8, 78.4, 73.3, 61.3, 77.1, 83.3 and 64.8
percent below the average respectively. There are also 4 years of moderate drought
during 1988, 1992, 1993 and 2002 when the average annual rainfall was 45.9, 32.4,
46.1 and 46.0 percent below the average.
16. Hanumangarh
The district had 2 occurrences of severe drought years during 1989 and 2002
when the average annual rainfall was 53.7 and 55.1 percent below the average. The
years 1986, 1987, 1990, 200 and 2004 had average annual rainfall 31.2, 46.7, 43.7,
37.8 and 30.7 percent below the average respectively. Here, 1986 and 1987; 1989
and 1990 are consecutive drought years and 1987 and 1989; 200-2002-2004 are
alternate drought years.
17. Jaipur
The year 1987 was the only severe drought year in the district during the
observed time span, when the average annual rainfall exceeded the average by 54.02
percent. The years 1986 and 1987 are the consecutive drought years and 1987 and
1989; 1999 and 2001 are the alternate drought years of the district, Here, during
1986, 1989, 1991, 1999 and 2000 were observed as moderate drought years as the
average annual rainfall was 44.02, 27.1, 33.5, 32.4 and 38.06 percent below average
respectively.
Page 55
Occurrences of Extreme Weather Events and its..... 254
18. Jaisalmer
The Jaisalmer district had 7 drought years during 1980 and 2009 where 1984
and 1985 were consecutive drought years and 1985 and 1987; 2002 and 2004 are
alternate drought years in the district. The years 1984, 1991 and 2009 have been
classified as the moderate drought years where average annual rainfall was 30.7,
48.3 and 40.4 percent below the average. The years 1985, 1987, 2002 and 2004 are
the severe drought years as the average annual rainfall was 52.8, 75.9, 74.2 and 53.5
percent below the average.
19. Jalore
The district has 3 severe and 8 moderate drought years during the observed
time span. Here the years 1985-1986 and 1987; 1998 and 1999 are consecutive and
1987 and 1989 and 1991 are the alternate drought years. The severe drought years
are 1986, 1987 and 1991 with average annual rainfall 58.7, 82.7 and 69.4 respectively
below the average. The moderate drought years are 1980, 1985, 1989, 1996, 1998,
1999, 2002 and 2009 with average annual rainfall 41.3, 27.3, 29.8, 39.6, 36.9, 34.2,
49.0 and 45.5 percent below the average respectively.
20. Jhalawar
Here years 1980, 1989, 1998, 2002 and 2005 are the moderate drought years
with average annual rainfall 29.2, 36.6, 27.5, 32.3 and 25.1 percent below the average
respectively. The district had no severe drought year in the observed time span.
21. Jhunjhunun
The years 1987 and 2002 are the severe drought years of the district when the
average annual rainfall was 51.3 and 64.7 percent below the average respectively. The
Page 56
Occurrences of Extreme Weather Events and its..... 255
moderate drought years were 1981, 1986, 1989, 1999 and 2009 with average annual
rainfall 27.7, 40.0, 42.5, 37.1 and 30.6 percent respectively below the average. The
district had 1986 and 1987 as consecutive and 1987 and 1989 as alternate drought
years.
22. Jodhpur
The year 2002 is the only severe drought year in the district when the
average annual rainfall was 63.5 percent below the average. The years 1986, 1991,
1993, 1998 and 2009 are considered as moderate drought years as the average
annual rainfall received is 38.2, 35.1, 32.1, 30.6 and 44.8 percent below the average
respectively. Here, 1991 and 1993 are alternate drought years.
23. Karauli
The district had the occurrence of drought majorly between 1986 and 1989.
The years 1986, 1987 and 2001 are classified as moderate drought years as the
average annual rainfall was 46.5, 35.2 and 44.6 percent below the average
respectively. Year 1989 is categorised as severe drought year with average annual
rainfall 56.9 percent below the average.
24. Kota
The Kota district has alternate drought years during 1987 and 1989 and
consecutive drought years during 1997 and 1998 and 1999. The moderate drought
years are 1987, 1993, 1999, 2002 and 2005 with average annual rainfall 47.4, 28.2,
34.7, 25.5 and 26.7 percent below the average respectively. The severe drought
years are 1989, 1997 and 1998 with average annual rainfall below the average by
52.6, 55.8 and 76.3 percent respectively.
Page 57
Occurrences of Extreme Weather Events and its..... 256
25. Nagaur
The severe drought years of the district are 1987 and 2002 with average
annual rainfall 58.8 and 55.1 percent below the average respectively. The years 1984,
1986, 1989, 1999 and 2009 are moderate drought years with 35.4, 36.2, 33.6, 37.1
and 45.2 percent average annual rainfall less than the average respectively. Here,
1984 and 1986; 1987 and 1989 are alternate and 1986 and 1987 are consecutive
drought years.
26. Pali
The district had 14 years of drought out of the observed 30 years. Here there
has been consecutive drought for 6 years during 1986 and 1991 and for 7 years
during 1993 and 1999. There have been 10 years of severe droughts i.e. 1986, 1987,
1989, 1991, 1993, 1994, 1995, 1996, 1998 and 1999 with average annual rainfall
being lower than the average by 79.1, 91.2, 73.2, 74.0, 59.6, 53.4, 68.1, 65.0, 77.5
and 62.8 respectively. The moderate drought years were 1988, 1990, 1997 and 2002
with average annual rainfall 30.7, 43.7, 40.1 and 45.4 percent below the average
respectively.
27. Pratapgarh
There are 4 years classified as moderate drought years on the district with no
severe drought year. The moderate drought years were 1992, 1998, 2000 and 2002
with 32.4, 48.0, 36.9 and 30.5 percent average annual rainfall below the average.
28. Rajsamand
The district had following 6 years of moderate drought in the district 1984,
1985, 1987, 1993, 2000 and 2002 with average annual rainfall below the average by
Page 58
Occurrences of Extreme Weather Events and its..... 257
29.3, 37.8, 48.9, 25.2, 42.7 and 41.8 percent respectively. There are no years
classified as severe drought years. Here 1984 and 1985 are consecutive and 1985
and 1987 as alternate drought years in the district.
29. Sawai Madhopur
The district had 5 moderate drought years during the observed time span i.e.
during 1987, 1989, 1993, 1997 and 2000 with average annual rainfall 44.9, 34.6,
42.2, 25.1 and 27.8 percent below the average respectively. The year 2002 is the
only severe drought year with 62.7 percent average annual rainfall below the
average. The years 1987 and 1989 are alternate drought years.
30. Sikar
At Sikar district too, 2002 is the only severe drought year with average
annual rainfall 57.2 percent below the average. The year 1987 and 1989; 2000 and
2002 are alternate and 1999 and 200 are consecutive drought years of the district.
The 7 moderate drought years are 1984, 1987, 1989, 1999, 2000, 2004 and 2009
with average annual rainfall below the average by 27.9, 49.3, 31.4, 27.7, 44.2 and
43.8 respectively.
31. Sirohi
There have been 12 drought years in the district during the observed 30
years. The years 1986 and 1987; and 1995 to 1999 are the consecutive drought years
and 1987 and 1989 and 1991 and 1993 and 1995 are the alternate drought years.
There were 8 severe drought years i.e. 1986, 1987, 1989, 1991, 1995, 1996, 1998
and 1999 with average annual rainfall 66.8, 87.0, 58.7, 67.4, 64.2, 60.9, 65.4 and
69.7 percent below the average respectively. And the 4 moderate drought years were
Page 59
Occurrences of Extreme Weather Events and its..... 258
1993, 1997, 2002 and 2009 with average annual rainfall less than the average by
44.3, 27.5, 45.7 and 28.3 percent respectively.
32. Tonk
The moderate drought years of the district are 1986, 1987, 1993, 1997 and
2009 with average annual rainfall 40.3, 44.4, 27.4, 49.1 and 33.2 percent below the
average respectively. Year 2002 was the only severe drought year with average
annual rainfall 52.16 percent less than the average. The years 1986 and 1987 are the
consecutive drought years of the district.
33. Udaipur
The district had 9 drought years with 1986 and 1987; 1993 to 1997; and 1999
and 2000 as the consecutive drought years. The 6 severe drought years are 1986,
1987, 1993, 1995, 1996 and 2000 with average annual rainfall percentage 57.8, 58.8,
53.4, 69.0, 58.0 and 55.9 percent below the average respectively. The moderate
drought years were 1994, 1997 and 1999 with average annual rainfall below the
average by 37.5, 46.7 and 31.4 percent respectively.
The study shows that the frequency of droughts has at many districts
increased during the last decade. All the districts have experienced low average
annual rainfall leading to moderate and severe drought years. But the districts like
Banswara, Bharatpur, Bhilwara, Bundi, Chittorgarh, Dholpur, Dungarpur, Jhalawar,
Pratapgarh and Rajsamand had no severe drought year, whereas Pali and Ganganagar
Districts had the highest frequency of drought years in Rajasthan during 1980 and
2009. The decadal occurences of drought in Rajasthan are depicted in Graph - 22.
Page 60
Occurrences of Extreme Weather Events and its..... 259
Graph – 22
0
1
2
3
4
5
6
7
8
9
Ajm
er
Alw
ar
Bansw
ara
Bara
n
Barm
er
Bhara
tpu
r
Bhil
wara
Bik
aner
Bu
ndi
Chit
torg
arh
Chu
ru
Dau
sa
Dholp
ur
Du
ngarp
ur
Ganganagar
Hanum
angarh
Jaip
ur
Jais
alm
er
Jalo
re
Jhala
war
Jhu
njh
unu
Jodhpur
Kara
uli
Kota
Nagaur
Pali
Pra
tap
garh
Rajs
am
and
Saw
ai M
adhop
ur
Sik
ar
Sir
ohi
Tonk
Udaip
ur
No. of
Occ
ura
nce
s
Districts
District-wise Decadal Frequency of Droughts in Rajasthan (1980-2009)
1980-1989 1990-1999 2000-2009
Page 61
Occurrences of Extreme Weather Events and its..... 260
5.7 IMPACT OF DROUGHT
Rajasthan state is has a dry and arid type of climate especially on the western
part. There has been a long history of droughts in the state. There have been various
severe and moderate drought years in the state during the observed years. Out of the
33 districts of the state 15 districts namely – Alwar, Banswara, Barmer, Bhilwara,
Bikaner, Churu, Dausa, Hanumangarh, Jaisalmer, Jalore, Jhunjhunu, Kota, Nagaur,
Sikar and Udaipur are drought affected. 3 districts namely – Ganganagar, Pali and
Sirohi fall in chronically drought affected category.
The impacts of drought are seen is social, economic and environmental
fronts. The most significant effect is seen on the quality and quantity of water of the
region. Extreme stress and paucity of basic necessities causes a situation of famine.
The 4 types of famines are – „Annakal‟ (food grain famine), „Jalakal‟ (scarcity of
water), „Trinakal‟ (fodder famine) and „Trikal‟ (scarcity of food grains, water and
fodder). Though in the present times the conditions of famine are absent in the state.
Impacts are seen in crop production losses, harm to habitats of various
animal and fish species, harm to plant species, degradation of the fertile layer of the
soil, income loss for farmers, losses to agro-products industries, mass unemployment,
losses of revenue to government. There are also food shortages, loss of human life,
decline in the living conditions, increased poverty and a sharp increase in the
migration of the population to the areas with better facilities.
In the survey conducted in the drought prone Barmer rural area
covering the Aagore, Mahaderi Naadi, Uttarlai naadi, Naganeshia and Beriyon
ka Baas the following impacts of droughts were observed from the accounts of the
people (see Figure – 5).
Page 62
Occurrences of Extreme Weather Events and its..... 261
Figure - 5 Surveyor interviewing farmers at Naganeshia dhaani,
Doonda village, Barmer
Water Resources: The main source of water in the villages or Dhaanis in western
Rajasthan is Naadi or community pond. See Figure – 6. The rain water gets collected
there and is used throughout the year.
Figure – 6 Surveyor at Mahaderi Naadi, Uttarlai village,
Barmer taking information
These Naadis are a source of water for both humans and animals of the
region. The ground water of the area is saline hence is not normally used. There are
Page 63
Occurrences of Extreme Weather Events and its..... 262
also presence of small wells or Kui. These are covered wells. The government assists
in building of these covered wells i.e. tankas (see Figure – 7).
Figure – 7 Surveyor taking a look at the government assisted Tanka
Cultivation: The area is arid and the entire agriculture in the region is rain fed.
Hence, agriculture is of mainly of coarse grains. Bajra, Moong, Mooth, Gram and oil
seeds are popularly grown. The general vegetation of the region of thorny shrubs in
patches in some region (see Figure – 8) and there are regions completely devoid of
any vegetation. During the drought period there is absolutely no agriculture.
Figure – 8 Natural Vegetation of the surveyed region
Page 64
Occurrences of Extreme Weather Events and its..... 263
Livestock: Cow, goat, buffalo, sheep and camel are normally domesticated. They
are reared mainly for milk and wool or hides. Water is supplied by the government
to small tanks especially built for cattle (see Figure – 9). There are pastures to feed
the cattle. During droughts there is an increased mortality of cattle due to less feed
and water. Also the locals informed that the feed supplied from the relief operation
is non- conventional. The cattle owners told that they leave their cattle free so that
they could look for fodder themselves. The respondents also told that few cattle died
due to choking of intestines as they ate polythene bags.
Figure – 9 One of the tanks especially built for cattle in the surveyed region
Cattle Feed and Fodder Resources: The respondents told that the insufficiency of
feed and fodder both in quality and quantity is a major problem. This problem
becomes even more during the drought years.
Socio – Economic Issues: During the drought period water scarcity is the biggest
constraint. The primary occupation of agriculture becomes impossible to be
practiced. Livestock rearing is the second major occupation of the region. But due to
drought a large scale migration of sheep and goats was seen from the region. There
Page 65
Occurrences of Extreme Weather Events and its..... 264
was weight loss amongst cows and sheep due to which the overall production and
dependence got affected. The migration of families along with their herds and
alienation of land were seen on a large scale.
Hence, it can be seen that the impact on land use post-drought in every
situation is that there is a sharp decrease of forest area, permanent pastures and
grazing lands. The Barren area and uncultivated land and culturable wasteland
increase.
Page 66
Occurrences of Extreme Weather Events and its..... 265
5.8 DROUGHT MANAGEMENT
The National Water Policy highlights that through the measures related to
soil-moisture conservation, water harvesting, minimizing evaporation loss and
development of the ground water potential the drought-prone areas of the country
should be made less vulnerable. The needs of drought-prone areas should be given
priority when planning water resource development projects. Even the relief works
must employ the drought stricken population and the work should be directed
towards making the region drought proof. The State Water Policy of Rajasthan
follows these guidelines and provides all the support for making the drought prone
areas less vulnerable.
As drought has been a frequent feature in Rajasthan so the communities of
western Rajasthan have developed strategies to survive drought by storing water,
food and fodder using their indigenous techniques. Livestock dependent communities
diversify their herds to act as insurance against drought. Some cattle owners of the
western Rajasthan migrate seasonally to Gujarat, Uttar Pradesh and Madhya Pradesh.
People migrate to look for jobs.
The monsoon in the state brings erratic and uncertain rainfall. The production
of Kharif crops is rainfall dependent. Hence it is necessary to have a response system
to deal with the situation. The Rajasthan Government follows an early warning and
response system; learning from the past experiences by proper data analysis, timely
maintenance of irrigation system; adoption of crop stabilization strategy; storing
adequate amount of food stuff; alternate arrangements for drinking water supply;
and repair and construction of deep wells or bore wells.
Page 67
Occurrences of Extreme Weather Events and its..... 266
These pre-drought preparedness works require the co-ordination of various
departments and government officials like, Gram Sabha, Patwari, The Circle
Inspector, The Tehsildar, The Sub divisional Officer, Collector, Chief Executive
Officer of Zilla Parishad, Executive Engineer of Irrigation Department, various bank
officials, Executive Engineer of Electricity Department, District Agricultural
Officer, Executive Engineer of PHED, District Animal Husbandry Officer, District
Medical Officer and the Director of the Bureau of Economics and Statistics.
All the officers of the respective departments collected the relevant
information, based on which a report is submitted to the State Government. A
declaration of scarcity is done by following set criteria which is related to the
scenario of deterioration of agricultural crop production due to failure of rains or
other natural calamity or due to pests and diseases; deficit of drinking water; and
deficit of fodder. The crop failure hence results in severe unemployment.
The Drought Relief Operations are started soon after the declaration of
scarcity. The government is not only providing assistance to meet the hardship but
also strives to provide for quality of life. The following strategies are employed to
combat the drought situation:
1. The people of the drought struck area are employed in long term drought
proofing works. These works are related to the fields of Water harvesting
structures, Soil conservation, Afforestation, Pasture Development, Water
shed development and Rural Roads, De-silting of nadis, tankas etc.
2. Durable assets are created by the State/Centre Sector Schemes like Food for
Work; creation of new assets like houses, wells, tanka, ponds etc.; Promote
Page 68
Occurrences of Extreme Weather Events and its..... 267
handloom activities; BPL, Small and Marginal farmers, landless agriculture
labourers are provided work on priority. Separate plans are prepared for the
tribal areas.
3. For Cattle Conservation fodder is provided at subsidized rates; cattle camps
are maintained; veterinary health is given due attention; and cultivation of
green fodder is encouraged.
4. To provide drinking water augmentation of existing water resources; repair
and installation of new Hand Pumps and Tube Wells; Revival of traditional
water sources under Rajiv Gandhi Drinking Water Mission; and transportation
of water through road and rail tankers.
5. Other Measures like Effective implementation of social security, nutrition
and health schemes, old age pension scheme, Mid-day-Meal program, Health
care schemes; and active and prompt involvement of donors, NGOs and
Panchayat Raj Institutions.
6. The drought affected population is also provided with Gratuitous – Relief.
This is provide to the persons who cannot work i.e. the old aged and infirm;
the blind, crippled or insane; pregnant women and young children with no
support from relatives; and those who take care of incapable adults or young
children at home.
Water especially for drinking purposes is most essential necessity and has to
be provided to both of humans and livestock. The measures taken in Rajasthan to
supply drinking water are improving the rural water supply works and drinking
water supply in urban areas; especially marking few reservoirs for drinking water
Page 69
Occurrences of Extreme Weather Events and its..... 268
purposes only; continuous repairs of hand pumps; and supply the water to the
affected region by tankers through road and rail or bullock-carts.
Providing essential commodities like food grains, edible oil and kerosene is
also very essential. This is mostly done through fair-price shops which have adequate
stock of these items. For the same may programs are also launched. Which include
the effective implementation of Public Distribution Schemes like Antyodaya Ann
Yojna, Annapoorna, Below Poverty Line and Above Poverty Line; others schemes
like National Family Benefit Scheme, National Maternity Benefit Scheme; providing
relief in kind (food grain) to the infirm, destitute, sick, pregnant women, orphans
etc.; encouraging donors to provide food articles; and free distribution of food grain
to the selected few very distressed families.
Monitoring of drought is a considerably important task especially in the
drought prone areas for each village at the district level. During the failure of
monsoons the District Relief Officers monitor the food, employment, drinking water,
fodder and general health situation for each village or Panchayat so that timely
action can be taken. Under the Chairmanship of Relief Secretary having Director
Agriculture, Director IMD, Hydrologist Irrigation Department and representative of
PHED and Ground Water Department a Weather Watch Group (WWG) has been
set- up in Rajasthan. This group help in providing early warning of drought onset
condition so that timely action can be taken. One of the most important inputs
available to the Weather Watch Group is monitors the water levels in all the medium
and major irrigation reservoirs for monitoring development of a drought situation
and a weekly assessment of crop condition is done at village level.
Page 70
Occurrences of Extreme Weather Events and its..... 269
The drought relief funds are primarily available from: Calamity Relief Fund,
National Calamity Contingency Fund, State funds and various ministries like rural
development, agriculture too allocate additional funds. For the funding during natural
calamities the budget estimates are compiled by the Disaster Management and Relief
Department according to the provisions given in the Budget Manual under the Head
- "2245-Relief on Account of Natural Calamities" which is forwarded to the Finance
Department.
The state government recognizes the importance of developing long term
drought mitigation strategies. The long run plans will focus on: Awareness generation
amongst vulnerable groups; promoting Community Based Drought Preparedness
and mitigation Plans; capacity building of the State institutes and departments; and
strengthening frameworks at state and district levels for drought risk management.
In the measures related to drought mitigation and post-drought management
supply of drinking water is most essential. It is essential to educate people on water
budgeting, so that they could themselves understand water demand and supply
relation with the ground water level scenario of their region. In water scarce state
like Rajasthan efforts must be made to conserve every drop of water.
There is a very urgent need to conserve water in used for irrigation with the
promotion of drip irrigation, sprinkler irrigation, water meters for flow irrigation etc.
so that water is used judiciously.
Page 71
Occurrences of Extreme Weather Events and its..... 270
For the optimal sustainable development, maintenance of quality and
efficient use of State's water resources following water management strategies have
been adopted for long term development:
1. For augmentation of Ground water levels rainwater harvesting techniques
must be employed. The rainwater is collected and retained for a longer time
period through check dams, roof top collections, naadi, contour bunding,
percolation tank etc. which helps in greater ground water recharge. This
technique is practiced in Rajasthan since ancient times.
2. Artificial recharge of ground water through feasible recharge methods like -
Induced recharge from surface water bodies, Percolation tanks, Recharge
through injection wells, Conservation of subsurface flows through construction
of sub surface dykes, etc.
3. The planning of Watershed Development is very beneficial for the state. It
involves an integrated approach that depends on physiographic and hydrologic
characteristics of a region. It includes construction of soil conservation works
on crop lands, construction of structures like percolation tanks, well
construction; check dams, contour bunds, gully plugging, rain water harvesting
structures etc.
4. The Planning Commission has suggested that for have better scientific
utilization of available resources planning must be done agro-climatic region
wise. This will help in making strategies to combat drought keeping in mind
the climate, topography, soil type, water resources and irrigation facilities.
Page 72
Occurrences of Extreme Weather Events and its..... 271
5. Methods like sprinkler and drip irrigation should be promoted to save water
and achieve higher irrigation efficiency. The Irrigation systems must be
properly and regularly maintained.
6. There must be a shift to surface drinking water projects from the ground
water projects like: Indira Gandhi Canal for desert districts; River Chambal
for Alwar, Bharatpur, Sawai Madhopur, Karauli and Dholpur districts; River
Yamuna for Alwar, Bharatpur, Jhunjhunu and Sikar districts; River Mahi for
Dungarpur and Banswara districts; and River Banas for Ajmer, Tonk,
Bhilwara, Chittorgarh, Udaipur and Jaipur districts.
7. Rajasthan has 54% of fluoride water and 43% of saline water of the country.
Hence there is a requirement simple design and low maintenance fluoride
plants in the State.
8. Fodder banks should be created especially in the western Rajasthan 60
percent of total livestock of the state if found there. These fodder banks
should be regularly maintained so that during drought years fodder can be
supplied in the areas.
9. Reduction in evaporation from soil surface can be reduced by placing water
tight moisture barriers on the soil
10. State should take forest restoration to solve the problem of environment
degradation and help in drought mitigation. This will meet the demand for
fuel wood and fodder.
11. Pricing of water is required so that it is not considered a free commodity and
is used optimally.
Page 73
Occurrences of Extreme Weather Events and its..... 272
12. To exploit the potential of ongoing irrigation and water supply projects they
must be completed timely.
13. Reduction of seepage losses in the conveyance system can be done by lining
of the canal system.
14. Optimum ground water exploitation and reuse of irrigation water must be
done.
15. Promoting comprehensive integrated basin planning approach, Lift Irrigation
Schemes and Inter Basin transfer of water.
16. Construction and revival of Rainwater Harvesting Structures; prevention of
evaporation losses from reservoirs and popularization of the use of
percolation tanks.
17. Dairy development in western Rajasthan, Allotment of Culturable wasteland
to Gaushalas, Promoting vermi compost production and diversification of
crops towards low water requiring horticultural crops.
18. Agriculture Insurance covering all food crops, oil seeds and annual
commercial crop must be done along with providing subsidy on selected
items for small and marginal farmers to save the farmers of the state.
19. In the drought prone districts like Barmer, Jodhpur, Jaisalmer and Bikaner
there is a vast potential in Handicraft and Khadi Village Industries. The
locals or artists of this region must be promoted for non-farm activities so
that they have an alternate to agriculture during drought times.
Page 74
Occurrences of Extreme Weather Events and its..... 273
Development pressures, population increase and environmental degradation
are the factors that could lead to climate change and also increase vulnerability to
drought. To deal with situation it is necessary to strengthen the coping mechanisms
through community-based integrated drought risk management plans using GIS
based risk and vulnerability mapping at district level. A wide range of factors
determine society's vulnerability to drought hence there is a need for a multi-sectoral
approach. For the same the government aims to combine traditional and indigenous
knowledge of drought preparedness and mitigation with modern science. This will
result in developing sustainable drought risk reduction strategies at state and district
levels.