1 5.2 Aquaculture Developments Related to Coastal and Marine Infrastructure Please note that whilst reference is made in this sector to coastal and marine infrastructure, i.e. piers, jetties, pontoons, slipways, moorings and navigation aids and their implications for Aquaculture, the policies, opportunities and hard and soft constraints for infrastructure development are given under the Coastal and Marine Infrastructure section of this plan. 5.2.1 Introduction The seas around Scotland are some of the most productive in the world, and the economic importance of fishing and aquaculture to Scotland’s rural and island communities is reflected by the higher proportion of these jobs when compared to overall national figures. In total Scottish marine and coastal areas support 16,000 fishing and aquaculture related jobs, and aquaculture in Scotland accounts for 90% of the UK’s farmed fin and shellfish. Aquaculture provides year round jobs which are important for coastal communities, although the increase in automation has resulted in a stabilising level of employment despite production increasing. As a whole the aquaculture industry is well established in the SOM with salmon farms having operated since the late 1980’s. However, shellfish production in the SOM itself is underdeveloped when compared with surrounding areas that have large oyster and mussel farms, and there may be potential for further expansion of shellfish sites. The following sections give an overview of the various activities within this sector. The overview of businesses, employment and economic contribution provided are summarised from a report by Magill et al. (2009) unless otherwise stated. The location of all known Aquaculture activities where spatial data was available is presented in Map AQ1 and in the Sub-area maps; and Map AQ2 presents opportunities identified for Aquaculture development in the SOM.
Transcript
1
5.2 Aquaculture
Developments Related to Coastal and Marine Infrastructure
Please note that whilst reference is made in this sector to coastal and marine infrastructure, i.e. piers,
jetties, pontoons, slipways, moorings and navigation aids and their implications for Aquaculture, the
policies, opportunities and hard and soft constraints for infrastructure development are given under the
Coastal and Marine Infrastructure section of this plan.
5.2.1 Introduction
The seas around Scotland are some of the most productive in the world, and the economic importance of
fishing and aquaculture to Scotland’s rural and island communities is reflected by the higher proportion of
these jobs when compared to overall national figures. In total Scottish marine and coastal areas support
16,000 fishing and aquaculture related jobs, and aquaculture in Scotland accounts for 90% of the UK’s
farmed fin and shellfish. Aquaculture provides year round jobs which are important for coastal
communities, although the increase in automation has resulted in a stabilising level of employment despite
production increasing.
As a whole the aquaculture industry is well established in the SOM with salmon farms having operated
since the late 1980’s. However, shellfish production in the SOM itself is underdeveloped when compared
with surrounding areas that have large oyster and mussel farms, and there may be potential for further
expansion of shellfish sites.
The following sections give an overview of the various activities within this sector. The overview of
businesses, employment and economic contribution provided are summarised from a report by Magill et al.
(2009) unless otherwise stated. The location of all known Aquaculture activities where spatial data was
available is presented in Map AQ1 and in the Sub-area maps; and Map AQ2 presents opportunities
identified for Aquaculture development in the SOM.
2
Map AQ1: Current known Aquaculture activities, supporting infrastructure and designations. The spatial accuracy of mapped information on activities is variable and these maps should not be used for navigation.
3
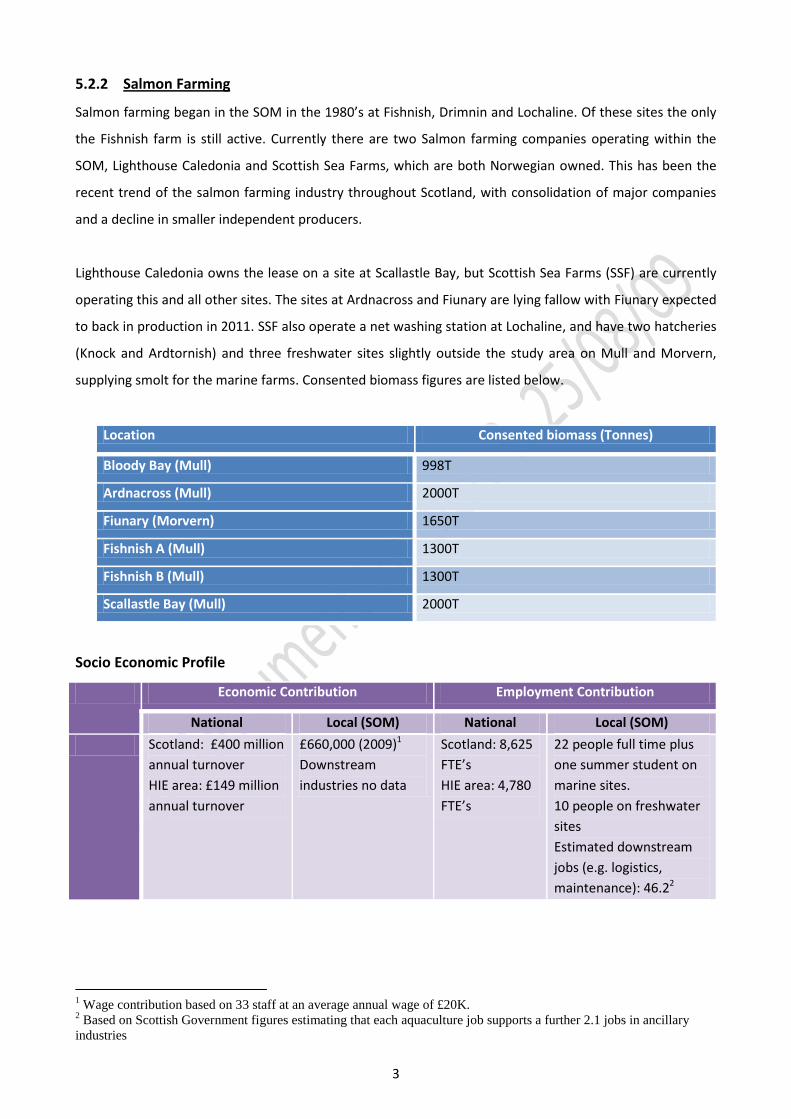
5.2.2 Salmon Farming
Salmon farming began in the SOM in the 1980’s at Fishnish, Drimnin and Lochaline. Of these sites the only
the Fishnish farm is still active. Currently there are two Salmon farming companies operating within the
SOM, Lighthouse Caledonia and Scottish Sea Farms, which are both Norwegian owned. This has been the
recent trend of the salmon farming industry throughout Scotland, with consolidation of major companies
and a decline in smaller independent producers.
Lighthouse Caledonia owns the lease on a site at Scallastle Bay, but Scottish Sea Farms (SSF) are currently
operating this and all other sites. The sites at Ardnacross and Fiunary are lying fallow with Fiunary expected
to back in production in 2011. SSF also operate a net washing station at Lochaline, and have two hatcheries
(Knock and Ardtornish) and three freshwater sites slightly outside the study area on Mull and Morvern,
supplying smolt for the marine farms. Consented biomass figures are listed below.
Location Consented biomass (Tonnes)
Bloody Bay (Mull) 998T
Ardnacross (Mull) 2000T
Fiunary (Morvern) 1650T
Fishnish A (Mull) 1300T
Fishnish B (Mull) 1300T
Scallastle Bay (Mull) 2000T
Socio Economic Profile
Economic Contribution Employment Contribution
National Local (SOM) National Local (SOM)
Scotland: £400 million
annual turnover
HIE area: £149 million
annual turnover
£660,000 (2009)1
Downstream
industries no data
Scotland: 8,625
FTE’s
HIE area: 4,780
FTE’s
22 people full time plus
one summer student on
marine sites.
10 people on freshwater
sites
Estimated downstream
jobs (e.g. logistics,
maintenance): 46.22
1 Wage contribution based on 33 staff at an average annual wage of £20K.
2 Based on Scottish Government figures estimating that each aquaculture job supports a further 2.1 jobs in ancillary
industries
4
5.2.3 Shellfish Cultivation
Production of farmed shellfish around the Isle of Mull as a whole has grown rapidly in recent years,
although the vast majority of production sites are situated outwith the study area. There are three main
operators: Inverlussa Mussels (at Loch Spelve) and Celtic Sea (at Loch Scridian) are the main mussel
producers, while Isle of Mull Oysters (at Loch Chumhainn) is the main oyster producer. A number of smaller
operators are found in Loch na Keal (oysters) and Loch Spelve (oysters). The number of operators in the
area reflects the general Scotland shellfish farming industry trend of small scale producers, although some
operators are increasing output through expansion and acquisition to increase their market share.
At present, there is only one small commercial mussel farm, situated in Tobermory Bay, operating within
the SOM. Unfortunately, mussels have not been produced there in great numbers, but it is believed that
Tobermory Bay does have potential for further development in terms of mussel cultivation based on
experimental results. Oysters are also cultivated experimentally in a number of places – Tobermory Bay,
Aros Bay and Torosay. The site at Tobermory Bay has not produced oysters for the market yet, while the
latter two sites have not been assessed for commercial viability. Sites at Arle, Ardnacross, Fishnish and
Scallastle have been identified for potential oyster cultivation (Mull Aquaculture and Fisheries Association).
There is no reported shellfish cultivation activity on the Morvern side of the SOM, and there are a number
of shellfish farm leases in neighbouring areas e.g. Loch Sunart but none are active at this time.
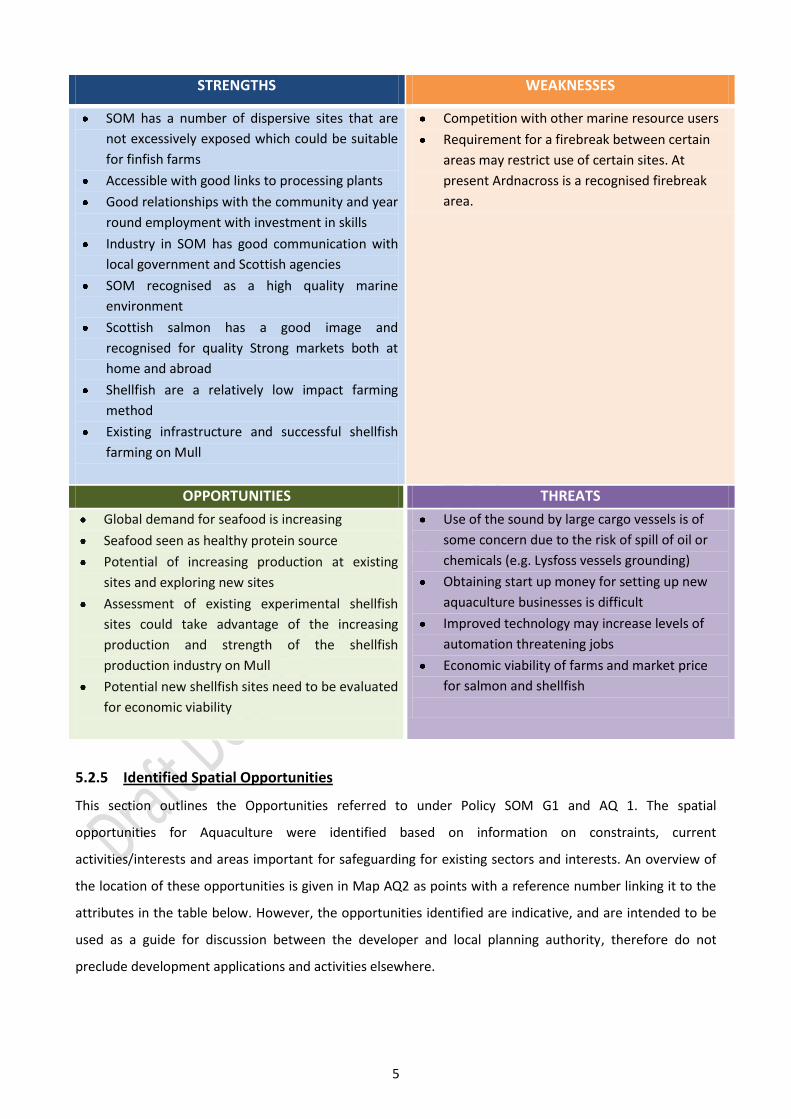
5.2.4 Summary of Strength, Weaknesses, Opportunities and Threats for the Sector
The information presented in the following SWOT analysis was collated from the socio-economic profile for
this sector provided by Magill et al. (2009) and the working group and Aquaculture subgroup. It has been
used to inform the Features of Interest for this sector outlined Policy SOM G1, the Additional Criteria in
policy AQ 1 and the Opportunities and Actions presented for this sector.
3 Based on Scottish Government figures estimating that each aquaculture job supports a further 2.1 jobs in ancillary
industries multiplied by the reported figure of 13 staff for Mull’s largest producer
5
STRENGTHS WEAKNESSES
SOM has a number of dispersive sites that are
not excessively exposed which could be suitable
for finfish farms
Accessible with good links to processing plants
Good relationships with the community and year
round employment with investment in skills
Industry in SOM has good communication with
local government and Scottish agencies
SOM recognised as a high quality marine
environment
Scottish salmon has a good image and
recognised for quality Strong markets both at
home and abroad
Shellfish are a relatively low impact farming
method
Existing infrastructure and successful shellfish
farming on Mull
Competition with other marine resource users
Requirement for a firebreak between certain
areas may restrict use of certain sites. At
present Ardnacross is a recognised firebreak
area.
OPPORTUNITIES THREATS
Global demand for seafood is increasing
Seafood seen as healthy protein source
Potential of increasing production at existing
sites and exploring new sites
Assessment of existing experimental shellfish
sites could take advantage of the increasing
production and strength of the shellfish
production industry on Mull
Potential new shellfish sites need to be evaluated
for economic viability
Use of the sound by large cargo vessels is of
some concern due to the risk of spill of oil or
chemicals (e.g. Lysfoss vessels grounding)
Obtaining start up money for setting up new
aquaculture businesses is difficult
Improved technology may increase levels of
automation threatening jobs
Economic viability of farms and market price
for salmon and shellfish
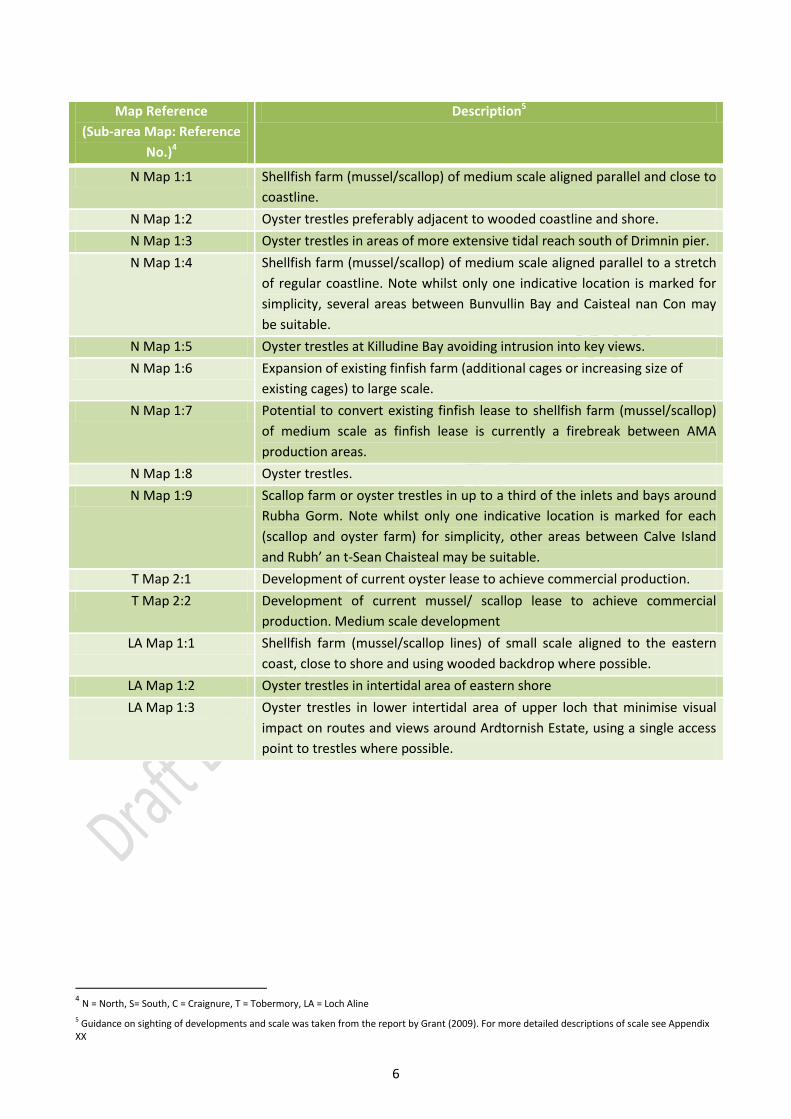
5.2.5 Identified Spatial Opportunities
This section outlines the Opportunities referred to under Policy SOM G1 and AQ 1. The spatial
opportunities for Aquaculture were identified based on information on constraints, current
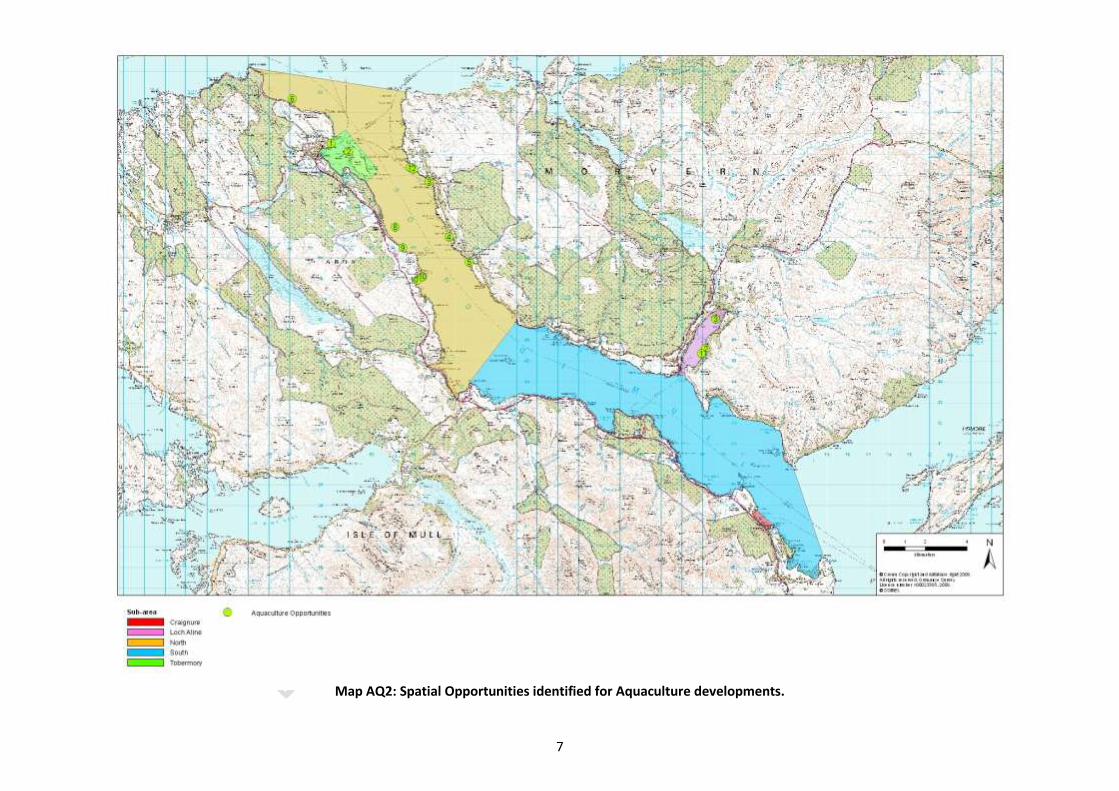
activities/interests and areas important for safeguarding for existing sectors and interests. An overview of
the location of these opportunities is given in Map AQ2 as points with a reference number linking it to the
attributes in the table below. However, the opportunities identified are indicative, and are intended to be
used as a guide for discussion between the developer and local planning authority, therefore do not
preclude development applications and activities elsewhere.
6
Map Reference
(Sub-area Map: Reference
No.)4
Description5
N Map 1:1 Shellfish farm (mussel/scallop) of medium scale aligned parallel and close to
coastline.
N Map 1:2 Oyster trestles preferably adjacent to wooded coastline and shore.
N Map 1:3 Oyster trestles in areas of more extensive tidal reach south of Drimnin pier.
N Map 1:4 Shellfish farm (mussel/scallop) of medium scale aligned parallel to a stretch
of regular coastline. Note whilst only one indicative location is marked for
simplicity, several areas between Bunvullin Bay and Caisteal nan Con may
be suitable.
N Map 1:5 Oyster trestles at Killudine Bay avoiding intrusion into key views.
N Map 1:6 Expansion of existing finfish farm (additional cages or increasing size of
existing cages) to large scale.
N Map 1:7 Potential to convert existing finfish lease to shellfish farm (mussel/scallop)
of medium scale as finfish lease is currently a firebreak between AMA
production areas.
N Map 1:8 Oyster trestles.
N Map 1:9 Scallop farm or oyster trestles in up to a third of the inlets and bays around
Rubha Gorm. Note whilst only one indicative location is marked for each
(scallop and oyster farm) for simplicity, other areas between Calve Island
and Rubh’ an t-Sean Chaisteal may be suitable.
T Map 2:1 Development of current oyster lease to achieve commercial production.
T Map 2:2 Development of current mussel/ scallop lease to achieve commercial
production. Medium scale development
LA Map 1:1 Shellfish farm (mussel/scallop lines) of small scale aligned to the eastern
coast, close to shore and using wooded backdrop where possible.
LA Map 1:2 Oyster trestles in intertidal area of eastern shore
LA Map 1:3 Oyster trestles in lower intertidal area of upper loch that minimise visual
impact on routes and views around Ardtornish Estate, using a single access
point to trestles where possible.
4 N = North, S= South, C = Craignure, T = Tobermory, LA = Loch Aline
5 Guidance on sighting of developments and scale was taken from the report by Grant (2009). For more detailed descriptions of scale see Appendix XX
7
Map AQ2: Spatial Opportunities identified for Aquaculture developments.
8
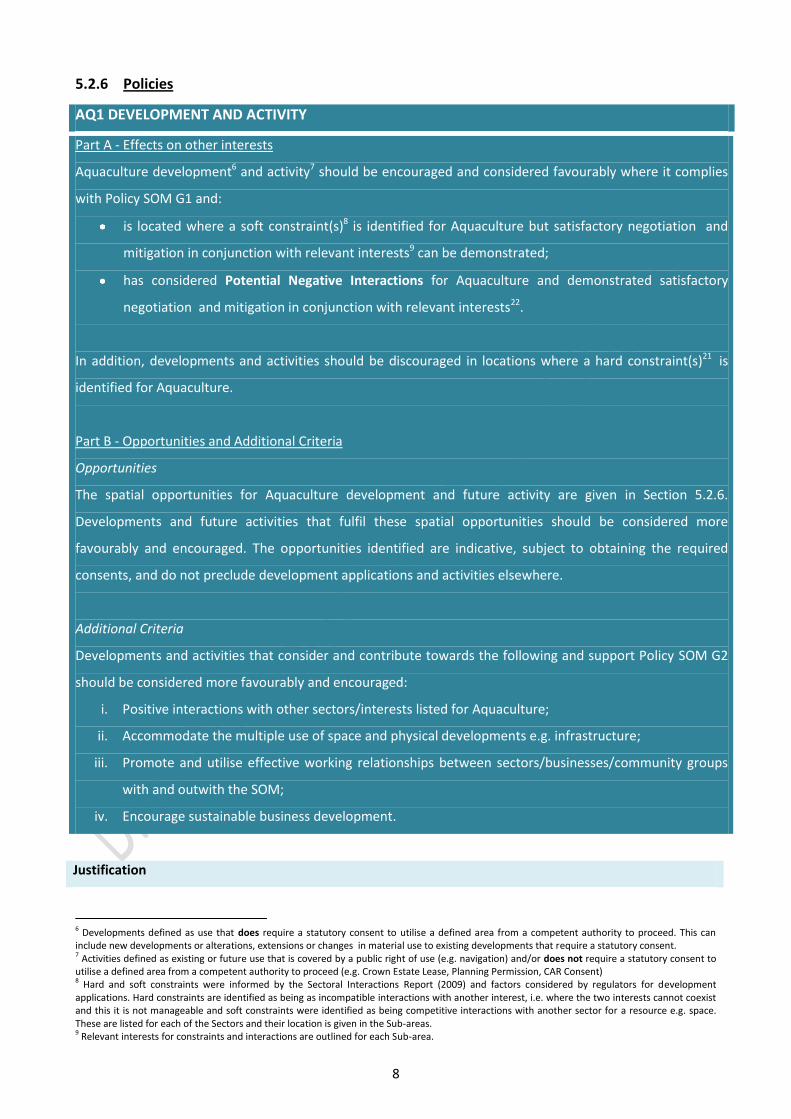
5.2.6 Policies
AQ1 DEVELOPMENT AND ACTIVITY
Part A - Effects on other interests
Aquaculture development6 and activity7 should be encouraged and considered favourably where it complies
with Policy SOM G1 and:
is located where a soft constraint(s)8 is identified for Aquaculture but satisfactory negotiation and
mitigation in conjunction with relevant interests9 can be demonstrated;
has considered Potential Negative Interactions for Aquaculture and demonstrated satisfactory
negotiation and mitigation in conjunction with relevant interests22.
In addition, developments and activities should be discouraged in locations where a hard constraint(s)21 is
identified for Aquaculture.
Part B - Opportunities and Additional Criteria
Opportunities
The spatial opportunities for Aquaculture development and future activity are given in Section 5.2.6.
Developments and future activities that fulfil these spatial opportunities should be considered more
favourably and encouraged. The opportunities identified are indicative, subject to obtaining the required
consents, and do not preclude development applications and activities elsewhere.
Additional Criteria
Developments and activities that consider and contribute towards the following and support Policy SOM G2
should be considered more favourably and encouraged:
i. Positive interactions with other sectors/interests listed for Aquaculture;
ii. Accommodate the multiple use of space and physical developments e.g. infrastructure;
iii. Promote and utilise effective working relationships between sectors/businesses/community groups
with and outwith the SOM;
iv. Encourage sustainable business development.
Justification
6 Developments defined as use that does require a statutory consent to utilise a defined area from a competent authority to proceed. This can include new developments or alterations, extensions or changes in material use to existing developments that require a statutory consent. 7 Activities defined as existing or future use that is covered by a public right of use (e.g. navigation) and/or does not require a statutory consent to utilise a defined area from a competent authority to proceed (e.g. Crown Estate Lease, Planning Permission, CAR Consent) 8 Hard and soft constraints were informed by the Sectoral Interactions Report (2009) and factors considered by regulators for development applications. Hard constraints are identified as being as incompatible interactions with another interest, i.e. where the two interests cannot coexist and this it is not manageable and soft constraints were identified as being competitive interactions with another sector for a resource e.g. space. These are listed for each of the Sectors and their location is given in the Sub-areas. 9 Relevant interests for constraints and interactions are outlined for each Sub-area.
9
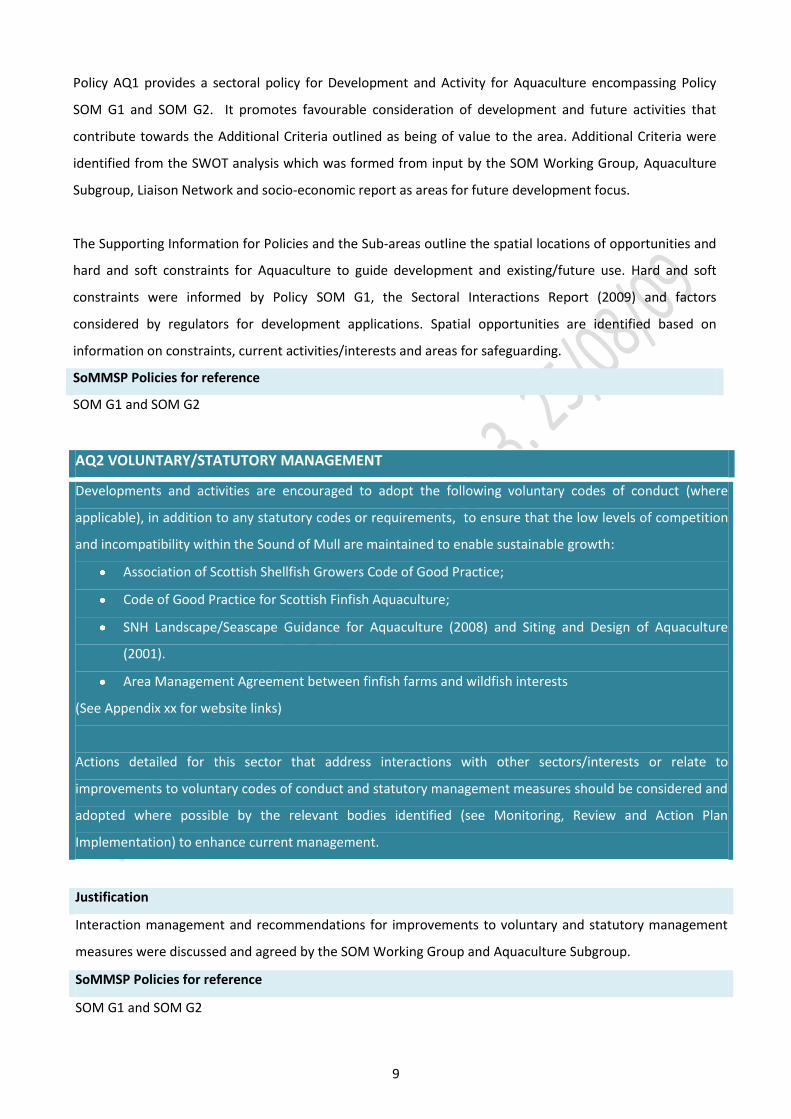
Policy AQ1 provides a sectoral policy for Development and Activity for Aquaculture encompassing Policy
SOM G1 and SOM G2. It promotes favourable consideration of development and future activities that
contribute towards the Additional Criteria outlined as being of value to the area. Additional Criteria were
identified from the SWOT analysis which was formed from input by the SOM Working Group, Aquaculture
Subgroup, Liaison Network and socio-economic report as areas for future development focus.
The Supporting Information for Policies and the Sub-areas outline the spatial locations of opportunities and
hard and soft constraints for Aquaculture to guide development and existing/future use. Hard and soft
constraints were informed by Policy SOM G1, the Sectoral Interactions Report (2009) and factors
considered by regulators for development applications. Spatial opportunities are identified based on
information on constraints, current activities/interests and areas for safeguarding.
SoMMSP Policies for reference
SOM G1 and SOM G2
AQ2 VOLUNTARY/STATUTORY MANAGEMENT
Developments and activities are encouraged to adopt the following voluntary codes of conduct (where
applicable), in addition to any statutory codes or requirements, to ensure that the low levels of competition
and incompatibility within the Sound of Mull are maintained to enable sustainable growth:
Association of Scottish Shellfish Growers Code of Good Practice;
Code of Good Practice for Scottish Finfish Aquaculture;
SNH Landscape/Seascape Guidance for Aquaculture (2008) and Siting and Design of Aquaculture
(2001).
Area Management Agreement between finfish farms and wildfish interests
(See Appendix xx for website links)
Actions detailed for this sector that address interactions with other sectors/interests or relate to
improvements to voluntary codes of conduct and statutory management measures should be considered and
adopted where possible by the relevant bodies identified (see Monitoring, Review and Action Plan
Implementation) to enhance current management.
Justification
Interaction management and recommendations for improvements to voluntary and statutory management
measures were discussed and agreed by the SOM Working Group and Aquaculture Subgroup.
SoMMSP Policies for reference
SOM G1 and SOM G2
10
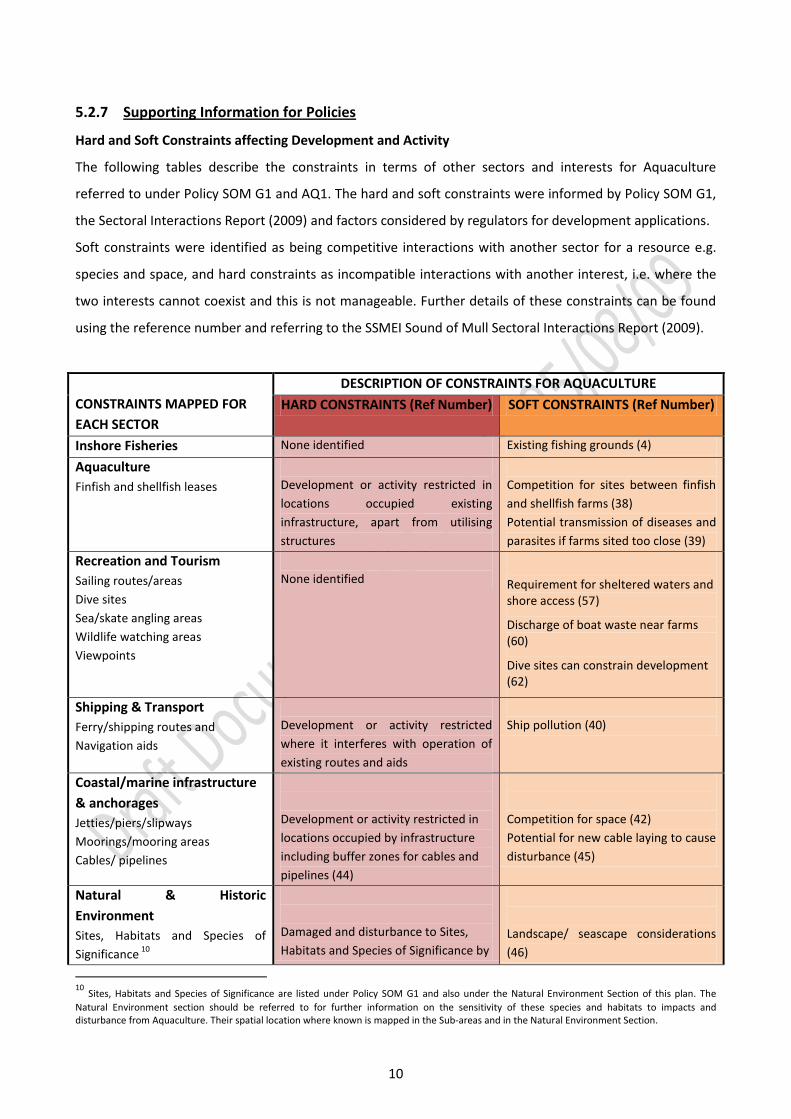
5.2.7 Supporting Information for Policies
Hard and Soft Constraints affecting Development and Activity
The following tables describe the constraints in terms of other sectors and interests for Aquaculture
referred to under Policy SOM G1 and AQ1. The hard and soft constraints were informed by Policy SOM G1,
the Sectoral Interactions Report (2009) and factors considered by regulators for development applications.
Soft constraints were identified as being competitive interactions with another sector for a resource e.g.
species and space, and hard constraints as incompatible interactions with another interest, i.e. where the
two interests cannot coexist and this is not manageable. Further details of these constraints can be found
using the reference number and referring to the SSMEI Sound of Mull Sectoral Interactions Report (2009).
CONSTRAINTS MAPPED FOR
EACH SECTOR
DESCRIPTION OF CONSTRAINTS FOR AQUACULTURE
HARD CONSTRAINTS (Ref Number) SOFT CONSTRAINTS (Ref Number)
Requirement for sheltered waters and shore access (57)
Discharge of boat waste near farms (60)
Dive sites can constrain development (62)
Shipping & Transport
Ferry/shipping routes and
Navigation aids
Development or activity restricted
where it interferes with operation of
existing routes and aids
Ship pollution (40)
Coastal/marine infrastructure
& anchorages
Jetties/piers/slipways
Moorings/mooring areas
Cables/ pipelines
Development or activity restricted in
locations occupied by infrastructure
including buffer zones for cables and
pipelines (44)
Competition for space (42)
Potential for new cable laying to cause
disturbance (45)
Natural & Historic
Environment
Sites, Habitats and Species of
Significance 10
Damaged and disturbance to Sites,
Habitats and Species of Significance by
Landscape/ seascape considerations
(46)
10
Sites, Habitats and Species of Significance are listed under Policy SOM G1 and also under the Natural Environment Section of this plan. The
Natural Environment section should be referred to for further information on the sensitivity of these species and habitats to impacts and disturbance from Aquaculture. Their spatial location where known is mapped in the Sub-areas and in the Natural Environment Section.
11
Coastal and marine historic sites
anchoring and chain scour from
moorings(84)
Designated wreck sites can be
disturbed by anchoring and chain
scour from moorings(84)
Benthic impacts (47)
Farm salmon affecting wild salmonids
(48)
Marine wildlife (49)
Introduction of non-native species
(50)
Presence of historical sites of
significance can constrain
development (52)
Water quality & waste
Effluent discharge points/ outfalls
None identified
Requirement for good water quality
(53)
Release of nutrients (54)
Marine Renewable Energy
None identified Competition for space (66)
Changes to current flow (67)
Positive and Potential Negative Interactions
The table outlines Positive and Potential Negative Interactions between Aquaculture and other sectors and
interests referred to under Policy SOM G1 and AQ1. Further details of these interactions can be found using
the reference number and the SSMEI Sound of Mull Sectoral Interactions Report (2009).
SECTOR Positive Interactions
Description (Ref Number)
Potential Negative Interactions
(Ref Number)
Inshore fisheries Creel fishing around edges of
farms (6)
Loss of resource (4)
Impacts on water quality, seabed
habitats and biodiversity (5)
Aquaculture Sharing of infrastructure e.g.
piers/jetties (43)
Biosecurity
Recreation & Tourism Farm tours (63)
Infrastructure sharing (43)
Collision with farm structures (58)
Removal of aquaculture bottom
equipment (59)
Use of farm structures to tie off (61)
Tourist views on development (64)
Shipping & Transport None identified Competition for space (41)