0.7 0.4 Seasonally adjusted 1.4 0.7 Trend Real net national disposable income –4.9 0.1 Seasonally adjusted Terms of trade 0.5 0.4 Original GDP chain price index –1.6 –0.1 Seasonally adjusted –1.4 –0.9 Trend Gross fixed capital formation (Chain volume measure) 1.5 0.5 Seasonally adjusted 1.7 0.5 Trend Final consumption expenditure (Chain volume measure) 2.6 0.6 Seasonally adjusted 2.5 0.5 Trend GDP (Chain volume measure) % change Jun qtr 12 to Jun qtr 13 % change Mar qtr 13 to Jun qtr 13 KEY FIGURES KEY AGGREGATES ! In trend terms, GDP increased 0.5% in the June 2013 quarter. Gross value added per hour worked in the market sector increased 0.5% and the Terms of trade rose 1.1%. ! In seasonally adjusted terms, GDP increased by 0.6% in the June quarter. The Terms of trade rose 0.1%, and Real gross domestic income rose 0.6%. EXPENDITURE ON GDP ! In seasonally adjusted terms, the contributors to expenditure on GDP were Final consumption expenditure (0.4 percentage points), Private gross fixed capital formation (1.4 percentage points) and Changes in inventories (0.2 percentage points). The main detractor was Public gross fixed capital formation (–1.4 percentage points). INDUSTRY GROSS VALUE ADDED ! In seasonally adjusted terms, the main contributors to GDP were Financial and insurance services (up 2.1%) and Construction (up 1.9%). Financial and insurance services contributed 0.2 percentage points to the increase in GDP while Construction contributed 0.1 percentage points. KEY POINTS E M B A R G O : 1 1 . 3 0 A M ( C A N B E R R A T I M E ) W E D 4 S E P 2 0 1 3 AUSTRALIAN NATIONAL ACCOUNTS: NATIONAL INCOME, EXPENDITURE AND PRODUCT 5206.0 JUNE QUARTER 2013 For further information about these and related statistics, contact the National Information and Referral Service on 1300 135 070 or National Accounts on Canberra (02) 6252 6711. GDP growth rates Volume measures, quarterly change Jun 2007 Jun 2009 Jun 2011 Jun 2013 % –1.5 –1.0 –0.5 0 0.5 1.0 1.5 2.0 Trend Seas. adj. Notes: Volume measures, contributions to quarterly growth. Contributions to GDP growth Seasonally adjusted GFCE HFCE GFCF–Priv GFCF–Pub Inventories Exports Imports GDP –2 –1 0 1 2 % points INQUIRIES www.abs.gov.au
Transcript
0.70.4Seasonally adjusted
1.40.7Trend
Real net national disposable income
–4.90.1Seasonally adjusted
Terms of trade
0.50.4Original
GDP chain price index
–1.6–0.1Seasonally adjusted
–1.4–0.9Trend
Gross fixed capital formation (Chain volume measure)
1.50.5Seasonally adjusted
1.70.5Trend
Final consumption expenditure (Chain volume measure)
2.60.6Seasonally adjusted
2.50.5Trend
GDP (Chain volume measure)
% changeJun qtr 12 to
Jun qtr 13
% changeMar qtr 13 to
Jun qtr 13
K E Y F I G U R E S
K E Y A G G R E G A T E S
! In trend terms, GDP increased 0.5% in the June 2013 quarter. Gross value added per
hour worked in the market sector increased 0.5% and the Terms of trade rose 1.1%.
! In seasonally adjusted terms, GDP increased by 0.6% in the June quarter. The Terms of
trade rose 0.1%, and Real gross domestic income rose 0.6%.
E X P E N D I T U R E O N G D P
! In seasonally adjusted terms, the contributors to expenditure on GDP were Final
consumption expenditure (0.4 percentage points), Private gross fixed capital formation
(1.4 percentage points) and Changes in inventories (0.2 percentage points). The main
detractor was Public gross fixed capital formation (–1.4 percentage points).
I N D U S T R Y G R O S S V A L U E A D D E D
! In seasonally adjusted terms, the main contributors to GDP were Financial and insurance
services (up 2.1%) and Construction (up 1.9%). Financial and insurance services
contributed 0.2 percentage points to the increase in GDP while Construction contributed
0.1 percentage points.
K E Y P O I N T S
E M B A R G O : 1 1 . 3 0 A M ( C A N B E R R A T I M E ) W E D 4 S E P 2 0 1 3
AUSTRALIAN NATIONALACCOUNTS: NATIONAL INCOME,EXPENDITURE AND PRODUCT
5206.0J U N E Q U A R T E R 2 0 1 3
For further informationabout these and relatedstatistics, contact theNational Information andReferral Service on1300 135 070 orNational Accounts onCanberra (02) 6252 6711.
RELEASE DATEISSUE (Quarter)FO R T H C O M I N G I S S U E S
Users should note that in the compilation of the quarterly Industry hours worked series
the National Accounts use June quarter Labour Force Survey data to be released on 19
September 2013 in Labour Force, Australia, Detailed, Quarterly, August 2013 (cat. no.
6291.0.55.003).
HO U R S WO R K E D
There are revisions in this issue due to the incorporation of more up–to–date data and
concurrent seasonal adjustment.
RE V I S I O N S IN TH I S I S S U E
wage price indexWPI
unit labour costsULC
System of National Accounts 2008 versionSNA08
real unit labour costsRULC
household final consumption expenditureHFCE
gross value of agricultural productionGVAP
gross value addedGVA
gross operating surplusGOS
gross national incomeGNI
gross national expenditureGNE
gross fixed capital formationGFCF
government final consumption expenditureGFCE
gross domestic productGDP
domestic final demandDFD
Australian and New Zealand Standard Industrial Classification, 2006
Edition
ANZSIC06
Australian Bureau of StatisticsABSAB B R E V I A T I O N S
B r i a n P i n k
Au s t r a l i a n S t a t i s t i c i a n
2 A B S • A U S T R A L I A N N A T I O N A L A C C O U N T S : N A T I O N A L I N C O M E , E X P E N D I T U R E A N D P R O D U C T • 5 2 0 6 . 0 • J U N 2 0 1 3
A B S • A U S T R A L I A N N A T I O N A L A C C O U N T S : N A T I O N A L I N C O M E , E X P E N D I T U R E A N D P R O D U C T • 5 2 0 6 . 0 • J U N 2 0 1 3 3
C O N T E N T S
F I N A L CO N S U M P T I O N EX P E N D I T U R E
! Household final consumption expenditure increased 0.4% in seasonally adjusted
terms. The main contributors to growth in Household final consumption
expenditure were Insurance and Other financial services (0.2 percentage points),
Rent and Other dwelling services, Purchase of vehicles and Food, each contributed
0.1 percentage points. The main detractor was Recreation and Culture (–0.2
percentage points). Government final consumption expenditure increased 0.8% in
seasonally adjusted terms.
GR O S S F I X E D CA P I T A L FO R M A T I O N
! Gross fixed capital formation fell 0.1% in seasonally adjusted terms. Private and
public gross fixed capital formation were influenced by a transfer of an asset from
Total public corporations gross fixed capital to private Total non dwelling
construction. This drove increases in Total non–dwelling construction (14.9%) and
Total private gross fixed capital formation (5.9%). This also drove offsetting
decreases in Total public corporations (–88.8%) and Total public gross fixed capital
formation (–28.7%). Underlying the effect of the asset sale for private capital were
decreases in New building (–1.6%), New engineering construction (–0.8%) and Total
machinery and equipment (–1.4%). This was offset by Ownership transfer costs
which increased 8.6%. For public capital the main underlying movement was Total
general government gross fixed capital formation down 3.7%.
CH A N G E S IN IN V E N T O R I E S
! Total inventories increased $98m in seasonally adjusted terms compared with an
decrease of –$726m last quarter. The Change in inventories added 0.2 percentage
points from GDP growth during the quarter.
Su m m a r y Co m m e n t sJU N E QU A R T E R
na not available— nil or rounded to zero (including null cells)
–0.3–1.81.60.1–2.7–0.7Imports of goods and services0.36.41.30.36.61.2Exports of goods and services0.60.50.6—0.2—Gross national expenditure0.2nana–0.2——Changes in inventories
–0.1–8.2–1.4–0.2–10.2–4.0Machinery and equipment1.316.514.90.610.96.3Non–dwelling construction0.113.38.6—9.14.1Ownership transfer costs—4.0–0.6—3.90.2Dwellings
PrivateGross fixed capital formation
0.21.80.40.32.00.5Households0.10.30.80.10.60.5General government
Final consumption expenditure
% points
contributions
to growth in
GDP Mar 13
to Jun 13
% change
Jun 12
to Jun 13
% change
Mar 13
to Jun 13
% points
contributions
to growth in
GDP Mar 13
to Jun 13
% change
Jun 12
to Jun 13
% change
Mar 13
to Jun 13
SEASONALLY ADJUSTEDTREND
4 A B S • A U S T R A L I A N N A T I O N A L A C C O U N T S : N A T I O N A L I N C O M E , E X P E N D I T U R E A N D P R O D U C T • 5 2 0 6 . 0 • J U N 2 0 1 3
M A I N F E A T U R E S E X P E N D I T U R E CH A I N V O L U M E ME A S U R E S
EX P O R T S AN D IM P O R T S OF GO O D S AN D SE R V I C E S
! Exports of goods and services increased 1.3% in seasonally adjusted terms.
Seasonally adjusted Exports of goods increased 1.5% and Exports of services
increased 0.1%. For Exports of goods, Rural exports increased 4.6% and Non–rural
exports increased 0.5%.
! Imports of goods and services increased 1.6% in seasonally adjusted terms.
Seasonally adjusted Imports of goods increased 2.7% and Imports of services
decreased 2.7%. For Imports of goods, Capital imports increased 8.8% and
Consumption goods decreased –2.1%.
A B S • A U S T R A L I A N N A T I O N A L A C C O U N T S : N A T I O N A L I N C O M E , E X P E N D I T U R E A N D P R O D U C T • 5 2 0 6 . 0 • J U N 2 0 1 3 5
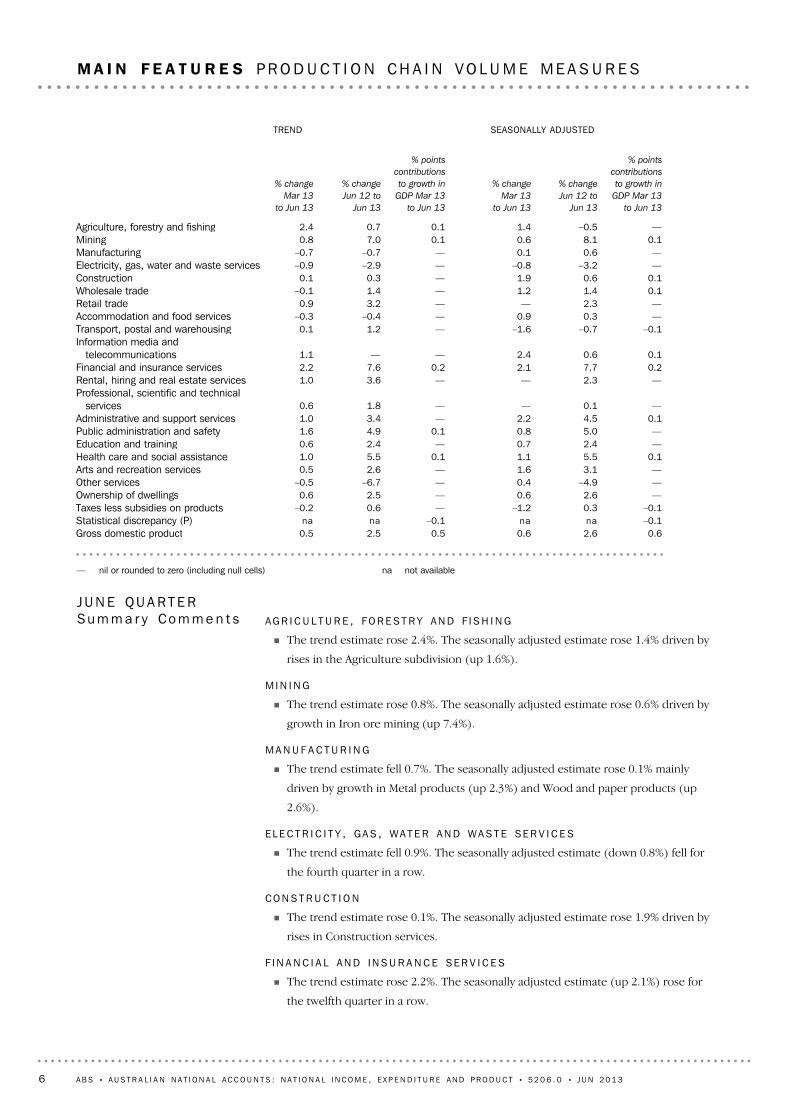
AG R I C U L T U R E , FO R E S T R Y AN D F I S H I N G
! The trend estimate rose 2.4%. The seasonally adjusted estimate rose 1.4% driven by
rises in the Agriculture subdivision (up 1.6%).
MI N I N G
! The trend estimate rose 0.8%. The seasonally adjusted estimate rose 0.6% driven by
growth in Iron ore mining (up 7.4%).
MA N U F A C T U R I N G
! The trend estimate fell 0.7%. The seasonally adjusted estimate rose 0.1% mainly
driven by growth in Metal products (up 2.3%) and Wood and paper products (up
2.6%).
EL E C T R I C I T Y , GA S , WA T E R AN D WA S T E SE R V I C E S
! The trend estimate fell 0.9%. The seasonally adjusted estimate (down 0.8%) fell for
the fourth quarter in a row.
CO N S T R U C T I O N
! The trend estimate rose 0.1%. The seasonally adjusted estimate rose 1.9% driven by
rises in Construction services.
F I N A N C I A L AN D IN S U R A N C E SE R V I C E S
! The trend estimate rose 2.2%. The seasonally adjusted estimate (up 2.1%) rose for
the twelfth quarter in a row.
Su m m a r y Co m m e n t sJU N E QU A R T E R
na not available— nil or rounded to zero (including null cells)
0.62.60.60.52.50.5Gross domestic product–0.1nana–0.1nanaStatistical discrepancy (P)–0.10.3–1.2—0.6–0.2Taxes less subsidies on products
—2.60.6—2.50.6Ownership of dwellings—–4.90.4—–6.7–0.5Other services—3.11.6—2.60.5Arts and recreation services
0.15.51.10.15.51.0Health care and social assistance—2.40.7—2.40.6Education and training—5.00.80.14.91.6Public administration and safety
0.14.52.2—3.41.0Administrative and support services—0.1——1.80.6
Professional, scientific and technicalservices
—2.3——3.61.0Rental, hiring and real estate services0.27.72.10.27.62.2Financial and insurance services0.10.62.4——1.1
Information media andtelecommunications
–0.1–0.7–1.6—1.20.1Transport, postal and warehousing—0.30.9—–0.4–0.3Accommodation and food services—2.3——3.20.9Retail trade
0.11.41.2—1.4–0.1Wholesale trade0.10.61.9—0.30.1Construction—–3.2–0.8—–2.9–0.9Electricity, gas, water and waste services—0.60.1—–0.7–0.7Manufacturing
0.18.10.60.17.00.8Mining—–0.51.40.10.72.4Agriculture, forestry and fishing
% points
contributions
to growth in
GDP Mar 13
to Jun 13
% change
Jun 12 to
Jun 13
% change
Mar 13
to Jun 13
% points
contributions
to growth in
GDP Mar 13
to Jun 13
% change
Jun 12 to
Jun 13
% change
Mar 13
to Jun 13
SEASONALLY ADJUSTEDTREND
6 A B S • A U S T R A L I A N N A T I O N A L A C C O U N T S : N A T I O N A L I N C O M E , E X P E N D I T U R E A N D P R O D U C T • 5 2 0 6 . 0 • J U N 2 0 1 3
M A I N F E A T U R E S PR O D U C T I O N CH A I N VO L U M E ME A S U R E S
(a) GOS of non–financial and financial corporations.
Jun1999
Jun2001
Jun2003
Jun2005
Jun2007
Jun2009
Jun2011
Jun2013
%
24
26
28
30
32
PROFIT (a) SHARE OF TOTAL FACTOR INCOME: Trend
GR O S S OP E R A T I N G SU R P L U S (G O S )
! Trend GOS for Total corporations increased 1.5%. In seasonally adjusted terms, GOS
for total corporations rose 0.5%. Financial corporations recorded the largest increase
at 2.9%, Private non–financial corporations recorded a flat movement. Trend GOS
for Total corporations represented 27.0% of Total factor income.
Jun1999
Jun2001
Jun2003
Jun2005
Jun2007
Jun2009
Jun2011
Jun2013
%
52
53
54
55
56
COE SHARE OF TOTAL FACTOR INCOME: Trend
CO M P E N S A T I O N OF EM P L O Y E E S (C O E )
! Trend total COE rose 0.7%, reflecting a rise of 0.4% in average earnings per
employee. Seasonally adjusted, COE increased 1.0%, reflecting a movement in
average earnings per employee of 0.5%. Trend, COE represented 53.9% of Total
factor income.
Su m m a r y Co m m e n t sJU N E QU A R T E R
na not available— nil or rounded to zero (including null cells)
0.37.62.80.27.01.6Taxes less subsidies on production and imports—3.6–0.40.15.41.4Gross mixed income
0.26.11.60.36.11.7Other—0.7—0.20.61.2Private
Gross operating surplus0.52.61.00.32.70.7Compensation of employees
% points
contributions
to growth in
GDP Mar 13
to Jun 13
% change
Jun 12 to
Jun 13
% change
Mar 13
to Jun 13
% points
contributions
to growth in
GDP Mar 13
to Jun 13
% change
Jun 12 to
Jun 13
% change
Mar 13
to Jun 13
SEASONALLY ADJUSTEDTREND
A B S • A U S T R A L I A N N A T I O N A L A C C O U N T S : N A T I O N A L I N C O M E , E X P E N D I T U R E A N D P R O D U C T • 5 2 0 6 . 0 • J U N 2 0 1 3 7
M A I N F E A T U R E S I N C O M E A T CU R R E N T PR I C E S
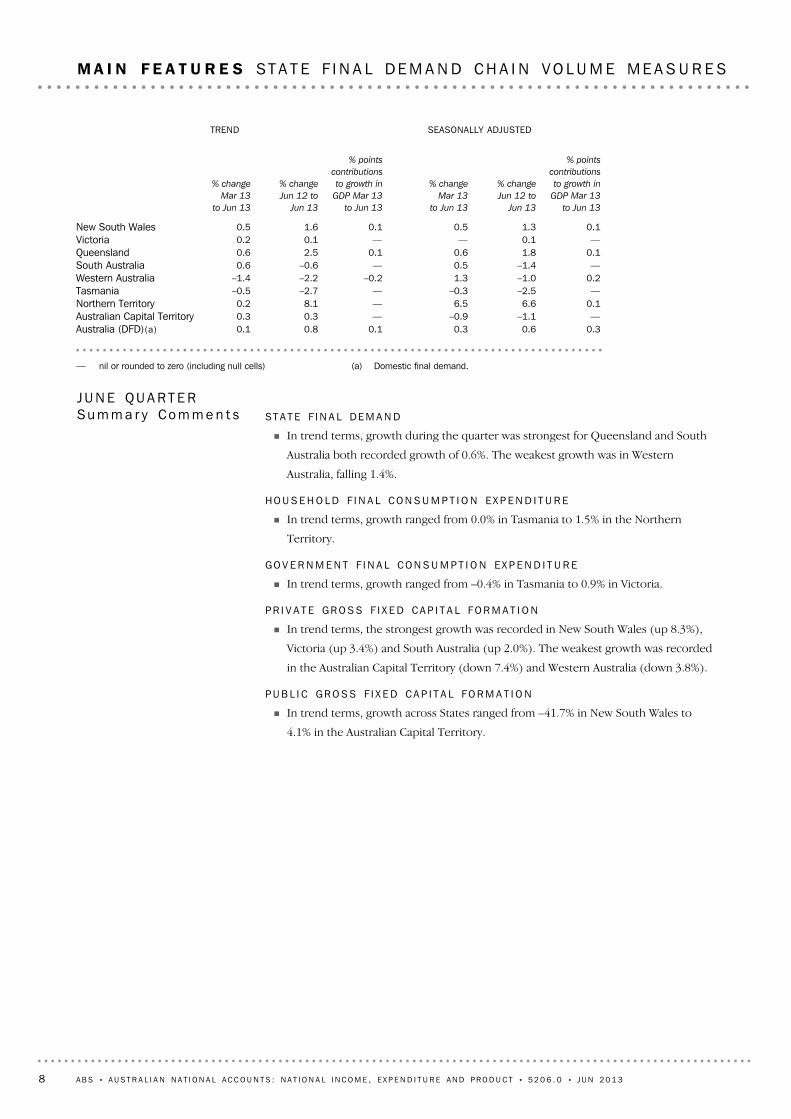
ST A T E F I N A L DE M A N D
! In trend terms, growth during the quarter was strongest for Queensland and South
Australia both recorded growth of 0.6%. The weakest growth was in Western
Australia, falling 1.4%.
HO U S E H O L D F I N A L CO N S U M P T I O N EX P E N D I T U R E
! In trend terms, growth ranged from 0.0% in Tasmania to 1.5% in the Northern
Territory.
GO V E R N M E N T F I N A L CO N S U M P T I O N EX P E N D I T U R E
! In trend terms, growth ranged from –0.4% in Tasmania to 0.9% in Victoria.
PR I V A T E GR O S S F I X E D CA P I T A L FO R M A T I O N
! In trend terms, the strongest growth was recorded in New South Wales (up 8.3%),
Victoria (up 3.4%) and South Australia (up 2.0%). The weakest growth was recorded
in the Australian Capital Territory (down 7.4%) and Western Australia (down 3.8%).
PU B L I C GR O S S F I X E D CA P I T A L FO R M A T I O N
! In trend terms, growth across States ranged from –41.7% in New South Wales to
4.1% in the Australian Capital Territory.
Su m m a r y Co m m e n t sJU N E QU A R T E R
(a) Domestic final demand.— nil or rounded to zero (including null cells)
0.30.60.30.10.80.1Australia (DFD)(a)—–1.1–0.9—0.30.3Australian Capital Territory
0.2–1.01.3–0.2–2.2–1.4Western Australia—–1.40.5—–0.60.6South Australia
0.11.80.60.12.50.6Queensland—0.1——0.10.2Victoria
0.11.30.50.11.60.5New South Wales
% points
contributions
to growth in
GDP Mar 13
to Jun 13
% change
Jun 12 to
Jun 13
% change
Mar 13
to Jun 13
% points
contributions
to growth in
GDP Mar 13
to Jun 13
% change
Jun 12 to
Jun 13
% change
Mar 13
to Jun 13
SEASONALLY ADJUSTEDTREND
8 A B S • A U S T R A L I A N N A T I O N A L A C C O U N T S : N A T I O N A L I N C O M E , E X P E N D I T U R E A N D P R O D U C T • 5 2 0 6 . 0 • J U N 2 0 1 3
M A I N F E A T U R E S S T A T E F I N A L DE M A N D CH A I N VO L U M E ME A S U R E S
The real purchasing power of income generated by domestic production is affected by
changes in import and export prices. Real gross domestic income adjusts the chain
volume measure of GDP for the Terms of trade effect. The graph below provides a
comparison of quarterly movements in trend GDP (volume measure) and Real gross
RE A L GR O S S DO M E S T I C
IN C O M E
From the June quarter 2012 to June quarter 2013 the Mining (0.7 percentage points),
Financial and insurance services (0.7 percentage points) and Health care and social
assistance (0.3 percentage points) industries were the largest contributors to total trend
growth of 2.5%. Manufacturing and Electricity, gas, water and waste services both
detracted 0.1 percentage points in trend terms.
Mining
Manufacturing
Electricity gas etc
Financial etc
Public admin etc
Health care etc
–0.2 0 0.2 0.4 0.6 0.8%points
SELECTED INDUSTRIES CONTRIBUT ION TO GROWTH, Jun 12 to Jun13 : Trend
On the expenditure side, the increase this quarter (in seasonally adjusted volume terms)
was driven by Private gross fixed capital formation (adding 1.4 percentage points) and
Final consumption expenditure (adding 0.4 percentage points). These increases were
partially offset by the decrease in Public gross fixed capital formation (detracting –1.4
percentage points)
Jun1999
Jun2001
Jun2003
Jun2005
Jun2007
Jun2009
Jun2011
Jun2013
%
–1.0
–0.5
0
0.5
1.0
1.5
2.0TrendSeas. adj.
GDP, Percen tage changes —Volume measures
In seasonally adjusted terms, GDP increased 0.6% in the June quarter, through the year
GDP growth was 2.6%.
GR O W T H RA T E S IN GD P
A B S • A U S T R A L I A N N A T I O N A L A C C O U N T S : N A T I O N A L I N C O M E , E X P E N D I T U R E A N D P R O D U C T • 5 2 0 6 . 0 • J U N 2 0 1 3 9
A N A L Y S I S A N D C O M M E N T S
A broader measure of change in national economic well–being is Real net national
disposable income. This measure adjusts the volume measure of GDP for the Terms of
trade effect, Real net incomes from overseas and Consumption of fixed capital (see
Glossary for definitions). The graph below provides a comparison of quarterly
movements in trend GDP (volume measure) and Real net national disposable income.
During the June quarter, seasonally adjusted Real net national disposable income
increased 0.4%. Growth over the past 4 quarters was 0.7% compared with 2.6% for GDP.
RE A L NE T NA T I O N A L
D I S P O S A B L E IN C O M E
Jun1999
Jun2001
Jun2003
Jun2005
Jun2007
Jun2009
Jun2011
Jun2013
index
40
60
80
100
120
TERMS OF TRADE, Trend —(2010—11 = 100.0)
The Terms of trade represent the relationship between the prices of exports and
imports. An increase (decrease) in the Terms of trade reflects export prices increasing
(decreasing) at a faster rate than import prices. The Terms of trade rose only 0.1% in
seasonally adjusted terms in the June quarter following a 3.1% increase in the March
quarter. From the June quarter 2012 to the June quarter 2013 the Terms of trade has
fallen 4.9%
TE R M S OF TR A D E
Jun1999
Jun2001
Jun2003
Jun2005
Jun2007
Jun2009
Jun2011
Jun2013
%
–2
–1
0
1
2
3GDP (chain volume measure)Real Gross Domestic Income
PERCENTAGE CHANGES: Trend
domestic income. In seasonally adjusted terms, during the June quarter, real gross
domestic income rose by 0.6%, the same increase as the volume measure of GDP. This
was due to the terms of trade increasing only marginally at 0.1% in seasonally adjusted
terms.
RE A L GR O S S DO M E S T I C
IN C O M E continued
10 A B S • A U S T R A L I A N N A T I O N A L A C C O U N T S : N A T I O N A L I N C O M E , E X P E N D I T U R E A N D P R O D U C T • 5 2 0 6 . 0 • J U N 2 0 1 3
A N A L Y S I S A N D C O M M E N T S continued
The Household saving ratio was 10.8% in seasonally adjusted terms in the June quarter
2013. The trend estimate for The Household saving ratio was 10.7% in the June quarter
2013.
Household saving is not measured directly. It is calculated as a residual item by
deducting Household final consumption expenditure from Household net disposable
income. As the difference between the two aggregates is relatively small, caution should
be exercised in interpreting the Household saving ratio in recent years, because major
components of household income and expenditure may be subject to significant
revisions. The impact of these revisions on the saving ratio can cause changes in the
direction of the trend. For more information on the Household saving ratio, see Spotlight
on National Accounts, 2007–Household Saving Ratio (cat. no. 5202.0).
HO U S E H O L D SA V I N G
RA T I O
Jun1999
Jun2001
Jun2003
Jun2005
Jun2007
Jun2009
Jun2011
Jun2013
%
–2
–1
0
1
2
3TrendSeas. adj.
NET EXPORTS CONTRIBUT ION TO GROWTH, Volume measures
Net exports represents the difference between exports and imports of goods and
services. Net exports detract from GDP growth when the change in the volume of
imports is greater than the change in the volume of exports. In seasonally adjusted
terms, Net exports did not contribute to GDP growth in the June quarter 2013 while it
contributed 0.9 percentage points in the March quarter 2013. In the June quarter 2013
Exports of goods and services increased 1.3% and Imports of goods and services rose
1.6%.
NE T EX P O R T S
CO N T R I B U T I O N TO
GR O W T H
Jun1999
Jun2001
Jun2003
Jun2005
Jun2007
Jun2009
Jun2011
Jun2013
%
–2
–1
0
1
2
3GDP (chain volume measure)Real net national disposable income
PERCENTANGE CHANGES: TrendRE A L NE T NA T I O N A L
D I S P O S A B L E IN C O M E
continued
A B S • A U S T R A L I A N N A T I O N A L A C C O U N T S : N A T I O N A L I N C O M E , E X P E N D I T U R E A N D P R O D U C T • 5 2 0 6 . 0 • J U N 2 0 1 3 11
A N A L Y S I S A N D C O M M E N T S continued
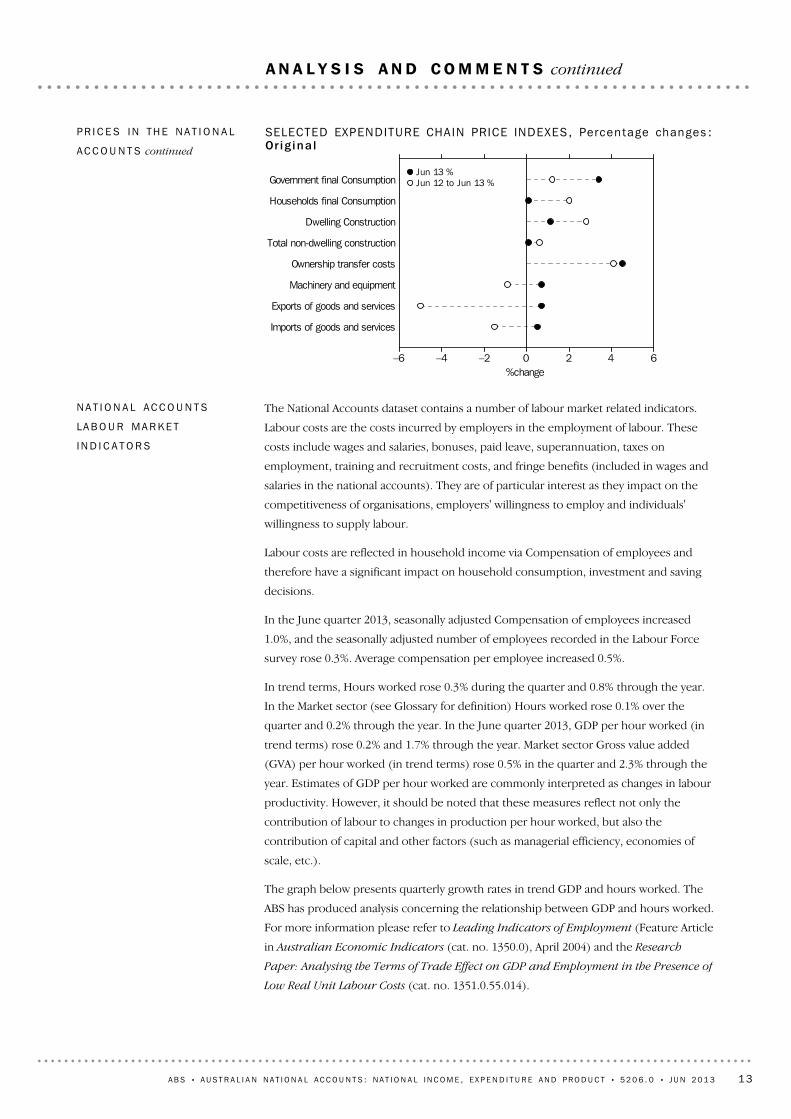
The GDP Chain price index increased 0.4% in the June quarter.
The Chain price index for Household final consumption expenditure (HFCE) was 0.1% in
the June quarter 2013, compared with 0.4% for the Consumer Price Index (CPI) over the
same period. The HFCE Chain price index is the National Accounts measure most
directly comparable to the CPI. However, it should be noted that the conceptual bases
for these two price measures are different. The most important differences are
! the frequency with which each index is re–weighted,
! the range of lower level indexes contributing to each index, and
! the concepts and treatment of household expenditure, particularly in respect of
home ownership costs.
The Chain price index for Private gross fixed capital formation increased 0.6% in the June
quarter. This increase was driven by an increase in the Chain price index for Ownership
transfer costs (4.5%) and Total dwellings (1.1%).
The Domestic final demand Chain price index, encompassing changes in both
consumption and investment prices, increased 0.4% this quarter and 1.5% through the
year.
The Export Chain price index increased 0.7% during the quarter, but decreased 5.0%
through the year. The Import Chain price index increased 0.5% in the June quarter, but
decreased 1.5% through the year.
PR I C E S IN TH E NA T I O N A L
AC C O U N T S
Jun1999
Jun2001
Jun2003
Jun2005
Jun2007
Jun2009
Jun2011
Jun2013
%
–4
0
4
8
12
TrendSeas. adj.
HOUSEHOLD SAVING RAT IO , Cur ren t pr icesHO U S E H O L D SA V I N G
RA T I O continued
12 A B S • A U S T R A L I A N N A T I O N A L A C C O U N T S : N A T I O N A L I N C O M E , E X P E N D I T U R E A N D P R O D U C T • 5 2 0 6 . 0 • J U N 2 0 1 3
A N A L Y S I S A N D C O M M E N T S continued
The National Accounts dataset contains a number of labour market related indicators.
Labour costs are the costs incurred by employers in the employment of labour. These
costs include wages and salaries, bonuses, paid leave, superannuation, taxes on
employment, training and recruitment costs, and fringe benefits (included in wages and
salaries in the national accounts). They are of particular interest as they impact on the
competitiveness of organisations, employers' willingness to employ and individuals'
willingness to supply labour.
Labour costs are reflected in household income via Compensation of employees and
therefore have a significant impact on household consumption, investment and saving
decisions.
In the June quarter 2013, seasonally adjusted Compensation of employees increased
1.0%, and the seasonally adjusted number of employees recorded in the Labour Force
survey rose 0.3%. Average compensation per employee increased 0.5%.
In trend terms, Hours worked rose 0.3% during the quarter and 0.8% through the year.
In the Market sector (see Glossary for definition) Hours worked rose 0.1% over the
quarter and 0.2% through the year. In the June quarter 2013, GDP per hour worked (in
trend terms) rose 0.2% and 1.7% through the year. Market sector Gross value added
(GVA) per hour worked (in trend terms) rose 0.5% in the quarter and 2.3% through the
year. Estimates of GDP per hour worked are commonly interpreted as changes in labour
productivity. However, it should be noted that these measures reflect not only the
contribution of labour to changes in production per hour worked, but also the
contribution of capital and other factors (such as managerial efficiency, economies of
scale, etc.).
The graph below presents quarterly growth rates in trend GDP and hours worked. The
ABS has produced analysis concerning the relationship between GDP and hours worked.
For more information please refer to Leading Indicators of Employment (Feature Article
in Australian Economic Indicators (cat. no. 1350.0), April 2004) and the Research
Paper: Analysing the Terms of Trade Effect on GDP and Employment in the Presence of
Low Real Unit Labour Costs (cat. no. 1351.0.55.014).
NA T I O N A L AC C O U N T S
LA B O U R MA R K E T
IN D I C A T O R S
Government final Consumption
Households final Consumption
Dwelling Construction
Total non-dwelling construction
Ownership transfer costs
Machinery and equipment
Exports of goods and services
Imports of goods and services
–6 –4 –2 0 2 4 6%change
Jun 13 %Jun 12 to Jun 13 %
SELECTED EXPENDITURE CHAIN PRICE INDEXES, Percentage changes :Or ig i na l
PR I C E S IN TH E NA T I O N A L
AC C O U N T S continued
A B S • A U S T R A L I A N N A T I O N A L A C C O U N T S : N A T I O N A L I N C O M E , E X P E N D I T U R E A N D P R O D U C T • 5 2 0 6 . 0 • J U N 2 0 1 3 13
A N A L Y S I S A N D C O M M E N T S continued
Changes in inventories can have a significant impact on growth in quarterly GDP. A
positive changes in inventories can be seen as production increasing at a faster rate than
consumption but the exact reasons underlying changes in inventories can be far more
complex. For example, firms may run up or run down inventories in anticipation of
future sales, supply constraints could affect inventories, or firms may under or over
estimate sales in a particular period.
The graph below shows GDP growth and the Changes in inventories contribution to
GDP growth, both in trend terms. Even in trend terms the Changes in inventories
contribution to GDP growth is quite volatile.
CH A N G E S IN
IN V E N T O R I E S
Jun1999
Jun2001
Jun2003
Jun2005
Jun2007
Jun2009
Jun2011
Jun2013
index
97.5
100.0
102.5
105.0
107.5
110.0
112.5Real unit labour costsReal unit labour costs – non–farm
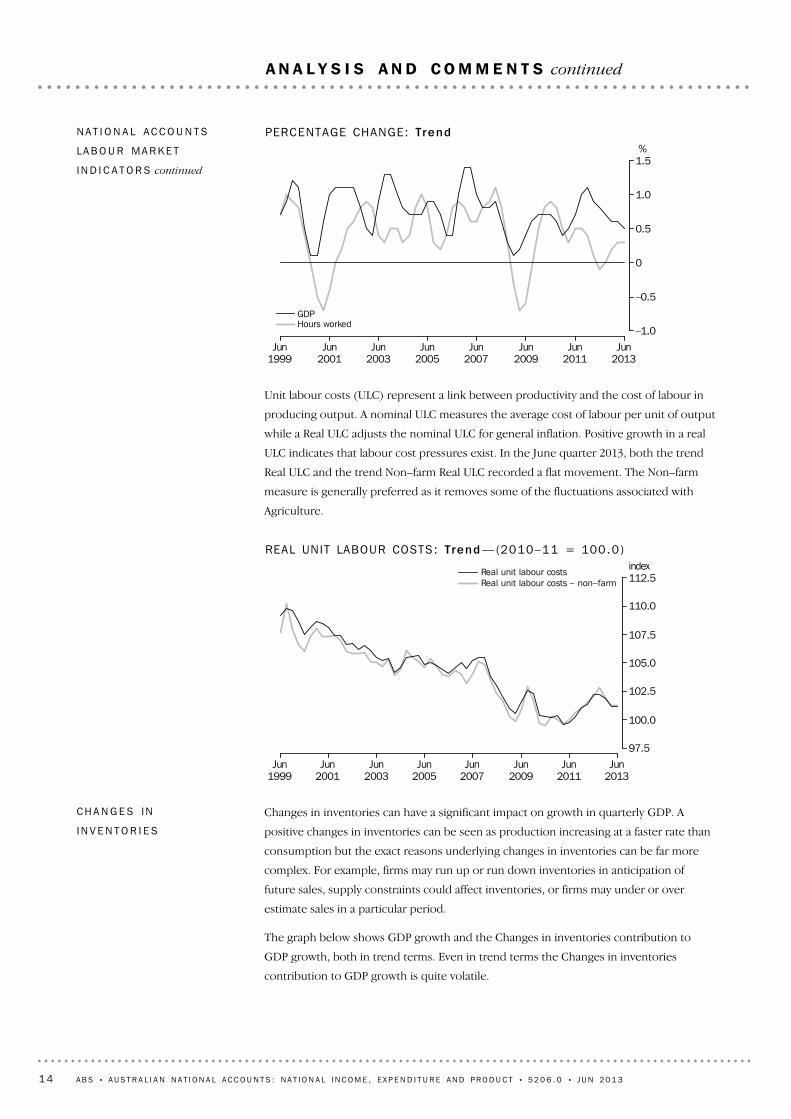
REAL UNIT LABOUR COSTS: Trend —(2010–11 = 100.0)
Unit labour costs (ULC) represent a link between productivity and the cost of labour in
producing output. A nominal ULC measures the average cost of labour per unit of output
while a Real ULC adjusts the nominal ULC for general inflation. Positive growth in a real
ULC indicates that labour cost pressures exist. In the June quarter 2013, both the trend
Real ULC and the trend Non–farm Real ULC recorded a flat movement. The Non–farm
measure is generally preferred as it removes some of the fluctuations associated with
Agriculture.
Jun1999
Jun2001
Jun2003
Jun2005
Jun2007
Jun2009
Jun2011
Jun2013
%
–1.0
–0.5
0
0.5
1.0
1.5
GDPHours worked
PERCENTAGE CHANGE: TrendNA T I O N A L AC C O U N T S
LA B O U R MA R K E T
IN D I C A T O R S continued
14 A B S • A U S T R A L I A N N A T I O N A L A C C O U N T S : N A T I O N A L I N C O M E , E X P E N D I T U R E A N D P R O D U C T • 5 2 0 6 . 0 • J U N 2 0 1 3
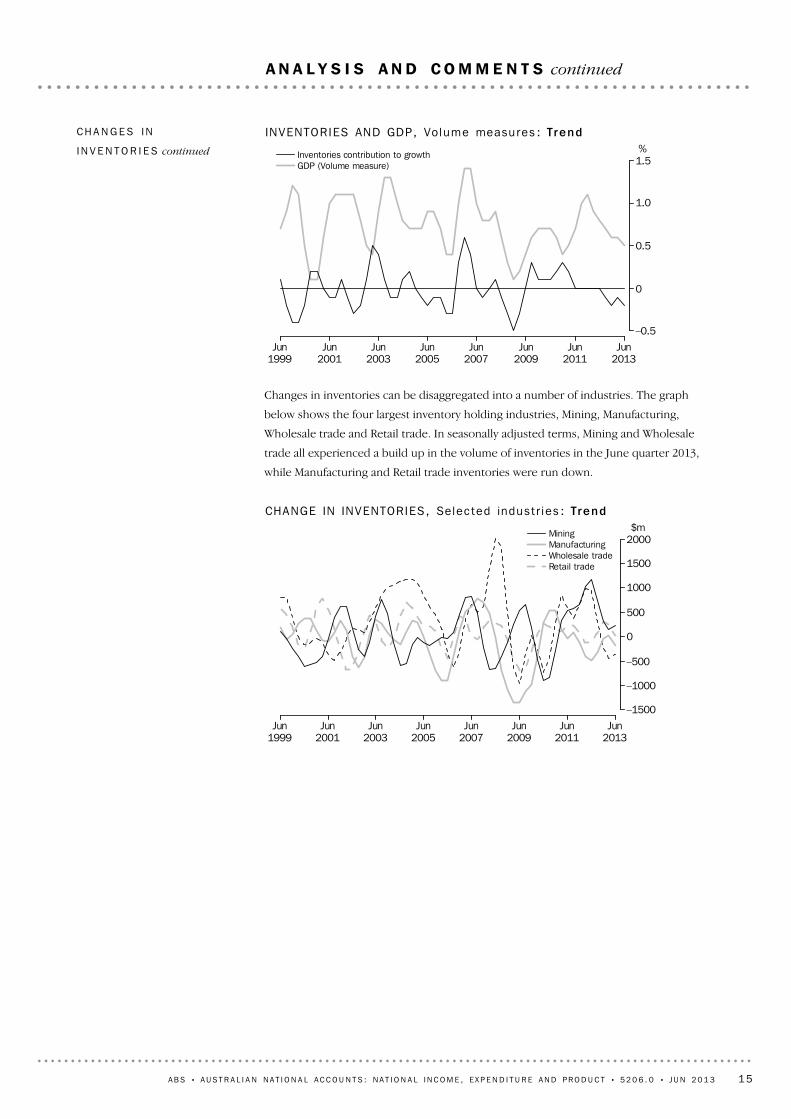
CHANGE IN INVENTORIES, Selec ted indus t r ies : Trend
Changes in inventories can be disaggregated into a number of industries. The graph
below shows the four largest inventory holding industries, Mining, Manufacturing,
Wholesale trade and Retail trade. In seasonally adjusted terms, Mining and Wholesale
trade all experienced a build up in the volume of inventories in the June quarter 2013,
while Manufacturing and Retail trade inventories were run down.
Jun1999
Jun2001
Jun2003
Jun2005
Jun2007
Jun2009
Jun2011
Jun2013
%
–0.5
0
0.5
1.0
1.5Inventories contribution to growthGDP (Volume measure)
INVENTORIES AND GDP, Volume measures : TrendCH A N G E S IN
IN V E N T O R I E S continued
A B S • A U S T R A L I A N N A T I O N A L A C C O U N T S : N A T I O N A L I N C O M E , E X P E N D I T U R E A N D P R O D U C T • 5 2 0 6 . 0 • J U N 2 0 1 3 15
TREND ESTIMATES IFSEASONALLY ADJUSTED GDPCHANGES BY THE FOLLOWINGAMOUNTS IN JUNE QTR 2013
Trend
GDP as
published
in table 1
Seasonally
adjusted
GDP as
published
in table 2
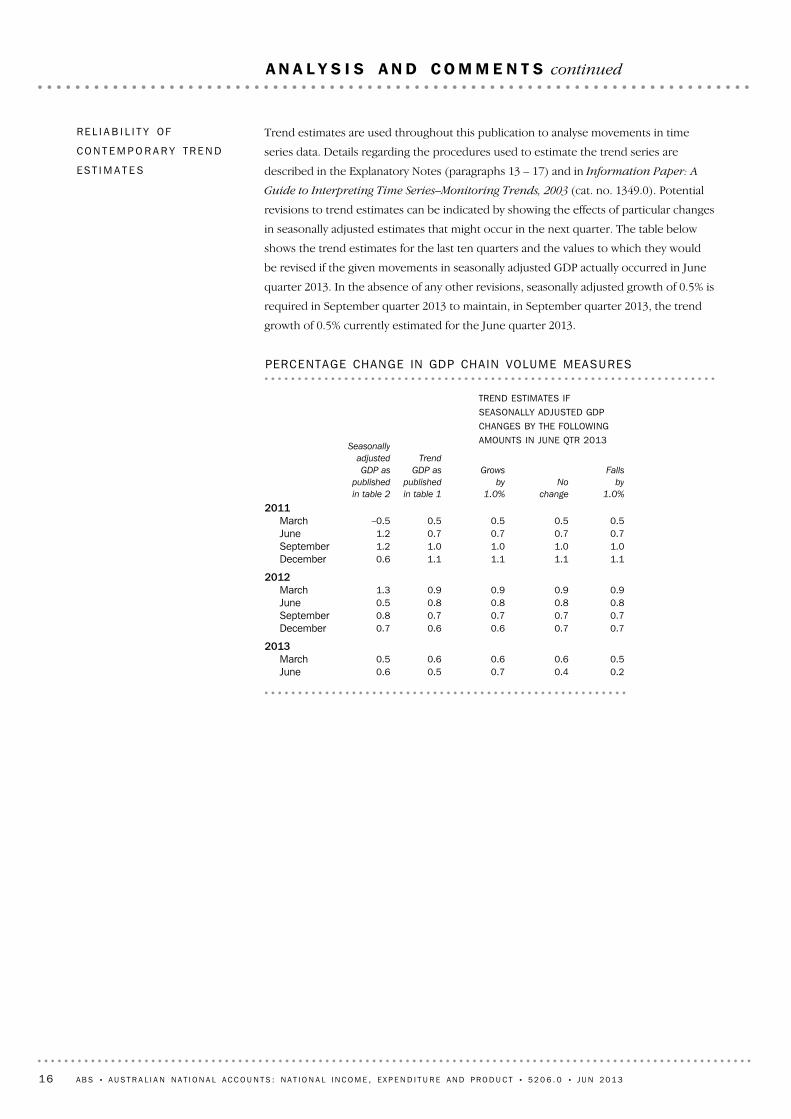
PERCENTAGE CHANGE IN GDP CHAIN VOLUME MEASURES
Trend estimates are used throughout this publication to analyse movements in time
series data. Details regarding the procedures used to estimate the trend series are
described in the Explanatory Notes (paragraphs 13 – 17) and in Information Paper: A
Guide to Interpreting Time Series–Monitoring Trends, 2003 (cat. no. 1349.0). Potential
revisions to trend estimates can be indicated by showing the effects of particular changes
in seasonally adjusted estimates that might occur in the next quarter. The table below
shows the trend estimates for the last ten quarters and the values to which they would
be revised if the given movements in seasonally adjusted GDP actually occurred in June
quarter 2013. In the absence of any other revisions, seasonally adjusted growth of 0.5% is
required in September quarter 2013 to maintain, in September quarter 2013, the trend
growth of 0.5% currently estimated for the June quarter 2013.
RE L I A B I L I T Y OF
CO N T E M P O R A R Y TR E N D
ES T I M A T E S
16 A B S • A U S T R A L I A N N A T I O N A L A C C O U N T S : N A T I O N A L I N C O M E , E X P E N D I T U R E A N D P R O D U C T • 5 2 0 6 . 0 • J U N 2 0 1 3
A N A L Y S I S A N D C O M M E N T S continued
The Information paper The Non–Observed Economy and Australia's GDP will be
released on Thursday 12 September 2013. This paper presents the results of recent
research undertaken to review ABS procedures and treatment of transactions in the
Non–Observed Economy in the estimation of Gross Domestic product. These
transactions escape measurement by traditional methods and have implications for the
quality of the national accounts and other business statistics.
I N F O R M A T I O N PA P E R :
TH E NO N – O B S E R V E D
EC O N O M Y AN D
AU S T R A L I A ' S GD P (C A T .
NO . 52 0 4 . 0 . 5 5 . 0 0 8 )
The 2008–09 issue of Australian National Accounts: Input–Output Tables was released
on 10 September 2012. This product presents information on supply and use by detailed
product item based on the 2005–06 Input–Output Product Classification (IOPC). It
shows Australian production, imports, intermediate usage, final usage, exports, margins
and taxes less subsidies on products in 2008–09. These tables are released as Microsoft
Excel workbooks.
AU S T R A L I A N NA T I O N A L
AC C O U N T S :
IN P U T – O U T P U T TA B L E S –
EL E C T R O N I C PU B L I C A T I O N
(C A T . NO .
52 1 5 . 0 . 5 5 . 0 0 1 )
The June quarter 2013 issue of Australian National Accounts: Financial Accounts will
be released on 26 September 2013. It provides quarterly estimates of the financial flows
between sectors of the domestic economy and with the rest of the world. In addition,
the publication provides estimates of the financial assets and liabilities owned by each
sector and various sub–sectors at the end of each quarter. Other key estimates within the
publication include the demand for credit by non–financial domestic institutional sectors
during the quarter, and their corresponding levels of credit outstanding.
AU S T R A L I A N NA T I O N A L
AC C O U N T S : F I N A N C I A L
AC C O U N T S (C A T . NO .
52 3 2 . 0 )
The 2011–12 issue of the Australian National Accounts: State Accounts was released on
21 November 2012. It provides detailed, annual estimates of Gross state product (GSP)
for all states and territories. These are estimated using the expenditure, income and
production approaches. Also published are estimates of household and agricultural
incomes. Many, but not all, estimates are available as chain volume measures as well as in
current prices.
AU S T R A L I A N NA T I O N A L
AC C O U N T S : ST A T E
AC C O U N T S (C A T . NO .
52 2 0 . 0 )
The 2011–12 issue of the Australian System of National Accounts was released on 2
November 2012. It provides detailed, annual estimates of Australia's National Accounts.
These include expenditure, income and production estimates of Gross domestic product
(GDP), productivity estimates, sectoral accounts (for households, financial and
non–financial corporations, general government and the rest of the world), and
additional aggregates dissected by industry. Many, but not all, estimates are available as
chain volume measures as well as in current prices.
AU S T R A L I A N SY S T E M OF
NA T I O N A L AC C O U N T S
(C A T . NO . 52 0 4 . 0 )
RE C E N T AN D UP C O M I N G RE L E A S E S
A B S • A U S T R A L I A N N A T I O N A L A C C O U N T S : N A T I O N A L I N C O M E , E X P E N D I T U R E A N D P R O D U C T • 5 2 0 6 . 0 • J U N 2 0 1 3 17
R E C E N T A N D U P C O M I N G R E L E A S E S
42Agricultural income, Current prices: Trend and seasonally adjusted23 . . . . . .41
Changes in inventories, Chain volume measures: Trend and seasonally
KE Y NA T I O N A L AC C O U N T S AG G R E G A T E S
page
18 A B S • A U S T R A L I A N N A T I O N A L A C C O U N T S : N A T I O N A L I N C O M E , E X P E N D I T U R E A N D P R O D U C T • 5 2 0 6 . 0 • J U N 2 0 1 3
L I S T O F T A B L E S
67
Industry gross value added, Chain volume measures, Revisions to
percentage changes: Seasonally adjusted
48. . . . . . . . . . . . . . . . . . . . . . .
66
Gross domestic product account, Current prices, Revisions: Seasonally
A B S • A U S T R A L I A N N A T I O N A L A C C O U N T S : N A T I O N A L I N C O M E , E X P E N D I T U R E A N D P R O D U C T • 5 2 0 6 . 0 • J U N 2 0 1 3 19
L I S T O F T A B L E S continued
(c) Population estimates are as published in the Australian Demographic Statistics(cat. no. 3101.0) and ABS projections.
(d) ANZSIC divisions A to N, R and S. See Glossary - Market sector.(e) Reference year for indexes is 2010–11 = 100.0.
. . not applicable— nil or rounded to zero (including null cells)(a) Change on preceding quarter; last column shows the change between the
current quarter and the corresponding quarter of the previous year.(b) Reference year for chain volume measures and real income measures is
2010–11.
. .91.390.490.391.694.598.3103.9107.1Terms of tradePrices
. .101.3101.3101.9102.8102.0101.5101.0100.7Real unit labour costs - non-farm
. .101.2101.2101.9102.2102.2101.4101.1100.3Real unit labour costs
. .105.6105.0104.4103.8103.2102.5102.0101.2Gross value added per hour worked market sector(d)
. .104.9104.6104.3103.8103.1102.2101.5100.7GDP per hour worked
. .101.1101.0101.0100.9100.9100.8100.7100.7Hours worked market sector(d)
–3.31.1—–1.4–3.0–3.9–5.3–3.0–0.8Terms of TradePrices
–0.8—–0.6–0.90.80.50.50.30.7Real unit labour costs - non-farm–0.9—–0.6–0.3—0.70.40.70.6Real unit labour costs2.30.50.60.60.60.60.50.70.8Gross value added per hour worked market sector(d)1.70.20.40.40.70.90.80.70.5GDP per hour worked0.20.1———0.10.10.10.1Hours worked market sector(d)0.80.30.30.2—–0.10.10.40.5Hours worked
–0.30.30.1–0.3–0.5–0.5–0.20.30.9Real net national disposable income per capita(c)1.40.70.50.2——0.20.71.3Real net national disposable income1.90.80.60.30.20.20.40.81.3Real gross national income1.70.80.60.3—–0.1—0.51.1Real gross domestic income
Real income measures(b)
2.10.40.50.50.60.70.81.11.0Net domestic product2.50.60.60.60.70.70.60.80.9Gross value added market sector(d)0.80.10.20.20.30.40.50.70.6GDP per capita(c)2.50.50.60.60.70.80.91.11.0GDP
Chain volume GDP and related measures(b)
PE R C E N T A G E CH A N G E (a)
JunMarDecSepJunMarDecSep
Jun 12 to
Jun 13
2012–132011–12
KEY NAT IONAL ACCOUNTS AGGREGATES: Trend1
20 A B S • A U S T R A L I A N N A T I O N A L A C C O U N T S : N A T I O N A L I N C O M E , E X P E N D I T U R E A N D P R O D U C T • 5 2 0 6 . 0 • J U N 2 0 1 3
(c) Population estimates are as published in the Australian Demographic Statistics(cat. no. 3101.0) and ABS projections.
(d) ANZSIC divisions A to N, R and S. See Glossary - Market sector.(e) Reference year for indexes is 2010–11 = 100.0.
. . not applicable— nil or rounded to zero (including null cells)(a) Change on preceding quarter; last column shows the change between the
current quarter and the corresponding quarter of the previous year.(b) Reference year for chain volume measures and real income measures is
2010–11.
. .91.591.388.691.196.196.8102.1106.6Terms of tradePrices
. .101.2100.8102.5102.4101.8102.1100.7100.4Real unit labour costs - non-farm
. .101.2100.8102.5101.8101.9102.1100.7100.0Real unit labour costs
. .105.4105.1104.5103.5103.1103.0101.2101.6Gross value added per hour worked market sector(d)
. .104.8104.5104.4103.7102.9102.8100.8100.8GDP per hour worked
. .101.4100.9100.9101.2101.1100.5101.1100.7Hours worked market sector(d)
–4.90.13.1–2.7–5.2–0.7–5.1–4.21.0Terms of TradePrices
–0.50.4–1.70.10.7–0.31.40.40.4Real unit labour costs - non-farm–0.70.4–1.70.7–0.1–0.21.40.70.4Real unit labour costs2.20.30.51.00.40.11.7–0.40.8Gross value added per hour worked market sector(d)1.80.20.10.70.80.11.9—0.2GDP per hour worked0.30.5—–0.30.10.6–0.60.30.5Hours worked market sector(d)0.80.40.4——0.4–0.60.61.0Hours worked
–0.9–0.11.1–0.6–1.30.5–0.2–0.71.5Real net national disposable income per capita(c)0.70.41.4–0.2–0.80.90.2–0.32.0Real net national disposable income1.40.51.40.1–0.50.90.4—1.8Real gross national income1.50.61.1—–0.30.30.2–0.31.5Real gross domestic income
Real income measures(b)
2.20.50.40.60.70.31.30.51.2Net domestic product2.50.80.50.70.50.71.1—1.2Gross value added market sector(d)0.90.10.20.20.4—0.90.20.7GDP per capita(c)2.60.60.50.70.80.51.30.61.2GDP
Chain volume GDP and related measures(b)
PE R C E N T A G E CH A N G E (a)
JunMarDecSepJunMarDecSep
Jun 12 to
Jun 13
2012–132011–12
KEY NAT IONAL ACCOUNTS AGGREGATES: Seasona l l y ad jus ted2
A B S • A U S T R A L I A N N A T I O N A L A C C O U N T S : N A T I O N A L I N C O M E , E X P E N D I T U R E A N D P R O D U C T • 5 2 0 6 . 0 • J U N 2 0 1 3 21
(c) Population estimates are as published in the Australian Demographic Statistics(cat. no. 3101.0) and ABS projections.
(d) ANZSIC divisions A to N, R and S. See Glossary - Market sector.(e) Reference year for indexes is 2010–11 = 100.0.
— nil or rounded to zero (including null cells)(a) Percentage change on preceding year.(b) Reference year for chain volume measures and real income measures is
2010–11.
90.7100.4100.083.086.480.376.170.9Terms of tradePrices
101.8101.2100.0101.1100.7104.0103.6104.5Real unit labour costs - non-farm101.6101.2100.0101.5101.3104.6104.6104.6Real unit labour costs104.6102.2100.099.596.995.994.793.8Gross value added per hour worked market sector(d)104.3101.8100.0100.298.197.696.996.0GDP per hour worked101.1100.9100.098.098.498.295.392.4Hours worked market sector(d)102.0101.6100.097.597.496.493.691.0Hours worked
0.51.2–1.10.4–3.20.4–0.9–0.6Real unit labour costs - non-farm0.41.2–1.50.2–3.1—–0.1–0.6Real unit labour costs2.32.20.52.71.01.21.01.7Gross value added per hour worked market sector(d)2.41.8–0.22.10.50.70.90.8GDP per hour worked0.20.92.1–0.40.23.13.11.5Hours worked market sector(d)0.41.62.6—1.13.02.92.3Hours worked
Productivity
2.55.08.63.06.78.58.98.0GDPCurrent price measures
–1.22.85.5–2.11.23.32.83.1Real net national disposable income per capita(c)0.64.56.9–0.33.45.24.44.6Real net national disposable income1.24.66.50.73.85.34.64.8Real gross national income0.63.56.51.13.24.95.35.0Real gross domestic income
Real income measures(b)
2.53.12.01.50.93.33.42.5Net domestic product2.63.12.62.31.24.34.13.2Gross value added market sector(d)1.11.81.10.2–0.51.92.11.6GDP per capita(c)2.83.42.42.11.63.83.83.0GDP
22 A B S • A U S T R A L I A N N A T I O N A L A C C O U N T S : N A T I O N A L I N C O M E , E X P E N D I T U R E A N D P R O D U C T • 5 2 0 6 . 0 • J U N 2 0 1 3
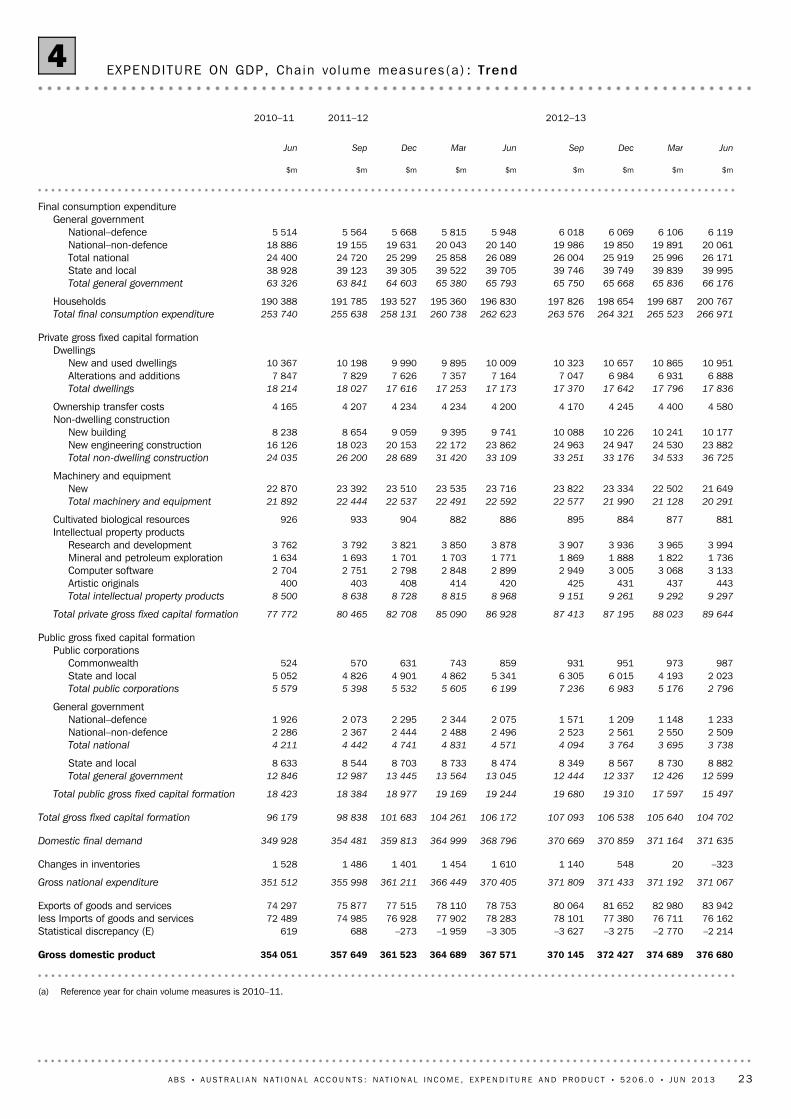
(a) Reference year for chain volume measures is 2010–11.
EXPENDITURE ON GDP, Cha in volume measures(a) : Trend4
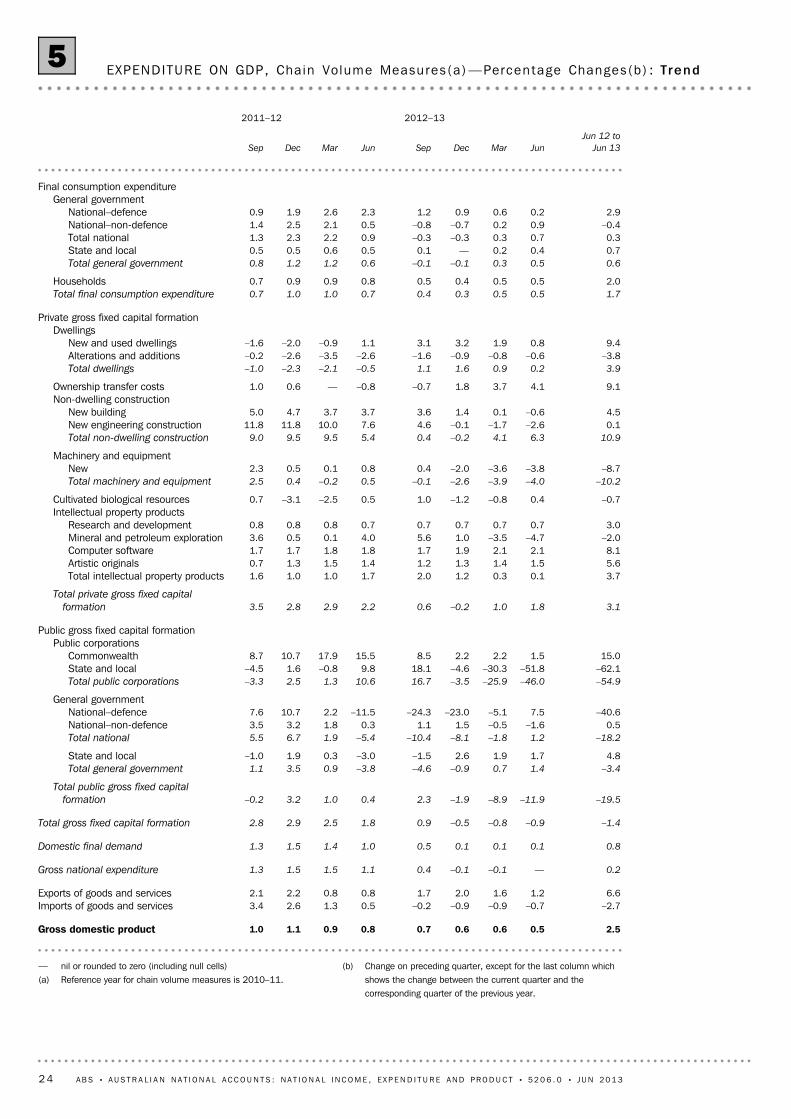
A B S • A U S T R A L I A N N A T I O N A L A C C O U N T S : N A T I O N A L I N C O M E , E X P E N D I T U R E A N D P R O D U C T • 5 2 0 6 . 0 • J U N 2 0 1 3 23
(b) Change on preceding quarter, except for the last column whichshows the change between the current quarter and thecorresponding quarter of the previous year.
— nil or rounded to zero (including null cells)(a) Reference year for chain volume measures is 2010–11.
2.50.50.60.60.70.80.91.11.0Gross domestic product
–2.7–0.7–0.9–0.9–0.20.51.32.63.4Imports of goods and services6.61.21.62.01.70.80.82.22.1Exports of goods and services
0.2—–0.1–0.10.41.11.51.51.3Gross national expenditure
0.80.10.10.10.51.01.41.51.3Domestic final demand
–1.4–0.9–0.8–0.50.91.82.52.92.8Total gross fixed capital formation
–19.5–11.9–8.9–1.92.30.41.03.2–0.2
Total public gross fixed capital
formation
–3.41.40.7–0.9–4.6–3.80.93.51.1Total general government
EXPENDITURE ON GDP, Cha in Volume Measures (a ) —Percentage Changes(b) : Trend5
24 A B S • A U S T R A L I A N N A T I O N A L A C C O U N T S : N A T I O N A L I N C O M E , E X P E N D I T U R E A N D P R O D U C T • 5 2 0 6 . 0 • J U N 2 0 1 3
(a) Reference year for chain volume measures is 2010–11.
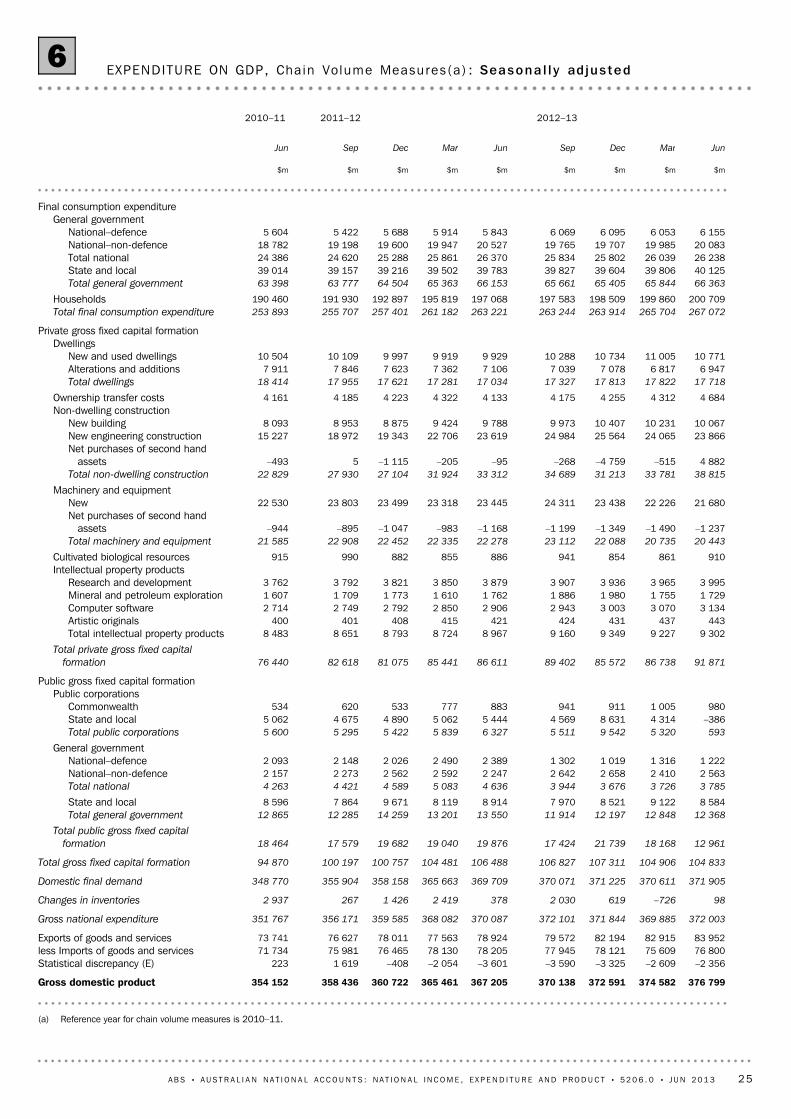
EXPENDITURE ON GDP, Cha in Volume Measures(a) : Seasona l l y ad jus ted6
A B S • A U S T R A L I A N N A T I O N A L A C C O U N T S : N A T I O N A L I N C O M E , E X P E N D I T U R E A N D P R O D U C T • 5 2 0 6 . 0 • J U N 2 0 1 3 25
(b) Change on preceding quarter, except for the last column whichshows the change between the current quarter and thecorresponding quarter of the previous year.
. . not applicable— nil or rounded to zero (including null cells)(a) Reference year for chain volume measures is 2010–11.
2.60.60.50.70.80.51.30.61.2Gross domestic product
–1.81.6–3.20.2–0.30.12.20.65.9Imports of goods and services6.41.30.93.30.81.8–0.61.83.9Exports of goods and services
0.50.6–0.5–0.10.50.52.41.01.3Gross national expenditure
0.60.3–0.20.30.11.12.10.62.0Domestic final demand
–1.6–0.1–2.20.50.31.93.70.65.6Total gross fixed capital formation
–34.8–28.7–16.424.8–12.34.4–3.312.0–4.8
Total public gross fixed capital
formation
–8.7–3.75.32.4–12.12.6–7.416.1–4.5Total general government
–3.7–5.97.16.9–10.69.8–16.023.0–8.5State and local
–8.2–1.4–6.1–4.43.7–0.3–0.5–2.06.1Total machinery and equipment
–7.5–2.5–5.2–3.63.70.5–0.8–1.35.7NewMachinery and equipment
16.514.98.2–10.04.14.317.8–3.022.3Total non-dwelling construction
1.0–0.8–5.92.35.84.017.42.024.6New engineering construction2.9–1.6–1.74.41.93.96.2–0.910.6New building
Non-dwelling construction13.38.61.31.91.0–4.42.30.90.6Ownership transfer costs
4.0–0.60.12.81.7–1.4–1.9–1.9–2.5Total dwellings
–2.21.9–3.70.6–0.9–3.5–3.4–2.8–0.8Alterations and additions8.5–2.12.54.33.60.1–0.8–1.1–3.8New and used dwellings
DwellingsPrivate gross fixed capital formation
1.50.50.70.3—0.81.50.70.7Total final consumption expenditure
1.80.40.70.50.30.61.50.50.8Households
0.30.80.7–0.4–0.71.21.31.10.6Total general government
0.90.80.5–0.60.10.70.70.20.4State and local–0.50.80.9–0.1–2.02.02.32.71.0Total national–2.20.51.4–0.3–3.72.91.82.12.2National–non-defence5.31.7–0.70.43.9–1.24.04.9–3.3National–defence
General governmentFinal consumption expenditure
JunMarDecSepJunMarDecSep
Jun 12 to
Jun 13
2012–132011–12
EXPENDITURE ON GDP, Cha in Volume Measures (a ) —Percentage Changes(b) : Seasona l l y
adjus ted7
26 A B S • A U S T R A L I A N N A T I O N A L A C C O U N T S : N A T I O N A L I N C O M E , E X P E N D I T U R E A N D P R O D U C T • 5 2 0 6 . 0 • J U N 2 0 1 3
(b) Contributions to quarterly growth, except for the last columnwhich shows the contribution to growth between the currentquarter and the corresponding quarter of the previous year.
— nil or rounded to zero (including null cells)(a) Reference year for chain volume measures is 2010–11.
2.60.60.50.70.80.51.30.61.2Gross domestic product
0.30.10.20.1—–0.4–0.5–0.60.4Statistical discrepancy (E)0.4–0.30.7—0.1—–0.5–0.1–1.2Imports of goods and services1.40.30.20.70.20.4–0.10.40.8Exports of goods and services
0.50.6–0.5–0.10.50.52.41.01.2Gross national expenditure
–0.10.2–0.4–0.40.4–0.60.30.3–0.8Changes in inventories
0.60.3–0.20.30.11.12.10.62.0Domestic final demand
–0.5—–0.60.10.10.51.00.21.5Total gross fixed capital formation
–1.9–1.4–1.01.2–0.70.2–0.20.6–0.2Total public gross fixed capital formation
–0.3–0.10.20.1–0.40.1–0.30.6–0.2Total general government
–0.1–0.10.20.1–0.30.2–0.40.5–0.2State and local0.1—–0.1—0.1–0.1—0.1—National–non-defence
–0.3—0.1–0.1–0.3—0.1——National–defenceGeneral government
–1.6–1.3–1.11.1–0.20.10.1—–0.1Total public corporations
–1.6–1.3–1.21.1–0.20.1—0.1–0.1State and local——————0.1——Commonwealth
Public corporationsPublic gross fixed capital formation
1.41.40.3–1.00.80.31.2–0.41.7
Total private gross fixed capital
formation
1.11.30.3–1.20.70.41.3–0.31.9Private business investment (s/s)0.1——0.10.10.1———Total intellectual property products—————————Artistic originals——–0.1——————Mineral and petroleum exploration
0.1————————Computer software—————————Research and development
–0.5–0.1–0.4–0.30.2——–0.10.4Total machinery and equipment
—0.1———–0.1———Net purchases of second hand
assets
–0.5–0.1–0.3–0.20.2—–0.1–0.10.4NewMachinery and equipment
1.51.30.7–0.90.40.41.3–0.21.4Total non-dwelling construction
1.41.41.1–1.2——0.3–0.30.1Net purchases of second hand
assets
0.1–0.1–0.40.20.40.30.90.11.1New engineering construction0.1——0.10.10.10.2—0.2New building
Non-dwelling construction0.10.1———–0.1———Ownership transfer costs0.2——0.10.1–0.1–0.1–0.1–0.1Total dwellings
——–0.1——–0.1–0.1–0.1—Alterations and additions0.2–0.10.10.10.1———–0.1New and used dwellings
DwellingsPrivate gross fixed capital formation
1.00.40.50.2—0.61.00.50.5Total final consumption expenditure
1.00.20.40.20.10.30.80.30.4Households0.10.10.1–0.1–0.10.20.20.20.1Total general government
0.10.10.1–0.1—0.10.1——State and local–0.1—0.1—–0.20.20.10.10.1National–Non-defence0.1———0.1—0.10.1–0.1National–defence
General governmentFinal consumption expenditure
% pts% pts% pts% pts% pts% pts% pts% pts% pts
JunMarDecSepJunMarDecSep
Jun 12 to
Jun 13
2012–132011–12
EXPENDITURE ON GDP, Cha in volume measures (a ) —Contr ibu t ions to Growth(b) :
Seasona l l y Ad jus ted8
A B S • A U S T R A L I A N N A T I O N A L A C C O U N T S : N A T I O N A L I N C O M E , E X P E N D I T U R E A N D P R O D U C T • 5 2 0 6 . 0 • J U N 2 0 1 3 27
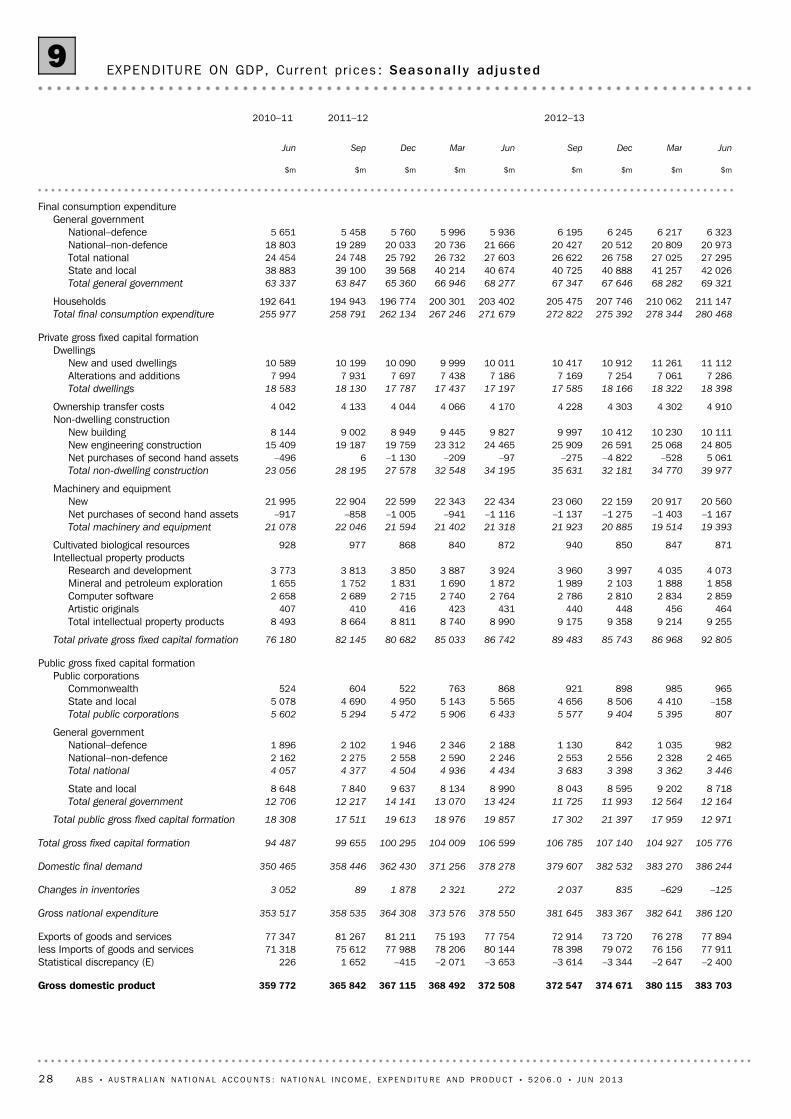
EXPENDITURE ON GDP, Cur ren t pr i ces : Seasona l l y ad jus ted9
28 A B S • A U S T R A L I A N N A T I O N A L A C C O U N T S : N A T I O N A L I N C O M E , E X P E N D I T U R E A N D P R O D U C T • 5 2 0 6 . 0 • J U N 2 0 1 3
(a) Chain price indexes are annually reweighted Laspeyres indexes with reference year 2010–11 = 100.0.
91.292.393.694.695.196.197.297.998.0Computer software107.7107.8106.5105.7106.4105.1103.3102.5102.6Mineral and petroleum exploration102.0101.8101.6101.4101.2101.0100.8100.5100.3Research and development
Intellectual property products99.699.699.599.398.498.298.097.9100.3Cultivated biological resources94.994.294.694.995.795.896.196.097.2Machinery and equipment
103.0102.9102.7102.5102.4101.7101.5100.8100.8Total non-dwelling construction
104.2104.3103.9103.6103.4102.5102.0101.0100.9New engineering construction100.5100.2100.2100.5100.5100.3100.8100.6100.7New building
Non-dwelling construction104.099.5101.1100.699.993.796.999.098.3Ownership transfer costs
106.0102.6103.6101.9104.7101.3101.599.6101.4Total general government
107.0102.0103.8100.7104.4100.2101.598.4101.8State and local104.5103.4103.3103.8105.1103.0101.6101.3100.7Total national105.1103.7103.6104.2106.2103.5101.6101.4100.6National–non-defence102.7102.5102.4102.3101.4101.2101.2101.0100.7National–defence
General governmentFinal consumption expenditure
indexindexindexindexindexindexindexindexindex
JunMarDecSepJunMarDecSepJun
2012–132011–122010–11
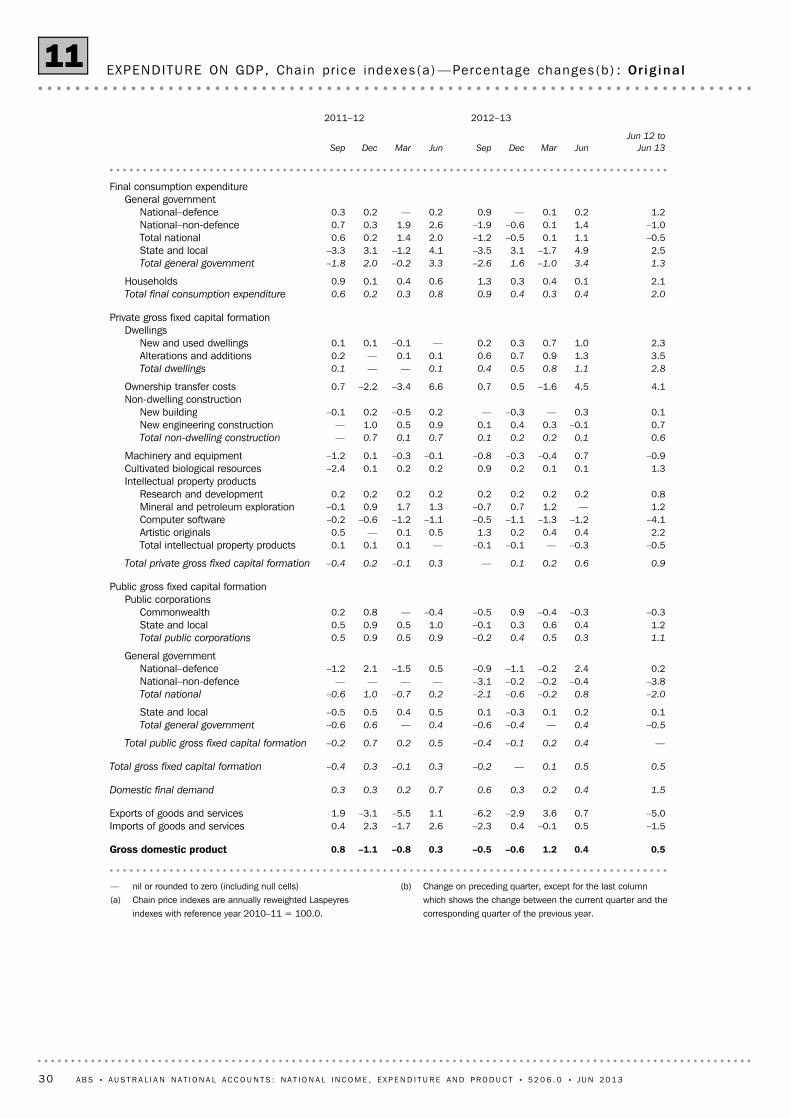
EXPENDITURE ON GDP, Cha in pr i ce indexes(a) : Or ig ina l10
A B S • A U S T R A L I A N N A T I O N A L A C C O U N T S : N A T I O N A L I N C O M E , E X P E N D I T U R E A N D P R O D U C T • 5 2 0 6 . 0 • J U N 2 0 1 3 29
(b) Change on preceding quarter, except for the last columnwhich shows the change between the current quarter and thecorresponding quarter of the previous year.
— nil or rounded to zero (including null cells)(a) Chain price indexes are annually reweighted Laspeyres
–4.1–1.2–1.3–1.1–0.5–1.1–1.2–0.6–0.2Computer software1.2—1.20.7–0.71.31.70.9–0.1Mineral and petroleum exploration0.80.20.20.20.20.20.20.20.2Research and development
–0.90.7–0.4–0.3–0.8–0.1–0.30.1–1.2Machinery and equipment
0.60.10.20.20.10.70.10.7—Total non-dwelling construction
0.7–0.10.30.40.10.90.51.0—New engineering construction0.10.3—–0.3—0.2–0.50.2–0.1New building
Non-dwelling construction4.14.5–1.60.50.76.6–3.4–2.20.7Ownership transfer costs
2.81.10.80.50.40.1——0.1Total dwellings
3.51.30.90.70.60.10.1—0.2Alterations and additions2.31.00.70.30.2—–0.10.10.1New and used dwellings
DwellingsPrivate gross fixed capital formation
2.00.40.30.40.90.80.30.20.6Total final consumption expenditure
2.10.10.40.31.30.60.40.10.9Households
1.33.4–1.01.6–2.63.3–0.22.0–1.8Total general government
2.54.9–1.73.1–3.54.1–1.23.1–3.3State and local–0.51.10.1–0.5–1.22.01.40.20.6Total national–1.01.40.1–0.6–1.92.61.90.30.7National–non-defence1.20.20.1—0.90.2—0.20.3National–defence
General governmentFinal consumption expenditure
JunMarDecSepJunMarDecSep
Jun 12 to
Jun 13
2012–132011–12
EXPENDITURE ON GDP, Cha in pr ice indexes(a ) —Percentage changes(b) : Or ig ina l11
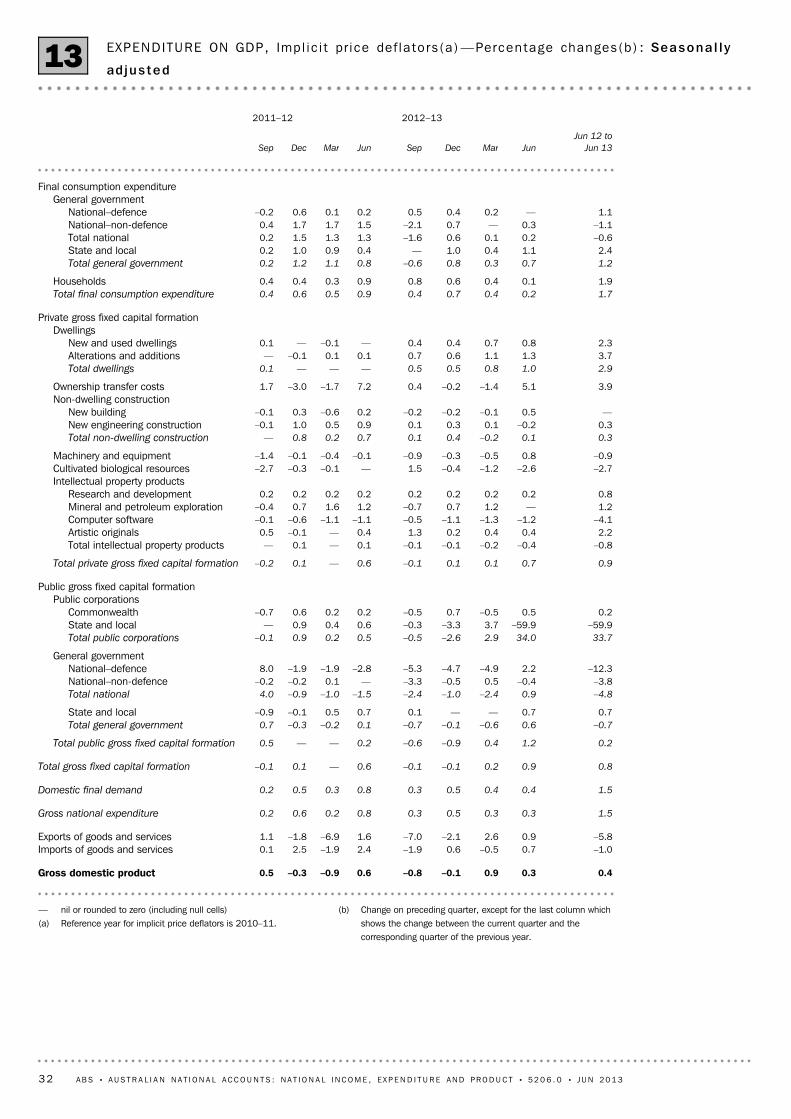
30 A B S • A U S T R A L I A N N A T I O N A L A C C O U N T S : N A T I O N A L I N C O M E , E X P E N D I T U R E A N D P R O D U C T • 5 2 0 6 . 0 • J U N 2 0 1 3
(a) Reference year for implicit price deflators is 2010–11.
91.292.393.694.795.196.197.297.897.9Computer software107.5107.5106.2105.4106.2104.9103.3102.6103.0Mineral and petroleum exploration102.0101.8101.6101.4101.2101.0100.8100.5100.3Research and development
Intellectual property products95.798.399.599.998.498.398.598.7101.4Cultivated biological resources94.994.194.694.995.795.896.296.297.7Machinery and equipment
103.0102.9103.1102.7102.7102.0101.8101.0101.0Total non-dwelling construction
103.9104.2104.0103.7103.6102.7102.2101.1101.2New engineering construction100.4100.0100.0100.2100.4100.2100.8100.6100.6New building
Non-dwelling construction104.899.8101.1101.3100.994.195.798.897.1Ownership transfer costs
104.5103.7103.4102.6103.2102.4101.3100.199.9Total general government
104.7103.6103.2102.3102.2101.8100.999.999.7State and local104.0103.8103.7103.1104.7103.4102.0100.5100.3Total national104.4104.1104.1103.3105.5104.0102.2100.5100.1National–non-defence102.7102.7102.5102.1101.6101.4101.3100.7100.8National–defence
General governmentFinal consumption expenditure
IndexIndexIndexIndexIndexIndexIndexIndexIndex
JunMarDecSepJunMarDecSepJun
2012–132011–122010–11
EXPENDITURE ON GDP, Imp l i c i t pr i ce def la to rs (a ) : Seasona l l y ad jus ted12
A B S • A U S T R A L I A N N A T I O N A L A C C O U N T S : N A T I O N A L I N C O M E , E X P E N D I T U R E A N D P R O D U C T • 5 2 0 6 . 0 • J U N 2 0 1 3 31
(b) Change on preceding quarter, except for the last column whichshows the change between the current quarter and thecorresponding quarter of the previous year.
— nil or rounded to zero (including null cells)(a) Reference year for implicit price deflators is 2010–11.
–4.1–1.2–1.3–1.1–0.5–1.1–1.1–0.6–0.1Computer software1.2—1.20.7–0.71.21.60.7–0.4Mineral and petroleum exploration0.80.20.20.20.20.20.20.20.2Research and development
Intellectual property products–2.7–2.6–1.2–0.41.5—–0.1–0.3–2.7Cultivated biological resources–0.90.8–0.5–0.3–0.9–0.1–0.4–0.1–1.4Machinery and equipment
0.30.1–0.20.40.10.70.20.8—Total non-dwelling construction
0.3–0.20.10.30.10.90.51.0–0.1New engineering construction—0.5–0.1–0.2–0.20.2–0.60.3–0.1New building
Non-dwelling construction3.95.1–1.4–0.20.47.2–1.7–3.01.7Ownership transfer costs
2.91.00.80.50.5———0.1Total dwellings
3.71.31.10.60.70.10.1–0.1—Alterations and additions2.30.80.70.40.4—–0.1—0.1New and used dwellings
DwellingsPrivate gross fixed capital formation
1.70.20.40.70.40.90.50.60.4Total final consumption expenditure
1.90.10.40.60.80.90.30.40.4Households
1.20.70.30.8–0.60.81.11.20.2Total general government
2.41.10.41.0—0.40.91.00.2State and local–0.60.20.10.6–1.61.31.31.50.2Total national–1.10.3—0.7–2.11.51.71.70.4National–non-defence1.1—0.20.40.50.20.10.6–0.2National–defence
General governmentFinal consumption expenditure
JunMarDecSepJunMarDecSep
Jun 12 to
Jun 13
2012–132011–12
EXPENDITURE ON GDP, Imp l i c i t pr i ce def la to rs (a ) —Percentage changes(b) : Seasona l l y
adjus ted13
32 A B S • A U S T R A L I A N N A T I O N A L A C C O U N T S : N A T I O N A L I N C O M E , E X P E N D I T U R E A N D P R O D U C T • 5 2 0 6 . 0 • J U N 2 0 1 3
(c) Includes water transport.(d) Excludes ownership of dwellings.
(a) At basic prices.(b) Reference year for chain volume measures is 2010–11.
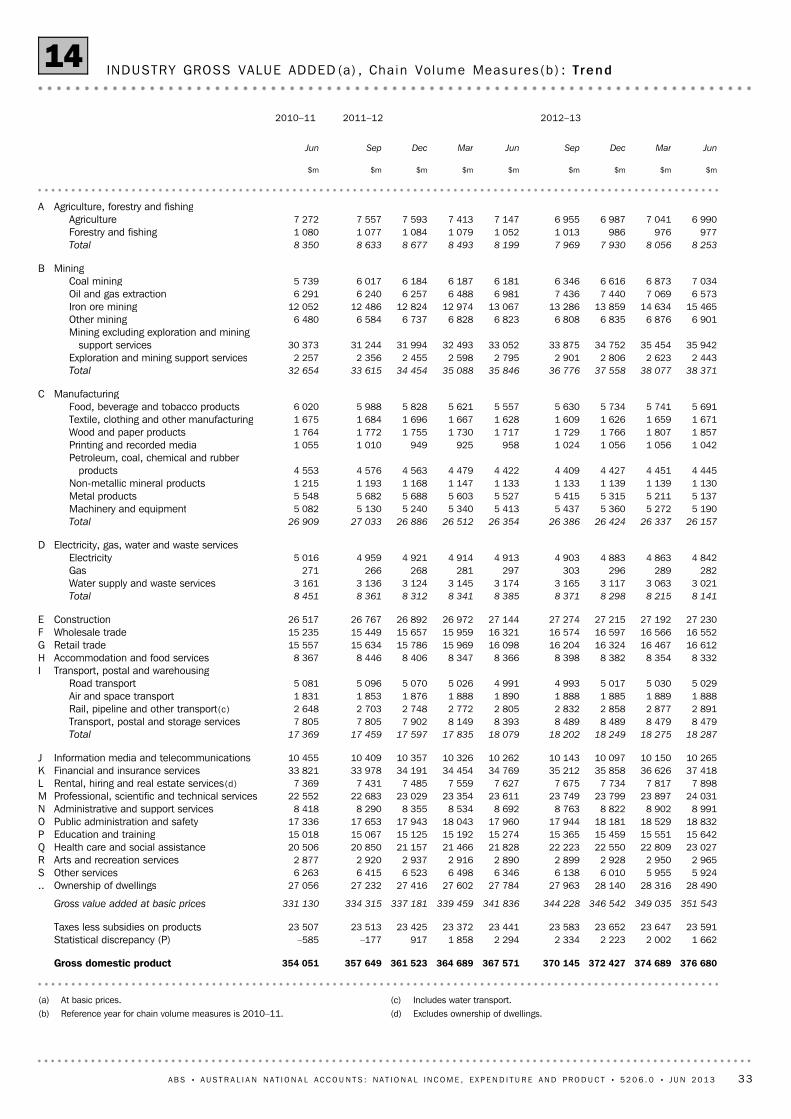
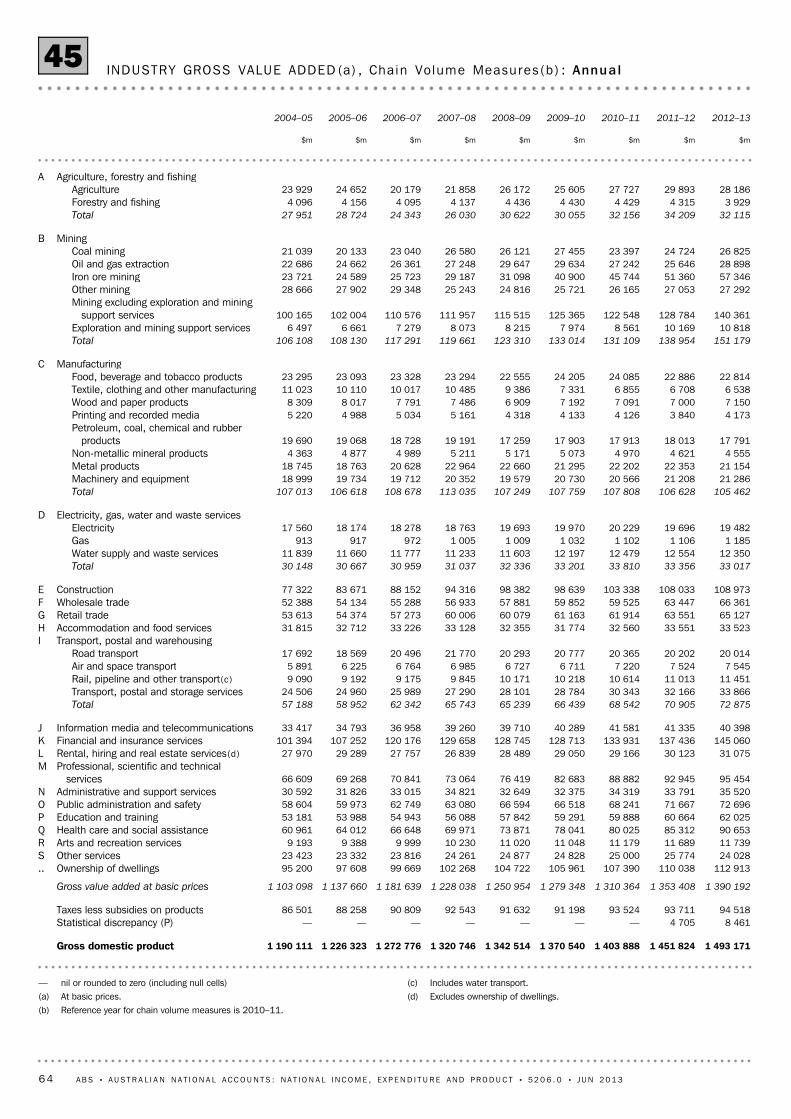
INDUSTRY GROSS VALUE ADDED (a) , Cha in Volume Measures (b ) : Trend14
A B S • A U S T R A L I A N N A T I O N A L A C C O U N T S : N A T I O N A L I N C O M E , E X P E N D I T U R E A N D P R O D U C T • 5 2 0 6 . 0 • J U N 2 0 1 3 33
(c) Change on preceding quarter, except for the last column which shows thechange between the current quarter and the corresponding quarter of theprevious year.
(d) Includes water transport.
— nil or rounded to zero (including null cells)(a) At basic prices.(b) Reference year for chain volume measures is 2010–11.
2.50.50.60.60.70.80.91.11.0Gross domestic product
0.6–0.2—0.30.60.3–0.2–0.4—Taxes less subsidies on products
2.80.70.70.70.70.70.70.91.0Gross value added at basic prices
2.50.60.60.60.60.70.70.70.6Ownership of dwellings..–6.7–0.5–0.9–2.1–3.3–2.3–0.41.72.4Other servicesS2.60.50.71.00.3–0.9–0.70.61.5Arts and recreation servicesR5.51.01.11.51.81.71.51.51.7Health care and social assistanceQ2.40.60.60.60.60.50.40.40.3Education and trainingP4.91.61.91.3–0.1–0.50.61.61.8Public administration and safetyO3.41.00.90.70.81.92.10.8–1.5Administrative and support servicesN1.80.60.40.20.61.11.41.50.6Professional, scientific and technical servicesM3.61.01.10.80.60.91.00.70.8Rental, hiring and real estate services(b)L7.62.22.11.81.30.90.80.60.5Financial and insurance servicesK—1.10.5–0.5–1.2–0.6–0.3–0.5–0.4Information media and telecommunicationsJ
1.20.10.10.30.71.41.40.80.5Total
1.0—–0.1—1.13.03.11.3—Transport, postal and storage services3.00.50.70.90.91.20.91.72.1Rail, pipeline and other transport(d)
–0.1—0.2–0.2–0.10.10.71.21.2Air and space transport0.8—0.30.50.1–0.7–0.9–0.50.3Road transport
Transport, postal and warehousingI–0.4–0.3–0.3–0.20.40.2–0.7–0.50.9Accommodation and food servicesH3.20.90.90.70.70.81.21.00.5Retail tradeG1.4–0.1–0.20.11.52.31.91.31.4Wholesale tradeF0.30.1–0.1–0.20.50.60.30.50.9ConstructionE
–2.9–0.9–1.0–0.9–0.20.50.3–0.6–1.1Total
–4.8–1.4–1.7–1.5–0.30.90.7–0.4–0.8Water supply and waste services–5.0–2.2–2.6–2.01.85.75.10.7–2.0Gas–1.5–0.4–0.4–0.4–0.2—–0.1–0.8–1.1Electricity
Electricity, gas, water and waste servicesD
–0.7–0.7–0.30.10.1–0.6–1.4–0.50.5Total
–4.1–1.6–1.6–1.40.41.41.92.10.9Machinery and equipment–7.0–1.4–2.0–1.8–2.0–1.4–1.50.12.4Metal products–0.3–0.8—0.5—–1.2–1.8–2.1–1.8Non-metallic mineral products0.5–0.10.50.4–0.3–1.3–1.8–0.30.5Petroleum, coal, chemical and rubber products8.8–1.3—3.16.93.6–2.5–6.1–4.2Printing and recorded media8.12.82.32.20.7–0.7–1.4–1.00.4Wood and paper products2.60.72.01.1–1.2–2.4–1.70.70.5Textile, clothing and other manufacturing2.4–0.90.11.81.3–1.1–3.5–2.7–0.5Food, beverage and tobacco products
ManufacturingC
7.00.81.42.12.62.21.82.52.9Total
–12.6–6.8–6.5–3.33.87.55.84.24.4Exploration and mining support services8.71.42.02.62.51.71.62.42.9
Mining excluding exploration and mining supportservices
1.10.40.60.4–0.2–0.11.32.31.6Other mining18.35.75.64.31.70.71.22.73.6Iron ore mining–5.8–7.0–5.00.16.57.63.70.3–0.8Oil and gas extraction13.82.33.94.32.7–0.1—2.84.8Coal mining
MiningB
0.72.41.6–0.5–2.8–3.5–2.10.53.4Total
–7.10.1–1.0–2.7–3.7–2.5–0.40.6–0.2Forestry and fishing–2.2–0.70.80.5–2.7–3.6–2.40.53.9Agriculture
Agriculture, forestry and fishingA
Jun
Qtr
2013
Mar
Qtr
2013
Dec
Qtr
2012
Sep
Qtr
2012
Jun
Qtr
2012
Mar
Qtr
2012
Dec
Qtr
2011
Sep
Qtr
2011
Jun 12 to
Jun 13
2012–132011–12
INDUSTRY GROSS VALUE ADDED (a) , Cha in Volume Measures (b ) —Percentage Changes(c ) :
Trend15
34 A B S • A U S T R A L I A N N A T I O N A L A C C O U N T S : N A T I O N A L I N C O M E , E X P E N D I T U R E A N D P R O D U C T • 5 2 0 6 . 0 • J U N 2 0 1 3
(c) Includes water transport.(d) Excludes ownership of dwellings.
(a) At basic prices.(b) Reference year for chain volume measures is 2010–11.
INDUSTRY GROSS VALUE ADDED (a) , Cha in Volume Measures (b ) : Seasona l l y ad jus ted16
A B S • A U S T R A L I A N N A T I O N A L A C C O U N T S : N A T I O N A L I N C O M E , E X P E N D I T U R E A N D P R O D U C T • 5 2 0 6 . 0 • J U N 2 0 1 3 35
(c) Change on preceding quarter, except for the last column which showsthe change between the current quarter and the corresponding quarterof the previous year.
(d) Includes water transport.(e) Excludes ownership of dwellings.
— nil or rounded to zero (including null cells)(a) At basic prices.(b) Reference year for chain volume measures is 2010–11.
2.60.60.50.70.80.51.30.61.2Gross domestic product
0.3–1.20.9–0.41.10.3—–1.20.1Taxes less subsidies on products
2.80.80.60.80.60.61.10.21.2Gross value added at basic prices
2.60.60.60.60.60.70.70.70.7Ownership of dwellings..–4.90.4–0.9–2.3–2.1–5.51.92.10.7Other servicesS3.11.6–1.42.9—–0.4–2.71.24.4Arts and recreation servicesR5.51.10.71.71.92.01.11.32.2Health care and social assistanceQ2.40.70.60.60.60.70.30.40.4Education and trainingP5.00.82.62.1–0.6–2.01.81.91.5Public administration and safetyO4.52.20.50.11.60.82.52.7–3.1Administrative and support servicesN0.1—0.41.8–2.02.52.3–0.21.5Professional, scientific and technical servicesM2.3—2.01.4–1.11.52.2–0.1–0.3Rental, hiring and real estate services(e)L7.72.12.41.91.10.51.50.10.7Financial and insurance servicesK0.62.40.8–1.1–1.5–0.50.2–0.3–1.6Information media and telecommunicationsJ
–0.7–1.61.20.9–1.12.51.71.4–2.4Total
–1.3–1.41.00.4–1.34.93.43.2–4.9Transport, postal and storage services2.70.5–0.22.30.11.50.33.4–2.0Rail, pipeline and other transport(d)
–0.3–0.90.40.7–0.5–2.15.2–2.93.4Air and space transport–1.7–3.42.70.8–1.70.7–1.3–0.6–0.8Road transport
Transport, postal and warehousingI0.30.9–0.7–1.31.40.6–0.6–2.21.5Accommodation and food servicesH2.3—1.80.8–0.31.41.30.80.8Retail tradeG1.41.2–1.30.11.33.42.1–0.53.2Wholesale tradeF0.61.9–1.60.5–0.11.11.6–2.83.8ConstructionE
–3.2–0.8–1.2–0.8–0.40.61.0–0.5–2.0Total
–5.6–1.3–2.1–1.5–0.81.61.00.1–2.8Water supply and waste services–4.2–0.5–0.8–7.24.66.46.8–0.5–4.3Gas–1.6–0.5–0.7—–0.4–0.40.7–1.0–1.3Electricity
Electricity, gas, water and waste servicesD
0.60.1–1.90.71.7–2.3–0.9–0.9–0.1Total
–2.90.7–4.7–0.21.3–1.06.3–3.77.8Machinery and equipment–3.12.3–3.5–4.93.3–3.5–3.94.5–2.8Metal products1.6–2.61.4–1.44.3–5.4–0.2–1.4–2.8Non-metallic mineral products3.80.7–0.90.63.3–6.93.0–3.51.3Petroleum, coal, chemical and rubber products7.1–2.5–2.04.27.66.0–1.9–12.41.8Printing and recorded media4.82.65.30.8–3.810.1–11.23.7–0.3Wood and paper products
–0.4–3.40.111.5–7.6–6.98.6–5.1–1.2Textile, clothing and other manufacturing2.6–1.8–2.04.12.4–1.4–6.30.7–4.6Food, beverage and tobacco products
ManufacturingC
8.10.61.51.24.61.21.42.23.7Total
–13.6–7.4–7.8–5.77.47.88.6–2.05.5Exploration and mining support services9.91.22.21.84.40.70.82.53.8
Mining excluding exploration and mining supportservices
–1.9–3.53.21.9–3.41.11.52.80.6Other mining21.17.46.82.13.4–0.40.53.63.7Iron ore mining–2.3–6.1–8.2–3.717.64.5–0.64.1–2.1Oil and gas extraction13.10.13.78.00.8–1.62.3–1.39.3Coal mining
MiningB
–0.51.45.4–1.9–5.1–1.4–1.8–2.75.8Total
–9.5–0.7–0.3–0.2–8.4–0.40.10.2–0.1Forestry and fishing0.81.66.2–2.1–4.6–1.6–2.0–3.16.6Agriculture
Agriculture, forestry and fishingA
JunMarDecSepJunMarDecSep
Jun 12 to
Jun 13
2012–132011–12
INDUSTRY GROSS VALUE ADDED (a) , Cha in Volume Measures (b ) —Percentage Changes(c ) :
Seasona l l y ad jus ted17
36 A B S • A U S T R A L I A N N A T I O N A L A C C O U N T S : N A T I O N A L I N C O M E , E X P E N D I T U R E A N D P R O D U C T • 5 2 0 6 . 0 • J U N 2 0 1 3
(b) Change on preceding quarter, except for the last column which shows thechange between the current quarter and the corresponding quarter of theprevious year.
. . not applicable— nil or rounded to zero (including null cells)(a) Includes contributions to superannuation made by employers and payments
of workers' compensation premiums.
3.41.11.00.70.50.40.50.91.4Gross domestic product
7.01.61.61.72.02.11.81.00.5Taxes less subsidies on production and imports
. .165 536164 385163 273162 350161 213159 438157 007154 109Wages and salariesCompensation of employees
VA L U E S ( $ m )
JunMarDecSepJunMarDecSep
Jun 12 to
Jun 13
2012–132011–12
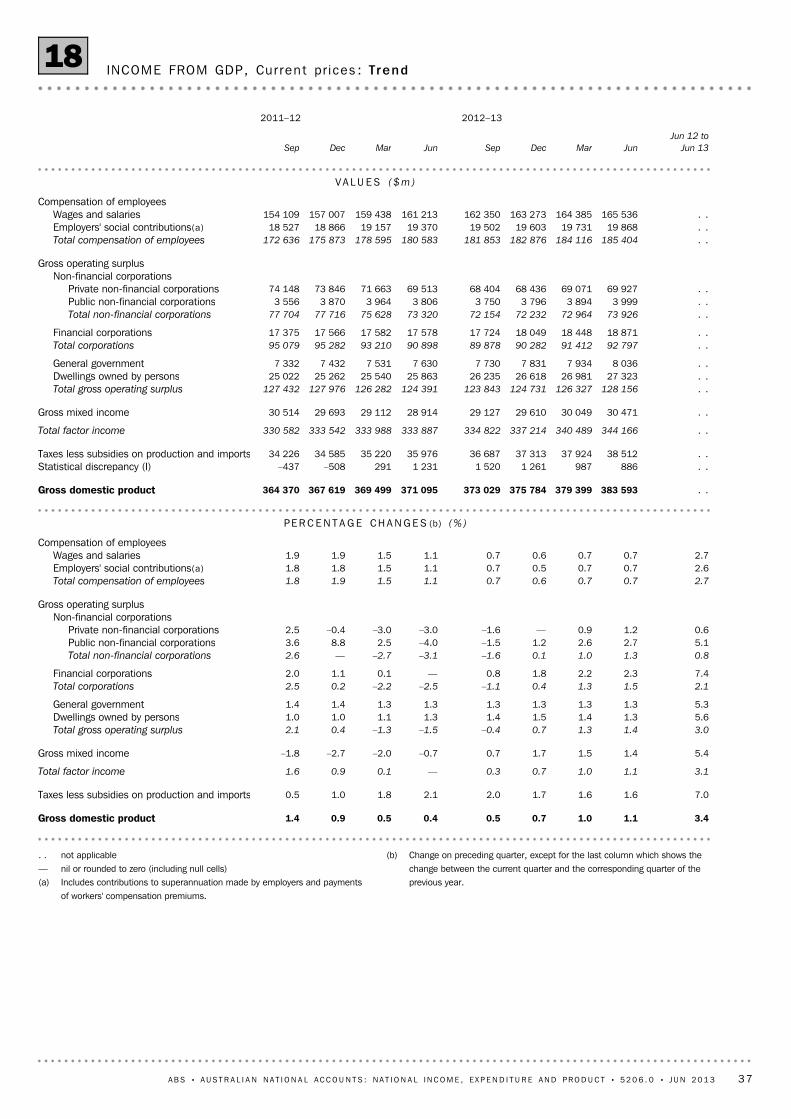
INCOME FROM GDP, Cur ren t pr ices : Trend18
A B S • A U S T R A L I A N N A T I O N A L A C C O U N T S : N A T I O N A L I N C O M E , E X P E N D I T U R E A N D P R O D U C T • 5 2 0 6 . 0 • J U N 2 0 1 3 37
(b) Change on preceding quarter, except for the last column which shows thechange between the current quarter and the corresponding quarter of theprevious year.
. . not applicable— nil or rounded to zero (including null cells)(a) Includes contributions to superannuation made by employers and payments
of workers' compensation premiums.
3.00.91.50.6—1.10.40.31.7Gross domestic product
7.62.80.32.41.91.92.30.90.7Taxes less subsidies on production and imports
2.90.71.70.4—0.4—0.22.3Total factor income
3.6–0.43.70.9–0.62.6–5.2–0.5–3.5Gross mixed income
. .165 624164 023163 819161 667161 421160 088156 383154 294Wages and salariesCompensation of employees
VA L U E S ( $ m )
JunMarDecSepJunMarDecSep
Jun 12 to
Jun 13
2012–132011–12
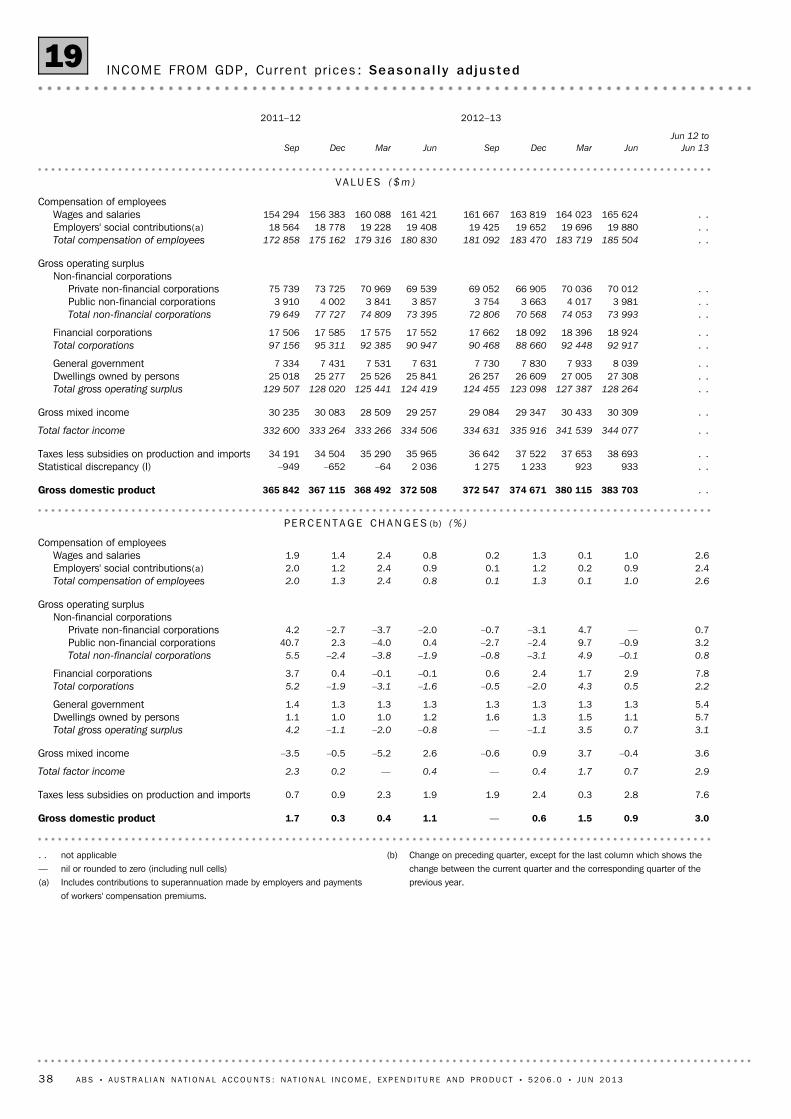
INCOME FROM GDP, Cur ren t pr ices : Seasona l l y ad jus ted19
38 A B S • A U S T R A L I A N N A T I O N A L A C C O U N T S : N A T I O N A L I N C O M E , E X P E N D I T U R E A N D P R O D U C T • 5 2 0 6 . 0 • J U N 2 0 1 3
(b) Change on preceding quarter, except for the last column which shows thechange between the current quarter and the corresponding quarter of theprevious year.
. . not applicable— nil or rounded to zero (including null cells)(a) Reference year for chain volume measures is 2010–11.
2.00.50.50.40.50.80.90.90.7Total
1.20.60.50.1–0.10.20.70.91.0Other goods and services5.51.41.41.41.20.6–0.3–0.8–0.7Insurance and other financial services
–2.5–0.5–0.6–0.8–0.60.40.81.01.1Hotels, cafes and restaurants3.00.60.80.80.81.01.10.90.6Education services
–1.1–0.6–0.5–0.30.30.60.80.91.3Recreation and culture3.81.21.20.90.40.40.40.10.1Communications
–2.40.4—–1.2–1.6–0.12.03.02.4Transport services–0.3–0.2——–0.1–0.1——0.2Operation of vehicles8.40.30.72.24.95.55.03.51.6Purchase of vehicles4.70.30.71.32.42.41.70.80.5Health4.01.61.30.70.20.30.81.01.4Furnishings and household equipment
–1.30.20.1–0.8–0.80.72.42.2—Electricity, gas and other fuel2.50.60.60.60.60.60.60.60.6Rent and other dwelling services1.70.50.50.40.30.91.30.9–0.4Clothing and footwear
–3.1–0.7–0.7–0.8–0.9–0.6–0.10.61.0Alcoholic beverages–3.4–0.4–1.0–1.3–0.70.40.5–0.4–1.2Cigarettes and tobacco4.51.51.51.00.50.71.72.11.5Food
HOUSEHOLD FINAL CONSUMPTION EXPENDITURE, Cha in volume measures (a ) : Trend20
A B S • A U S T R A L I A N N A T I O N A L A C C O U N T S : N A T I O N A L I N C O M E , E X P E N D I T U R E A N D P R O D U C T • 5 2 0 6 . 0 • J U N 2 0 1 3 39
(b) Change on preceding quarter, except for the last column which showsthe change between the current quarter and the corresponding quarter ofthe previous year.
. . not applicable— nil or rounded to zero (including null cells)(a) Reference year for chain volume measures is 2010–11.
1.80.40.70.50.30.61.50.50.8Total
1.00.51.2–0.2–0.50.40.90.80.9Other goods and services5.62.10.32.50.60.60.4–1.5–0.7
Insurance and other financialservices
–1.2–0.10.4–3.01.5–1.21.91.1–0.5Hotels, cafes and restaurants3.10.61.10.80.70.52.10.20.9Education services
–1.5–1.40.5–1.00.40.71.4–0.11.4Recreation and culture4.31.41.9—0.90.30.30.6–0.4Communications
–3.00.10.9–0.7–3.4–0.64.22.41.4Transport services——–0.80.9–0.1–1.00.60.3–0.4Operation of vehicles
8.13.4–4.36.03.28.03.21.88.1Purchase of vehicles4.20.10.41.62.22.72.9–1.72.5Health3.40.73.8–0.9–0.21.30.50.42.1
Furnishings and householdequipment
–2.4–0.80.51.1–3.2–0.66.31.0–0.8Electricity, gas and other fuel2.50.60.60.60.60.60.60.60.6Rent and other dwelling services1.1–0.10.71.3–0.80.72.11.6–1.8Clothing and footwear
–3.4–1.80.6–1.6–0.6–0.90.30.60.1Alcoholic beverages–2.21.1–0.4–3.91.00.40.10.3–1.7Cigarettes and tobacco3.90.81.92.0–0.80.52.52.11.6Food
HOUSEHOLD FINAL CONSUMPTION EXPENDITURE, Cha in volume measures (a ) : Seasona l l y
adjus ted21
40 A B S • A U S T R A L I A N N A T I O N A L A C C O U N T S : N A T I O N A L I N C O M E , E X P E N D I T U R E A N D P R O D U C T • 5 2 0 6 . 0 • J U N 2 0 1 3
(a) Reference year for chain volume measures is 2010–11.
98–7266192 0303782 4191 4262672 937Total changes in
CHANGES IN INVENTORIES, Cha in volume measures (a )22
A B S • A U S T R A L I A N N A T I O N A L A C C O U N T S : N A T I O N A L I N C O M E , E X P E N D I T U R E A N D P R O D U C T • 5 2 0 6 . 0 • J U N 2 0 1 3 41
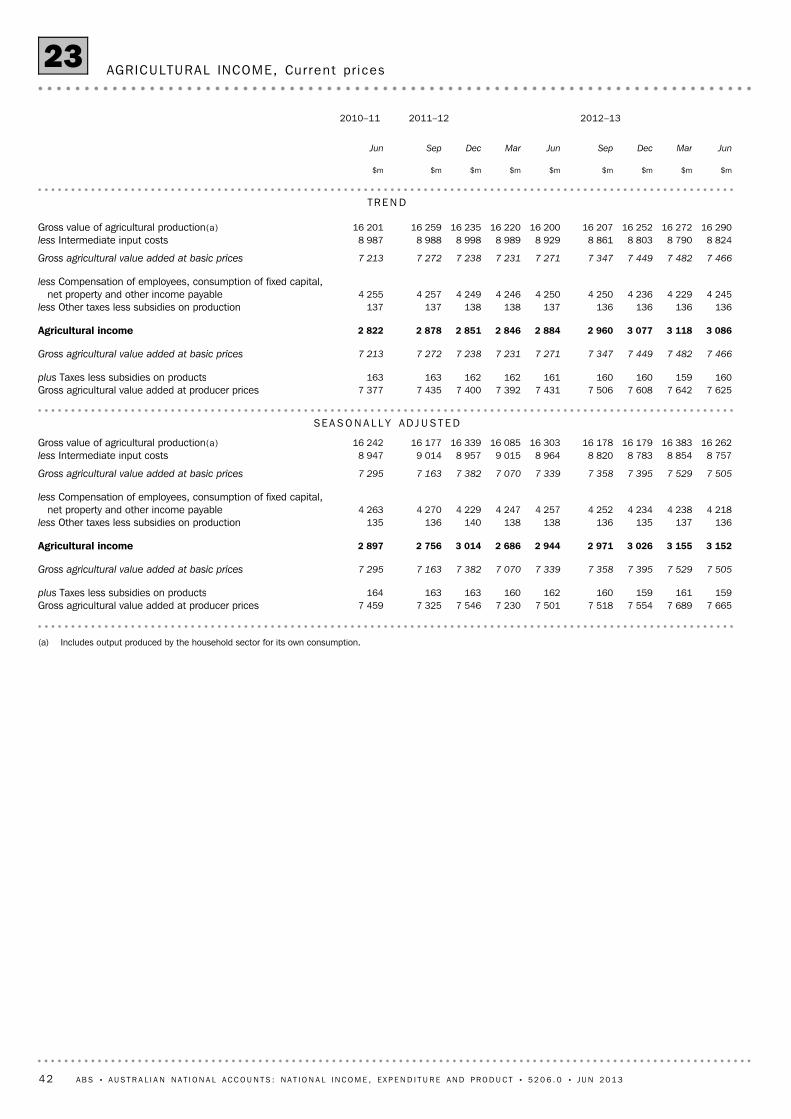
(a) Includes output produced by the household sector for its own consumption.
7 6657 6897 5547 5187 5017 2307 5467 3257 459Gross agricultural value added at producer prices159161159160162160163163164plus Taxes less subsidies on products
7 5057 5297 3957 3587 3397 0707 3827 1637 295Gross agricultural value added at basic prices
42 A B S • A U S T R A L I A N N A T I O N A L A C C O U N T S : N A T I O N A L I N C O M E , E X P E N D I T U R E A N D P R O D U C T • 5 2 0 6 . 0 • J U N 2 0 1 3
(a) Reference year for chain volume measures is 2010–11.
–1.0–1.40.9–0.5–1.00.31.82.52.3International trade—imports of goods2.0–2.83.3–1.87.4–1.30.15.31.4International trade—exports of goods
COMPONENTS OF STATE FINAL DEMAND, Cha in Volume Measures (a ) : New South Wales24
A B S • A U S T R A L I A N N A T I O N A L A C C O U N T S : N A T I O N A L I N C O M E , E X P E N D I T U R E A N D P R O D U C T • 5 2 0 6 . 0 • J U N 2 0 1 3 43
(a) Reference period for chain volume measures is 2010–11.— nil or rounded to zero (including null cells)
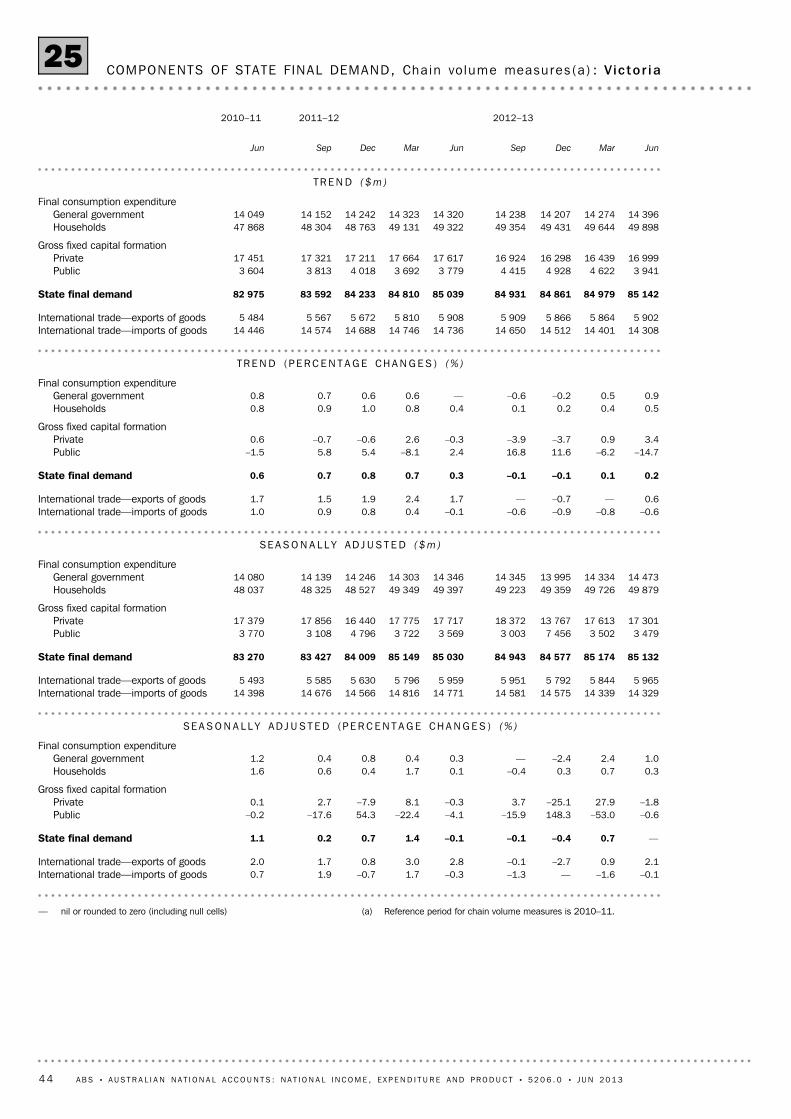
–0.1–1.6—–1.3–0.31.7–0.71.90.7International trade—imports of goods2.10.9–2.7–0.12.83.00.81.72.0International trade—exports of goods
COMPONENTS OF STATE FINAL DEMAND, Cha in volume measures (a ) : Vic to r i a25
44 A B S • A U S T R A L I A N N A T I O N A L A C C O U N T S : N A T I O N A L I N C O M E , E X P E N D I T U R E A N D P R O D U C T • 5 2 0 6 . 0 • J U N 2 0 1 3
(a) Reference year for chain volume measures is 2010–11.
–3.8–3.35.01.63.15.61.07.20.9International trade—imports of goods3.6–3.816.0–0.7–6.82.64.17.413.1International trade—exports of goods
COMPONENTS OF STATE FINAL DEMAND, Cha in Volume Measures (a ) : Queens land26
A B S • A U S T R A L I A N N A T I O N A L A C C O U N T S : N A T I O N A L I N C O M E , E X P E N D I T U R E A N D P R O D U C T • 5 2 0 6 . 0 • J U N 2 0 1 3 45
(a) Reference year for chain volume measures is 2010–11.— nil or rounded to zero (including null cells)
2.1–5.5–2.6–0.43.91.3–4.44.42.2International trade—imports of goods–1.89.1–2.3–2.0–3.1–3.28.2–2.8–4.6International trade—exports of goods
COMPONENTS OF STATE FINAL DEMAND, Cha in Volume Measures (a ) : South Aus t ra l i a27
46 A B S • A U S T R A L I A N N A T I O N A L A C C O U N T S : N A T I O N A L I N C O M E , E X P E N D I T U R E A N D P R O D U C T • 5 2 0 6 . 0 • J U N 2 0 1 3
(a) Reference year for chain volume measures is 2010–11.— nil or rounded to zero (including null cells)
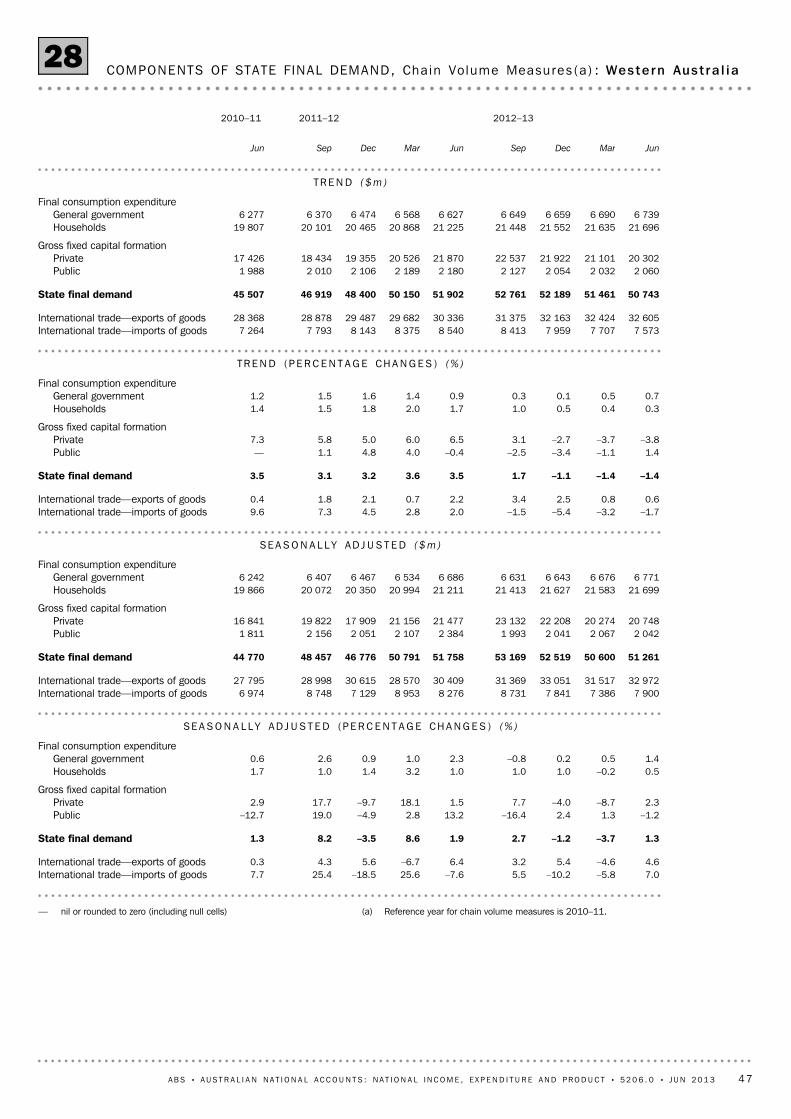
7.0–5.8–10.25.5–7.625.6–18.525.47.7International trade—imports of goods4.6–4.65.43.26.4–6.75.64.30.3International trade—exports of goods
COMPONENTS OF STATE FINAL DEMAND, Cha in Volume Measures (a ) : Weste rn Aus t ra l i a28
A B S • A U S T R A L I A N N A T I O N A L A C C O U N T S : N A T I O N A L I N C O M E , E X P E N D I T U R E A N D P R O D U C T • 5 2 0 6 . 0 • J U N 2 0 1 3 47
(a) Reference year for chain volume measures is 2010–11.— nil or rounded to zero (including null cells)
–9.213.79.8–4.1–10.9–55.9146.50.83.8International trade—imports of goods–13.411.02.48.6–14.311.0–5.37.05.6International trade—exports of goods
–0.3–0.7–1.2–0.3–0.9–0.8–0.80.90.1State final demand
COMPONENTS OF STATE FINAL DEMAND, Cha in Volume Measures (a ) : Tasman ia29
48 A B S • A U S T R A L I A N N A T I O N A L A C C O U N T S : N A T I O N A L I N C O M E , E X P E N D I T U R E A N D P R O D U C T • 5 2 0 6 . 0 • J U N 2 0 1 3
(a) Reference year for chain volume measures is 2010–11.— nil or rounded to zero (including null cells)
27.6–40.474.62.3–10.2–2.7–0.90.26.2International trade—imports of goods4.3–0.1–0.811.04.27.8–10.3–0.1–0.6International trade—exports of goods
COMPONENTS OF STATE FINAL DEMAND, Cha in Volume Measures (a ) : Nor the rn Ter r i to r y30
A B S • A U S T R A L I A N N A T I O N A L A C C O U N T S : N A T I O N A L I N C O M E , E X P E N D I T U R E A N D P R O D U C T • 5 2 0 6 . 0 • J U N 2 0 1 3 49
(a) Reference year for chain volume measures is 2010–11.. . not applicable— nil or rounded to zero (including null cells)
COMPONENTS OF STATE FINAL DEMAND, Cha in Volume Measures (a ) : Aust ra l i an Cap i ta l
Ter r i t o r y31
50 A B S • A U S T R A L I A N N A T I O N A L A C C O U N T S : N A T I O N A L I N C O M E , E X P E N D I T U R E A N D P R O D U C T • 5 2 0 6 . 0 • J U N 2 0 1 3
(a) Net saving is derived as a balancing item.
373 438370 330363 952361 753361 727357 622356 132354 170345 645Total use of gross disposable income
60 45559 77159 10358 45057 77757 12556 50955 92955 425Consumption of fixed capital
32 51532 21629 45730 48132 27133 25137 48939 45034 243Total national net saving
A B S • A U S T R A L I A N N A T I O N A L A C C O U N T S : N A T I O N A L I N C O M E , E X P E N D I T U R E A N D P R O D U C T • 5 2 0 6 . 0 • J U N 2 0 1 3 51
(a) Statistical discrepancy (E) less statistical discrepancy (I)— nil or rounded to zero (including null cells)
92 63291 70188 30488 71789 71090 09093 74295 16489 503Total capital accumulation and net
92 49590 87289 44388 61889 24791 40893 41693 04890 206Gross saving and capital transfers
320285258262287293262210171less Payable to non-residents—————————Receivable from non-residents
Capital transfers60 43659 77659 10858 44057 77857 12756 51455 94955 405Consumption of fixed capital32 39831 37830 58430 43931 75634 57437 16437 30934 972National net saving
TR E N D
$m$m$m$m$m$m$m$m$m
JunMarDecSepJunMarDecSepJun
2012–132011–122010–11
NAT IONAL CAPITAL ACCOUNT, Cur rent pr i ces33
52 A B S • A U S T R A L I A N N A T I O N A L A C C O U N T S : N A T I O N A L I N C O M E , E X P E N D I T U R E A N D P R O D U C T • 5 2 0 6 . 0 • J U N 2 0 1 3
— nil or rounded to zero (including null cells)
9 6889 02615 09515 22011 47414 2328 6677 1837 647Total capital accumulation and net lending (+) /
Primary income receivable by non-residents77 22377 45078 14178 92579 29778 95976 81374 98071 812Imports of goods and services
Income of non-residentsIncome account
TR E N D
$m$m$m$m$m$m$m$m$m
JunMarDecSepJunMarDecSepJun
2012–132011–122010–11
EXTERNAL ACCOUNT, Cur rent pr i ces34
A B S • A U S T R A L I A N N A T I O N A L A C C O U N T S : N A T I O N A L I N C O M E , E X P E N D I T U R E A N D P R O D U C T • 5 2 0 6 . 0 • J U N 2 0 1 3 53
(c) Interest flows are adjusted for the cost of financial intermediation servicesindirectly measured. See Explanatory Notes.
(d) Includes interest payable and rent payable on natural assets.(e) Includes financial intermediation services indirectly measured relating to
deposits and consumer debt interest.(f) Net saving is derived as a balancing item.
(a) Includes non-profit institutions serving households and unincorporatedenterprises.
(b) Includes investment income of insurance enterprises, superannuation fundsand investment funds attributable to policyholders and imputed interest ongovernment unfunded superannuation arrangements.
331 174328 702326 498324 209320 745316 670312 651309 430306 467Total use of gross income
HOUSEHOLD INCOME ACCOUNT (a) , Cur ren t pr ices : Trend35
54 A B S • A U S T R A L I A N N A T I O N A L A C C O U N T S : N A T I O N A L I N C O M E , E X P E N D I T U R E A N D P R O D U C T • 5 2 0 6 . 0 • J U N 2 0 1 3
(c) Interest flows are adjusted for the cost of financial intermediation servicesindirectly measured. See Explanatory Notes.
(d) Includes interest payable and rent payable on natural assets.(e) Includes financial intermediation services indirectly measured relating to
deposits and consumer debt interest.(f) Net saving is derived as a balancing item.
(a) Includes non-profit institutions serving households and unincorporatedenterprises.
(b) Includes investment income of insurance enterprises, superannuation fundsand investment funds attributable to policyholders and imputed interest ongovernment unfunded superannuation arrangements.
331 521328 525326 114324 371321 983315 577312 104310 676304 988Total use of gross income
HOUSEHOLD INCOME ACCOUNT (a) , Cur ren t pr ices : Seasona l l y Adjus ted36
A B S • A U S T R A L I A N N A T I O N A L A C C O U N T S : N A T I O N A L I N C O M E , E X P E N D I T U R E A N D P R O D U C T • 5 2 0 6 . 0 • J U N 2 0 1 3 55
(b) Net saving is derived as a balancing item.— nil or rounded to zero (including null cells)(a) Includes land rent and royalties on mineral leases and native timber tracts.
121 873120 184118 660117 482116 292114 802113 028110 806108 315Total use of gross income
44 06443 64343 08442 34741 30440 22439 46239 09938 813Taxes on production and imports8 0367 9347 8317 7307 6307 5317 4327 3327 231Gross operating surplus
Primary income receivableIncome
$m$m$m$m$m$m$m$m$m
JunMarDecSepJunMarDecSepJun
2012–132011–122010–11
GENERAL GOVERNMENT INCOME ACCOUNT, Cur ren t pr ices : Trend37
56 A B S • A U S T R A L I A N N A T I O N A L A C C O U N T S : N A T I O N A L I N C O M E , E X P E N D I T U R E A N D P R O D U C T • 5 2 0 6 . 0 • J U N 2 0 1 3
(b) Net saving is derived as a balancing item.— nil or rounded to zero (including null cells)(a) Includes land rent and royalties on mineral leases and native timber tracts.
122 401119 960118 318117 635116 475114 807112 587111 523108 160Total use of gross income
44 44343 41243 14142 79040 83940 50239 22939 12038 817Taxes on production and imports8 0397 9337 8307 7307 6317 5317 4317 3347 231Gross operating surplus
Primary income receivableIncome
$m$m$m$m$m$m$m$m$m
JunMarDecSepJunMarDecSepJun
2012–132011–122010–11
GENERAL GOVERNMENT INCOME ACCOUNT, Cur ren t pr ices : Seasona l l y Adjus ted38
A B S • A U S T R A L I A N N A T I O N A L A C C O U N T S : N A T I O N A L I N C O M E , E X P E N D I T U R E A N D P R O D U C T • 5 2 0 6 . 0 • J U N 2 0 1 3 57
58 A B S • A U S T R A L I A N N A T I O N A L A C C O U N T S : N A T I O N A L I N C O M E , E X P E N D I T U R E A N D P R O D U C T • 5 2 0 6 . 0 • J U N 2 0 1 3
(c) For definitions see Glossary.(d) Change on preceding quarter.
. . not applicable(a) Reference year for chain volume measures is 2010–11.(b) Reference year for implicit price deflators is 2010–11.
0.80.30.30.10.10.51.11.61.5Average non-farm compensation per employee (%)
2.70.70.70.60.71.11.61.91.9Non-farm compensation of employees (%)
1.10.40.40.20.20.51.01.51.6Average compensation per employee (%)
Income related measures
–2.1–2.4–1.8–0.42.63.84.24.65.0New Private business investment–current prices (%)
–2.0–2.4–1.8–0.42.63.73.94.55.2New Private business investment–chain volume(a) (%)
A B S • A U S T R A L I A N N A T I O N A L A C C O U N T S : N A T I O N A L I N C O M E , E X P E N D I T U R E A N D P R O D U C T • 5 2 0 6 . 0 • J U N 2 0 1 3 59
(b) Reference year for implicit price deflators is 2010–11.(c) For definitions see Glossary.(d) Change on preceding quarter.
. . not applicable— nil or rounded to zero (including null cells)(a) Reference year for chain volume measures is 2010–11.
0.80.3–0.10.8–0.2–0.12.01.11.6Average non-farm compensation per employee (%)
2.61.00.11.30.10.82.41.32.0Non-farm compensation of employees (%)
1.20.5–0.10.9–0.1–0.32.01.01.7Average compensation per employee (%)
Income related measures
–1.5–1.0–4.50.43.72.96.10.410.5New Private business investment–current prices (%)
–1.3–1.2–4.30.44.02.65.9—11.1New Private business investment–chain volume(a) (%)
SELECTED ANALYT ICAL SERIES, Seasona l l y ad jus ted41
60 A B S • A U S T R A L I A N N A T I O N A L A C C O U N T S : N A T I O N A L I N C O M E , E X P E N D I T U R E A N D P R O D U C T • 5 2 0 6 . 0 • J U N 2 0 1 3
(a) Reference year for chain volume measures is 2010–11.— nil or rounded to zero (including null cells)
EXPENDITURE ON GDP, Cha in volume measures(a) : Annua l42
A B S • A U S T R A L I A N N A T I O N A L A C C O U N T S : N A T I O N A L I N C O M E , E X P E N D I T U R E A N D P R O D U C T • 5 2 0 6 . 0 • J U N 2 0 1 3 61
EXPENDITURE ON GDP, Cur ren t pr i ces : Annua l43
62 A B S • A U S T R A L I A N N A T I O N A L A C C O U N T S : N A T I O N A L I N C O M E , E X P E N D I T U R E A N D P R O D U C T • 5 2 0 6 . 0 • J U N 2 0 1 3
(a) Includes contributions to superannuation made by employers and payments ofworkers' compensation premiums.
4 608–23———————Statistical discrepancy (I)150 477139 891135 008128 023119 270123 044115 292107 005101 254Taxes less subsidies on production and imports
A B S • A U S T R A L I A N N A T I O N A L A C C O U N T S : N A T I O N A L I N C O M E , E X P E N D I T U R E A N D P R O D U C T • 5 2 0 6 . 0 • J U N 2 0 1 3 63
(c) Includes water transport.(d) Excludes ownership of dwellings.
— nil or rounded to zero (including null cells)(a) At basic prices.(b) Reference year for chain volume measures is 2010–11.
INDUSTRY GROSS VALUE ADDED (a) , Cha in Volume Measures (b ) : Annua l45
64 A B S • A U S T R A L I A N N A T I O N A L A C C O U N T S : N A T I O N A L I N C O M E , E X P E N D I T U R E A N D P R O D U C T • 5 2 0 6 . 0 • J U N 2 0 1 3
(b) Change on preceding quarter.— nil or rounded to zero (including null cells)(a) Reference year for chain volume measures is 2010–11.
–0.10.1—–0.10.1–0.10.1–0.1Gross domestic product
0.3–0.2—–0.2—–0.10.2—less Imports of goods and services–0.2–0.4–0.4–0.10.4–0.1–0.2–0.1Exports of goods and services
0.10.1—–0.10.1—0.1–0.1Gross national expenditure
0.10.1——————Domestic final demand
0.10.4—0.2–0.10.1——Total gross fixed capital formation
–1.13.0–7.38.2—1.3–0.2–0.5Total public gross fixed capital formation
0.5–0.31.8–1.6–0.1–0.2–0.10.3Total private gross fixed capital formation
——–0.10.1–0.1——0.1Intellectual property products1.40.1—–0.2–0.2–0.10.1—Cultivated biological resources0.8–0.2–0.20.3–0.1—–0.10.2Machinery and equipment0.6–0.64.9–4.5–0.3–0.4–0.20.6Non-dwelling construction0.7–0.10.4–0.70.7–0.20.2–0.5Ownership transfer costs0.10.4–0.20.1—–0.1–0.10.1Dwellings
Private gross fixed capital formation
0.10.1—–0.1—0.10.1–0.1Total final consumption expenditure
0.10.1—–0.2——0.1–0.1Households0.2—0.2–0.2——0.1–0.1General government
Final consumption expenditure
MarDecSepJunMarDecSepJun
2012–132011–122010–11
EXPENDITURE ON GDP, Cha in volume measures (a ) —Rev is ions to percentage changes(b) :
Seasona l l y ad jus ted46
A B S • A U S T R A L I A N N A T I O N A L A C C O U N T S : N A T I O N A L I N C O M E , E X P E N D I T U R E A N D P R O D U C T • 5 2 0 6 . 0 • J U N 2 0 1 3 65
— nil or rounded to zero (including null cells)
56195–80–283112–316121–200Gross domestic product
–343–211–27438–26–223–138112Statistical discrepancy (I)164–145–69764–931931Taxes less subsidies on production and imports
151–20225–1 602–177–725194Total private gross fixed capital formation
–13–10–76–6–1—6Intellectual property products1222—————Cultivated biological resources95–55333–34–4616Machinery and equipment
–64–21227–1 644–150–534666Non-dwelling construction29–6—–1220–7—–7Ownership transfer costs9379–214–7–6—13Dwellings
Private gross fixed capital formation
59031–160–239246–16–2–156Total final consumption expenditure
99–121–278–98105–4223–65Households491152118–14114226–26–90General government
Final consumption expenditure
EX P E N D I T U R E ON GD P
$m$m$m$m$m$m$m$m
MarDecSepJunMarDecSepJun
2012–132011–122010–11
GROSS DOMESTIC PRODUCT ACCOUNT, Cur ren t pr i ces —Rev is ions : Seasona l l y ad jus ted47
66 A B S • A U S T R A L I A N N A T I O N A L A C C O U N T S : N A T I O N A L I N C O M E , E X P E N D I T U R E A N D P R O D U C T • 5 2 0 6 . 0 • J U N 2 0 1 3
(b) Reference year for chain volume measures is 2010–11.(c) Excludes ownership of dwellings.
— nil or rounded to zero (including null cells)(a) At basic prices.
–0.10.1—–0.10.1–0.10.1–0.1Gross domestic product
0.20.5–0.60.3–0.40.2–0.30.2Taxes less subsidies on products
–0.10.10.1–0.10.1–0.10.1–0.1Gross value added at basic prices
————————Ownership of dwellings..–1.10.10.2–0.30.1—0.1–0.2Other servicesS0.60.1–0.10.1–0.1———Arts and recreation servicesR
–0.1———0.1———Health care and social assistanceQ————————Education and trainingP
–0.20.20.30.20.20.2—0.1Public administration and safetyO0.2——–0.40.4——–0.3Administrative and support servicesN
–0.80.1–0.10.1–0.10.1–0.10.2Professional, scientific and technical servicesM–0.30.10.5–0.6—0.10.3–0.3Rental, hiring and real estate services(c)L0.20.10.2–0.50.4–0.10.1–0.3Financial and insurance servicesK0.80.20.3–0.2–0.20.10.2–0.1Information media and telecommunicationsJ
–1.20.20.2–0.2—0.10.1–0.1Transport, postal and warehousingI–0.4–0.1–0.20.20.1–0.2–0.10.2Accommodation and food servicesH–0.3——0.1————Retail tradeG0.6–0.10.2–0.1——0.1–0.1Wholesale tradeF0.5–0.10.2–0.30.2–0.10.1–0.2ConstructionE
–0.2–0.1–0.10.1–0.10.1—0.1Electricity, gas, water and waste servicesD–1.10.1–0.20.1–0.10.1–0.10.1ManufacturingC
—0.9–0.3–0.10.2–0.40.30.4MiningB2.8—0.6–0.6—–2.13.0–2.6Agriculture, forestry and fishingA
MarDecSepJunMarDecSepJun
2012–132011–122010–11
INDUSTRY GROSS VALUE ADDED (a) , Cha in volume measures (b ) —Rev is ions to percentage
changes : Seasona l l y ad jus ted48
A B S • A U S T R A L I A N N A T I O N A L A C C O U N T S : N A T I O N A L I N C O M E , E X P E N D I T U R E A N D P R O D U C T • 5 2 0 6 . 0 • J U N 2 0 1 3 67
4 Estimating the national accounts components for a period of less than one year
presents special problems. It is often difficult to adhere strictly to definitions used in
annual estimates when deriving quarterly ones. This is particularly the case for the
quarterly measure of income, because it is not always possible to match the volume of
production for a quarter with the cost incurred in that production. Difficulties are also
encountered in obtaining detailed data for short periods and in preparing consistent
estimates from different sources with different accounting procedures and periods.
Furthermore, the quarter–to–quarter growth in seasonally adjusted terms is very
sensitive to the timing of recording a transaction. If the recording of a transaction is
delayed by one quarter, seasonally adjusted movements will be distorted for three
consecutive quarters. All these problems affect the accuracy of the current price and
chain volume estimates and should be taken into account in interpreting the estimates.
5 The majority of the estimates in the quarterly national accounts are based on the
results of sample surveys. Many of the results of these surveys are released in the period
leading up to the release of the quarterly accounts thus providing users with a guide to
likely movements in key national accounting aggregates. In a national accounts context,
these various pieces of information are referred to as partial indicators. Usually there are
differences in concept and scope between the national accounts series and the relevant
partial indicator which means that the movements in the partial indicator will not always
be identical to the national accounts series movement. However, in general the
AC C U R A C Y OF QU A R T E R L Y
ES T I M A T E S
2 Australia's national accounts statistics are compiled in accordance with international
standards contained in the System of National Accounts. These standards have recently
been updated and are presented in the System of National Accounts, 2008 (SNA08).
Australia's application of these SNA standards is described in Australian System of
National Accounts: Concepts, Sources and Methods (cat. no. 5216.0). It is available on
the ABS web site <http://www.abs.gov.au>. This publication outlines major concepts
and definitions, describes sources of data and methods used to derive annual and
quarterly estimates for major aggregates at current prices and in chain volume terms, and
discusses the accuracy and reliability of the national accounts. In addition, it includes
documentation on input–output tables, financial accounts, capital stock, productivity
measures, balance sheets, and state accounts. The current version of this product reflects
the System of National Accounts, 2008 (SNA08) concepts and a number of references to
data sources and methods are out of date. A revised Concepts, Sources and Methods
product was released on 2 July 2012.
3 While national estimates are based on the concepts and conventions embodied in
SNA08, no such standard is available for sub–national (regional/state) accounts. In the
main, the national concepts are applicable to state accounts, but there remain a number
of conceptual and measurement issues that either do not apply or are insignificant at the
national level. Information on some of the more important conceptual, methodological
and data issues relating to annual and quarterly estimates by state is provided in Chapter
28 of the Concepts, Sources and Methods.
CO N C E P T S , SO U R C E S AN D
ME T H O D S
1 This publication contains estimates of gross domestic product (GDP) and its
components, components of state final demand, the national income account, the
national capital account and supporting series. Quarterly estimates are provided for the
latest nine quarters. For the most part, these estimates are provided in trend and
seasonally adjusted terms. Where trend and seasonally adjusted estimates are not
available, original data are provided. Annual estimates, on an original basis, are provided
for the key statistics for the past nine years. The List of Time Series Spreadsheets, set out
in the Appendix, shows the full range of data provided. The full quarterly time series,
including all original data on a quarterly basis (both national and state), are available
from the Australian Bureau of Statistics (ABS) website <http://www.abs.gov.au>.
I N T R O D U C T I O N
68 A B S • A U S T R A L I A N N A T I O N A L A C C O U N T S : N A T I O N A L I N C O M E , E X P E N D I T U R E A N D P R O D U C T • 5 2 0 6 . 0 • J U N 2 0 1 3
E X P L A N A T O R Y N O T E S
11 Data that are affected by seasonal factors are adjusted to remove the effects of these
factors. Three important points should be noted here:
! The methods used in seasonal adjustment do not force the sum of the adjusted
current price estimates for each quarter of a year to equal the original annual total.
! Where chain volume estimates have no apparent seasonality in their implicit price
deflators, the estimates are adjusted using the corresponding factors for current
price estimates.
! A special method, known as the pseudo–additive method, has been used to adjust
the output of cereal crops. This is necessary to account for the fact that there is no
cereal output in some quarters.
12 Seasonally adjusted chain volume figures are calculated from seasonally adjusted
figures expressed in the prices of the previous year. As with original data, the seasonally
adjusted chain volume measures are benchmarked to annual original estimates. As a
consequence, the seasonally adjusted chain volume measures sum to the corresponding
annual original figures – unlike their current price counterparts.
Seasonal Adjustment
10 The general methods for deriving seasonally adjusted and trend estimates are
described in Appendix 3 of Australian National Accounts: Concepts, Sources and
Methods, 2012 (cat. no. 5216.0).
SE A S O N A L L Y AD J U S T E D AN D
TR E N D ES T I M A T E S
9 Most figures are subject to revision as more complete and accurate information
becomes available. The revisions are of two types: those made to recent quarters and
those made as a consequence of a redistribution across all quarters within a year
following revisions to annual totals.
RE V I S I O N S
movements should be similar. To ensure a reasonable level of consistency between the
partial indicators and the national accounts series and hence present a common
understanding of recent economic developments, the national accounts area liaises with
the relevant survey areas and provides feedback regarding data quality and data
coherence. This may result in adjustments being made by survey areas to their collected
data prior to their release. The objective use of the national accounts framework to
provide data coherence across all ABS economic statistics ensures that a common
understanding of recent economic developments is presented.
6 The state estimates generally represent dissections of quarterly estimates published
for Australia in this publication. Therefore, they will reflect any inaccuracies in those
estimates as well as inaccuracies introduced by the particular conceptual, methodological
and data problems inherent in the allocation of Australian estimates to states and
territories. As such, the degree of accuracy and reliability will necessarily be lower than
that for the counterpart Australian estimates.
7 Estimates for compensation of employees, household final consumption expenditure
and private gross fixed capital formation are based on the results of sample surveys. By
their nature, survey results become less accurate as they are disaggregated (for example
into states and/or industries). Generally, the ABS surveys used to derive these aggregates
are designed to provide accurate estimates at the Australian total level and individual
state estimates that are less accurate but still of acceptable quality. However, it should be
noted that relative standard errors are generally higher for the smaller states and
territories than they are for the larger states. This may result in greater volatility in the
quarterly estimates for the smaller states and two territories.
8 Estimates of government final consumption expenditure, and general government
and public enterprise gross fixed capital formation can be substantially affected by the
indicators chosen to apportion the Commonwealth government component to states
and territories. Care is required when interpreting these estimates.
AC C U R A C Y OF QU A R T E R L Y
ES T I M A T E S continued
A B S • A U S T R A L I A N N A T I O N A L A C C O U N T S : N A T I O N A L I N C O M E , E X P E N D I T U R E A N D P R O D U C T • 5 2 0 6 . 0 • J U N 2 0 1 3 69
E X P L A N A T O R Y N O T E S continued
19 GDP is derived by three approaches: the income approach (I), the expenditure
approach (E) and the production approach (P). A description of each approach is
provided in the following paragraphs. While each measure should, conceptually,
produce the same estimate of GDP, if the three measures are compiled independently
using different data sources, then different estimates of GDP result. The ABS aligns the
estimates of GDP annually by balancing them in supply and use tables. These tables have
been compiled from 1994–95, up to the year preceding the latest complete financial year.
Balancing in supply and use tables ensures that the same estimate of GDP is obtained
from the three approaches. Annual estimates using the I, E and P approaches are
identical for the years for which these tables are compiled. For years balanced using
supply and use tables, quarterly GDP is benchmarked to annual GDP. However, the
three estimates of GDP can be different for any given quarter. The annual GDP estimate
GR O S S DO M E S T I C PR O D U C T
(G D P )
18 For trend and seasonally adjusted series, the sum of the states and territories
generally does not equal the corresponding estimate for 'total Australia', nor are the
quarter–to–quarter movements identical. On a few occasions, these differences have
been significant, particularly for the seasonally adjusted series. This reflects both the
shorter span of data available for seasonal analysis at the state level and the fact that
seasonal analysis is generally carried out at a more aggregated level than for the 'total
Australia' series. The state and territory trend and seasonally adjusted series are less
accurate than the Australian data. However, as the state and territory time series
lengthen, the quarterly movements in the sum of the state estimates should more closely
match those in the Australian series.
State and terr i tory versus
Austral ian ser ies
13 Given the qualifications regarding the accuracy and reliability of the quarterly
national accounts, the ABS considers that trend estimates provide the best guide to the
underlying movements, and are more suitable than either the seasonally adjusted or
original data for most business decisions and policy advice.
14 A trend estimate is obtained by removing the irregular component from the
seasonally adjusted series. For estimates in this publication, it is calculated using a
centred 7–term Henderson moving average of the seasonally adjusted series. The
procedure is designed to minimise distortions in the trend level, turning point shape and
timing of turning points. Estimates for the three most recent quarters cannot be
calculated using this centred average method; instead an asymmetric average is used.
This can lead to revisions in the trend estimates for the last three quarters when data
become available for later quarters, even if none of the original data for earlier quarters
has changed.
15 The higher the 'irregular' component in a series, then the greater the likelihood
that trend estimates for the latest quarters will be revised as more observations become
available. However, it is important to note that this does not make the trend series
inferior to the seasonally adjusted or original series. In fact, in such cases the effect of the
irregular component on overall movements is likely to be even more in the seasonally
adjusted and the original estimates than in the trend series.
16 Trend estimates for aggregates such as GDP are derived directly, rather than as the
sum of components. As a result, the sum of the trend estimates of individual
components of a particular aggregate will not sum to the overall trend estimate of the
aggregate for the latest three quarters. This approach provides higher quality trend
estimates for key aggregates, particularly GDP.
17 For more information about ABS procedures for deriving trend estimates and an
analysis of the advantage of using them over alternative techniques for monitoring
trends, see Information Paper: A Guide to Interpreting Time Series – Monitoring
Trends, 2003 (cat. no. 1349.0) or contact Time Series Analysis on (02) 6252 6345 or by
70 A B S • A U S T R A L I A N N A T I O N A L A C C O U N T S : N A T I O N A L I N C O M E , E X P E N D I T U R E A N D P R O D U C T • 5 2 0 6 . 0 • J U N 2 0 1 3
E X P L A N A T O R Y N O T E S continued
26 In the national accounts, estimates are made for the output of banks and similar
institutions who produce services through the provision of deposit and loan services.
Often there is no single explicit charge for these services and instead the relevant
financial institutions set interest rates such that a service margin can be earned. Thus,
interest rates on loans are higher than would otherwise be the case if there were no
service element provided and interest rates on deposits are lower than would otherwise
be the case.
27 In order to appropriately account for this service component the output produced
by these financial institutions is shown as being consumed by Households (includes
unincorporated enterprises and private non profit institutions serving households),
Corporations, and General government. In the sector income accounts the effect of
F I N A N C I A L IN T E R M E D I A T I O N
SE R V I C E S
24 GDP using the production approach is derived as the sum of gross value added for
each industry, at basic prices, plus taxes less subsidies on products. Basic values
represent the amounts received by producers, including the value of any subsidies on
products, but before any taxes on products. The difference between the sum over all
industries of gross value added at basic prices, and GDP at market (or purchasers')
prices, is the value of taxes less subsidies on products.
25 In this publication, only volume estimates compiled using the production approach
have been shown. These estimates are derived by extrapolating annual volume measures
using various indicators. The information necessary to compile comprehensive current
price estimates using the production approach is not available quarterly.
PRODUCTION APPROACH (P)
23 GDP using the expenditure approach is derived as the sum of all final expenditures,
changes in inventories and exports of goods and services less imports of goods and
services. Volume estimates are derived for each of the components as well as for their
sum.
EXPENDITURE APPROACH (E)
22 GDP using the income approach is derived as the sum of compensation of
employees, gross operating surplus, gross mixed income and taxes less subsidies on
production and imports. Volume estimates are derived at the total GDP level by deflating
current price estimates by the implicit price deflator from the expenditure approach.
INCOME APPROACH (I)
produced by balancing using supply and use tables forms the benchmark for the
production of quarterly GDP going forward. Quarterly GDP is compiled in chain volume
terms using all three approaches. The headline measure of GDP is a simple average of
the three separate measures. It is labelled GDP(A), with "A" denoting "average".
20 Prior to 1994–95 quarterly and annual estimates using each approach are based on
independent sources, and there are usually differences between the I, E and P estimates.
For these periods, a single estimate of GDP has been compiled. In chain volume terms,
GDP is derived by averaging the chain volume estimates obtained from each of the three
independent approaches. The current price estimate of GDP is obtained by reflating the
average chain volume estimate by the implicit price deflator derived from the
expenditure–based estimates.
21 As a result of the above methods:
! There is no statistical discrepancy for annual estimates from 1994–95 up to the year
prior to the latest complete financial year, in either current price or volume terms,
except for estimates released in the June quarter where discrepancies will exist for
the latest two complete financial years.
! For years prior to 1994–95, and for all quarters, statistical discrepancies exist
between estimates based on the I, E and P approaches and the single estimate of
GDP, in both current prices and volume terms. These discrepancies are shown in
the relevant tables.
GR O S S DO M E S T I C PR O D U C T
(G D P ) continued
A B S • A U S T R A L I A N N A T I O N A L A C C O U N T S : N A T I O N A L I N C O M E , E X P E N D I T U R E A N D P R O D U C T • 5 2 0 6 . 0 • J U N 2 0 1 3 71
E X P L A N A T O R Y N O T E S continued
29 In addition to the publications already mentioned, others of interest include:
annual Australian System of National Accounts (cat. no. 5204.0)
annual Australian National Accounts: State Accounts (cat. no. 5220.0)
quarterly Australian National Accounts: Financial Accounts (cat. no. 5232.0)
30 Current publications and other products released by the ABS are freely available
from the ABS website <http://www.abs.gov.au>, the website contains a link to the daily
Release Advice which details products to be released in the weeks (months) ahead. A
National Accounts theme page is available on the website, select: Themes – Economy –
National Accounts. This page provides direct links to all national accounts related data
and publications, recent national accounts changes and forthcoming events, links to
relevant websites and a range of other information about the Australian National
Accounts.
RE L A T E D PU B L I C A T I O N S
allocating the output to consuming sectors is that part of the interest flow is deemed a
payment of service and the balance is shown as interest such that the net effect on saving
is zero.
28 In interpreting the income accounts it is therefore necessary to regard the interest
flow series as being a flow without a service element – i.e. a pure interest flow. In the
case of loans the interest flow that is shown will be less than the observed interest
payment made to the financial institution. In the case of deposits the interest flow that is
shown will be greater than the observed interest payment made by the financial
institution. For further information users should consult the Australian System of
National Accounts: Concepts, Sources and Methods (cat. no. 5216.0).
F I N A N C I A L IN T E R M E D I A T I O N
SE R V I C E S continued
72 A B S • A U S T R A L I A N N A T I O N A L A C C O U N T S : N A T I O N A L I N C O M E , E X P E N D I T U R E A N D P R O D U C T • 5 2 0 6 . 0 • J U N 2 0 1 3
E X P L A N A T O R Y N O T E S continued
Original. Social Assistance Benefits Payments, Current prices19.
Trend, seasonally adjusted and original.39 Taxes, Current prices18.
Original. State and Local General Government Income Account,Current prices
17.
Original. National General Government Income Account, Currentprices
16.
Trend, seasonally adjusted and original.37, 38 General Government Income Account, Current prices15.
Trend, seasonally adjusted and original.35, 36 Household Income Account, Current prices14.
Trend, seasonally adjusted and original.34 External Account, Current prices13.
Trend, seasonally adjusted and original.33 National Capital Account, Current prices12.
Trend, seasonally adjusted and original.32 National Income Account, Current prices11.
Trend, seasonally adjusted and original.23 Agricultural Income, Current prices10.
Volume and current price data (trend , seasonally adjusted &original).
22 Changes in Inventories9.
Volume and current price data (trend , seasonally adjusted &original).
20, 21 Household Final Consumption Expenditure (HFCE)8.
Trend, seasonally adjusted and original Income from GDP.18, 19, 47 Income from Gross Domestic Product (GDP), Current prices7.
Trend, seasonally adjusted and original data for industry GVAincluding percentage changes (trend & seasonally adjusted), revisionsto percentage changes and contributions to growth (seasonallyadjusted).
14, 15,16, 17, 48
Gross Value Added by Industry, Chain volume measures6.
Seasonally adjusted and percentage changes (seasonally adjusted).12, 13 Expenditure on Gross Domestic Product (GDP), Implicit pricedeflators
5.
Original and percentage changes (original).10, 11 Expenditure on Gross Domestic Product (GDP), Chain priceindexes
4.
Trend, seasonally adjusted and original data for expenditure on GDPincluding revisions (seasonally adjusted).
9, 47 Expenditure on Gross Domestic Product (GDP), Current prices3.
Trend, seasonally adjusted and original data for expenditure on GDPincluding percentage changes, revisions to percentage changes andcontributions to growth.
4, 5, 6, 7,8, 46
Expenditure on Gross Domestic Product (GDP), Chain volumemeasures
2.
Trend, seasonally adjusted and original data for key aggregatesincluding percentage changes and indexes.
1, 2 Key National Accounts Aggregates1.
Type
of
data
Includes
table(s)
from pdf
Electronic table
(time series
spreadsheet)
A B S • A U S T R A L I A N N A T I O N A L A C C O U N T S : N A T I O N A L I N C O M E , E X P E N D I T U R E A N D P R O D U C T • 5 2 0 6 . 0 • J U N 2 0 1 3 73
A P P E N D I X T I M E S E R I E S S P R E A D S H E E T S
Annual indexes. Indexes of Industrial Production, Annual39.
Trend, seasonally adjusted and original indexes. Unit Labour Costs38.
Quarterly indexes. Indexes of Industrial Production37.
Annual current price data. External Account, Current prices, Annual36.
Annual current price data. National Capital Account, Current prices, Annual35.
Annual current price data. National Income Account, Current prices, Annual34.
Annual volume measures.45 Industry Gross Value Added, Chain volume measures, Annual33.
Annual volume and current price data with chain price indexes andIPD's.
42, 43 Expenditure on Gross Domestic Product (GDP), Chain volumemeasures and Current prices, Annual
32.
Annual44 Income from GDP and Changes in Inventories, Annual31.
Annual3 Key Aggregates and analytical series, Annual30.
Trend, seasonally adjusted and original, and revisions to percentagechanges (seasonally adjusted).
State Final Demand, Detailed Components: AustralianCapital Territory
29.
Trend, seasonally adjusted and original, and revisions to percentagechanges (seasonally adjusted).
State Final Demand, Detailed Components: Northern Territory28.
Trend, seasonally adjusted and original, and revisions to percentagechanges (seasonally adjusted).
State Final Demand, Detailed Components: Tasmania27.
Trend, seasonally adjusted and original, and revisions to percentagechanges (seasonally adjusted).
State Final Demand, Detailed Components: WesternAustralia
26.
Trend, seasonally adjusted and original, and revisions to percentagechanges (seasonally adjusted).
State Final Demand, Detailed Components: South Australia25.
Trend, seasonally adjusted and original, and revisions to percentagechanges (seasonally adjusted).
State Final Demand, Detailed Components: Queensland24.
Trend, seasonally adjusted and original, and revisions to percentagechanges (seasonally adjusted).
State Final Demand, Detailed Components: Victoria23.
Trend, seasonally adjusted and original, and revisions to percentagechanges (seasonally adjusted).
State Final Demand, Detailed Components: New SouthWales
22.
Trend and seasonally adjusted, all states24, 25,26, 27,28, 29,30, 31
State Final Demand, Summary Components by State: Chainvolume measures
21.
Trend, seasonally adjusted and original.40, 41 Selected Analytical Series20.
Type
of
data
Includes
table(s)
from pdf
Electronic table
(time series
spreadsheet)
74 A B S • A U S T R A L I A N N A T I O N A L A C C O U N T S : N A T I O N A L I N C O M E , E X P E N D I T U R E A N D P R O D U C T • 5 2 0 6 . 0 • J U N 2 0 1 3
A P P E N D I X T I M E S E R I E S S P R E A D S H E E T S continued
The total remuneration, in cash or in kind, payable by an enterprise to an employee inreturn for work done by the employee during the accounting period. It is furtherclassified into two sub–components: wages and salaries; and employers’ socialcontributions. Compensation of employees is not payable in respect of unpaid workundertaken voluntarily, including the work done by members of a household within anunincorporated enterprise owned by the same household. Compensation of employeesexcludes any taxes payable by the employer on the wage and salary bill (e.g. payroll tax).
Compensation of employees
Obtained after adjusting the increase in book value of inventories by the inventoryvaluation adjustment. The need for an inventory valuation adjustment arises because thechanges in the value of inventories as calculated from existing business accountingrecords do not meet national accounting requirements. For national accountingpurposes, physical changes in inventories should be valued at the prices current at thetimes when the changes occur. The inventory valuation adjustment is the differencebetween the change in (book) value of inventories and the physical changes valued atcurrent prices. The physical changes at average current quarter prices are calculated byapplying average quarterly price indexes to the changes in various categories ofinventories in volume terms.
Changes in inventories held byenterprises and general
government
Annually–reweighted chain Laspeyres volume indexes referenced to the current pricevalues in a chosen reference year (i.e. the year when the quarterly chain volumemeasures sum to the current price annual values). Chain Laspeyres volume measures arecompiled by linking together (compounding) movements in volumes, calculated usingthe average prices of the previous financial year, and applying the compoundedmovements to the current price estimates of the reference year. Quarterly chain volumeestimates are benchmarked to annual chain volume estimates, so that the quarterlyestimates for a financial year sum to the corresponding annual estimate.
Generally, chain volume measures are not additive. In other words, component chainvolume measures do not sum to a total in the way original current price components do.In order to minimize the impact of this property, the ABS uses the latest base year as thereference year. By adopting this approach, additivity exists for the quarters following thereference year and non–additivity is relatively small for the quarters in the reference yearand the quarters immediately preceding it. The latest base year and the reference yearwill be advanced one year with the release of the September quarter issue of thispublication. A change in reference year changes levels but not growth rates, althoughsome revision to recent growth rates can be expected because of the introduction of amore recent base year (and revisions to the current price estimates underlying the chainvolume measures).
Chain volume measures
Annually–reweighted chain Laspeyres price indexes referenced to the same year as thechain volume measures. They can be thought of as a series of indexes measuring pricechange from a base year to quarters in the following year using current price values inthe base year as weights, linked together to form a continuous time series. In otherwords, chain price indexes are constructed in a similar fashion to the chain volumeindexes. Quarterly chain price indexes are benchmarked to annual chain price indexes inthe same way as their chain volume counterparts. Unlike implicit price deflators, chainprice indexes measure only the impact of price change.
Chain price indexes
The amount receivable by the producer from the purchaser for a unit of a good orservice produced as output minus any tax payable, and plus any subsidy receivable, onthat unit as a consequence of its production or sale.
Basic price
Calculated as total compensation of employees divided by the number of wage and salaryearners from the monthly Labour Force Survey.
Average compensation peremployee
The income accruing from agricultural production during the year. It is equal to grossagricultural product at factor cost less consumption of fixed capital, compensation ofemployees, and net rent and interest payments.
Agricultural income
A B S • A U S T R A L I A N N A T I O N A L A C C O U N T S : N A T I O N A L I N C O M E , E X P E N D I T U R E A N D P R O D U C T • 5 2 0 6 . 0 • J U N 2 0 1 3 75
G L O S S A R Y
The ratio of the chain volume estimate of GDP to an estimate of the resident Australianpopulation. Population estimates use data published in the quarterly publication Australian Demographic Statistics (cat. no. 3101.0) and ABS projections.
GDP per capita
Is the total market value of goods and services produced in Australia within a givenperiod after deducting the cost of goods and services used up in the process ofproduction but before deducting allowances for the consumption of fixed capital. Thusgross domestic product, as here defined, is 'at market prices'. It is equivalent to grossnational expenditure plus exports of goods and services less imports of goods andservices. Farm GDP is that part of gross domestic product which arises from productionin agriculture. It is equivalent to the value added of ANZSIC 06 subdivision 01'Agriculture' plus taxes less subsidies on products primary to this subdivision. Non–farmGDP arises from production in all other industries.
Gross domestic product (GDP)
Gross household income less income tax payable, other current taxes on income, wealthetc., interest on dwellings, consumer debt interest, interest payable by unincorporatedenterprises, rent on natural assets, net non–life insurance premiums, social contributionfor workers' compensation and other current transfers payable by households.
Gross disposable income –households
Gross agricultural product at market prices. It is equivalent to gross value added ofagriculture at basic prices plus taxes less subsidies on products.
Farm GDP
See Imports to domestic sales ratio.Domestic sales
Estimates are valued at the prices of the period to which the observation relates. Forexample, estimates for 2007–08 are valued using 2007–08 prices. This contrasts to chainvolume measures where the prices used in valuation refer to the prices of a previousperiod.
Current prices
Includes such assets as orchard growth and livestock. The definition of orchard growth isany plant that can produce a marketable quantity of fruit for more than one year in whichthe grower intends to obtain a future benefit from the sale of the fruits borne. It caninclude trees, vines, bushes and shrubs. The costs to be capitalised as part of the value offruit and nut bearing plants are the establishment costs involved in planting the newnursery plant and then maintenance costs associated with making the plant grow.Livestock assets are classified as either fixed assets or inventories. Those livestock whichare used in production of other products (e.g. breeding stock, animals forentertainment, sheep for wool and dairy cattle) are fixed assets. Inventories cover allother livestock types and includes those animals raised for meat or other one–offproducts (e.g. leather).
Cultivated BiologicalResources
The contributions to growth for a given aggregate 'A' is calculated as:
100 * ((PYAt – PPA
t) / PPAt) x (PPA
t / PPGDPt)
Where:! PYA
t is the quantity of an aggregate in the current period, in previous period prices! PPA
t is the quantity of an aggregate in the previous period, in previous period prices! PPGDP
t is the current price value of GDP in the previous period
Additivity for contributions to growth exists for the years where the statisticaldiscrepancy is zero, effectively 1995–96 onwards, by using GDP expressed in the prices ofthe previous year. For the period 1986–87 to 1994–95, where the statistical discrepancy isnot zero, the result is close to additive but not exact because the statistical discrepancycannot be expressed in prices of the previous year. Additionally, quarterly contribution togrowth estimates will not add to GDP growth due to the existence of a statisticaldiscrepancy between the three quarterly measures of GDP.
Contributions to growth inGDP
The reduction in the value of fixed assets used in production during the accountingperiod resulting from physical deterioration, normal obsolescence or normal accidentaldamage. Unforeseen obsolescence, major catastrophes and the depletion of naturalresources are not taken into account.
Consumption of fixed capital
76 A B S • A U S T R A L I A N N A T I O N A L A C C O U N T S : N A T I O N A L I N C O M E , E X P E N D I T U R E A N D P R O D U C T • 5 2 0 6 . 0 • J U N 2 0 1 3
G L O S S A R Y continued
The hours worked by all labour engaged in the production of goods and services,including hours worked by civilian wage and salary earners, employers, self–employedpersons, persons working one hour or more without pay in a family business or on afarm, and members of the Australian defence forces.
Hours worked
The value of output at basic prices minus the value of intermediate consumption atpurchasers' prices. The term is used to describe gross product by industry and by sector.Basic prices valuation of output removes the distortion caused by variations in theincidence of commodity taxes and subsidies across the output of individual industries.
Gross value added
The operating surplus accruing to all enterprises, except unincorporated enterprises,from their operations in Australia. It is the excess of gross output over the sum ofintermediate consumption, compensation of employees, and taxes less subsidies onproduction and imports. It is calculated before deduction of consumption of fixedcapital, dividends, interest, royalties and land rent, and direct taxes payable, but afterdeducting the inventory valuation adjustment. Gross operating surplus is also calculatedfor general government and it equals general government's consumption of fixed capital.
Gross operating surplus
The aggregate value of gross primary incomes for all institutional sectors, including netprimary income receivable from non–residents. GNI was formerly called gross nationalproduct (GNP).
Gross national income (GNI)
The surplus or deficit accruing from production by unincorporated enterprises. Itincludes elements of both compensation of employees (returns on labour inputs) andoperating surplus (returns on capital inputs).
Gross mixed income ofunincorporated enterprises
Expenditure on new fixed assets plus net expenditure on second–hand fixed assets andincluding both additions and replacements. Also included is compensation of employeesand other costs paid by public corporations in connection with capital works undertakenon own account.
Gross fixed capital formation –public corporations
Expenditure on fixed assets broken down into dwellings, non–dwelling construction,machinery and equipment, cultivated biological assets, intellectual property productsand ownership transfer costs. The machinery and equipment category includes plant,machinery, equipment, vehicles, etc. Expenditure on repair and maintenance of fixedassets is excluded, being chargeable to the production account. Additions to fixed assetsare regarded as capital formation. Also included is compensation of employees and othercosts paid by private enterprise in connection with own–account capital formation.Expenditure on dwellings, non–dwelling construction, and machinery and equipment ismeasured as expenditure on new and second–hand assets, less sales of existing assets.Cultivated biological assets includes livestock and orchard growth. Along with Computersoftware, Mineral and petroleum exploration and Artistic originals, Research anddevelopment is now included in the intellectual property products asset type. Ownershiptransfer costs comprise of stamp duty, real estate agents' fees and sales commissions,conveyancing fees and miscellaneous government charges.
Gross fixed capital formation –private
Expenditure on new fixed assets plus net expenditure on second–hand fixed assetswhether for additions or replacements including defence weapons platforms that havean anticipated ongoing use (greater than one year). Expenditure on new roadworks (orupgrading existing roads) is included but expenditure on road repair and maintenance isclassified as government final consumption expenditure.
Gross fixed capital formation –general government
The ratio of the chain volume estimate of GDP to an estimate of hours worked. Hoursworked estimates are derived as the product of employment and average hours worked.
Movements in chain volume estimates of GDP per hour worked are commonlyinterpreted as changes in labour productivity. However, it should be noted that thesemeasures reflect not only the contribution of labour to changes in production per hourworked, but also the contribution of capital and other factors (such as managerialefficiency, economies of scale, etc.).
Gross domestic product perhour worked
A B S • A U S T R A L I A N N A T I O N A L A C C O U N T S : N A T I O N A L I N C O M E , E X P E N D I T U R E A N D P R O D U C T • 5 2 0 6 . 0 • J U N 2 0 1 3 77
G L O S S A R Y continued
Defined as:! non–dwelling construction
Private business investment
Gross domestic product less farm GDP.Non–farm GDP
The excess of net acquisition of financial assets in the rest of the world by residentinstitutional units over their net incurrence of liabilities in the rest of the world.
Net lending to non–residents
Calculated as GDP less consumption of fixed capital.Net domestic product
The ratio of national net saving to national net disposable income. National net saving iscalculated as national net disposable income less final consumption expenditure.National net disposable income is calculated as national gross disposable income lessconsumption of fixed capital.
National saving ratio
Calculated as the sum of the net saving of each of the resident sectors – households(includes unincorporated enterprises and private non–profit institutions servinghouseholds), non–financial corporations, financial corporations and general government.Also referred to as net saving.
National saving
With the introduction of ANZSIC06, the definition of those industries that constitute the'market' sector' has also changed. It is now defined to include all industries except forPublic administration and safety (O); Education and training (P); and Health care andsocial assistance (Q). The chain volume measure of the production of a group ofindustries referred to as the market sector is defined to be the chain volume estimate ofindustry gross value added of all industries less Divisions O, P and Q, less Ownership ofdwellings, plus taxes less subsidies on products attributable to the market sectorindustries.
Market sector
See Gross domestic product per hour worked.Labour productivity
Includes such assets as computer software, research and development, entertainment,literary or artistic originals, and mineral exploration intended to be used for more than ayear.
Intellectual property products
The numerator – imports – refers to imports of merchandise goods. The denominator –domestic sales – is defined as:! household final consumption expenditure on goods! plus private gross fixed capital formation: dwellings, non–dwelling construction, and
machinery and equipment! plus public gross fixed capital formation: dwellings, non–dwelling construction, and
machinery and equipment.
This ratio is calculated using current price estimates.
Imports to domestic sales ratio
Obtained by dividing a current price value by its real counterpart (the chain volumemeasure). When calculated from the major national accounting aggregates, such as grossdomestic product, implicit price deflators relate to a broader range of goods and servicesin the economy than that represented by any of the individual price indexes that arepublished by the ABS. Whereas the chain price indexes are chain Laspeyres indexes, theannual implicit price deflators are chain Paasche price indexes, i.e. each year–to–yearmovement is calculated using the current price value shares of the second of the twoyears to weight together the elemental price indexes.
Movements in implicit price deflators can be greatly affected by changes in the physicalcomposition of the aggregates and their components. For this reason, quarterly implicitprice deflators derived from seasonally adjusted or trend data are preferred to thosederived using original data.
Implicit price deflator
The ratio of household net saving to household net disposable income. Household netsaving is calculated as household net disposable income less household finalconsumption expenditure. Household net disposable income is calculated as householdgross disposable income less household consumption of fixed capital.
Household saving ratio
78 A B S • A U S T R A L I A N N A T I O N A L A C C O U N T S : N A T I O N A L I N C O M E , E X P E N D I T U R E A N D P R O D U C T • 5 2 0 6 . 0 • J U N 2 0 1 3
G L O S S A R Y continued
Subsidies payable per unit of a good or service. The subsidy may be a specific amount ofmoney per unit of quantity of a good or service, or it may be calculated ad valorem as aspecified percentage of the price per unit. A subsidy may also be calculated as thedifference between a specified target price and the market price actually paid by apurchaser. A subsidy on a product usually becomes payable when the product isproduced, sold or imported, but it may also become payable in other circumstances,
Subsidies on products
Calculated as the differences between aggregate incomes, expenditures, or industryproducts respectively and the single measure of GDP. For years in which a balancedsupply and use table is available to benchmark the national accounts, the same measureof GDP is obtained.
Statistical discrepancy (I), (E)and (P)
Calculated by:! taking real gross domestic income! deducting real incomes payable to the rest of the world! adding real incomes receivable from the rest of the world! deducting the volume measure of consumption of fixed capital.
Real incomes payable and receivable are calculated by dividing the nominal income flowsby the implicit price deflator for gross national expenditure. In the derivation of theaggregate all of the adjustments are made using the chain volume aggregation methodused to derive all of the ABS chain volume estimates.
Real net national disposableincome
Calculated by:! taking the volume measure of gross national expenditure (GNE)! adding exports of goods and services at current prices deflated by the implicit price
deflator for imports of goods and services! deducting the volume measure of imports of goods and services! adding the current price statistical discrepancy for GDP(E) deflated by the implicit
price deflator for GDP.
In the derivation of the aggregate all of the adjustments are made using the chainvolume aggregation method used to derive all of the ABS chain volume estimates.
Real gross domestic income
Calculated by adjusting real gross domestic income for the real impact of primary incomeflows (property income and labour income) to and from overseas.
Real gross national income
The amount paid by the purchaser, excluding any deductible tax, in order to takedelivery of a unit of a good or service at the time and place required by the purchaser.The purchaser’s price of a good includes any transport charges paid separately by thepurchaser to take delivery at the required time and place.
Purchasers' price
The denominator – total sales – is defined as:! household final consumption expenditure on goods! plus private gross fixed capital formation: dwellings, non–dwelling construction, and
machinery and equipment! plus public gross fixed capital formation: dwellings, non–dwelling construction, and
machinery and equipment! plus exports of goods.
This ratio is calculated using current price estimates.
Private non–farm inventoriesto total sales ratio
! plus machinery and equipment! plus cultivated biological resources! plus intellectual property products.
Second hand asset sales by the public sector to private corporations are included inprivate business investment in the components non–dwelling construction andmachinery and equipment. As the public sector also sells secondhand assets to thehousehold sector and to the external sector, not all secondhand asset sales by the publicsector will be included in private business investment.
Private business investmentcontinued
A B S • A U S T R A L I A N N A T I O N A L A C C O U N T S : N A T I O N A L I N C O M E , E X P E N D I T U R E A N D P R O D U C T • 5 2 0 6 . 0 • J U N 2 0 1 3 79
G L O S S A R Y continued
Consist of amounts payable in cash including the value of any social contributions,income taxes, fringe benefits tax, etc., payable by the employee even if they are actuallywithheld by the employer for administrative convenience or other reasons and paiddirectly to social insurance schemes, tax authorities, etc., on behalf of the employee.Wages and salaries may be paid as remuneration in kind instead of, or in addition to,remuneration in cash. Separation, termination and redundancy payments are alsoincluded in wages and salaries. Wages and salaries are also measured as far as possible onan accrual rather than a strict cash basis. See also Employers’ social contributions;Compensation of employees.
Wages and salaries
See Private non–farm inventories to total sales ratio.Total sales
Calculated by dividing the export implicit price deflator by the import implicit pricedeflator and multiplying by 100.
Terms of trade
Taxes payable per unit of some good or service. The tax may be a specific amount ofmoney per unit of quantity of a good or service (quantity being measured either in termsof discrete units or continuous physical variables such as volume, weight, strength,distance, time, etc.), or it may be calculated ad valorem as a specified percentage of theprice per unit or value of the goods or services transacted. A tax on a product usuallybecomes payable when the product is produced, sold or imported, but it may alsobecome payable in other circumstances, such as when a good is exported, leased,transferred, delivered, or used for own consumption or own capital formation.
Taxes on products
such as when a product is exported, leased, transferred, delivered or used for ownconsumption or own capital formation.
Subsidies on productscontinued
80 A B S • A U S T R A L I A N N A T I O N A L A C C O U N T S : N A T I O N A L I N C O M E , E X P E N D I T U R E A N D P R O D U C T • 5 2 0 6 . 0 • J U N 2 0 1 3
G L O S S A R Y continued
www.abs.gov.auWEB ADDRESS
All statistics on the ABS website can be downloaded freeof charge.
F R E E A C C E S S T O S T A T I S T I C S
Client Services, ABS, GPO Box 796, Sydney NSW 2001POST
Our consultants can help you access the full range ofinformation published by the ABS that is available free ofcharge from our website. Information tailored to yourneeds can also be requested as a 'user pays' service.Specialists are on hand to help you with analytical ormethodological advice.
I N F O R M A T I O N A N D R E F E R R A L S E R V I C E
www.abs.gov.au the ABS website is the best place fordata from our publications and information about the ABS.