NREL is a national laboratory of the U.S. Department of Energy, Office of Energy Efficiency & Renewable Energy, operated by the Alliance for Sustainable Energy, LLC. Contract No. DE-AC36-08GO28308 Hydrogen Storage Needs for Early Motive Fuel Cell Markets J. Kurtz, C. Ainscough, L. Simpson, and M. Caton Technical Report NREL/TP-5600-52783 November 2012
Transcript
NREL is a national laboratory of the U.S. Department of Energy, Office of Energy Efficiency & Renewable Energy, operated by the Alliance for Sustainable Energy, LLC.
Contract No. DE-AC36-08GO28308
Hydrogen Storage Needs for Early Motive Fuel Cell Markets J. Kurtz, C. Ainscough, L. Simpson, and M. Caton
Technical Report NREL/TP-5600-52783 November 2012
NREL is a national laboratory of the U.S. Department of Energy, Office of Energy Efficiency & Renewable Energy, operated by the Alliance for Sustainable Energy, LLC.
National Renewable Energy Laboratory 15013 Denver West Parkway Golden, Colorado 80401 303-275-3000 • www.nrel.gov
Contract No. DE-AC36-08GO28308
Hydrogen Storage Needs for Early Motive Fuel Cell Markets
J. Kurtz, C. Ainscough, L. Simpson, and M. Caton Prepared under Task No. H272.4410
Technical Report NREL/TP-5600-52783 November 2012
NOTICE
This report was prepared as an account of work sponsored by an agency of the United States government. Neither the United States government nor any agency thereof, nor any of their employees, makes any warranty, express or implied, or assumes any legal liability or responsibility for the accuracy, completeness, or usefulness of any information, apparatus, product, or process disclosed, or represents that its use would not infringe privately owned rights. Reference herein to any specific commercial product, process, or service by trade name, trademark, manufacturer, or otherwise does not necessarily constitute or imply its endorsement, recommendation, or favoring by the United States government or any agency thereof. The views and opinions of authors expressed herein do not necessarily state or reflect those of the United States government or any agency thereof.
Available electronically at http://www.osti.gov/bridge
Available for a processing fee to U.S. Department of Energy and its contractors, in paper, from:
U.S. Department of Energy Office of Scientific and Technical Information P.O. Box 62 Oak Ridge, TN 37831-0062 phone: 865.576.8401 fax: 865.576.5728 email: mailto:[email protected]
Available for sale to the public, in paper, from: U.S. Department of Commerce National Technical Information Service 5285 Port Royal Road Springfield, VA 22161 phone: 800.553.6847 fax: 703.605.6900 email: [email protected] online ordering: http://www.ntis.gov/help/ordermethods.aspx
National Renewable Energy Laboratory activities are supported by the U.S. Department of Energy Fuel Cell Technologies Program under contract DE-AC36-08GO28308. We thank the many partners who collaborated with us on this report, including technology suppliers, operators, and end users such as vehicle and fuel cell developers, infrastructure providers, and fleet or site operators to the information gathering. We also thank Shawna McQueen, Energetics, for the workshop facilitation and support for this report.
iv
Acronyms and Abbreviations
AV autonomous vehicles & unmanned vehicles
ARRA American Recovery and Reinvestment Act
DLA Defense Logistics Agency
DOE U.S. Department of Energy
EPA U.S. Environmental Protection Agency
SV specialty vehicles
MHE material handling equipment
GSE ground support equipment
MTTR mean time to repair
NREL National Renewable Energy Laboratory
R&D research and development
v
Executive Summary
Objective The National Renewable Energy Laboratory’s (NREL) objective for this project is to identify performance needs for onboard energy storage of early motive fuel cell markets by working with end users, manufacturers, and experts. The performance needs analysis is combined with a hydrogen storage technology gap analysis to provide the U.S. Department of Energy (DOE) Fuel Cell Technologies Program with information about the needs and gaps that can be used to focus research and development activities that are capable of supporting market growth.
Method NREL selected the early motive fuel cell markets studied based on the DOE Fuel Cell Technologies Program’s market transformation activity focus on specialty vehicles, which includes material handling equipment, ground support equipment, public transit, and autonomous vehicles. NREL collected information about the performance needs in these markets during workshops and with electronic questionnaires. The performance needs were identified without selecting a particular storage technology to facilitate a clear understanding of the end user’s performance expectations without a technology bias.
Results NREL completed the analyses per a specific application, but a few themes were common across applications. A common focus was the performance of incumbent technologies that are well established, familiar, and generally simple. A hydrogen storage technology needs to be simple, flexible, safe, low cost (capital and operation), and robust to compete with the incumbent technologies.
These markets tend to be risk averse and demand systems with high technology readiness levels and manufacturing readiness levels. Hydrogen storage technologies that have near-term potential to be readily available, reliable, and capable of satisfying the demanding operation environment are a must for market acceptance. This is obvious from the number of discussions and responses focusing on reliability, maintenance costs, operating conditions (e.g., temperature as well as shock and vibration) and mean time to repair. The top five “must-have” attributes (along with a few important “linear” attributes) by application are listed in Table ES-1.
Table ES-1. “Must-Have” Attributes of Hydrogen Storage Technologies
Material Handling Equipment Public Transit Autonomous Vehicles Shock and vibration Environment Storage capacity
Mean time to repair Storage capacity End-of-life costs
Reliability/availability Fill rate Reliability/availability
Greenhouse gas emissions Shock and vibration Shock and vibration
Operation temperature Operation lifetime Mean time to repair
Fill rate, maintenance costs, and storage capacity
Maintenance costs, reliability/ availability, preventative maintenance frequency, and mean time to repair
Fill rate, operation temperature, maintenance cost, preventative maintenance frequency, and warranty
vi
Hydrogen storage technologies capable of accelerating market acceptance should:
• Be capable of satisfying all of the “must-have” performance needs
• Be simple, easy to use, safe, and effective (particularly from the operator’s perspective)
• Integrate with the fuel cell systems and hydrogen infrastructure in a way to decrease infrastructure complexity and cost
• Have near-term potential as a readily available technology.
Recommendations Compressed hydrogen tanks are the most common hydrogen storage technology implemented and capable of satisfying many of the performance needs for these markets. However, there is potential for performance gains by developing alternative hydrogen storage technologies to:
• Lower onboard storage system costs
• Lower infrastructure costs resulting in expanding the potential market beyond high count fleet sites
• Simplify infrastructure without the need for compression and high pressure hardware
• Increase scalability to be capable of multiple, sequential fills without a decrease in fill amount or time
• Improve volumetric capacity and weight.
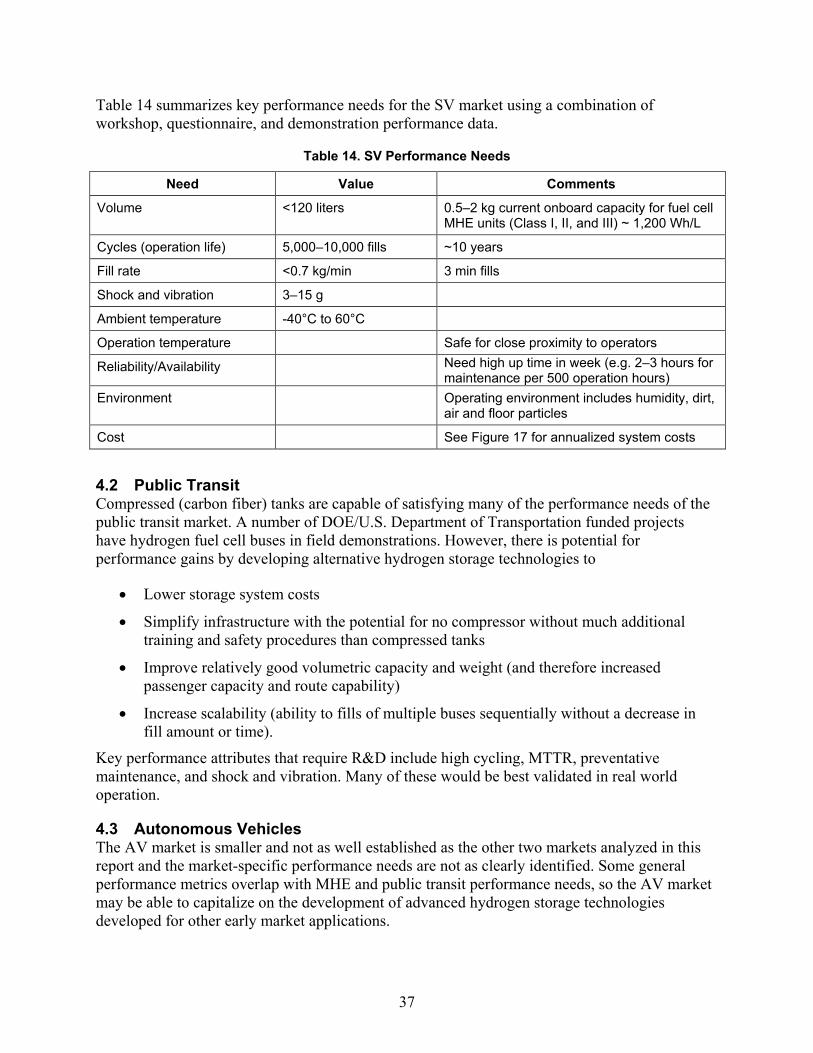
A summary of the performance needs for the specialty vehicle market that combines data from workshop, questionnaire, and active deployments appears in Table ES-2.
Table ES-2. Summary of Specialty Vehicle Performance Needs
Need Value Comments
Volume <120 liters 0.5–2 kg current onboard capacity for fuel cell material handling equipment units (Class I, II, and III) ~ 1,200 Wh/L
Cycles (operation life) 5,000 – 10,000 fills ~10 years
Fill rate <0.7 kg/min 3 min fills
Shock and vibration 3–15 g
Ambient temperature -40°C to 60°C
Operation temperature
Safe for close proximity to operators
vii
Table of Contents
List of Figures ................................................................................................................................ ix
List of Tables ................................................................................................................................. ix
1 Background and Introduction ................................................................................................... 1
Appendix A. Workshop Agendas ................................................................................................. 40
Appendix B. Questionnaires Developed by NREL in Cooperation with Sandia National Laboratories .................................................................................................................................. 43
B-2. End User Questionnaire ..................................................................................................... 52
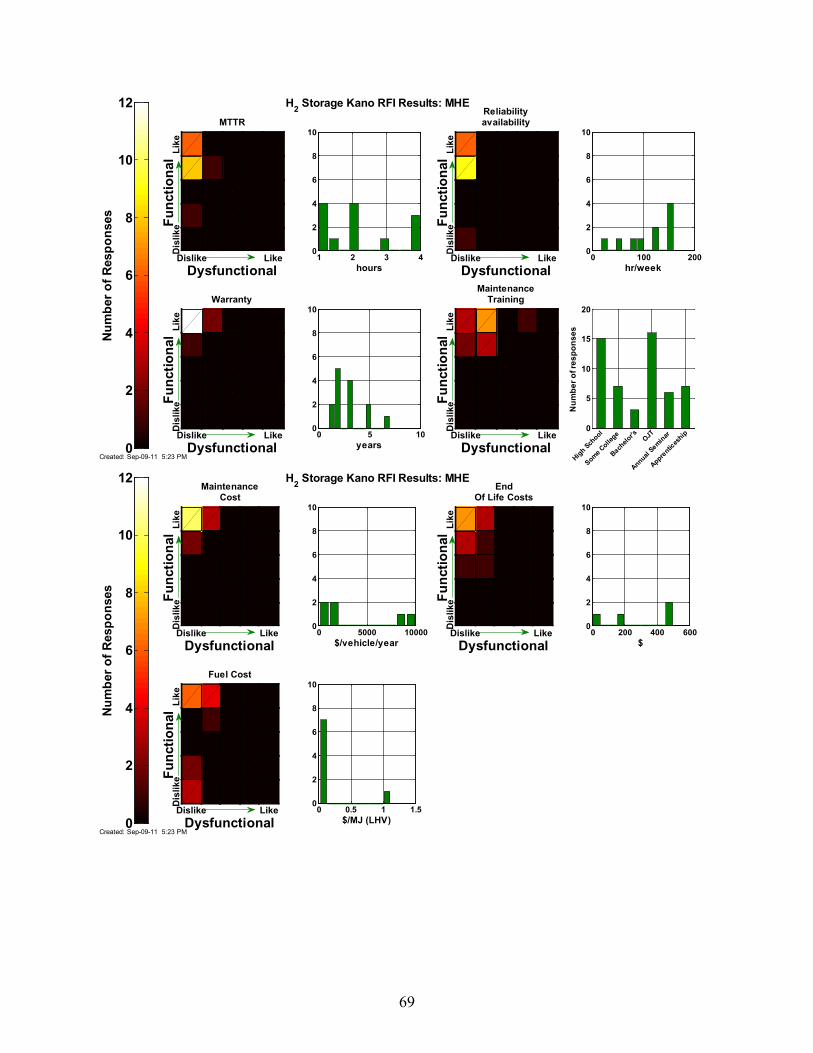
Appendix C. Detailed Results by Application and Questionnaire Topic ..................................... 59
Appendix D. Specialty Vehicle Attributes Results ....................................................................... 67
Appendix E. Public Transit Attributes Results ............................................................................. 70
Appendix F. Autonomous Vehicle Attributes Results .................................................................. 73
ix
List of Figures Figure 1. Plot of projected volumetric and gravimetric capacities for different hydrogen storage system technologies as applied to light duty vehicles .................................................................... 2 Figure 2. Different hydrogen storage material capacities—developed by DOE projects ............... 3 Figure 3. Projected hydrogen storage system costs for different technologies ............................... 4 Figure 4. Example of MHE Kano results for topics relating to operation ...................................... 7 Figure 5. Questionnaire respondents by application ....................................................................... 8 Figure 6. Identification of MHE performance needs by Must-Have, Linear, and Exciter Kano results ............................................................................................................................................ 12 Figure 7. Identification of PT performance needs by Must-Have, Linear, and Exciter Kano results ............................................................................................................................................ 16 Figure 8. Identification of AV performance needs by Must-Have, Linear, and Exciter Kano results ............................................................................................................................................ 19 Figure 9. Continuous runtime between fill by application ........................................................... 29 Figure 10. Range of MTTR by application ................................................................................... 30 Figure 11. Fill rate ranges by application ..................................................................................... 30 Figure 12. Operation hours per week by application .................................................................... 31 Figure 13. Range of preventative maintenance frequency by application .................................... 31 Figure 14. Histogram of fueling rates for MHE units ................................................................... 33 Figure 15. Operating hours between fuelings ............................................................................... 34 Figure 16. Range of average daily kilograms of hydrogen fill frequency and amount dispensed for the fleets .................................................................................................................................. 35 Figure 17. Annualized cost of ownership for battery and fuel cell forklifts with the breakdown of major cost components ................................................................................................................. 36 List of Tables Table ES-1. “Must-Have” Attributes of Hydrogen Storage Technologies ..................................... v Table ES-2. Summary of Specialty Vehicle Performance Needs .................................................. vi Table 1. Kano Attributes Space ...................................................................................................... 6 Table 2. Questionnaire Topics ........................................................................................................ 7 Table 3. Lift Truck Power Sources and Operating Characteristics ................................................ 9 Table 4. Summary of Onboard Energy Storage Needs for MHE and GSE Workshop Results ... 10 Table 5. Summary of All Performance Needs for SV .................................................................. 13 Table 6. Vehicle Power Sources by Mode of Service .................................................................. 14 Table 7. Summary of Onboard Energy Storage Needs for PT Workshop Results ....................... 15 Table 8. Summary of All Performance Needs for Public Transit ................................................. 17 Table 9. Summary of All Performance Needs for Autonomous Vehicle ..................................... 21 Table 10. Comparison of Hydrogen Storage Technologies Capabilities to Key Performance Needs for MHE ............................................................................................................................. 24 Table 11. Comparison of Hydrogen Storage Technologies Capabilities to Key Performance Needs for Public Transit ............................................................................................................... 25 Table 12. Comparison of Hydrogen Storage Technologies Capabilities to Key Performance Needs for AV ................................................................................................................................ 26 Table 13. Summary of Key Performance Attributes by Application ............................................ 29 Table 14. SV Performance Needs ................................................................................................. 37
1
1 Background and Introduction
1.1 Objective The National Renewable Energy Laboratory’s (NREL) objective for this project is to identify performance needs for onboard energy storage of early motive fuel cell markets by working with end users, manufacturers, and experts. The performance needs analysis is combined with a hydrogen storage technology gap analysis to provide the U.S. Department of Energy (DOE) Fuel Cell Technologies Program with information about the needs and gaps that can be used to focus research and development (R&D) activities capable of supporting market growth.
1.2 Scope The DOE Fuel Cell Technologies Program focuses on the R&D of materials and approaches that will enable widespread commercialization of fuel cell systems for diverse applications across stationary, portable, industrial, and transportation sectors. The market adoption of motive fuel cell systems can be accelerated by improving storage system technologies. Effective improvements in hydrogen storage systems could result in extended product run times, increased productivity, decreased capital and operating costs, improved integration between the equipment and facility, and facilitation of siting and permitting processes. These improvements can be achieved through focused R&D efforts based on an in-depth understanding of storage requirements in key early markets.
1.2.1 Motive Market Selection NREL selected the early motive markets based on the DOE Fuel Cell Technologies Program’s focus of its market transformation activity on specialty vehicles (U.S. Department of Energy Office of Energy Efficiency and Renewable Energy 2010). For the purpose of this report, the markets are categorized as the following:
• Specialty vehicles. This market includes material handling equipment (MHE) such as traditional forklifts and pallet jacks for used in warehouses and manufacturing facilities, as well as other ground support equipment (GSE) used in airports, mining operations, and grounds keeping and maintenance operations.
• Public transit. This market includes transit services (urban routes, commuter, and paratransit) and shuttle services (airport, campus, and large events).
• Autonomous vehicles and other niche applications. These markets include applications for autonomous vehicles, and other military autonomous motive applications.
To gather supporting data for the analysis and identification of motive market-specific performance needs and current hydrogen storage technology gaps, NREL identified target audiences and contacted them for participation through market-specific workshops and questionnaires. The target audience where end users, fuel cell manufacturers, and hydrogen storage experts in the motive markets selected.
1.2.2 Hydrogen Storage Technologies The DOE Fuel Cell Technologies Program focuses on R&D of several technologies to provide hydrogen storage, including metal hydrides, chemical hydrides, sorbents, compressed tanks, liquid hydrogen, and cryo-compressed tanks. Lower pressure, materials-based technologies
2
include chemical hydrides, metal hydrides, and sorbents. Figure 1 compares 2011 projections of hydrogen storage system gravimetric and volumetric capacities for light duty vehicles, including compressed hydrogen; cryo-compressed hydrogen; liquid hydrogen; and lower-pressure, materials-based technologies.
Figure 1. Plot of projected volumetric and gravimetric capacities for different hydrogen storage
system technologies as applied to light duty vehicles The plot includes representative system technologies involving compressed hydrogen (cH2, at ambient temperature), cryo-compressed hydrogen (CcH2, at ~35 K), liquid hydrogen (LH2, at ~20 K), sorbents
(AX-21 and MOF-177 at ~100 K), metal hydrides (alane, NaAlH4), and chemical hydrides (liquid carrier [LCH2], sodium borohydride [SBH], ammonia borane [AB]). (Ahluwalia 2011)
3
Figure 2. Different hydrogen storage material capacities—developed by DOE projects
(Stetson 2011) Key factors for hydrogen storage system performance are capacities (Figure 2), retention of hydrogen, low system cost (Figure 3), high-purity hydrogen with good well-to-drive system energy efficiency, low associated emissions such as carbon dioxide, and little impact on the overall hydrogen fuel costs.
4
Figure 3. Projected hydrogen storage system costs for different technologies
(Ahluwalia 2011) 2 Method
The performance needs for onboard energy storage are technology agnostic to facilitate a clear understanding of the end user’s performance expectations without a technology bias.
NREL developed a questionnaire using the Kano Analysis Method and distributed it to stakeholders both electronically and during interactive workshops to gather supporting information and provide a better understanding of the industries identified for motive fuel cell applications. The results were used for analysis and assessment.
NREL then assessed the current hydrogen storage technologies and compared them to the needs and expectations that were identified by the target audiences. This method enabled us to identify gaps in hydrogen storage R&D activities.
5
2.1 Information Gathering – Workshops NREL conducted three workshops to gather input from equipment developers, manufacturers, end users, and expert stakeholders on the important performance requirements of motive power applications and onboard energy systems in near-term markets for hydrogen-fueled motive power applications. The workshops were held in conjunction with conferences already being attended by the targeted stakeholder groups. The first workshop was held February 16, 2011, in conjunction with the Fuel Cell and Hydrogen Energy Association annual conference in National Harbor, Maryland. The second two workshops were held March 21, 2011, in Chicago, Illinois, in conjunction with ProMat 2011, an annual conference and trade show for the material handling and logistics industry. Participants’ experience with fuels cells, hydrogen, or other onboard energy storage technologies ranged from expert to layperson. Information on the autonomous vehicle category was gathered via email and phone contact as well as at the workshop held in February.
Each workshop featured small group discussion sessions led by professional facilitators from Energetics Incorporated. The February 16 workshop included two breakout groups: one focused on onboard energy storage needs for transit buses, and one focused on MHE and GSE. The two half-day workshops held on March 21 were targeted toward the MHE industry. As shown in the agendas included in Appendix A, the workshop facilitators structured the discussion sessions around two focus questions used to initiate conversation in particular topic areas. The facilitators prompted participants to share information and experiences with motive power applications general performance requirements, and, more specifically, the requirements for the onboard energy storage system. Participants were asked to share strengths and weaknesses of current onboard energy storage technologies for meeting performance needs, and to identify opportunities for improvement. The facilitators documented results of the session, which are summarized in Section 2.2.
2.2 Information Gathering – Questionnaires Japanese Professor Noriaki Kano developed the Kano Analysis Method to determine customer wants and needs. The method is widely applied in industry as a tool for market research to drive customer satisfaction. It is a key tool in the six-sigma quality movement. The method breaks customer desires into the following five categories:
• Must-have - These are attributes that a product needs if it is to be adopted (e.g., a system in an autonomous vehicle that requires an in-place operator).
• Linear - These attributes are of the “more is better” type (e.g., an increased operation temperature range for MHE power packs is not required by most fleet managers, but it could improve overall operation capability).
• Exciters - These are unexpected attributes that the customer can live without, but they really add a new level of convenience that the customer did not know was possible (e.g., a simple maintenance training program for public transit buses that decreases training requirements). Exciter attributes tend to become must-haves over time as they become more common.
• Reverse - These are attributes that make a product less desirable (e.g., a storage capacity that would require more than one fill per shift or mission).
6
• Indifferent - These are attributes that the customer does not care about (e.g., the color of the storage system).
To determine which category a particular attribute falls into, potential customers are asked the following questions:
• A positive question (e.g., How would you feel if you could operate many shifts in a row without needing to replenish your energy storage system?).
• A negative question (e.g., How would you feel if you had to replenish your energy storage system many times in a shift?).
Answers to the questions are limited to mutually exclusive multiple choice options such as: “like it,” “expect it,” “do not care,” “live with it,” and “dislike it.” These responses correspond to numerical ratings of 1 to 5.
The answers to each question are plotted on a positive versus negative Cartesian plane (see Table 1). Depending on where most responses lie, one can determine which Kano category applies to that attribute.
Table 1. Kano Attributes Space
Negative Question
Dislike It Live With It Neutral Expect It Like It
Posi
tive
Que
stio
n
Like It Linear Exciter Inconsistent
Expect It
Must-Have Indifferent
Reverse
Neutral
Live With It
Dislike It Inconsistent Reverse (having this attribute is bad)
NREL made an extension to the model for the purposes of this project. In addition to the standard Kano method, NREL added a third question to each question topic to determine quantitative values for the customer’s specific needs. For instance, on the hydrogen storage topic of hydrogen fill rate, the following questions were asked:
• Positive: How would you feel if your vehicle could be fueled quickly?
• Negative: How would you feel if your vehicle took a long time to fill?
• Follow-up: What would you consider to be quick (in minutes)?
7
NREL included the topics in Table 2 in the questionnaire in cooperation with Sandia National Laboratories. Each topic included a question triplet (positive, negative, and follow-up). The order of the questions was randomized to avoid grouping the triplets together. This approach forced the users to address each question with fresh minds, and therefore produced more genuine responses. Grouping the triplets together could cause respondents to provide answers they think the questioners are seeking, rather than legitimate responses. The questionnaire can be viewed in Appendix B.
Table 2. Questionnaire Topics
End-of-Life Costs Operator Training Weight Maintenance Costs
Environment Preventative maintenance frequency Site air quality Operation temperature
Fill rate Maintenance training Warranty Reliability/availability
Safety Mean time to repair (MTTR) Volume Shock and vibration
3 Results
NREL separated the results from the workshops and questionnaires by application in the following subsections. For each application, NREL identified attributes that are important to the end user through discussions and the Kano results for “Must-Have,” “Linear,” and “Exciter” categories. Detailed figures for each Kano topic are grouped and plotted as in Figure 4. Refer to Appendix C for detailed results by application and questionnaire topic.
Figure 4. Example of MHE Kano results for topics relating to operation
Dislike Like
StorageCapacity
Dysfunctional
Func
tiona
lD
islik
eLi
ke
6 8 10 120
2
4
6
8
10
hoursDislike Like
Fill Rate
Dysfunctional
Func
tiona
lD
islik
eLi
ke
0 2 4 60
2
4
6
8
10
minutes
Dislike Like
Operationlifetime
Dysfunctional
Func
tiona
lD
islik
eLi
ke
5 10 15 200
2
4
6
8
10
yearsDislike Like
Preventativemaintenance frequency
Dysfunctional
Func
tiona
lD
islik
eLi
ke
0 0.5 10
2
4
6
8
10
days/vehicle/month
Num
ber o
f Res
pons
es
0
1
2
3
4
5
6
7
8
9
Created: Aug-24-11 5:02 PM
H2 Storage Kano RFI Results: MHE
8
The analysis includes 33 responses, most of which are from the MHE application group (see Figure 5). This is reflective of industry projects, market size, and available contacts for the applications. Each Kano question set has two graphs, one for identifying whether the attribute is important to the responder, and one for the expected performance. The detailed results include each response value, and the summary information contains statistical values such as the mean and one standard deviation of the quantitative performance attributes. Respondents in the other category did not specify an application or represented multiple applications.
Figure 5. Questionnaire respondents by application
3.1 Specialty Vehicles (SV)
3.1.1 Overview Specialty vehicles includes MHE and GSE applications. MHE includes a variety of powered industrial trucks used in material receiving, storage, loading, packing, and shipping operations. Common types of MHE include forklifts, tugs, stock pickers, pallet trucks, and hand trucks. There are seven major classes (Class I–VII) of lift trucks, each designed for a specific type of application, demand (e.g., power and speed), and locale. Classes I–III are typically used in warehouse-type settings, such as distribution centers or shipping and receiving, as well as grocery stores. Classes IV–VII are typically used outdoors (though Class IV trucks are sometimes operated indoors) in applications such as construction, agriculture, manufacturing, trucking, paper industries, recycling, and shipping.
18%
58%
12%
12%
Respondents By Application
Other
MHE
Public Transit
AV
Created: Aug-29-11 4:54 PM
9
Table 3. Lift Truck Power Sources and Operating Characteristics
Power Source Fuel Characteristics
Internal combustion engine
Gasoline, diesel, liquefied petroleum gas, or compressed natural gas
Can handle heavy loads over a full shift Quick refueling via liquid or gas fuel dispenser Noisy operations Potentially harmful exhaust emissions in indoor environments
Battery-driven electric motor
Stored electricity, typically in lead-acid batteries
Battery drained faster with heavy loads Quiet, emissions-free operation
Fuel-cell-driven electric motor
Hydrogen or methanol
Performs as well as, or better than, battery systems with no power drop during operation Quick refueling via hydrogen or methanol dispenser Quiet, emissions-free operation
The lift truck industry is a multibillion dollar, global industry. The top 15 lift truck manufacturers in 2009 had annual revenues of $19.6 billion (Rogers 2010), and included companies in Asia, Europe, and the United States. About 900 companies (Mahadevan et al. 2007) utilize MHEs and companies such as FedEx, Coca-Cola, Walmart, BMW, and Sysco Foods have experience with fuel cell MHEs.
User requirements for MHE will vary, depending on the application. Decision factors important to MHE end users include reliability, ease of use, lifetime, fuel availability, and costs (operation and capital) (Mahadevan et al. 2007). Other considerations include constant power; peak power loads; lift capacity; stability; and ambient operating conditions such as temperature, humidity, and space.
GSE is used to service aircraft between flights. GSE comprises a diverse array of specialty vehicles and equipment designed to perform a variety of functions, including starting, fueling, and maintaining aircraft; towing aircraft; providing ground-based power or conditioned air to the cabin and cockpit; loading and unloading passengers and cargo; and providing cleaning and food and beverage catering services. Today, GSE is largely powered by internal combustion engines (fueled by gasoline, diesel, liquefied petroleum gas, compressed natural gas, or Jet A fuel) or batteries.
GSE is used at major commercial airports, smaller flying fields, air courier services, military facilities, helicopter carriers, hangars, charter services, and air ambulance services. In 2006, there were more than 14,500 such facilities in the United States (Mahadevan et al. 2007). The latest data showing the estimated GSE population in the Unites States (in this case, pushback tractors and baggage tugs) are from 1999, when the U.S. Environmental Protection Agency (EPA) estimated that 2,759 aircraft pushback tractors and 10,505 baggage tugs were in service (U.S. Environmental Protection Agency 1999). Assuming a 4% annual growth, there are at least 4,300 pushback tractors and at least 16,200 baggage tugs in the United States today.
One of the biggest concerns of GSE end users is emissions. With the latest EPA standards on nonroad diesel emissions (15 parts per million sulfur content, effective June 2010), a significant
10
amount of attention has been focused on cleaning up GSE emissions, mainly by using emission control devices or switching to electric motors. Emissions are particularly important in and around airport terminal buildings, where many workers are located. The air quality in those environments directly affects the workers’ health and safety. Many airports are located in nonattainment areas, and are either being encouraged or mandated to lower their emissions.
The results in the next section focus on MHE applications because of the lack of GSE available information.
3.1.2 Key Performance Attributes
3.1.2.1 Workshop Results Table 4. Summary of Onboard Energy Storage Needs for MHE and GSE Workshop Results
(Kurtz et al. 2011a and 2011b)
High-Priority Need Comments
Fast and convenient filling
• Quick, convenient fueling at no more than 2–3 minutes per fill • Fill time and convenience are more important than continuous run time
over a 5–8 hour shift—with quick fills, operators can “opportunity charge” during scheduled breaks
• Low-pressure operation would be great but not at the expense of run- or fill-time
Flexibility in storage system design to fit within existing products (weight and volume)
• Today, most fuel cell systems are treated as a retrofit to battery-powered forklifts
• Must fit in existing battery spaces (weight, center of gravity, and dimensions)
• Fuel cell system weight must be increased approximately four times to make up for counterbalancing provided by heavy batteries
• Need to eliminate equipment and control system redundancies in vehicles that have been retrofitted to run on fuel cells
Transparent, simple, safe operations
• Simple is necessary to compete with batteries • Must be easy for operators to use, with user-friendly controls and system
diagnostics • Systems must be demonstrated to be safe for operators
Cost of onboard energy system
• Total cost must be competitive with batteries (including costs for fueling, operations, maintenance, and disposal)
• Low-cost maintenance requires a simple system that is easy to install, use, and maintain
Onboard energy system lifetime
• Industrial environment requires reliable, easy to retrofit or replace systems that do not require frequent or extensive maintenance
• An 8–10 year lifetime is ideal—the ability to refurbish, rather than replace, the energy system is a plus
• Hydrogen storage tanks must be capable of high cycling, or many charge/discharge cycles, over a 10-year life span
Certified field support with low maintenance requirements
• Maintenance must not be more frequent than preventative maintenance for incumbent technologies (e.g., 2–3 hours per 500 operation hours)
Meeting power demands
• Customers are demanding vehicles with higher and higher power—the energy system needs to meet the increased power needs without changing its size
• Available power must be able to provide multiple 400-inch lift cycles
11
High-Priority Need Comments • Power should be consistent over the full life of the shift (e.g., no
performance degradation at the end of shift or due to extreme hot or cold temperatures)
• Power must be available for peak bursts (e.g., lifting or towing) and low use (e.g., driving)
• To meet the full range of MHE applications, providers must supply systems with a range of power levels of 3–50 kilowatts
Tolerant to Extreme Environmental Conditions
• Must perform in the full range of MHE environments without performance degradation
• Temperatures in freezer, refrigerator, and dry goods storage facilities can range from subfreezing (–30°F) to very hot (> 100°F)
• Humidity levels will fluctuate and MHE must be able to withstand condensation caused by moving from cold to hot environments
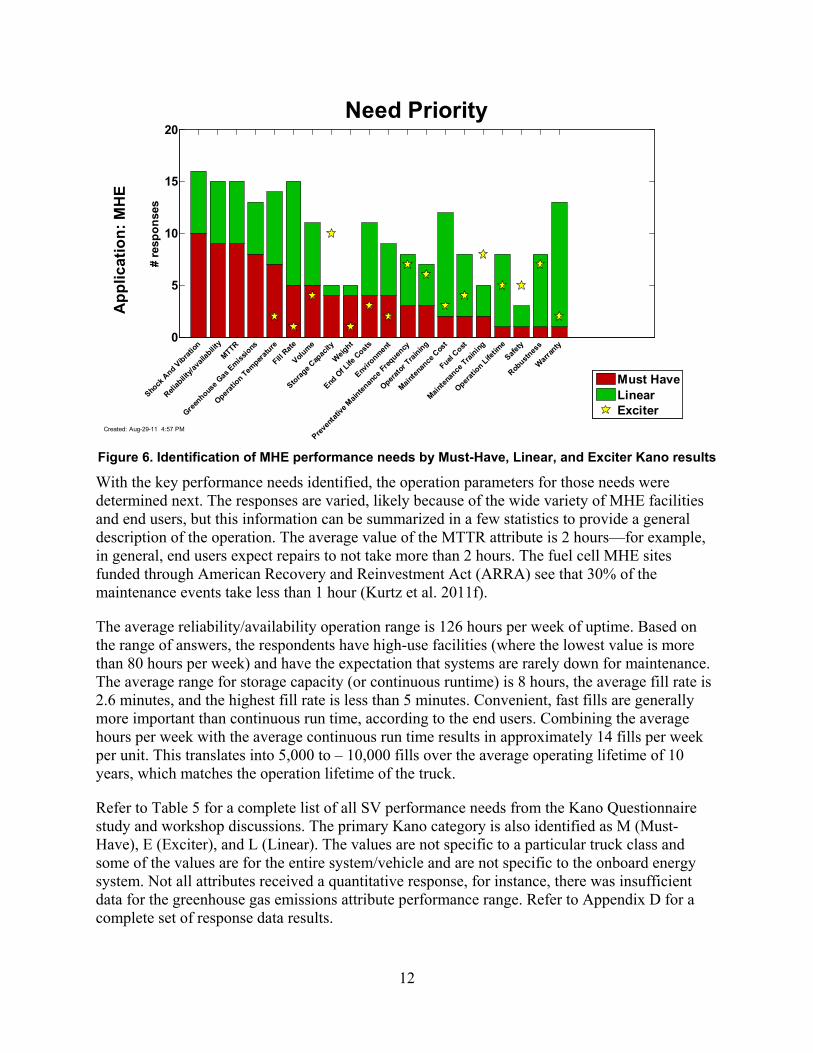
• Must tolerate shock and vibration from rugged use or rough surfaces 3.1.2.2 Kano Results The Kano results in the MHE category are summarized in Figure 6. The attributes are organized according to the number of “Must-Have” responses to highlight the key performance needs. The following are the top five attributes:
• Shock and vibration
• MTTR
• Reliability/availability
• Greenhouse gas emissions
• Operation temperature.
Fill rate, warranty, and maintenance costs are also important performance needs because of the high count in the “Linear” category. A clear “Exciter” in MHE is storage capacity. Similarly, during workshop discussions, capacity was determined to be important but not a driving factor as long as the system only needed to fill once a shift and could fill quickly (less than five minutes). The greenhouse gas emissions “Must-Have” need is likely related to indoor air quality, as most of the facilities that utilize battery or fuel cell technologies are located indoors.
12
Figure 6. Identification of MHE performance needs by Must-Have, Linear, and Exciter Kano results
With the key performance needs identified, the operation parameters for those needs were determined next. The responses are varied, likely because of the wide variety of MHE facilities and end users, but this information can be summarized in a few statistics to provide a general description of the operation. The average value of the MTTR attribute is 2 hours—for example, in general, end users expect repairs to not take more than 2 hours. The fuel cell MHE sites funded through American Recovery and Reinvestment Act (ARRA) see that 30% of the maintenance events take less than 1 hour (Kurtz et al. 2011f).
The average reliability/availability operation range is 126 hours per week of uptime. Based on the range of answers, the respondents have high-use facilities (where the lowest value is more than 80 hours per week) and have the expectation that systems are rarely down for maintenance. The average range for storage capacity (or continuous runtime) is 8 hours, the average fill rate is 2.6 minutes, and the highest fill rate is less than 5 minutes. Convenient, fast fills are generally more important than continuous run time, according to the end users. Combining the average hours per week with the average continuous run time results in approximately 14 fills per week per unit. This translates into 5,000 to – 10,000 fills over the average operating lifetime of 10 years, which matches the operation lifetime of the truck.
Refer to Table 5 for a complete list of all SV performance needs from the Kano Questionnaire study and workshop discussions. The primary Kano category is also identified as M (Must-Have), E (Exciter), and L (Linear). The values are not specific to a particular truck class and some of the values are for the entire system/vehicle and are not specific to the onboard energy system. Not all attributes received a quantitative response, for instance, there was insufficient data for the greenhouse gas emissions attribute performance range. Refer to Appendix D for a complete set of response data results.
0
5
10
15
20
Shock
And V
ibration
Reliab
ility/a
vaila
bility
MTTR
Green
house G
as Emiss
ions
Operatio
n Tem
perature
Fill Rate
Volume
Storage C
apac
ity
Weight
End O
f Life
Costs
Enviro
nment
Preven
tative
Main
tenan
ce Fr
equen
cy
Operator
Training
Mainten
ance
Cos
t
Fuel Cost
Mainten
ance
Training
Operatio
n Life
time
Safety
Robustn
ess
Warran
ty
# re
spon
ses
Need Priority
Must HaveLinearExciter
Created: Aug-29-11 4:57 PM
App
licat
ion:
MH
E
13
Table 5. Summary of All Performance Needs for SV
Attribute Units Mean Max Min75%
percentile25%
percentile Std Dev KanoAdditional Workshop
InformationComments
Shock and Vibration g 3 - 15 M
Reliability/Availability hours/ w eek 127 160 80 100 150 32 MNeed high up time in w eek (e.g. 2-3 hours for maintenance per 500 operation hours)
MTTR hours 2 4 1 1 2 1 MEntire system - 30% maintenance events are < 1 hour long in ARRA MHE demonstrations5
Greenhouse Gas Emissions M kg-CO2 eq/kg-H2 Likely zero emissions required
Operation Temperature (Min) oC -40 120 -40 118 -38 MOperation Temperature (Max) oC 60 120 -40 118 -38 M
Fill Rate minutes 3 5 1 2 3 1 L2 -3 minutes
Quick and convenience is more important than continuous run time
Warranty years 3 7 1 2 3 2 L
Maintenance Costs $/vehicle/ year 4420 10000 100 775 9250 4699 L Per vehicle, energy storage is a small percentage
Storage Capacity hours 9 12 6 8 10 2 E5 - 8 hours
Continuous run time betw een f ills (converts to ~ 5 kg3,4)
Volume liters 387 680 49 125 566 251 L Entire system - assume 30% available for Storage (~1200 Wh/l)4
Weight kg 1190 1814 4 862 1474 570 M Entire system - assume 50% available for storage (~0.8 w t%)4
End of life Costs $ 100 200.0 0.0 0.0 200.0 141 L
Operation lifetime years 10 20 5 7 10 5 L
8 - 10 years
Combine availablity hours/w eek w ith continuous run time (capacity) => 14 f ills per w eek (5,000 - 10,000 f ills over 10 years)
Operating environment includes dirt, humidity, extreme temperatures, rugged use, indoors and outdoors w ith pow er needs of 3 - 50 kW
Maintenance Training E
Safety min/operator/ day
6 15 1 2 10 5 E
Operator Training hr/operator/ year
27 60 5 9 40 18 E 1-8 hours for dispensing of compressed tanks in DOE MHE sites
Storage System Costs MWell to engine eff iciency M WTE Eff. (%)
1. Some values are for entire SV system/vehicle2. Values are not specif ic to a certain truck class3. Assumes 10 kW pow er plant operating at ~ 50% eff iciency4. The capacity in terms of run time w as used to calaculate the amount of fuel needed (~5 kg, 0.8 w t%, 1200 Wh/l). The w eight and volume values assumed to be for entire system and estimate 30% w eight and 50% volume available for stoarge5. CDP-ARRA-MHE-43 http://w w w .nrel.gov/hydrogen/cfm/images/cdparra_mhe_43_maintenancelaborhoursbreakdow n.jpg
No quantitative responses
Speciality Vehicle1,2 Questionnaire Statistics
No quantitative responses
No quantitative responses
No quantitative responses
No quantitative responses
No quantitative responses
14
3.2 Public Transit
3.2.1 Overview Public transit buses are large on-road vehicles designed to provide public transportation and carry a large passenger load. The market includes small shuttle-type buses or vanpool buses with a passenger capacity as low as 10-20 people and large commuter buses that can carry as many as 300 passengers. Transit buses traverse both urban and rural routes, and are designed for both long- and short-haul operations.
The major end-users of public transit buses are city or county transit agencies that have a mission to create an accessible, affordable, and useful public transportation infrastructure, including paratransit services for elderly or disabled persons. Other public- and private-sector organizations can also be end users of public transit buses, including airports, military bases, national parks, and schools and universities.
In the United States, bus transit accounted for close to 55% of total public transit trips in 2009, equating to over 4 billion vehicle miles travelled (American Public Transportation Association 2011). In that year, approximately 66,500 public transit buses and 65,800 paratransit vehicles were operating in the United States during peak periods (American Public Transportation Association, 2011, p. Table 9). While the vast majority of transit buses in use today are powered by internal combustion engines operating on diesel fuel or gasoline, alternative fuels are also used, including electricity, compressed natural gas, liquefied natural gas, biofuels, and hydrogen (see Table 5). Because buses are an extremely popular mode of transportation in the United States and globally, it is becoming increasingly important to make them as environmentally friendly and efficient as possible, and the market for alternative fueled buses is growing.
Table 6. Vehicle Power Sources by Mode of Service (American Public Transportation Association 2011)
Mode Electricity Diesel Fuel Electric and Other (Hybrid)
Gasoline CNG, LNG and Blends
Other
Bus 0.1% 65.8% 7.0% 0.7% 18.6% 7.8%
Para-transit -- 49.2% 0.5% 42.8% 1.9% 5.6%
Vanpool -- 4.0% 0.3% 93.2% 0.1% 2.4%
3.2.2 Key Performance Attributes This section summarizes the key energy storage performance needs and capabilities of public transit vehicles, as identified by participants in the workshop discussions and through the Kano questionnaire.
3.2.2.1 Workshop Results Although three workshops were held to gather information for this analysis, only one included a session specifically addressing public transit vehicles as an end-user application. As shown in Table 6, the participants identified four high-priority needs for the energy storage system, including its cost, weight, lifetime, and capacity (vehicle driving range).
15
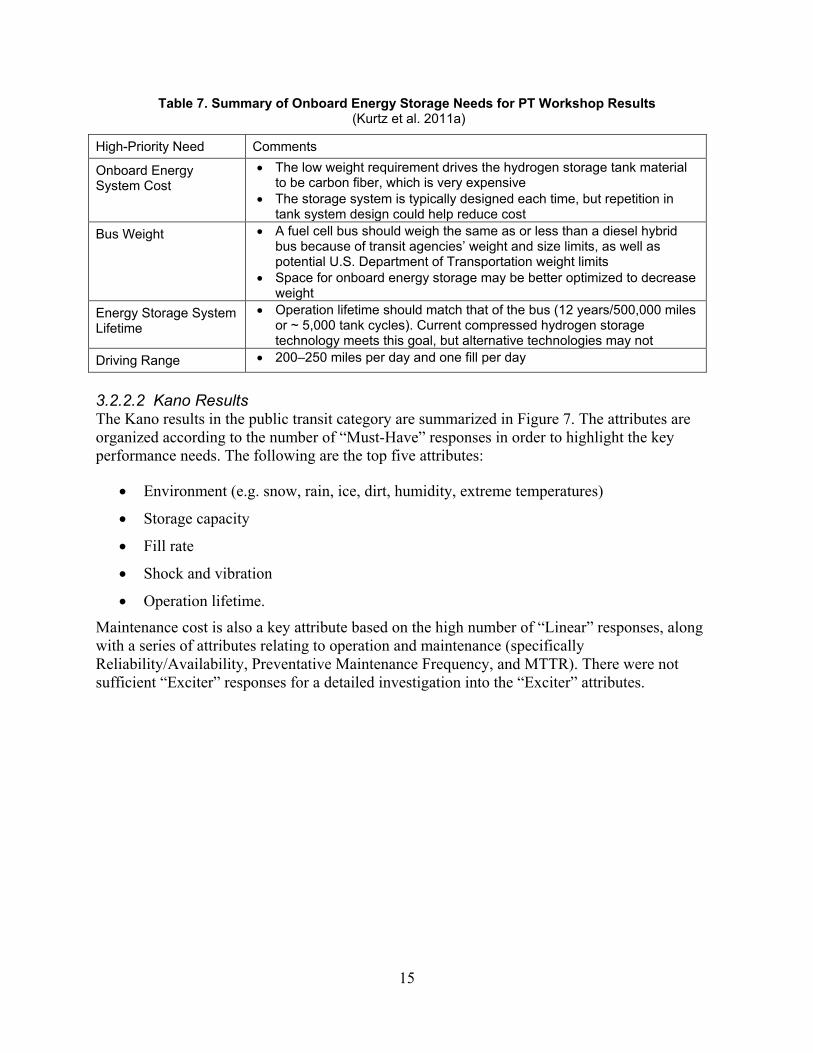
Table 7. Summary of Onboard Energy Storage Needs for PT Workshop Results (Kurtz et al. 2011a)
High-Priority Need Comments
Onboard Energy System Cost
• The low weight requirement drives the hydrogen storage tank material to be carbon fiber, which is very expensive
• The storage system is typically designed each time, but repetition in tank system design could help reduce cost
Bus Weight • A fuel cell bus should weigh the same as or less than a diesel hybrid bus because of transit agencies’ weight and size limits, as well as potential U.S. Department of Transportation weight limits
• Space for onboard energy storage may be better optimized to decrease weight
Energy Storage System Lifetime
• Operation lifetime should match that of the bus (12 years/500,000 miles or ~ 5,000 tank cycles). Current compressed hydrogen storage technology meets this goal, but alternative technologies may not
Driving Range • 200–250 miles per day and one fill per day
3.2.2.2 Kano Results The Kano results in the public transit category are summarized in Figure 7. The attributes are organized according to the number of “Must-Have” responses in order to highlight the key performance needs. The following are the top five attributes:
Maintenance cost is also a key attribute based on the high number of “Linear” responses, along with a series of attributes relating to operation and maintenance (specifically Reliability/Availability, Preventative Maintenance Frequency, and MTTR). There were not sufficient “Exciter” responses for a detailed investigation into the “Exciter” attributes.
16
Figure 7. Identification of PT performance needs by Must-Have, Linear, and Exciter Kano results
With the key performance needs identified, the operation parameters for those needs were determined next. The operating environment for public transit applications includes a variety of air quality challenges. Additionally, the systems used in these applications are expected to operate 8–12 hours continuously before refueling and average between 200 and 250 miles per day. The average fill rate is 7 minutes, and all responses came in at less than 10 minutes. Another important aspect of filling buses is the ability to quickly fill many buses back-to-back. The respondents identified an operation period of 8–12 years, matching the operation period of the bus. When the hours per week are combined with at least 1 fill per day, it results in approximately 5,000 fills over the operation lifetime. The average MTTR is around 2 hours, which is similar to the MHE group’s findings. Likewise, the end-user requirement for a reliable system that is available 85–140 hours per week is also similar to the MHE group’s results.
Refer to Table 8 for a complete list of all PT performance needs from the Kano Questionnaire study and workshop discussions. The primary Kano category is also identified as M (Must-Have), E (Exciter), and L (Linear). The values are not specific to a particular bus class and some of the values are for the entire system/vehicle and are not specific to the onboard energy system. Not all attributes received a quantitative response; for instance, there was insufficient data for the greenhouse gas emissions and shock and vibration attributes performance ranges. Refer to Appendix E for a complete set of response data results.
0
1
2
3
4
5
Enviro
nment
Storage C
apac
ity
Fill Rate
Shock
And V
ibration
Operatio
n Life
time
Reliab
ility/a
vaila
bility
Mainten
ance
Cos
t
Preven
tative
Main
tenan
ce Fr
equen
cy
End O
f Life
Costs
Green
house G
as Emiss
ionsMTTR
Mainten
ance
Training
Warran
ty
Weight
Volume
Operatio
n Tem
perature
Safety
Robustn
ess
Fuel Cost
Operator
Training
# re
spon
ses
Need Priority
Must HaveLinearExciter
Created: Aug-29-11 4:59 PM
App
licat
ion:
Pub
lic T
rans
it
17
Table 8. Summary of All Performance Needs for Public Transit
Attribute Units Mean Max Min75%
percentile25%
percentile Std Dev KanoAdditional Workshop
InformationComments
Shock and Vibration MRoad driving
Road shock and vibration conditions ~ 3 - 5 g
Reliability/Availability hours/ w eek 112 140 84 84 140 40 L Need high up time in w eek, as bus is likely routinely utilized
MTTR hours 3 4 2 2 3.5 1 LGreenhouse Gas Emissions LOperation Temperature (Min) oC -33 160 -100 140 -60 46/51 LOperation Temperature (Max) oC 103 160 -100 140 -60 46/51 L
Fill Rate minutes 7 10 3 4 10 4 M Need fast back to back f illsWarranty years 8 12 6 6.2 10.7 3 L
Maintenance Costs $/vehicle/ year 14250 26000 2500 2500 26000 16617 L Per vehicle, energy storage is a small percentage
Storage Capacity hours 9 12 8 8 11 2 M Continuous run time betw een f ills (~50 kg3,4), 200 - 250 miles per day
Volume L
Weight MLow w eight
Weight the same as or less than a diesel hybrid bus (~45,000 lbs curb w eight 50+ passanger capacity FOOTNOTE)
End of life Costs
Operation lifetime years 11 12 8 9 12 2 M Combine availability hours/w eek w ith 1 f ill per day for ~ 5,000 f ills over lifetime
Environment MOperating environment includes dirt, humidity, extreme temperatures, snow , and rain
Maintenance Training MSafety
Operator Training hr/operator/ year
40 40 40 40 40 0 L
Storage System Costs M On par w ith diesel hybrid costs, $500,000 - $700,000
Well to engine eff iciency M WTE Eff. (%)
1. Some values are for entire SV system/vehicle2. Values are not specif ic to a certain public transit option3. Assumes 100 kW pow er plant operating at ~ 50% eff iciency4. The capacity in terms of run time w as used to calaculate the amount of fuel needed (~50 kg).
No quantitative responses
No quantitative responses
No quantitative responses
No quantitative responses
No quantitative responses
No quantitative responses
Questionnaire Statistics
No quantitative responses
No quantitative responses
No quantitative responses
No quantitative responses
No quantitative responses
Public Transit1,2
18
3.3 Autonomous Vehicles (AV)
3.3.1 Overview AVs are powered vehicles that operate via remote operator control or autonomously, via “self-directed” computer programming. There are three primary types of AVs: aerial, ground, and maritime. AVs have numerous uses, including battlefield reconnaissance; battlefield targeting and decoy; autonomous combat; de-arming bombs and munitions; search and rescue/recovery; remote sensing; border patrol; commercial surveillance (e.g., pipeline monitoring, crop and livestock monitoring, wildfire mapping, weather monitoring, highway patrol, etc.); oil, gas and mineral exploration; cargo transport; equipment maintenance and repair; and scientific research in hostile or extreme environments.
The success of AVs in performing these various missions and services has fostered a rapidly growing global industry. The Federal Aviation Administration estimates that in the United States alone there are more than 50 companies, universities, and government organizations actively involved in developing and producing approximately 155 autonomous aircraft designs (Federal Aviation Administration 2010). As of April 2009, the U.S. military was developing or producing 311 autonomous systems (93 air, 171 ground, and 47 maritime) (U.S. Department of Defense 2009).
The power source for AVs varies depending on the application. According to the DOD, current energy sources are insufficient to support future military expectations for long-duration employment of autonomous systems, and they have defined a need to move to “next generation power resources.” that will provide enhanced, smaller, and more robust power sources (U.S. Department of Defense 2009, p. 41 and 167). Today, small AV systems are typically powered by battery-operated motors or gasoline engines. Larger systems are typically powered by engines fueled by diesel, AVGAS, MOGAS, JP-5, JP-8, and Jet-A. Future power sources being considered include advanced engines and batteries, fuel cells, solar arrays, or biomass gasifier reactors.
3.3.2 Key Performance Attributes Key performance attributes for all AVs include operating range, durability, reliability, ability to operate increasingly autonomously, without human control or intervention; and low acoustic, thermal, visual and communication signatures (particularly for military applications). Other performance attributes depend on the application, including speed, maneuverability, performance at altitude/depth, load carrying capacity, load lifting capacity, and ability to handle harsh or extreme environmental conditions such as rugged/bumpy terrain, high gravitational forces, rapid drops in air pressure, high humidity, and salt, dust, mud or sand. Autonomous ground vehicles may be required to operate in buildings or in urban environments busy with pedestrians, so low emissions is also important.
The section below describes results from the Kano questionnaire distributed for this analysis. The workshops did not attract participants from the AV industry, so no workshop results are presented.
19
3.3.2.1 Kano Results The Kano results in the AV category are summarized in Figure 8. The results for the AV market are difficult to summarize clearly because of the low number of responses, small market size, and a developing market. The attributes are organized according to the number of “Must-Have” responses in order to highlight the key performance needs. The following are the top five attributes:
• Storage capacity
• End-of-life costs
• Reliability/availability
• Shock and vibration
• MTTR.
Fill Rate, Operation Temperature, Maintenance Cost, Preventative Maintenance Frequency, and Warranty are also important attributes because of the number of “Linear” responses.
Figure 8. Identification of AV performance needs by Must-Have, Linear, and Exciter Kano results
With the key performance needs identified, the operation parameters for those needs were determined next. There is significant variability in the attribute operation ranges because there are many variations in the types of AV systems and missions. For instance, storage capacity is 8–24 hours of continuous operation, but a longer continuous runtime presents other mission possibilities. The acceptable fill rate is higher for AVs because the expected operation hours per week (20–160) are less than in the MHE and public transit groups. Weight is more important for aerial AVs than underwater AVs, and volume is likely critical in all AVs.
0
1
2
3
4
5
Storage C
apac
ity
End O
f Life
Costs
Reliab
ility/a
vaila
bility
Shock
And V
ibration
MTTR
Fill Rate
Operatio
n Tem
perature
Mainten
ance
Cos
t
Preven
tative
Main
tenan
ce Fr
equen
cy
Enviro
nment
Mainten
ance
Training
Warran
ty
Weight
Volume
Operatio
n Life
time
Safety
Robustn
ess
Fuel Cost
Green
house G
as Emiss
ions
Operator
Training
# re
spon
ses
Need Priority
Must HaveLinearExciter
Created: Aug-29-11 5:01 PM
App
licat
ion:
AV
20
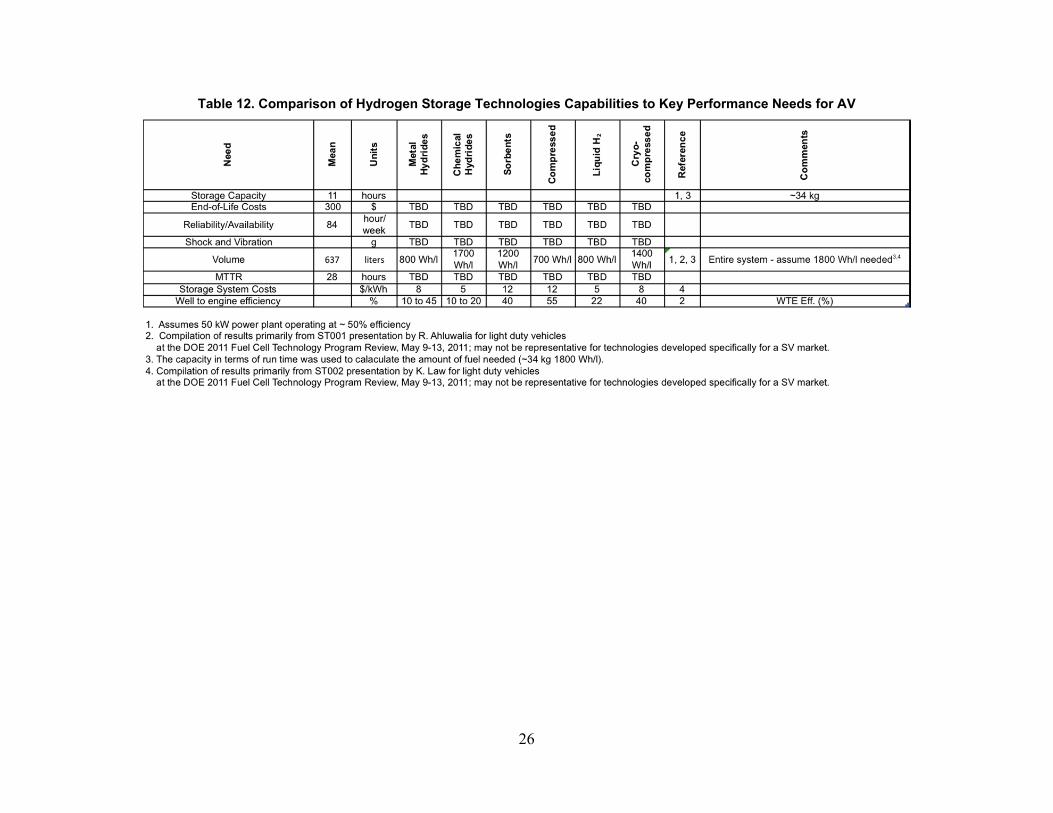
Refer to Table 9 for a complete list of all PT performance needs from the Kano Questionnaire study. The values are not specific to a particular AV system, such as aerial, and some of the values are for the entire system/vehicle and are not specific to the onboard energy system. Not all attributes received a quantitative response, for instance, there was insufficient data for the greenhouse gas emissions attribute performance range. Refer to Appendix F for a complete set of response data results.
21
Table 9. Summary of All Performance Needs for Autonomous Vehicle
Attribute Units Mean Max Min 75% percentile
25% percentile
Std Dev Kano Comments
Shock and Vibration MReliability/Availability hours/ w eek 84 168 16 40 160 64 M
MTTR hours 28 120 2 3.5 36 52 MGreenhouse Gas Emissions LOperation Temperature (Min) oC -0.8/111 140 -40 120 -25 36/22 LOperation Temperature (Max) oC -0.8/111 140 -40 120 -25 36/22 L
Fill Rate minutes 15 30 5 5 25 10 LWarranty years 5 15 2 2 7.5 6 L
Maintenance Costs $/vehicle/ year 3900 10000 500 675 7800 5294 L Per system, energy storage is a small percentage
Storage Capacity hours 11 24 8 8 12 6 M Continuous run time betw een f ills (~34 kg3,4)
Volume liters 637 1359 170 311 963 509 L Entire system - assume 1800 Wh/l needed3,4
WeightEnd of life Costs $ 300 500 100 100 500 283 MOperation lifetime
Storage System Costs MWell to engine eff iciency M WTE Eff. (%)
1. Some values are for entire SV system/vehicle2. Values are not specif ic to a certain autonomous vehicle3. Assumes 50 kW pow er plant operating at ~ 50% eff iciency4. The capacity in terms of run time w as used to calaculate the amount of fuel needed (~34 kg 1800 Wh/l).
No quantitative responses
No quantitative responses
No quantitative responses
No quantitative responses
No quantitative responses
Autonomous Vehicle1,2 Questionnaire Statistics
No quantitative responses
No quantitative responses
No quantitative responsesNo quantitative responses
No quantitative responses
22
3.4 Hydrogen Technologies Comparisons with Performance Needs Metal hydrides, chemical hydrides, sorbents, compressed, liquid, and cryo-compressed hydrogen storage technologies were all included in comparing current hydrogen storage technologies to the market performance needs. General performance attributes were assigned to each category even though there are many variations within each category.
Table 10 through Table 12 show key performance needs by application, operation values, and how a storage technology is able to satisfy the operation expectation. There are a number of entries marked “TBD,” which is an indication of little or no data to support whether the storage technology can meet the operation need.
The commercially available hydrogen storage technology that is most commonly used today is compressed storage at ambient temperature. In addition to gravimetric and volumetric capacity potentials being limited to close to present values, the major issue is hydrogen storage system cost. Another issue is the high cost and low reliability of compressing the hydrogen to relatively high pressures of 350–700 bar. However, compressed hydrogen provides rapid fill and delivery of high-purity hydrogen that can be stored indefinitely. In addition, steel tanks are used in some applications where weight is not an issue (e.g., MHE), meaning tank costs can be substantially reduced compared to applications where composites are needed for lighter weight.
Lower temperatures can be used to increase volumetric capacities further, but they require cryogenics. For example, liquid hydrogen storage at ~20 K and near atmospheric pressures enables ~30 g/L and ~6 wt % hydrogen storage systems, but dormancy and the relatively large amount of energy needed for liquefaction are critical issues. Recent work at Lawrence Livermore National Laboratory has led to the design of cryo-compressed hydrogen storage systems that combine very low temperatures (e.g., ~35 K) with high pressures (e.g., 300–700 bar) to substantially increase volumetric capacities to ~45 g/L and gravimetric capacities to ~7 wt %. However, these systems still require liquid hydrogen for fueling and have limited dormancy.
Sorbents with very high specific surface areas and nominal hydrogen isosteric heats of adsorption can increase volumetric and gravimetric capacities at any temperature and lower pressures compared to compressed hydrogen alone. In such cases, hydrogen is adsorbed on the surfaces of the material, and any interstitial volume is filled with compressed gas. Volumetric system capacities of ~35 g/L can be achieved with sorbents—higher than what is possible with liquid hydrogen—at a storage temperature of ~100 K. If cooler temperatures of ~35 K were used, sorbent systems would have capacities well in excess of cryo-compressed systems. However, the increased isosteric heats of adsorption at all temperatures must be removed during filling and nominal amounts of heat must be provided during delivery to remove the hydrogen from the sorbent. These added issues must be balanced against the increased capacities obtained with sorbents, along with the similar dormancy and hydrogen cost issues associated with cryogenic temperatures.
To enable higher capacities at temperatures near ambient, the hydrogen must be bound more strongly. Metal and chemical hydrides achieve this by forming chemical bonds with atomic hydrogen (compared to the molecular hydrogen typically associated with compressed, liquid, or sorbent storage systems). Metal hydrides typically dissociate molecular hydrogen and release heat during filling. Thus, some metal hydrides can be refilled onboard the vehicle; however,
23
higher capacity generally requires stronger binding and more heat has to be removed during fueling. In addition, metal hydride kinetics near ambient temperature may be slow and require substantial times for refueling. Also, metal hydrides may require temperatures higher than 200°C to deliver hydrogen. Other metal hydrides such as alanes must be regenerated off-vehicle because they require high pressures and temperatures. Chemical hydrides are generally regenerated off-vehicle because complex chemical processes are typically involved. Off-vehicle regeneration requires technologies to fill the tank and remove the spent products. Shipping of the hydrides and spent materials requires additional costs and technology as well. In addition, chemical hydrides typically release heat and contaminants when hydrogen is delivered, both of which impact storage system capacity and costs.
24
Table 10. Comparison of Hydrogen Storage Technologies Capabilities to Key Performance Needs for MHE
Need high up time in week (e.g. 2-3 hours for maintenance per 500 operation hours)
MTTR 2 hours TBD TBD TBD TBD TBD
Greenhouse Gas Emissions 14 63 20 14 20-40 20 2 kg-CO2 eq/kg-H2 Likely zero emissions required
Operation Temperature (Min) -40 oCOperation Temperature (Max) 60 oC
Fill Rate 3 minutes 3 to 10 <2 <2 <2 <2 <2 2 Assume a fill of 2 kg for a fill rate of 0.7 kg/min
Warranty 3 years TBD TBD TBD TBD TBD
Maintenance Costs 4420 $/vehicle/year
TBD TBD TBD TBD TBD TBD Per vehicle, energy storage is a small percentage
Storage Capacity 9 hours
Volume 387 liters 800 Wh/l
1700 Wh/l
1200 Wh/l
700 Wh/l
800 Wh/l
1400 Wh/l
1, 2, 3
Value for entire system - Assume 30% available for Storage (~1200 Wh/l)
Liquid vol capacity better if dormancy is not an issue
Weight 1190 kg ~2 wt% ~5 wt% ~6 wt% ~5 wt% ~6 wt%5 to 9 wt% 1,2, 3
Value for entire system - assume 50% available for storage (~0.8 wt%)
Liquid wt% better if dormancy is not an issue
Storage System Costs $/kWh 8 5 12 12 5 8 4Well to engine efficiency % 10 to 45 10 to 20 40 55 22 40 2 WTE Eff. (%)
1. Assumes 10 kW power plant operating at ~ 50% efficiency2. Compilation of results primarily from ST001 presentation by R. Ahluwalia for light duty vehicles at the DOE 2011 Fuel Cell Technology Program Review, May 9-13, 2011; may not be representative for technologies developed specifically for a SV market.3. The weight and volume values assumed to be for entire system and estimate 30% weight and 50% volume available for stoarge4. Compilation of results primarily from ST002 presentation by K. Law for light duty vehicles at the DOE 2011 Fuel Cell Technology Program Review, May 9-13, 2011; may not be representative for technologies developed specifically for a SV market.
25
Table 11. Comparison of Hydrogen Storage Technologies Capabilities to Key Performance Needs for Public Transit
Fill Rate 7 minutes 6 - 80 6 - 12 6 - 12 6 - 12 6 - 12 6 - 12 2 Assume 30 kg onboard for a fill rate of ~ 4 kg/min
Shock and Vibration TBD TBD TBD TBD TBD TBDOperation Lifetime 11 years TBD TBD TBD TBD TBD
Maintenance Costs 14250 $/vehicle/year
TBD TBD TBD TBD TBD TBD
Reliability/Availability 112 hours/ week
TBD TBD TBD TBD TBD 1 fill per day, assumed 5,000 fills over lifetime
Preventative Maintenance Frequency 3day/vehi
cle/ month
TBD TBD TBD TBD TBD
MTTR 3 hours TBD TBD TBD TBD TBDWeight
Storage System Costs $/kWh 8 5 12 12 5 8 3Well to engine efficiency % 10 to 45 10 to 20 40 55 22 40 2 WTE Eff. (%)
1. Assumes 100 kW power plant operating at ~ 50% efficiency2. Compilation of results primarily from ST001 presentation by R. Ahluwalia for light duty vehicles at the DOE 2011 Fuel Cell Technology Program Review, May 9-13, 2011; may not be representative for technologies developed specifically for a PT market.3. Compilation of results primarily from ST002 presentation by K. Law for light duty vehicles at the DOE 2011 Fuel Cell Technology Program Review, May 9-13, 2011; may not be representative for technologies developed specifically for a PT market.
26
Table 12. Comparison of Hydrogen Storage Technologies Capabilities to Key Performance Needs for AV
27
3.4.1 Specialty Vehicles The results from the questionnaires of whether the storage technologies will meet the must-have attributes of shock and vibration, reliability/availability, and MTTR are all inconclusive. Additional testing is needed to understand if a particular technology is more suited for the MHE environment, with the exception of compressed storage tanks. The MHE market does have experience with fuel cell and hydrogen technologies, primarily with onboard compressed hydrogen storage.
The need for reliability and availability was given in the number of hours per week the system is expected to be operational. Using this value (127 hours/week) along with the continuous runtime requirement of 9 hours and operation lifetime of 10 years, the onboard storage systems could experience 7,000 fill cycles. This number could be even higher if a runtime of 4–5 hours between fills is used for the estimate, based on feedback from the workshop discussions on MHE needs. Each technology may have different strategies to meet the required reliability and availability; for example, chemical hydrides may need to be replaced or replenished offsite periodically or the high number of cycles may require multiple recertification over the operation period of the onboard storage system.
An attribute that is closely connected to reliability is MTTR. The expectation for MTTR is 2 hours, so special considerations for repairing storage technologies (if necessary) are whether repairs can be made onsite or offsite, system complexity, and special handling requirements such as material safety procedures, toxicity, flammability, and pyrophoricity.
Another must-have MHE attribute is greenhouse gas emissions, which are assumed to be zero, particularly for indoor MHE facilities. Factors impacting the well-to-engine emissions include how the hydrogen is produced, transported, compressed, stored, and regenerated, as well as individual storage technology efficiencies. Most of these factors do not relate directly to the onboard energy storage system capabilities. The linear attribute of warranty is another example where there is a need for additional information, specifically with respect to reliability and preventative maintenance needs of the different storage technologies.
The operation temperature requirement range is –40°C to 60°C. The hydrides need additional testing to understand how these extreme low and high operation temperatures would impact performance. This is another attribute for which different operation strategies can be implemented to ensure operation.
Most of the storage technologies can be engineered to meet the fast fill times. Metal hydride is the only technology for which the fill rate is dominated by the material properties. The fill times per storage technology were calculated based on a fill amount of 5 kg, but the fill amounts for MHE will likely be 2.5 kg or less. Fill rate is not likely a major hurdle for the storage technologies for MHE.
The other linear attribute of maintenance cost is provided as cost per entire vehicle. The available maintenance cost for onboard storage from the total is likely to be a very small percentage and connected to the expectation of high reliability and low preventative maintenance for the storage systems. Maintenance features that may add to the cost include regeneration of metal hydrides, toxic gas and purity filters for chemical hydrides, and regeneration of sorbents.
28
An attribute that was not included in the Kano question set, but is a known key attribute, is capital and operation costs. The end user is unlikely to distinguish between energy storage costs and the entire drive system costs, so low equipment cost is important. An annualized cost of ownership analysis for the ARRA and Defense Logistics Agency (DLA) MHE demonstrations indicates that per lift the cost of infrastructure for fuel cell MHE is more than 2.5 greater than for a battery MHE in class I or II (Kurtz et al. 2011d).
Hydrides have low equipment costs compared with compressed and sorbents technologies but higher fuel costs. Fuel cost is also a key need for the daily operation of these systems, but most of the factors affecting fuel costs, except for well-to-drive system efficiency, are not influenced by the type of storage technology.
Another important aspect of cost is the availability of commercial off the shelf products. None of the fuel cell system original equipment manufacturers (OEMs) present at the workshops expressed an interest in designing a storage system that involves any basic research or extensive engineering time. Compressed gas cylinders have an advantage in that they may be purchased on the open market today.
3.4.2 Public Transit The results of whether the storage technologies will meet the must-have attributes of shock and vibration, reliability/availability, maintenance, operation lifetime, and MTTR are all inconclusive. Additional testing is needed to understand if a particular technology is more suited for the public transit environment, with the exception of compressed storage tanks. The public transit market does have experience with fuel cell and hydrogen technologies, primarily with onboard compressed hydrogen storage (carbon fiber tanks). Refer to the discussion in Section 3.5 for detailed discussion on the different performance needs as there is significant overlap between the public transit and MHE performance needs.
3.4.3 Autonomous Vehicles Due to the low number of responses and varied operation conditions, the market-specific performance needs are not clearly identified. Some general performance metrics overlap with MHE and public transit performance needs, but few conclusions about the comparison of hydrogen storage technology capabilities and the performance needs of the AV market can be made.
29
3.5 Summary The questionnaire and workshop results show some common performance needs, a few application specific needs, and operation ranges that are very application specific. The top five must-have attributes (along with a few key linear attributes) are summarized in Table 13.
Table 13. Summary of Key Performance Attributes by Application
MHE Public Transit AV Shock and vibration Environment Storage capacity
MTTR Storage capacity End-of-life costs
Reliability/availability Fill rate Reliability/availability
Greenhouse gas emissions Shock and vibration Shock and vibration
Operation temperature Operation lifetime MTTR
Fill rate, maintenance costs, and storage capacity
Maintenance costs, reliability/availability, preventative maintenance frequency, and MTTR
Fill rate, operation temperature, maintenance cost, preventative maintenance frequency, and warranty
Refer to Figure 9 through Figure 13 for the operation range of the key performance metrics by application. These figures identify the mean, maximum, minimum, and 25th and 75th percentiles for the responses in each application.
Figure 9. Continuous runtime between fill by application
Other MHE Public Transit AV0
5
10
15
20
25
30Range of Storage Capacity by Application
hour
s
meanmax/min25/75 Percentile
Created: Sep-07-11 3:58 PM
30
Figure 10. Range of MTTR by application
Figure 11. Fill rate ranges by application
Other MHE Public Transit AV0
20
40
60
80
100
120
Range of MTTR by Application
hour
s
meanmax/min25/75 Percentile
Created: Sep-07-11 3:57 PM
Other MHE Public Transit AV0
5
10
15
20
25
30
35Range of Fill Rate by Application
min
utes
meanmax/min25/75 Percentile
Created: Sep-07-11 3:57 PM
31
Figure 12. Operation hours per week by application
Figure 13. Range of preventative maintenance frequency by application
Other MHE Public Transit Military0
20
40
60
80
100
120
140
160
180
Range of reliability/availability by Application
hr/w
eek
meanmax/min25/75 Percentile
Created: Aug-24-11 5:43 PM
Other MHE Public Transit AV0
1
2
3
4
5
6
7
8
9
10Range of Preventative Maintenance Frequency by Application
days
/veh
icle
/mon
th
meanmax/min25/75 Percentile
Created: Sep-09-11 5:53 PM
32
4 Recommendations
A few common topics across the applications were either discussed in the workshops or identified as key performance needs in the Kano results. One of the common topics focused on the incumbent technologies in MHE and public transit markets. These markets have incumbent technologies that are well established, familiar, and generally simple. If an alternative technology is to compete in those markets, it must have similar or better performance capabilities than the incumbent. Simple, flexible, safe, low capital and operation costs, and robustness were all used to describe how an alternative technology must operate to compete in these well-established markets. These markets generally operate on thin profit margins and tend to be risk averse. Therefore, any onboard storage technology should meet the end user’s expectations that are based on experience with incumbent technologies. Particular attention should be given to onboard storage technologies that, from the operator’s perspective, are easy to use, safe, simple, and effective.
Another topic that came up frequently is how hydrogen infrastructure cost and complexity can hinder market acceptance of hydrogen fuel cell technologies in markets because a site with a small fleet size may not see a benefit with the high capital cost (Kurtz et al. 2011d). Challenges for high-pressure (~200 bar and higher) hydrogen infrastructure include hydrogen compression, storage, frequent fills in rapid succession, reliability, and capital and operation costs. Particular attention should be given to onboard storage technologies that could decrease infrastructure complexity and cost (e.g., near ambient pressure hydrogen storage options) and still satisfy the other end user performance needs.
These near-term markets, end users, and technology OEMs are not interested in long, involved product development cycles on equipment with low technology readiness levels or low manufacturing readiness levels. Compressed hydrogen storage tanks (steel and carbon fiber) are meeting many of the performance needs for these markets. However, one reason compressed tanks are the most commonly used onboard storage system is that no other validated hydrogen storage technology is readily available. Consideration should also be given to onboard storage technologies with overlap across the different markets to leverage R&D investments. The close relationship to the fuel cell system should not be overlooked. Collaboration between fuel cell OEMs and storage OEMs could result in integration gains with overall weight and volume.
4.1 Specialty Vehicles Compressed tanks are capable of satisfying many of the performance needs of the MHE market, and a number of DOE funded projects have hydrogen fuel cell MHE utilizing steel and carbon fiber tanks (250–350 bar) in field demonstrations. However, there is potential for performance gains by developing alternative hydrogen storage technologies to
• Lower storage system costs
• Simplify infrastructure with the potential for no compressor without much additional training and safety procedures compared to compressed tanks.
Key performance attributes that require R&D include high cycling, MTTR, preventative maintenance, and shock and vibration. Many of these would be best validated in real-world operation.
33
The DOE funded fuel cell MHE projects provide a reference for the current hydrogen technology capabilities. The performance status results supplement the questionnaire and workshop results for a more complete picture of the SV performance needs. (Refer to http://www.nrel.gov/hydrogen/proj_fc_market_demo.html for all publications and results.) For example, the current systems store between 0.5 and 2 kilograms of hydrogen for Class I, II, and III forklifts. Class III are the lowest power and smallest onboard hydrogen amounts. The average fill rate is 0.3 kg/min from 86,016 fill events (see Figure 14) where the average fill amount is 0.5 kg and just under 2 minutes for filling. The maximum continuous run time capability is dependent on the fuel cell system efficiency, amount of stored hydrogen, and operating conditions. Figure 15 depicts operation time between fills with the distribution of all fills and the average of just over 5 hours between fills. The insert graph highlights the range of averages per site from greater than 3 hours to less than 8 hours.
Figure 14. Histogram of fueling rates for MHE units
The average operation time between fills fits with the average daily operation for the fleets, which range from approximately 3 to 8 hours. Most fleets average one fill per day per system (see Figure 16). The kilograms dispensed per day is dependent on the fleet size and ranges from 10 to 40 kilograms.
35
Figure 16. Range of average daily kilograms of hydrogen fill frequency and amount dispensed for
the fleets (Kurtz et al. 2011c)
A cost of ownership analysis of the facilities operating fuel cell MHE indicates there is a strong relationship between fleet size and hydrogen demand to the cost benefits of fuel cell MHEs over battery MHEs. Cost benefits depend on fleet size and utilization, primarily due to amortization of infrastructure costs based on different levels of hydrogen usage. Current data (see Figure 17) already shows a strong advantage of fuel cell MHE to battery-powered MHE in high use facilities. The cost of ownership analyses breakdown major cost components and reflect many parameters, such as maintenance and productivity improvements due to reduced labor time for hydrogen filling versus a battery change out. Infrastructure cost differential between battery and fuel cells increases as the number of units in a fleet decreases making the capital cost of hydrogen infrastructure a limiting factor for fleets with only a few MHEs.
Hydrogen Use0
10
20
30
40
Avg
Dai
ly k
g
Hydrogen Use0
0.2
0.4
0.6
0.8
1
Avg
Dai
ly k
g/sy
stem
Fill Frequency 0
20
40
60
80
100
Avg
Dai
ly fi
lls
Fill Frequency 0
0.5
1
1.5
Avg
Dai
ly fi
lls/s
yste
m
NREL cdparra_mhe_22
Created: Sep-15-11 2:08 PM
Average Daily Dispensing Operations by Site - ARRA
Shaded areas represent the min and max site average hydrogen use and fill frequency
36
Figure 17. Annualized cost of ownership for battery and fuel cell forklifts with the breakdown of
major cost components (Kurtz et al. 2011d)
37
Table 14 summarizes key performance needs for the SV market using a combination of workshop, questionnaire, and demonstration performance data.
Table 14. SV Performance Needs
Need Value Comments
Volume <120 liters 0.5–2 kg current onboard capacity for fuel cell MHE units (Class I, II, and III) ~ 1,200 Wh/L
Cycles (operation life) 5,000–10,000 fills ~10 years
Fill rate <0.7 kg/min 3 min fills
Shock and vibration 3–15 g
Ambient temperature -40°C to 60°C
Operation temperature Safe for close proximity to operators
Reliability/Availability Need high up time in week (e.g. 2–3 hours for maintenance per 500 operation hours)
Environment Operating environment includes humidity, dirt, air and floor particles
Cost See Figure 17 for annualized system costs
4.2 Public Transit Compressed (carbon fiber) tanks are capable of satisfying many of the performance needs of the public transit market. A number of DOE/U.S. Department of Transportation funded projects have hydrogen fuel cell buses in field demonstrations. However, there is potential for performance gains by developing alternative hydrogen storage technologies to
• Lower storage system costs
• Simplify infrastructure with the potential for no compressor without much additional training and safety procedures than compressed tanks
• Improve relatively good volumetric capacity and weight (and therefore increased passenger capacity and route capability)
• Increase scalability (ability to fills of multiple buses sequentially without a decrease in fill amount or time).
Key performance attributes that require R&D include high cycling, MTTR, preventative maintenance, and shock and vibration. Many of these would be best validated in real world operation.
4.3 Autonomous Vehicles The AV market is smaller and not as well established as the other two markets analyzed in this report and the market-specific performance needs are not as clearly identified. Some general performance metrics overlap with MHE and public transit performance needs, so the AV market may be able to capitalize on the development of advanced hydrogen storage technologies developed for other early market applications.
38
5 References
Ahluwalia, R. (2011). System Level Analysis of Hydrogen Storage Options. Arlington, Virginia: U.S. Department of Energy.
American Public Transportation Association. (2011). Public Transportation Fact Book (62 ed.). Washington: American Public Transportation Association.
Federal Aviation Administration. (2010). Unmanned Aircraft Systems (UAS). Retrieved September 9, 2011, from Federal Aviation Administration: http://www.faa.gov/news/fact_sheets/news_story.cfm?newsId=6287
Kurtz, J.; Ainscough, C.; Simpson, L. (2011a). Onboard Energy Storage Performance Needs for Fuel Cell Motive Markets Workshop. Held in conjunction with the FCHEA Conference, National Harbor, Washington D.C.
Kurtz, J.; Ainscough, C.; Simpson, L. (2011b). Onboard Energy Storage Performance Needs for Material Handling Equipment Workshop. Held in conjunction with the ProMat2011 Expo, Chicago, IL.
Kurtz, J.; Wipke, K.; Sprik, S.; Ramsden, T.; Ainscough, C.; Saur, G. (2011c). Daily Hydrogen Fill Frequency and Amount per MHE Site. Retrieved February 10, 2012, from Early Fuel Cell Market Demonstrations: http://www.nrel.gov/hydrogen/cfm/images/cdparra_mhe_22_dailyhydrogenpersite.jpg
Kurtz, J.; Wipke, K.; Sprik, S.; Ramsden, T.; Ainscough, C.; Saur, G. (2011d). MHE Annualized Cost of Ownership. Retrieved from Early Fuel Cell Market Demonstrations: http://www.nrel.gov/hydrogen/cfm/images/cdp_mhe_58_totalcostofownership.jpg
Kurtz, J.; Wipke, K.; Sprik, S.; Ramsden, T.; Ainscough, C.; Saur, G. (2011e) MHE Fill Rates. Retrieved February 10, 2012, from Early Fuel Cell Market Demonstrations: http://www.nrel.gov/hydrogen/cfm/images/cdparra_mhe_09_refuelingrates.jpg
Kurtz, J.; Wipke, K.; Sprik, S.; Ramsden, T.; Ainscough, C. Saur, G. (2011f). MHE Maintenance Hours. Retrieved from Early Fuel Cell Market Demonstrations: http://www.nrel.gov/hydrogen/cfm/images/cdparra_mhe_43_maintenancelaborhoursbreakdown.jpg
Kurtz, J.; Wipke, K.; Sprik, S.; Ramsden, T.; Ainscough, C.; Saur, G. (2011g). MHE Operation Hours between Fills. Retrieved February 10, 2012, from Early Fuel Cell Market Demonstrations: http://www.nrel.gov/hydrogen/cfm/images/cdparra_mhe_08_ophoursbetweenfills.jpg
Mahadevan, K.; Judd, K.; Stone, H.; Zewastsky, J.; Thomas, A.; Mahy, H. et al. (2007). Identification and Characterization of Near-Term Direct Hydrogen Proton Exchange Membrane Fuel Cell Markets. Columbus: Battelle.
Rogers, L. K. (2010). “Top Lift Truck Supplier.” Modern Materials Handling: http://www.mmh.com/images/site/MMH_1008_Top20LiftTrucks.pdf
Stetson, N. (2011). 2011 Annual Merit Review and Peer Evaluation Meeting. Hydrogen Storage. Arlington, Virginia: U.S. Department of Energy.
U.S. Department of Defense (DOD). (2009). Unamanned Systems Integrated Roadmap FY2009-2034. Washington, D.C.: DOD.
U.S. Department of Energy Office of Energy Efficiency and Renewable Energy. (2010). Early Market Applications for Fuel Cell Technologies. Retrieved September 20, 2011, from Fuel Cell technologies Program: http://www1.eere.energy.gov/hydrogenandfuelcells/applications.html#specialty
U.S. Environmental Protection Agency (EPA). (1999). Technical Support for Development of Airport Ground Support Equipment Emission Reductions. Washington, D.C.: EPA.