Page 1
Section 5.4.1: Risk Assessment – Climate Change and Sea Level Rise
DMA 2000 Hazard Mitigation Plan Update – Cape May County, New Jersey 5.4.1-1 May 2016
5.4.1 Climate Change and Sea Level Rise
The following section provides the hazard profile (hazard description, location, extent, previous occurrences and
losses, and probability of future occurrences) and vulnerability assessment for the climate change and its impacts
on sea level rise in Cape May County.
2016 Plan Update Changes
For the plan update, climate change and sea level rise are profiled together. This differs from the 2010
plan when they were included in the flood profile. The hazard profile has been significantly enhanced,
using best available data, to include detailed hazard description, location, extent, and probability of
future occurrences.
New and updated figures from federal and state agencies are incorporated.
A vulnerability assessment was conducted using best available data.
5.4.1.1 Profile
Hazard Description
Climate Change
Climate change refers to any significant change in the measures of climate lasting for an extended period of time.
Climate change includes major changes in temperature, precipitation, or wind patterns, which occur over several
decades or longer. The earth’s average temperature has risen by 1.5°F over the past century and is projected to
rise another 0.5 to 8.6°F over the next 100 years (U.S. EPA 2016).
The rise in temperatures have been accompanied by changes in weather and climate. Many areas have seen
changes in rainfall, resulting in more floods, droughts or intense rain storms, as well as more frequent and severe
heat waves. Additionally, the earth’s oceans and glaciers have experienced changes as well. The oceans are
warming and becoming more acidic, ice caps are melting, and sea levels are rising (U.S. EPA 2016).
The State of New Jersey is also being impacted by the impacts of climate change. Between 1971 and 2001, the
state observed an increase in average annual temperatures of 1.2°F between 1971 and 2000 and the most recent
decade of 2001 and 2010 (ONJSC 2011). By the 2020s, the average annual temperature in New Jersey is
projected to increase by 1.5°F to 3°F above the statewide baseline (1971 to 2000), which was 52.7°F. By 2050,
the temperature is projected to increase 3°F to 5°F (Sustainable Jersey Climate Change Adaptation Task Force
2013).
In addition to warmer temperatures, there has also been an increase the amount of precipitation in New Jersey.
Northern New Jersey’s 1971-2000 precipitation average was over five inches (12%) greater than the average
from 1895-1970. Southern New Jersey was two inches (five-percent) wetter late in the 20th century (Office of
New Jersey State Climatologist). Average annual precipitation is projected to increase in the region by five-
percent by the 2020s and up to 10% by the 2050s. Most of the additional precipitation is expected to come during
the winter months (New York City Panel on Climate Change [NPCC] 2009). In addition, heavy precipitation
events have increased in the past 20 years.
The changing climate impacts populations and ecosystems in numerous ways. For the purpose of this HMP
update, this profile will include climate change and the impacts it has on sea level rise in Cape May County.
Each of the hazard profiles (Section 5.4.2 through Section 5.4.9) discuss the impacts climate change on each of
the hazards of concern for the county.
Page 2
Section 5.4.1: Risk Assessment – Climate Change and Sea Level Rise
DMA 2000 Hazard Mitigation Plan Update – Cape May County, New Jersey 5.4.1-2 May 2016
Sea Level Rise
Sea level rise associated with climate change will have significant effects on coastal areas, including Cape May
County. Long-term sea level records show changes in global temperatures, hydrologic cycles, coverage of
glaciers and ice sheets, and storm frequency and intensity. Sea levels provide a key to understanding the impact
of climate change (NOAA 2015).
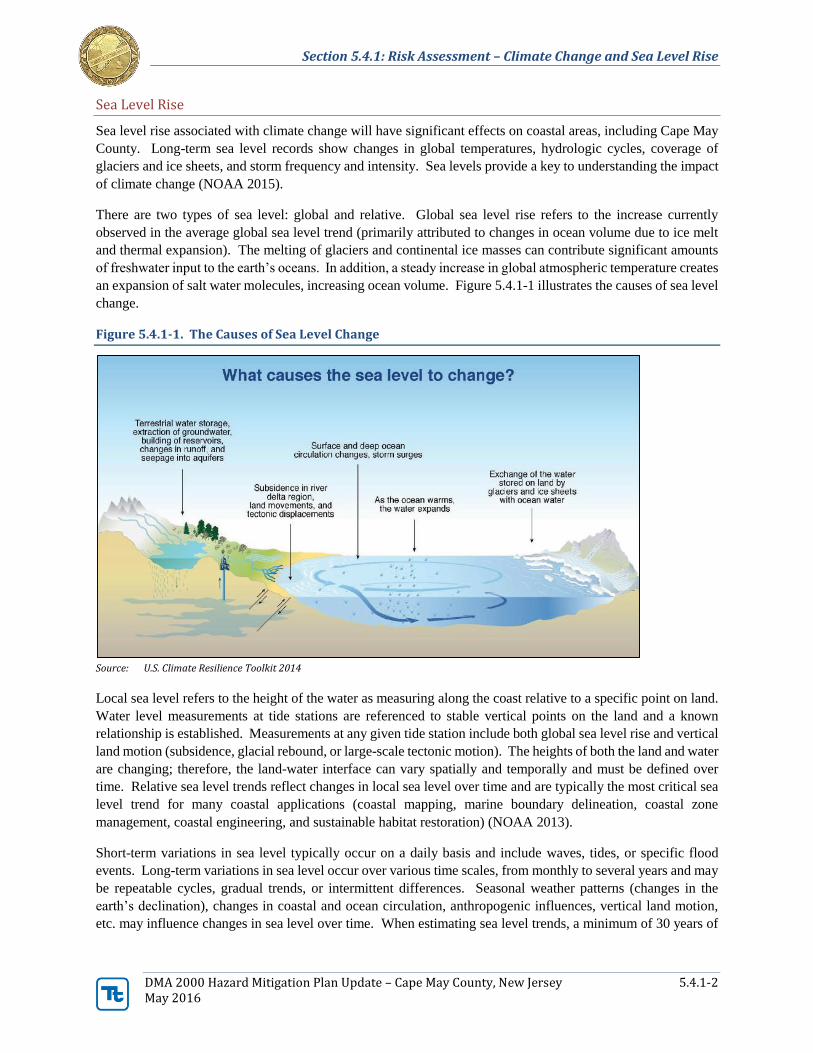
There are two types of sea level: global and relative. Global sea level rise refers to the increase currently
observed in the average global sea level trend (primarily attributed to changes in ocean volume due to ice melt
and thermal expansion). The melting of glaciers and continental ice masses can contribute significant amounts
of freshwater input to the earth’s oceans. In addition, a steady increase in global atmospheric temperature creates
an expansion of salt water molecules, increasing ocean volume. Figure 5.4.1-1 illustrates the causes of sea level
change.
Figure 5.4.1-1. The Causes of Sea Level Change
Source: U.S. Climate Resilience Toolkit 2014
Local sea level refers to the height of the water as measuring along the coast relative to a specific point on land.
Water level measurements at tide stations are referenced to stable vertical points on the land and a known
relationship is established. Measurements at any given tide station include both global sea level rise and vertical
land motion (subsidence, glacial rebound, or large-scale tectonic motion). The heights of both the land and water
are changing; therefore, the land-water interface can vary spatially and temporally and must be defined over
time. Relative sea level trends reflect changes in local sea level over time and are typically the most critical sea
level trend for many coastal applications (coastal mapping, marine boundary delineation, coastal zone
management, coastal engineering, and sustainable habitat restoration) (NOAA 2013).
Short-term variations in sea level typically occur on a daily basis and include waves, tides, or specific flood
events. Long-term variations in sea level occur over various time scales, from monthly to several years and may
be repeatable cycles, gradual trends, or intermittent differences. Seasonal weather patterns (changes in the
earth’s declination), changes in coastal and ocean circulation, anthropogenic influences, vertical land motion,
etc. may influence changes in sea level over time. When estimating sea level trends, a minimum of 30 years of
Page 3
Section 5.4.1: Risk Assessment – Climate Change and Sea Level Rise
DMA 2000 Hazard Mitigation Plan Update – Cape May County, New Jersey 5.4.1-3 May 2016
data are used in order to account for long-term sea level variations and reduce errors in computing sea level
trends based on monthly mean sea level (NOAA 2013).
During the 20th century, global sea level rose at an average rate of 0.6 inches per decade. Thermal expansion of
a warming ocean and the melting of glaciers and ice sheets were the primary reasons for this rise in global sea
level. Thermal expansion made the same amount of water take up more space, and the melting of glaciers and
ice sheets added water to the ocean. The rate of global sea level rise has increased, with an average rate of 1.2
inches per decade since the early 1990s. Rates of sea level rise vary globally, and sea levels along the New
Jersey coastline have risen faster than the global average. The rate of sea level rise is greater along the coastal
plain of New Jersey due to the land subsiding at the same time that water levels are rising, this includes Cape
May County (Rutgers 2013).
According to NOAA, sea level rise can amplify factors that currently contribute to coastal flooding: high tides,
storm surge, high waves, and high runoff from rivers and creeks. All of these factors change during extreme
weather and climate events (NOAA 2012). Other secondary hazards that could occur along the mid-Atlantic
coast in response to sea level rise:
Bluff and upland erosion – shorelines composed of older geologic units that form headland regions of
the coast will retreat landward with rising sea level. As sea level rises, the uplands are eroded and sandy
materials are incorporated into the beach and dune systems along the shore and adjacent compartments
(Gutierrez et al. 2007).
Overwash, inlet processes, shoreline retreat, and barrier island narrowing – as sea level rise occurs,
storm overwash will become more likely. Tidal inlet formation and migration will become important
components of future shoreline changes. Barrier islands are subject to inlet formation by storms. If the
storm surge produces channels that extend below sea level, an inlet may persist after the storm. The
combination of rising sea level and stronger storms can create the potential to accelerate shoreline retreat
in many locations. Assessments of shoreline change on barrier islands have shown that barrier island
narrowing has been observed on some islands over the last 100 years (Gutierrez et al. 2007).
Threshold behavior – changes in sea level rise can lead to conditions where a barrier system becomes
less stable and crosses a geomorphic threshold; making the potential for rapid barrier-island migration
or segmentation/disintegration high. Unstable barriers may be defined by rapid landward recession of
the ocean shoreline, decrease in barrier width and height, increased overwashing during storms,
increased barrier breaching and inlet formation, or chronic loss of beach and dune sand volume. With
the rates of sea level rise and climate change, it is very likely that these conditions will worsen (Gutierrez
et al. 2007).
Loss of critical habitat – natural ecosystems may be impacted by warmer temperatures and associated
changes in the water cycle. The changes could lead to loss of critical habitat and further stresses on
some threatened and endangered species (Rutgers 2013).
Location
Climate change is a concern for the entire United States and it will impact all areas of the country. Sea level rise
is associated with climate change and has been experienced by coastal communities for the past 50 years (Union
of Concerned Scientists 2009). In New Jersey, coastal communities include any land adjacent to a tidally
influenced waterway and includes the Atlantic Coast, the Delaware Bayshore, and the urban coast which lies
along the tidal portion of the Hudson River (Rutgers 2015). Cape May County is located in the coastal areas of
New Jersey and is vulnerable to both climate change and sea level rise. According to Figure 5.4.1-4 (found later
in this profile), project sea level rise of just one foot will impact nearly half of Cape May County.
Page 4
Section 5.4.1: Risk Assessment – Climate Change and Sea Level Rise
DMA 2000 Hazard Mitigation Plan Update – Cape May County, New Jersey 5.4.1-4 May 2016
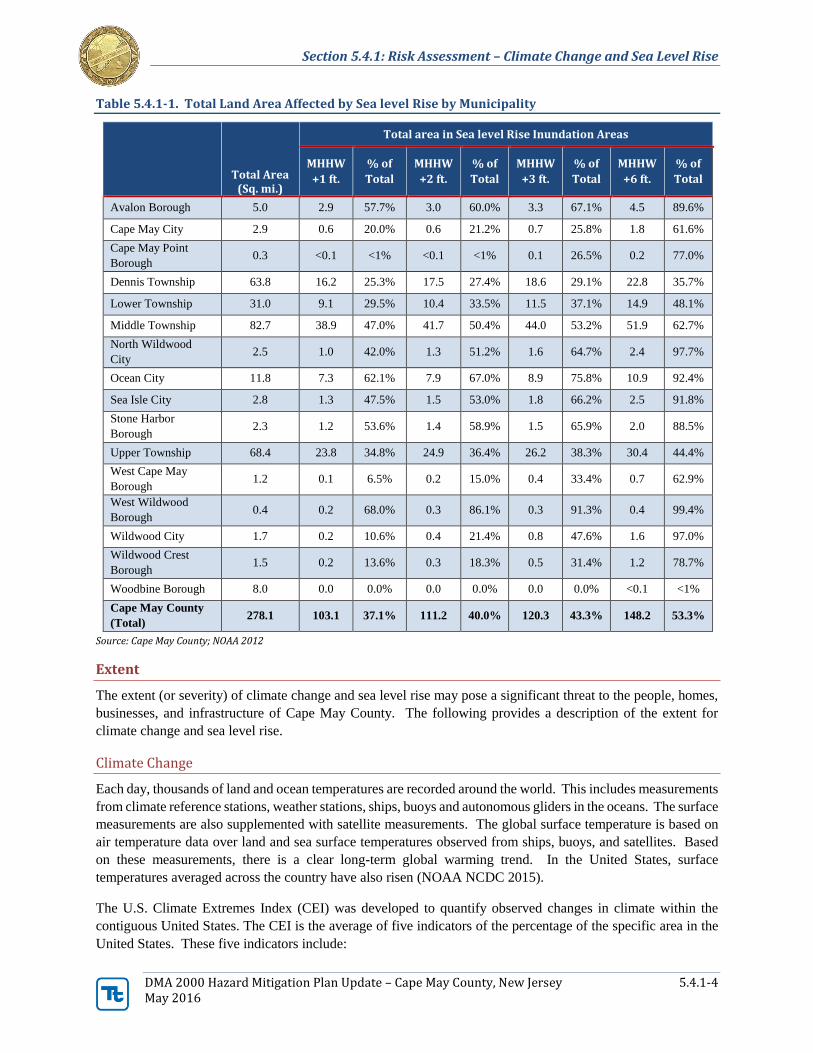
Table 5.4.1-1. Total Land Area Affected by Sea level Rise by Municipality
Total Area (Sq. mi.)
Total area in Sea level Rise Inundation Areas
MHHW
+1 ft.
% of
Total
MHHW
+2 ft.
% of
Total
MHHW
+3 ft.
% of
Total
MHHW
+6 ft.
% of
Total
Avalon Borough 5.0 2.9 57.7% 3.0 60.0% 3.3 67.1% 4.5 89.6%
Cape May City 2.9 0.6 20.0% 0.6 21.2% 0.7 25.8% 1.8 61.6%
Cape May Point
Borough 0.3 <0.1 <1% <0.1 <1% 0.1 26.5% 0.2 77.0%
Dennis Township 63.8 16.2 25.3% 17.5 27.4% 18.6 29.1% 22.8 35.7%
Lower Township 31.0 9.1 29.5% 10.4 33.5% 11.5 37.1% 14.9 48.1%
Middle Township 82.7 38.9 47.0% 41.7 50.4% 44.0 53.2% 51.9 62.7%
North Wildwood
City 2.5 1.0 42.0% 1.3 51.2% 1.6 64.7% 2.4 97.7%
Ocean City 11.8 7.3 62.1% 7.9 67.0% 8.9 75.8% 10.9 92.4%
Sea Isle City 2.8 1.3 47.5% 1.5 53.0% 1.8 66.2% 2.5 91.8%
Stone Harbor
Borough 2.3 1.2 53.6% 1.4 58.9% 1.5 65.9% 2.0 88.5%
Upper Township 68.4 23.8 34.8% 24.9 36.4% 26.2 38.3% 30.4 44.4%
West Cape May
Borough 1.2 0.1 6.5% 0.2 15.0% 0.4 33.4% 0.7 62.9%
West Wildwood
Borough 0.4 0.2 68.0% 0.3 86.1% 0.3 91.3% 0.4 99.4%
Wildwood City 1.7 0.2 10.6% 0.4 21.4% 0.8 47.6% 1.6 97.0%
Wildwood Crest
Borough 1.5 0.2 13.6% 0.3 18.3% 0.5 31.4% 1.2 78.7%
Woodbine Borough 8.0 0.0 0.0% 0.0 0.0% 0.0 0.0% <0.1 <1%
Cape May County
(Total) 278.1 103.1 37.1% 111.2 40.0% 120.3 43.3% 148.2 53.3%
Source: Cape May County; NOAA 2012
Extent
The extent (or severity) of climate change and sea level rise may pose a significant threat to the people, homes,
businesses, and infrastructure of Cape May County. The following provides a description of the extent for
climate change and sea level rise.
Climate Change
Each day, thousands of land and ocean temperatures are recorded around the world. This includes measurements
from climate reference stations, weather stations, ships, buoys and autonomous gliders in the oceans. The surface
measurements are also supplemented with satellite measurements. The global surface temperature is based on
air temperature data over land and sea surface temperatures observed from ships, buoys, and satellites. Based
on these measurements, there is a clear long-term global warming trend. In the United States, surface
temperatures averaged across the country have also risen (NOAA NCDC 2015).
The U.S. Climate Extremes Index (CEI) was developed to quantify observed changes in climate within the
contiguous United States. The CEI is the average of five indicators of the percentage of the specific area in the
United States. These five indicators include:
Page 5
Section 5.4.1: Risk Assessment – Climate Change and Sea Level Rise
DMA 2000 Hazard Mitigation Plan Update – Cape May County, New Jersey 5.4.1-5 May 2016
1) The sum of (a) percentage of the United States with maximum temperatures much below normal and
(b) percentage of the United States with maximum temperatures much above normal;
2) The sum of (a) percentage of the United States with minimum temperatures much below normal and (b)
percentage of the United States with minimum temperatures much above normal;
3) The sum of (a) percentage of the United States in severe drought (equivalent to the lowest tenth
percentile) based on the PDSI and (b) percentage of the United States with severe moisture surplus
(equivalent to the highest tenth percentile) based on the PDSI;
4) Twice the value of the percentage of the United States with a much greater than normal proportion of
precipitation derived from extreme (equivalent to the highest tenth percentile) 1-day precipitation
events; and
5) The sum of (a) percentage of the United States with a much greater than normal number of days with
precipitation and (b) percentage of the United States with a much greater than normal number of days
without precipitation
There is a sixth indicator (the sum of squares of U.S. landfalling tropical storm and hurricane wind velocities
scaled to the mean of the first five indicators); however, it is only used when the period of interest includes
months with significant tropical activity. The figure below shows the CEI graph for the northeast United States,
which includes New Jersey and Cape May County. A value of 0% for the CEI indicates that no portion of the
period of record was subject to any extremes of temperature or precipitation considered in the index. A value of
100% means that the entire country had extreme conditions throughout the year for each of the indicators.
Therefore, observed CEI values of more than 20 percent indicate "more extreme" conditions than average, and
CEI values less than 20 percent indicate "less extreme" conditions than average.
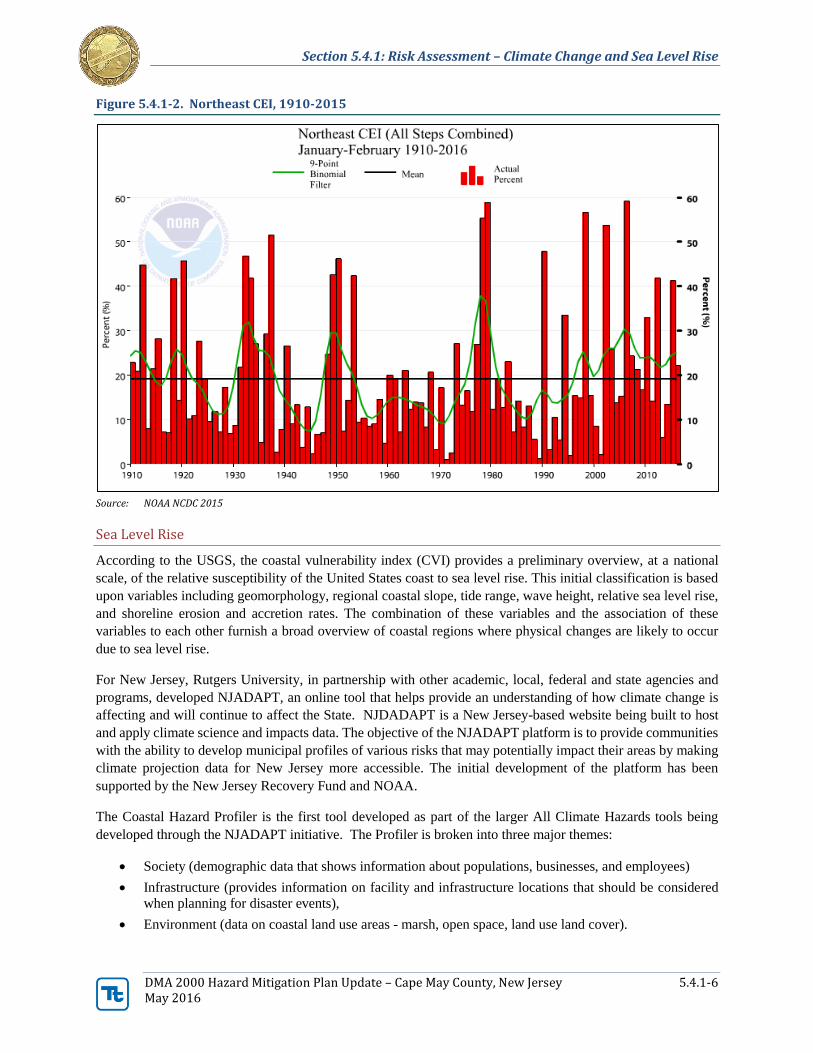
The figure below shows the CEI for the northeast United States, from 1910 to 2015. According to this figure,
in the last 30 years, the northeast has experienced extreme conditions for the indicators of the CEI. In 2006,
59.18% of the northeast experienced extreme conditions throughout the year. Most recently, in 2015, the 41.32%
of the northeast experienced extreme conditions (NOAA NCDC 2015).
Page 6
Section 5.4.1: Risk Assessment – Climate Change and Sea Level Rise
DMA 2000 Hazard Mitigation Plan Update – Cape May County, New Jersey 5.4.1-6 May 2016
Figure 5.4.1-2. Northeast CEI, 1910-2015
Source: NOAA NCDC 2015
Sea Level Rise
According to the USGS, the coastal vulnerability index (CVI) provides a preliminary overview, at a national
scale, of the relative susceptibility of the United States coast to sea level rise. This initial classification is based
upon variables including geomorphology, regional coastal slope, tide range, wave height, relative sea level rise,
and shoreline erosion and accretion rates. The combination of these variables and the association of these
variables to each other furnish a broad overview of coastal regions where physical changes are likely to occur
due to sea level rise.
For New Jersey, Rutgers University, in partnership with other academic, local, federal and state agencies and
programs, developed NJADAPT, an online tool that helps provide an understanding of how climate change is
affecting and will continue to affect the State. NJDADAPT is a New Jersey-based website being built to host
and apply climate science and impacts data. The objective of the NJADAPT platform is to provide communities
with the ability to develop municipal profiles of various risks that may potentially impact their areas by making
climate projection data for New Jersey more accessible. The initial development of the platform has been
supported by the New Jersey Recovery Fund and NOAA.
The Coastal Hazard Profiler is the first tool developed as part of the larger All Climate Hazards tools being
developed through the NJADAPT initiative. The Profiler is broken into three major themes:
Society (demographic data that shows information about populations, businesses, and employees)
Infrastructure (provides information on facility and infrastructure locations that should be considered
when planning for disaster events),
Environment (data on coastal land use areas - marsh, open space, land use land cover).
Page 7
Section 5.4.1: Risk Assessment – Climate Change and Sea Level Rise
DMA 2000 Hazard Mitigation Plan Update – Cape May County, New Jersey 5.4.1-7 May 2016
Each of the profiles allow the viewer to see the themed data and then overlay a hazard layer of your choice to
see what the potential impacts may be. The hazard layers include SLOSH for Categories 1-4, NJ Coastal
Flooding Exposure (CFE), Sea Level Rise for 1-6 feet, Coastal Vulnerability Index, Shallow Coastal Flooding,
FEMA Flood Zones, and Sandy Surge Extent. This tool allows you to create maps that you can then package
and share links to or create pdfs from for further use. The mapping program is found here:
http://www.njadapt.org/
The global sea level trend has been recorded by satellite altimeters since 1992 and the latest calculation can be
obtained from NOAA’s Laboratory for Satellite Altimetry. The University of Colorado’s Sea Level Research
Group compares global sea level rates calculated by different research organizations and provides detailed
explanations about the issues involved (NOAA 2013). A map of regional MSL in the United States can be found
here: http://tidesandcurrents.noaa.gov/sltrends/slrmap.htm. The map provides an overview of variations in the
rates of relative local MSL at long-term tide stations. The variations in sea level trends primarily reflect
differences in rates and sources of vertical land motion. Areas that experienced little-to-no change in MSL are
shown in green, including stations consistent with average global sea level rise rate of 1.7 to 1.8 mm/year. These
stations do not experience significant vertical land motion. Stations that experienced positive sea level trends
(yellow to red) experience both global sea level rise and lowering or sinking of the local land, causing an apparent
exaggerated rate of relative sea level rise. Stations that are blue to brown have experienced global sea level rise
and a greater vertical rise in local land, causing an apparent decrease in relative sea level. The rates of relative
sea level rise reflect actual observations and must be accounted for in any coastal planning or engineering
applications (NOAA 2013).
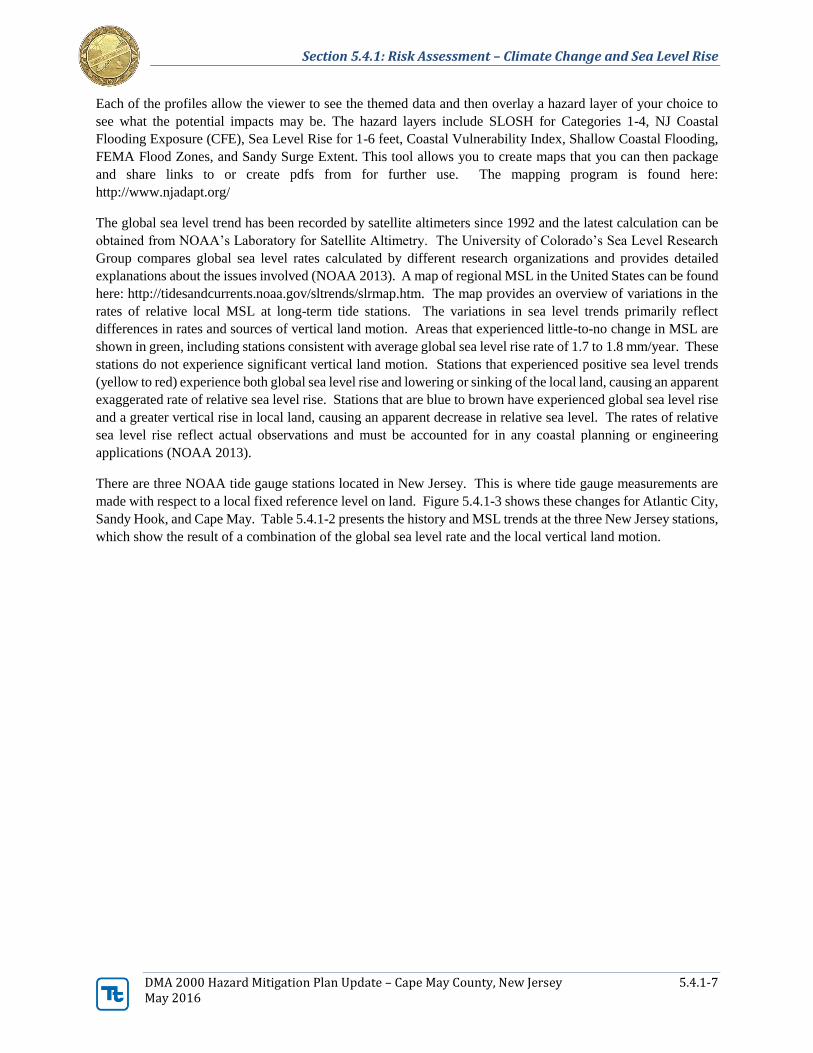
There are three NOAA tide gauge stations located in New Jersey. This is where tide gauge measurements are
made with respect to a local fixed reference level on land. Figure 5.4.1-3 shows these changes for Atlantic City,
Sandy Hook, and Cape May. Table 5.4.1-2 presents the history and MSL trends at the three New Jersey stations,
which show the result of a combination of the global sea level rate and the local vertical land motion.
Page 8
Section 5.4.1: Risk Assessment – Climate Change and Sea Level Rise
DMA 2000 Hazard Mitigation Plan Update – Cape May County, New Jersey 5.4.1-8 May 2016
Figure 5.4.1-3. Mean Sea Level Trends in New Jersey
Source: NOAA 2016
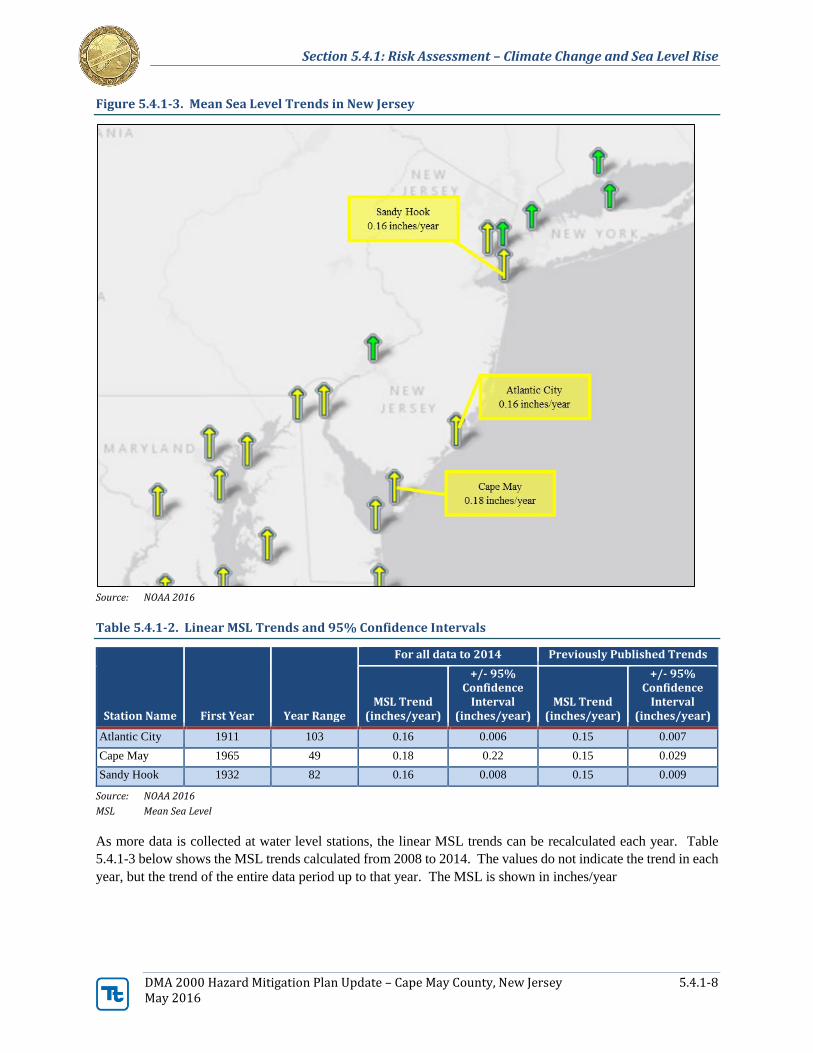
Table 5.4.1-2. Linear MSL Trends and 95% Confidence Intervals
Station Name First Year Year Range
For all data to 2014 Previously Published Trends
MSL Trend (inches/year)
+/- 95% Confidence
Interval (inches/year)
MSL Trend (inches/year)
+/- 95% Confidence
Interval (inches/year)
Atlantic City 1911 103 0.16 0.006 0.15 0.007
Cape May 1965 49 0.18 0.22 0.15 0.029
Sandy Hook 1932 82 0.16 0.008 0.15 0.009
Source: NOAA 2016
MSL Mean Sea Level
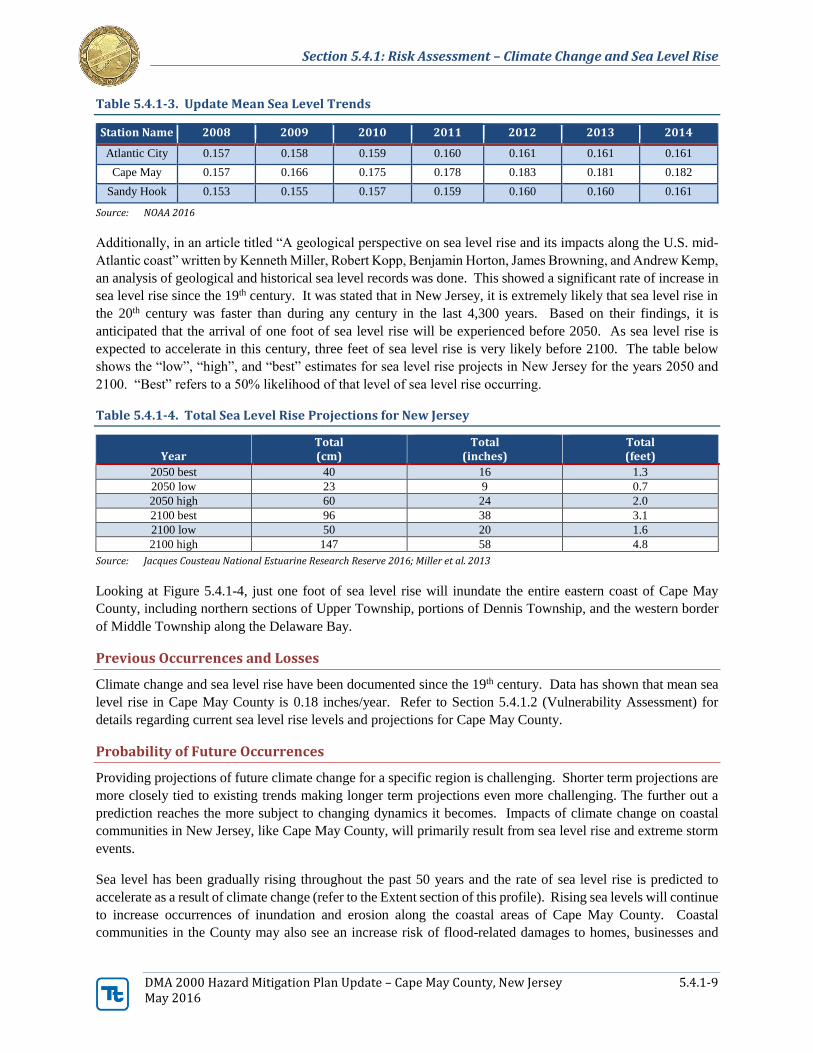
As more data is collected at water level stations, the linear MSL trends can be recalculated each year. Table
5.4.1-3 below shows the MSL trends calculated from 2008 to 2014. The values do not indicate the trend in each
year, but the trend of the entire data period up to that year. The MSL is shown in inches/year
Page 9
Section 5.4.1: Risk Assessment – Climate Change and Sea Level Rise
DMA 2000 Hazard Mitigation Plan Update – Cape May County, New Jersey 5.4.1-9 May 2016
Table 5.4.1-3. Update Mean Sea Level Trends
Station Name 2008 2009 2010 2011 2012 2013 2014
Atlantic City 0.157 0.158 0.159 0.160 0.161 0.161 0.161
Cape May 0.157 0.166 0.175 0.178 0.183 0.181 0.182
Sandy Hook 0.153 0.155 0.157 0.159 0.160 0.160 0.161
Source: NOAA 2016
Additionally, in an article titled “A geological perspective on sea level rise and its impacts along the U.S. mid-
Atlantic coast” written by Kenneth Miller, Robert Kopp, Benjamin Horton, James Browning, and Andrew Kemp,
an analysis of geological and historical sea level records was done. This showed a significant rate of increase in
sea level rise since the 19th century. It was stated that in New Jersey, it is extremely likely that sea level rise in
the 20th century was faster than during any century in the last 4,300 years. Based on their findings, it is
anticipated that the arrival of one foot of sea level rise will be experienced before 2050. As sea level rise is
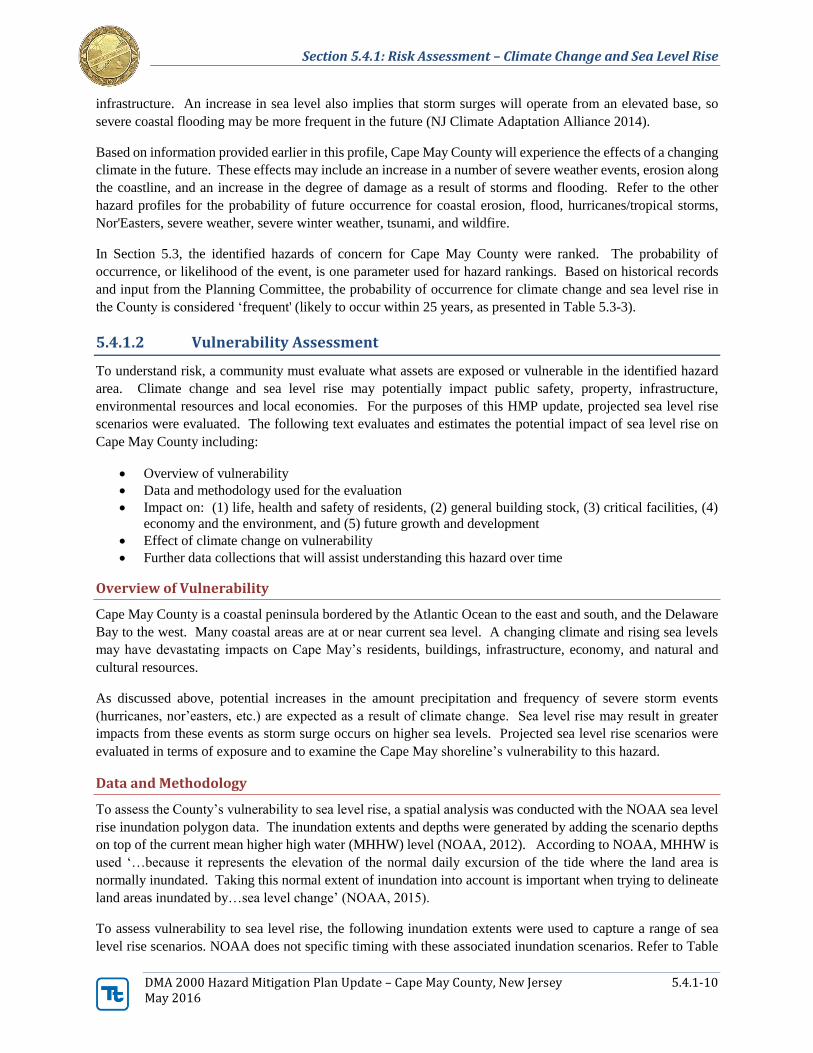
expected to accelerate in this century, three feet of sea level rise is very likely before 2100. The table below
shows the “low”, “high”, and “best” estimates for sea level rise projects in New Jersey for the years 2050 and
2100. “Best” refers to a 50% likelihood of that level of sea level rise occurring.
Table 5.4.1-4. Total Sea Level Rise Projections for New Jersey
Year Total (cm)
Total (inches)
Total (feet)
2050 best 40 16 1.3
2050 low 23 9 0.7
2050 high 60 24 2.0
2100 best 96 38 3.1
2100 low 50 20 1.6
2100 high 147 58 4.8
Source: Jacques Cousteau National Estuarine Research Reserve 2016; Miller et al. 2013
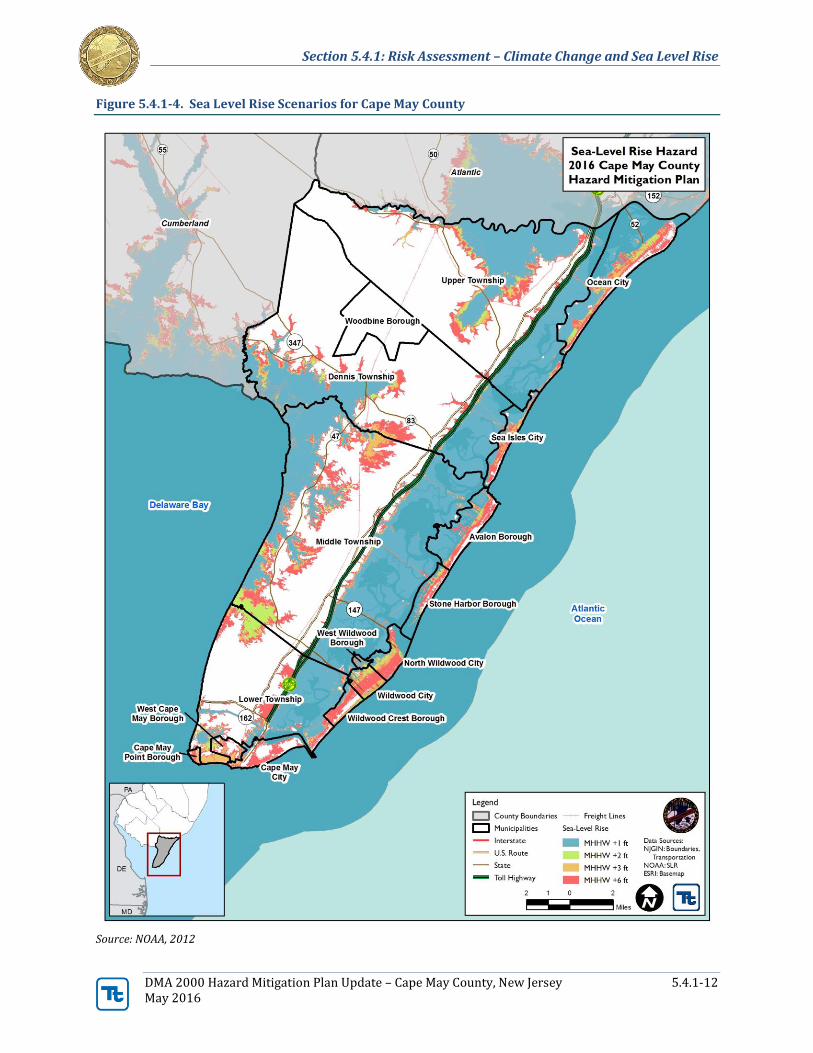
Looking at Figure 5.4.1-4, just one foot of sea level rise will inundate the entire eastern coast of Cape May
County, including northern sections of Upper Township, portions of Dennis Township, and the western border
of Middle Township along the Delaware Bay.
Previous Occurrences and Losses
Climate change and sea level rise have been documented since the 19th century. Data has shown that mean sea
level rise in Cape May County is 0.18 inches/year. Refer to Section 5.4.1.2 (Vulnerability Assessment) for
details regarding current sea level rise levels and projections for Cape May County.
Probability of Future Occurrences
Providing projections of future climate change for a specific region is challenging. Shorter term projections are
more closely tied to existing trends making longer term projections even more challenging. The further out a
prediction reaches the more subject to changing dynamics it becomes. Impacts of climate change on coastal
communities in New Jersey, like Cape May County, will primarily result from sea level rise and extreme storm
events.
Sea level has been gradually rising throughout the past 50 years and the rate of sea level rise is predicted to
accelerate as a result of climate change (refer to the Extent section of this profile). Rising sea levels will continue
to increase occurrences of inundation and erosion along the coastal areas of Cape May County. Coastal
communities in the County may also see an increase risk of flood-related damages to homes, businesses and
Page 10
Section 5.4.1: Risk Assessment – Climate Change and Sea Level Rise
DMA 2000 Hazard Mitigation Plan Update – Cape May County, New Jersey 5.4.1-10 May 2016
infrastructure. An increase in sea level also implies that storm surges will operate from an elevated base, so
severe coastal flooding may be more frequent in the future (NJ Climate Adaptation Alliance 2014).
Based on information provided earlier in this profile, Cape May County will experience the effects of a changing
climate in the future. These effects may include an increase in a number of severe weather events, erosion along
the coastline, and an increase in the degree of damage as a result of storms and flooding. Refer to the other
hazard profiles for the probability of future occurrence for coastal erosion, flood, hurricanes/tropical storms,
Nor'Easters, severe weather, severe winter weather, tsunami, and wildfire.
In Section 5.3, the identified hazards of concern for Cape May County were ranked. The probability of
occurrence, or likelihood of the event, is one parameter used for hazard rankings. Based on historical records
and input from the Planning Committee, the probability of occurrence for climate change and sea level rise in
the County is considered ‘frequent' (likely to occur within 25 years, as presented in Table 5.3-3).
5.4.1.2 Vulnerability Assessment
To understand risk, a community must evaluate what assets are exposed or vulnerable in the identified hazard
area. Climate change and sea level rise may potentially impact public safety, property, infrastructure,
environmental resources and local economies. For the purposes of this HMP update, projected sea level rise
scenarios were evaluated. The following text evaluates and estimates the potential impact of sea level rise on
Cape May County including:
Overview of vulnerability
Data and methodology used for the evaluation
Impact on: (1) life, health and safety of residents, (2) general building stock, (3) critical facilities, (4)
economy and the environment, and (5) future growth and development
Effect of climate change on vulnerability
Further data collections that will assist understanding this hazard over time
Overview of Vulnerability
Cape May County is a coastal peninsula bordered by the Atlantic Ocean to the east and south, and the Delaware
Bay to the west. Many coastal areas are at or near current sea level. A changing climate and rising sea levels
may have devastating impacts on Cape May’s residents, buildings, infrastructure, economy, and natural and
cultural resources.
As discussed above, potential increases in the amount precipitation and frequency of severe storm events
(hurricanes, nor’easters, etc.) are expected as a result of climate change. Sea level rise may result in greater
impacts from these events as storm surge occurs on higher sea levels. Projected sea level rise scenarios were
evaluated in terms of exposure and to examine the Cape May shoreline’s vulnerability to this hazard.
Data and Methodology
To assess the County’s vulnerability to sea level rise, a spatial analysis was conducted with the NOAA sea level
rise inundation polygon data. The inundation extents and depths were generated by adding the scenario depths
on top of the current mean higher high water (MHHW) level (NOAA, 2012). According to NOAA, MHHW is
used ‘…because it represents the elevation of the normal daily excursion of the tide where the land area is
normally inundated. Taking this normal extent of inundation into account is important when trying to delineate
land areas inundated by…sea level change’ (NOAA, 2015).
To assess vulnerability to sea level rise, the following inundation extents were used to capture a range of sea
level rise scenarios. NOAA does not specific timing with these associated inundation scenarios. Refer to Table
Page 11
Section 5.4.1: Risk Assessment – Climate Change and Sea Level Rise
DMA 2000 Hazard Mitigation Plan Update – Cape May County, New Jersey 5.4.1-11 May 2016
5.4.1-3 presented earlier which summarizes best estimates for sea level rise projections for New Jersey for the
years 2050 and 2100. The scenarios used for this assessment were chosen based on the “best” estimate for 2050
and 2100 (+1 ft. and +3 ft.). MHHW +2 was chosen as an intermediate estimate between the 2050 and 2100
“best” estimates, and MHHW +6 was chosen to assess the worst-case scenario. Figure 5.4.1-4 illustrates the
NOAA sea level rise scenarios boundaries used for this vulnerability assessment.
Current MHHW + 1 foot
Current MHHW +2 feet
Current MHHW +3 feet
Current MHHW +6 feet
In addition to the rising sea level, sea level rise may also result in greater impact from storm events. The potential
exposure and loss from surge atop a higher sea level is not included in the analysis and results summarized
below.
Page 12
Section 5.4.1: Risk Assessment – Climate Change and Sea Level Rise
DMA 2000 Hazard Mitigation Plan Update – Cape May County, New Jersey 5.4.1-12 May 2016
Figure 5.4.1-4. Sea Level Rise Scenarios for Cape May County
Source: NOAA, 2012
Page 13
Section 5.4.1: Risk Assessment – Climate Change and Sea Level Rise
DMA 2000 Hazard Mitigation Plan Update – Cape May County, New Jersey 5.4.1-13 May 2016
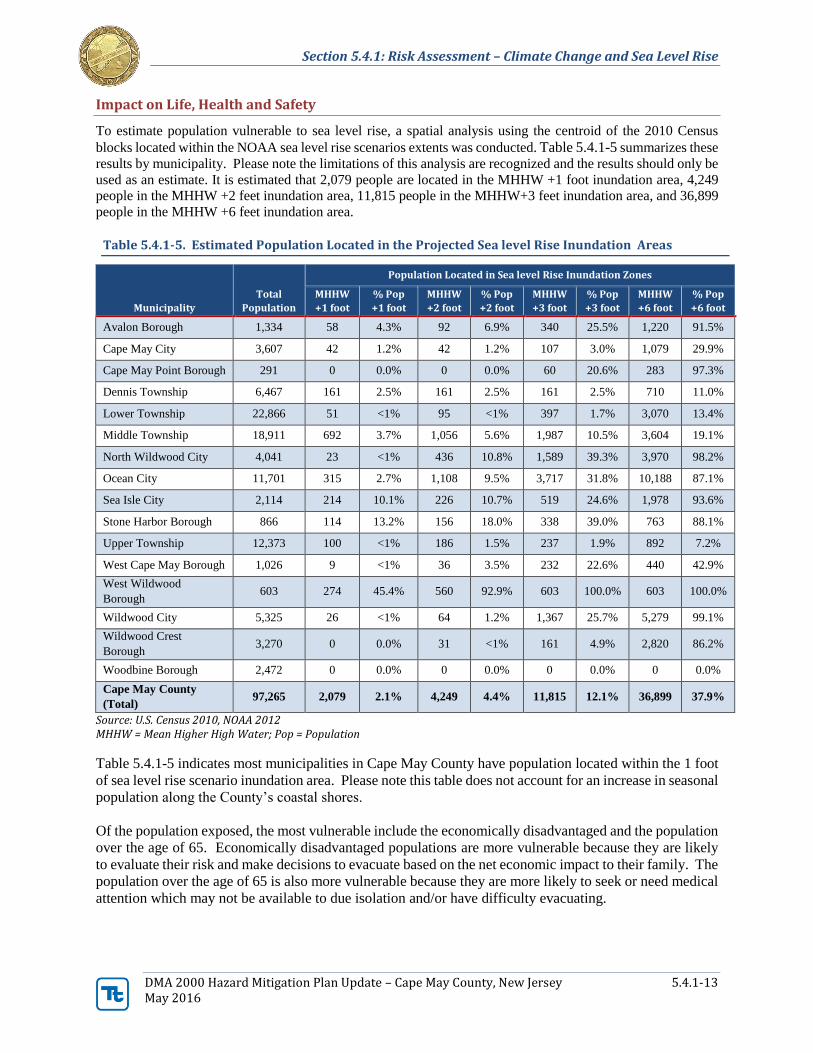
Impact on Life, Health and Safety
To estimate population vulnerable to sea level rise, a spatial analysis using the centroid of the 2010 Census
blocks located within the NOAA sea level rise scenarios extents was conducted. Table 5.4.1-5 summarizes these
results by municipality. Please note the limitations of this analysis are recognized and the results should only be
used as an estimate. It is estimated that 2,079 people are located in the MHHW +1 foot inundation area, 4,249
people in the MHHW +2 feet inundation area, 11,815 people in the MHHW+3 feet inundation area, and 36,899
people in the MHHW +6 feet inundation area.
Table 5.4.1-5. Estimated Population Located in the Projected Sea level Rise Inundation Areas
Municipality
Total
Population
Population Located in Sea level Rise Inundation Zones
MHHW
+1 foot
% Pop
+1 foot
MHHW
+2 foot
% Pop
+2 foot
MHHW
+3 foot
% Pop
+3 foot
MHHW
+6 foot
% Pop
+6 foot
Avalon Borough 1,334 58 4.3% 92 6.9% 340 25.5% 1,220 91.5%
Cape May City 3,607 42 1.2% 42 1.2% 107 3.0% 1,079 29.9%
Cape May Point Borough 291 0 0.0% 0 0.0% 60 20.6% 283 97.3%
Dennis Township 6,467 161 2.5% 161 2.5% 161 2.5% 710 11.0%
Lower Township 22,866 51 <1% 95 <1% 397 1.7% 3,070 13.4%
Middle Township 18,911 692 3.7% 1,056 5.6% 1,987 10.5% 3,604 19.1%
North Wildwood City 4,041 23 <1% 436 10.8% 1,589 39.3% 3,970 98.2%
Ocean City 11,701 315 2.7% 1,108 9.5% 3,717 31.8% 10,188 87.1%
Sea Isle City 2,114 214 10.1% 226 10.7% 519 24.6% 1,978 93.6%
Stone Harbor Borough 866 114 13.2% 156 18.0% 338 39.0% 763 88.1%
Upper Township 12,373 100 <1% 186 1.5% 237 1.9% 892 7.2%
West Cape May Borough 1,026 9 <1% 36 3.5% 232 22.6% 440 42.9%
West Wildwood
Borough 603 274 45.4% 560 92.9% 603 100.0% 603 100.0%
Wildwood City 5,325 26 <1% 64 1.2% 1,367 25.7% 5,279 99.1%
Wildwood Crest
Borough 3,270 0 0.0% 31 <1% 161 4.9% 2,820 86.2%
Woodbine Borough 2,472 0 0.0% 0 0.0% 0 0.0% 0 0.0%
Cape May County
(Total) 97,265 2,079 2.1% 4,249 4.4% 11,815 12.1% 36,899 37.9%
Source: U.S. Census 2010, NOAA 2012 MHHW = Mean Higher High Water; Pop = Population
Table 5.4.1-5 indicates most municipalities in Cape May County have population located within the 1 foot
of sea level rise scenario inundation area. Please note this table does not account for an increase in seasonal
population along the County’s coastal shores.
Of the population exposed, the most vulnerable include the economically disadvantaged and the population
over the age of 65. Economically disadvantaged populations are more vulnerable because they are likely
to evaluate their risk and make decisions to evacuate based on the net economic impact to their family. The
population over the age of 65 is also more vulnerable because they are more likely to seek or need medical
attention which may not be available to due isolation and/or have difficulty evacuating.
Page 14
Section 5.4.1: Risk Assessment – Climate Change and Sea Level Rise
DMA 2000 Hazard Mitigation Plan Update – Cape May County, New Jersey 5.4.1-14 May 2016
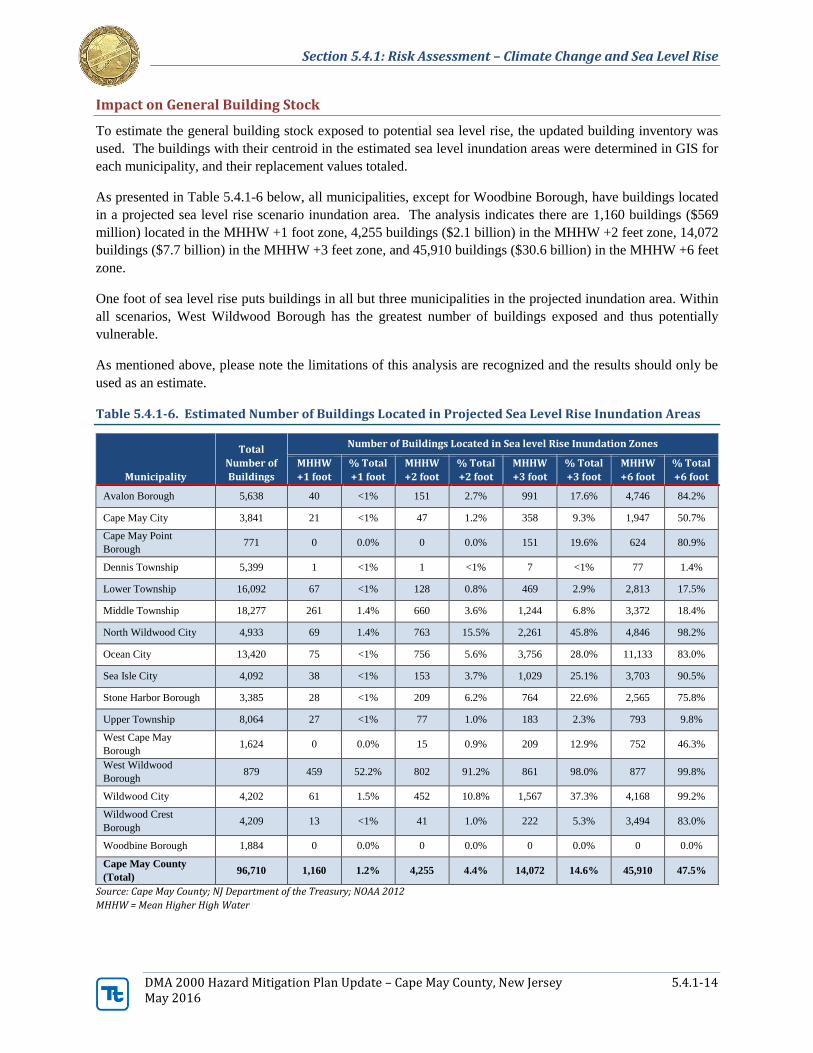
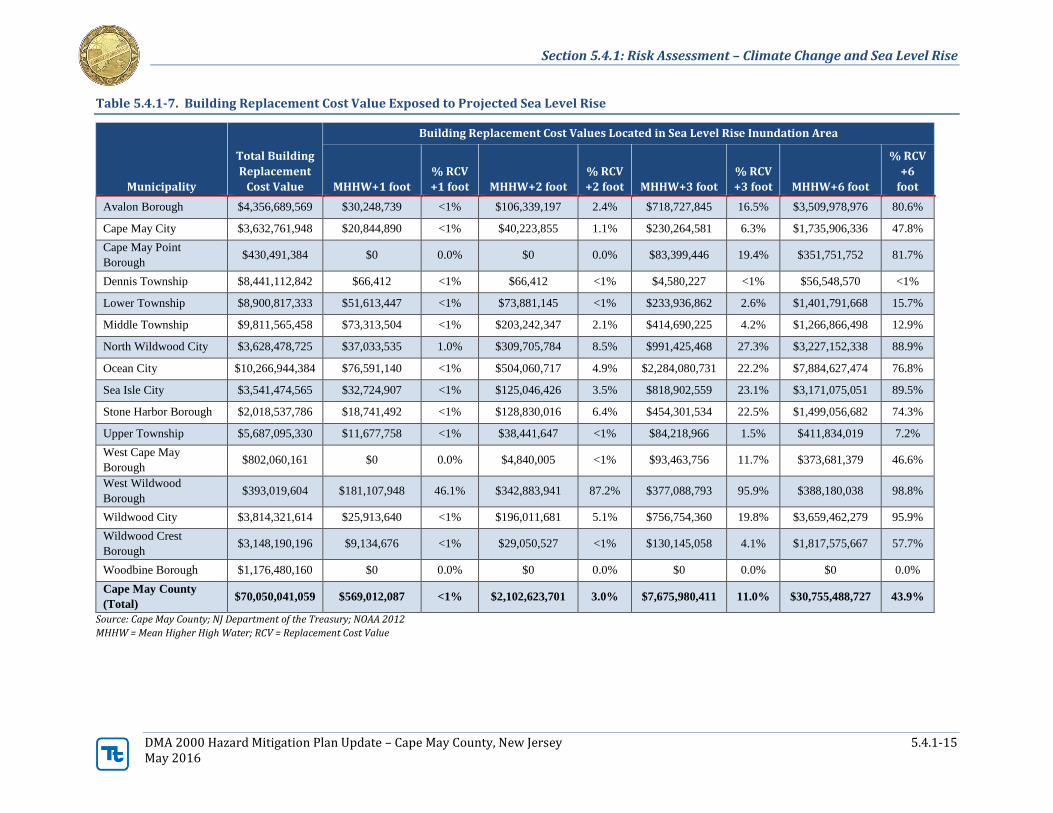
Impact on General Building Stock
To estimate the general building stock exposed to potential sea level rise, the updated building inventory was
used. The buildings with their centroid in the estimated sea level inundation areas were determined in GIS for
each municipality, and their replacement values totaled.
As presented in Table 5.4.1-6 below, all municipalities, except for Woodbine Borough, have buildings located
in a projected sea level rise scenario inundation area. The analysis indicates there are 1,160 buildings ($569
million) located in the MHHW +1 foot zone, 4,255 buildings ($2.1 billion) in the MHHW +2 feet zone, 14,072
buildings ($7.7 billion) in the MHHW +3 feet zone, and 45,910 buildings ($30.6 billion) in the MHHW +6 feet
zone.
One foot of sea level rise puts buildings in all but three municipalities in the projected inundation area. Within
all scenarios, West Wildwood Borough has the greatest number of buildings exposed and thus potentially
vulnerable.
As mentioned above, please note the limitations of this analysis are recognized and the results should only be
used as an estimate.
Table 5.4.1-6. Estimated Number of Buildings Located in Projected Sea Level Rise Inundation Areas
Municipality
Total
Number of
Buildings
Number of Buildings Located in Sea level Rise Inundation Zones
MHHW
+1 foot
% Total
+1 foot
MHHW
+2 foot
% Total
+2 foot
MHHW
+3 foot
% Total
+3 foot
MHHW
+6 foot
% Total
+6 foot
Avalon Borough 5,638 40 <1% 151 2.7% 991 17.6% 4,746 84.2%
Cape May City 3,841 21 <1% 47 1.2% 358 9.3% 1,947 50.7%
Cape May Point
Borough 771 0 0.0% 0 0.0% 151 19.6% 624 80.9%
Dennis Township 5,399 1 <1% 1 <1% 7 <1% 77 1.4%
Lower Township 16,092 67 <1% 128 0.8% 469 2.9% 2,813 17.5%
Middle Township 18,277 261 1.4% 660 3.6% 1,244 6.8% 3,372 18.4%
North Wildwood City 4,933 69 1.4% 763 15.5% 2,261 45.8% 4,846 98.2%
Ocean City 13,420 75 <1% 756 5.6% 3,756 28.0% 11,133 83.0%
Sea Isle City 4,092 38 <1% 153 3.7% 1,029 25.1% 3,703 90.5%
Stone Harbor Borough 3,385 28 <1% 209 6.2% 764 22.6% 2,565 75.8%
Upper Township 8,064 27 <1% 77 1.0% 183 2.3% 793 9.8%
West Cape May
Borough 1,624 0 0.0% 15 0.9% 209 12.9% 752 46.3%
West Wildwood
Borough 879 459 52.2% 802 91.2% 861 98.0% 877 99.8%
Wildwood City 4,202 61 1.5% 452 10.8% 1,567 37.3% 4,168 99.2%
Wildwood Crest
Borough 4,209 13 <1% 41 1.0% 222 5.3% 3,494 83.0%
Woodbine Borough 1,884 0 0.0% 0 0.0% 0 0.0% 0 0.0%
Cape May County
(Total) 96,710 1,160 1.2% 4,255 4.4% 14,072 14.6% 45,910 47.5%
Source: Cape May County; NJ Department of the Treasury; NOAA 2012
MHHW = Mean Higher High Water
Page 15
Section 5.4.1: Risk Assessment – Climate Change and Sea Level Rise
DMA 2000 Hazard Mitigation Plan Update – Cape May County, New Jersey 5.4.1-15 May 2016
Table 5.4.1-7. Building Replacement Cost Value Exposed to Projected Sea Level Rise
Municipality
Total Building
Replacement
Cost Value
Building Replacement Cost Values Located in Sea Level Rise Inundation Area
MHHW+1 foot
% RCV
+1 foot MHHW+2 foot
% RCV
+2 foot MHHW+3 foot
% RCV
+3 foot MHHW+6 foot
% RCV
+6
foot
Avalon Borough $4,356,689,569 $30,248,739 <1% $106,339,197 2.4% $718,727,845 16.5% $3,509,978,976 80.6%
Cape May City $3,632,761,948 $20,844,890 <1% $40,223,855 1.1% $230,264,581 6.3% $1,735,906,336 47.8%
Cape May Point
Borough $430,491,384 $0 0.0% $0 0.0% $83,399,446 19.4% $351,751,752 81.7%
Dennis Township $8,441,112,842 $66,412 <1% $66,412 <1% $4,580,227 <1% $56,548,570 <1%
Lower Township $8,900,817,333 $51,613,447 <1% $73,881,145 <1% $233,936,862 2.6% $1,401,791,668 15.7%
Middle Township $9,811,565,458 $73,313,504 <1% $203,242,347 2.1% $414,690,225 4.2% $1,266,866,498 12.9%
North Wildwood City $3,628,478,725 $37,033,535 1.0% $309,705,784 8.5% $991,425,468 27.3% $3,227,152,338 88.9%
Ocean City $10,266,944,384 $76,591,140 <1% $504,060,717 4.9% $2,284,080,731 22.2% $7,884,627,474 76.8%
Sea Isle City $3,541,474,565 $32,724,907 <1% $125,046,426 3.5% $818,902,559 23.1% $3,171,075,051 89.5%
Stone Harbor Borough $2,018,537,786 $18,741,492 <1% $128,830,016 6.4% $454,301,534 22.5% $1,499,056,682 74.3%
Upper Township $5,687,095,330 $11,677,758 <1% $38,441,647 <1% $84,218,966 1.5% $411,834,019 7.2%
West Cape May
Borough $802,060,161 $0 0.0% $4,840,005 <1% $93,463,756 11.7% $373,681,379 46.6%
West Wildwood
Borough $393,019,604 $181,107,948 46.1% $342,883,941 87.2% $377,088,793 95.9% $388,180,038 98.8%
Wildwood City $3,814,321,614 $25,913,640 <1% $196,011,681 5.1% $756,754,360 19.8% $3,659,462,279 95.9%
Wildwood Crest
Borough $3,148,190,196 $9,134,676 <1% $29,050,527 <1% $130,145,058 4.1% $1,817,575,667 57.7%
Woodbine Borough $1,176,480,160 $0 0.0% $0 0.0% $0 0.0% $0 0.0%
Cape May County
(Total) $70,050,041,059 $569,012,087 <1% $2,102,623,701 3.0% $7,675,980,411 11.0% $30,755,488,727 43.9%
Source: Cape May County; NJ Department of the Treasury; NOAA 2012
MHHW = Mean Higher High Water; RCV = Replacement Cost Value
Page 16
Section 5.4.1: Risk Assessment – Climate Change and Sea Level Rise
DMA 2000 Hazard Mitigation Plan Update – Cape May County, New Jersey 5.4.1-16 May 2016
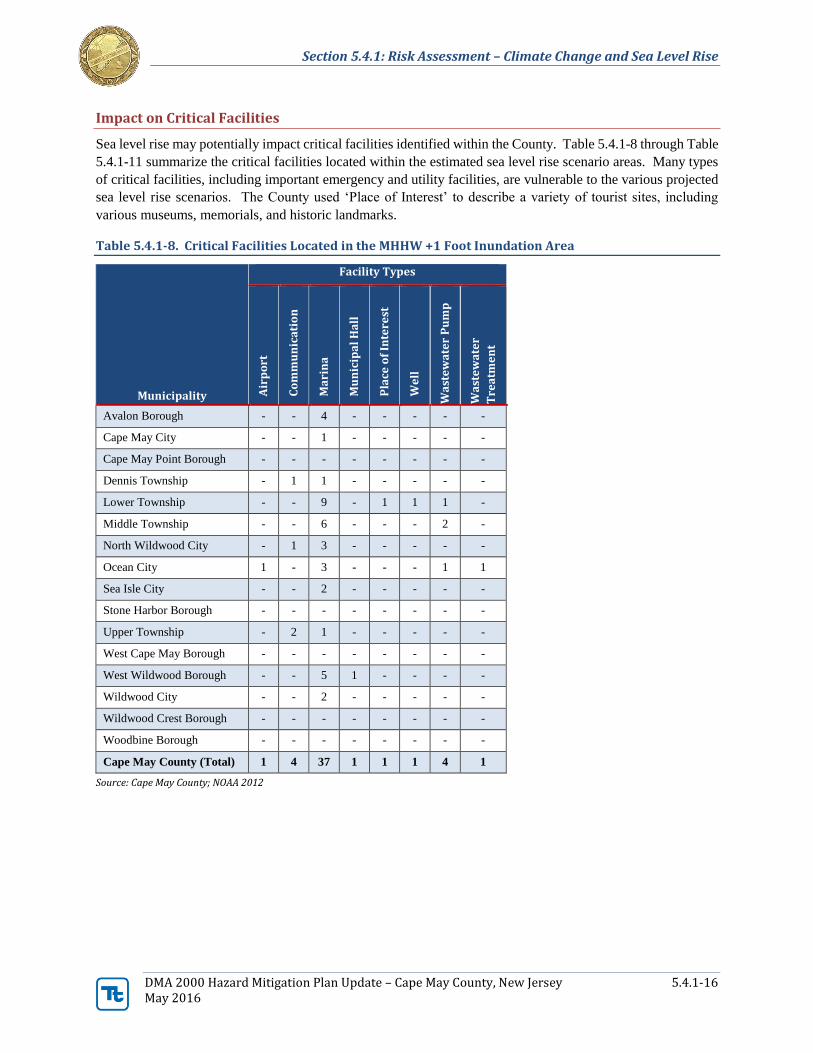
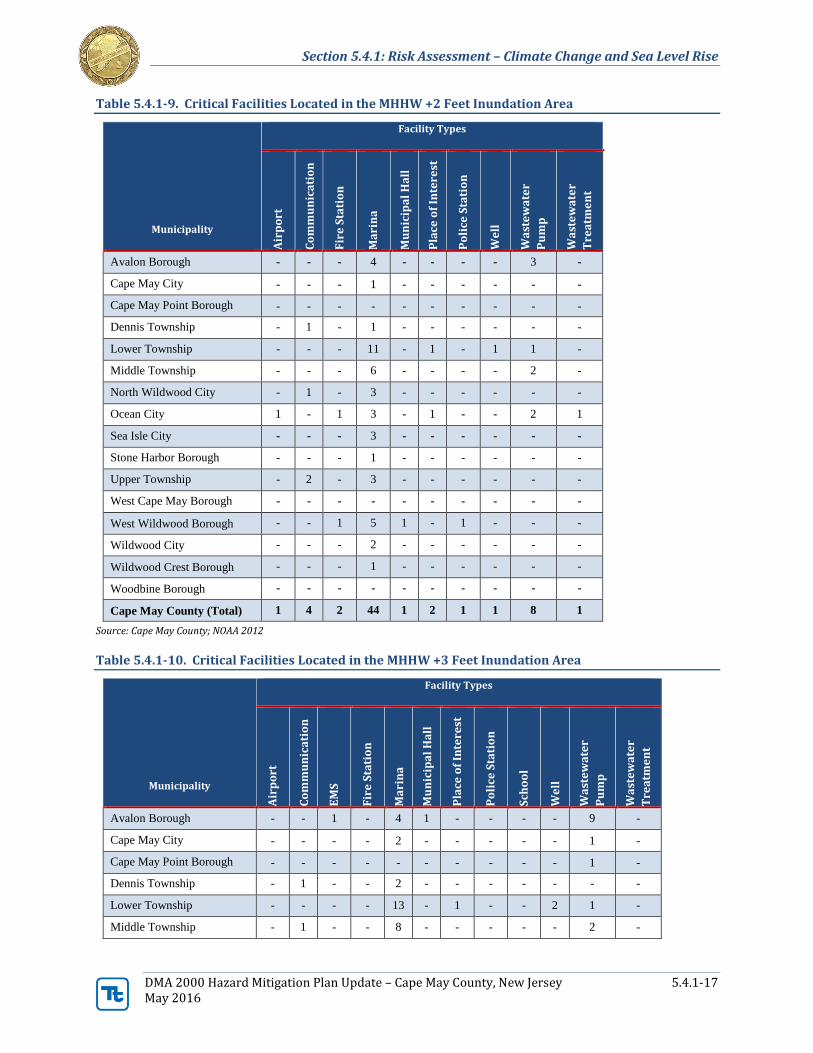
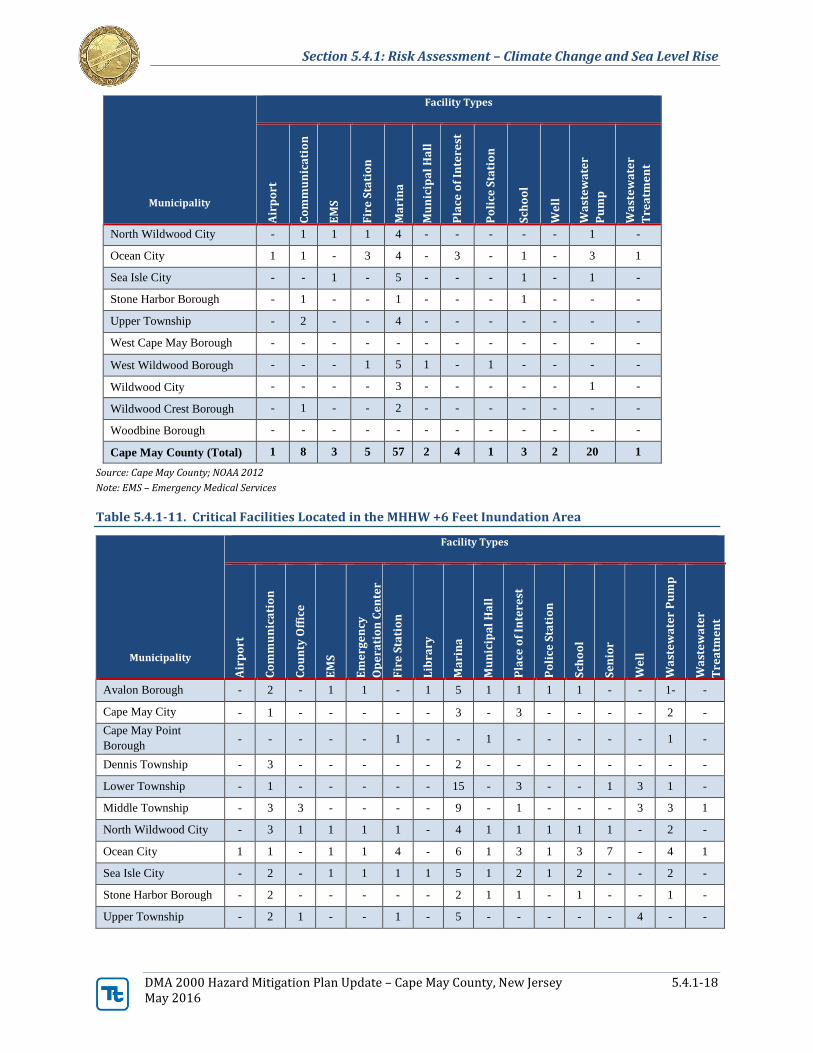
Impact on Critical Facilities
Sea level rise may potentially impact critical facilities identified within the County. Table 5.4.1-8 through Table
5.4.1-11 summarize the critical facilities located within the estimated sea level rise scenario areas. Many types
of critical facilities, including important emergency and utility facilities, are vulnerable to the various projected
sea level rise scenarios. The County used ‘Place of Interest’ to describe a variety of tourist sites, including
various museums, memorials, and historic landmarks.
Table 5.4.1-8. Critical Facilities Located in the MHHW +1 Foot Inundation Area
Municipality
Facility Types A
irp
ort
Co
mm
un
ica
tio
n
Ma
rin
a
Mu
nic
ipa
l H
all
Pla
ce o
f In
tere
st
We
ll
Wa
ste
wa
ter
Pu
mp
Wa
ste
wa
ter
Tre
atm
en
t
Avalon Borough - - 4 - - - - -
Cape May City - - 1 - - - - -
Cape May Point Borough - - - - - - - -
Dennis Township - 1 1 - - - - -
Lower Township - - 9 - 1 1 1 -
Middle Township - - 6 - - - 2 -
North Wildwood City - 1 3 - - - - -
Ocean City 1 - 3 - - - 1 1
Sea Isle City - - 2 - - - - -
Stone Harbor Borough - - - - - - - -
Upper Township - 2 1 - - - - -
West Cape May Borough - - - - - - - -
West Wildwood Borough - - 5 1 - - - -
Wildwood City - - 2 - - - - -
Wildwood Crest Borough - - - - - - - -
Woodbine Borough - - - - - - - -
Cape May County (Total) 1 4 37 1 1 1 4 1
Source: Cape May County; NOAA 2012
Page 17
Section 5.4.1: Risk Assessment – Climate Change and Sea Level Rise
DMA 2000 Hazard Mitigation Plan Update – Cape May County, New Jersey 5.4.1-17 May 2016
Table 5.4.1-9. Critical Facilities Located in the MHHW +2 Feet Inundation Area
Municipality
Facility Types
Air
po
rt
Co
mm
un
ica
tio
n
Fir
e S
tati
on
Ma
rin
a
Mu
nic
ipa
l H
all
Pla
ce o
f In
tere
st
Po
lice
Sta
tio
n
We
ll
Wa
ste
wa
ter
Pu
mp
Wa
ste
wa
ter
Tre
atm
en
t
Avalon Borough - - - 4 - - - - 3 -
Cape May City - - - 1 - - - - - -
Cape May Point Borough - - - - - - - - - -
Dennis Township - 1 - 1 - - - - - -
Lower Township - - - 11 - 1 - 1 1 -
Middle Township - - - 6 - - - - 2 -
North Wildwood City - 1 - 3 - - - - - -
Ocean City 1 - 1 3 - 1 - - 2 1
Sea Isle City - - - 3 - - - - - -
Stone Harbor Borough - - - 1 - - - - - -
Upper Township - 2 - 3 - - - - - -
West Cape May Borough - - - - - - - - - -
West Wildwood Borough - - 1 5 1 - 1 - - -
Wildwood City - - - 2 - - - - - -
Wildwood Crest Borough - - - 1 - - - - - -
Woodbine Borough - - - - - - - - - -
Cape May County (Total) 1 4 2 44 1 2 1 1 8 1
Source: Cape May County; NOAA 2012
Table 5.4.1-10. Critical Facilities Located in the MHHW +3 Feet Inundation Area
Municipality
Facility Types
Air
po
rt
Co
mm
un
ica
tio
n
EM
S
Fir
e S
tati
on
Ma
rin
a
Mu
nic
ipa
l H
all
Pla
ce o
f In
tere
st
Po
lice
Sta
tio
n
Sch
oo
l
We
ll
Wa
ste
wa
ter
Pu
mp
Wa
ste
wa
ter
Tre
atm
en
t
Avalon Borough - - 1 - 4 1 - - - - 9 -
Cape May City - - - - 2 - - - - - 1 -
Cape May Point Borough - - - - - - - - - - 1 -
Dennis Township - 1 - - 2 - - - - - - -
Lower Township - - - - 13 - 1 - - 2 1 -
Middle Township - 1 - - 8 - - - - - 2 -
Page 18
Section 5.4.1: Risk Assessment – Climate Change and Sea Level Rise
DMA 2000 Hazard Mitigation Plan Update – Cape May County, New Jersey 5.4.1-18 May 2016
Municipality
Facility Types
Air
po
rt
Co
mm
un
ica
tio
n
EM
S
Fir
e S
tati
on
Ma
rin
a
Mu
nic
ipa
l H
all
Pla
ce o
f In
tere
st
Po
lice
Sta
tio
n
Sch
oo
l
We
ll
Wa
ste
wa
ter
Pu
mp
Wa
ste
wa
ter
Tre
atm
en
t
North Wildwood City - 1 1 1 4 - - - - - 1 -
Ocean City 1 1 - 3 4 - 3 - 1 - 3 1
Sea Isle City - - 1 - 5 - - - 1 - 1 -
Stone Harbor Borough - 1 - - 1 - - - 1 - - -
Upper Township - 2 - - 4 - - - - - - -
West Cape May Borough - - - - - - - - - - - -
West Wildwood Borough - - - 1 5 1 - 1 - - - -
Wildwood City - - - - 3 - - - - - 1 -
Wildwood Crest Borough - 1 - - 2 - - - - - - -
Woodbine Borough - - - - - - - - - - - -
Cape May County (Total) 1 8 3 5 57 2 4 1 3 2 20 1
Source: Cape May County; NOAA 2012
Note: EMS – Emergency Medical Services
Table 5.4.1-11. Critical Facilities Located in the MHHW +6 Feet Inundation Area
Municipality
Facility Types
Air
po
rt
Co
mm
un
ica
tio
n
Co
un
ty O
ffic
e
EM
S
Em
erg
en
cy
Op
era
tio
n C
en
ter
Fir
e S
tati
on
Lib
rary
Ma
rin
a
Mu
nic
ipa
l H
all
Pla
ce o
f In
tere
st
Po
lice
Sta
tio
n
Sch
oo
l
Se
nio
r
We
ll
Wa
ste
wa
ter
Pu
mp
Wa
ste
wa
ter
Tre
atm
en
t
Avalon Borough - 2 - 1 1 - 1 5 1 1 1 1 - - 1- -
Cape May City - 1 - - - - - 3 - 3 - - - - 2 -
Cape May Point
Borough - - - - - 1 - - 1 - - - - - 1 -
Dennis Township - 3 - - - - - 2 - - - - - - - -
Lower Township - 1 - - - - - 15 - 3 - - 1 3 1 -
Middle Township - 3 3 - - - - 9 - 1 - - - 3 3 1
North Wildwood City - 3 1 1 1 1 - 4 1 1 1 1 1 - 2 -
Ocean City 1 1 - 1 1 4 - 6 1 3 1 3 7 - 4 1
Sea Isle City - 2 - 1 1 1 1 5 1 2 1 2 - - 2 -
Stone Harbor Borough - 2 - - - - - 2 1 1 - 1 - - 1 -
Upper Township - 2 1 - - 1 - 5 - - - - - 4 - -
Page 19
Section 5.4.1: Risk Assessment – Climate Change and Sea Level Rise
DMA 2000 Hazard Mitigation Plan Update – Cape May County, New Jersey 5.4.1-19 May 2016
Municipality
Facility Types
Air
po
rt
Co
mm
un
ica
tio
n
Co
un
ty O
ffic
e
EM
S
Em
erg
en
cy
Op
era
tio
n C
en
ter
Fir
e S
tati
on
Lib
rary
Ma
rin
a
Mu
nic
ipa
l H
all
Pla
ce o
f In
tere
st
Po
lice
Sta
tio
n
Sch
oo
l
Se
nio
r
We
ll
Wa
ste
wa
ter
Pu
mp
Wa
ste
wa
ter
Tre
atm
en
t
West Cape May
Borough - - - - - - - - - - - - - - - -
West Wildwood
Borough - - - - - 1 - 5 1 - 1 - - - 1 -
Wildwood City - - - - - 1 - 3 - 4 - 4 2 - 1 -
Wildwood Crest
Borough - 1 - 1 - 1 - 2 1 - 1 - - - 1 -
Woodbine Borough - - - - - - - - - - - - - - - -
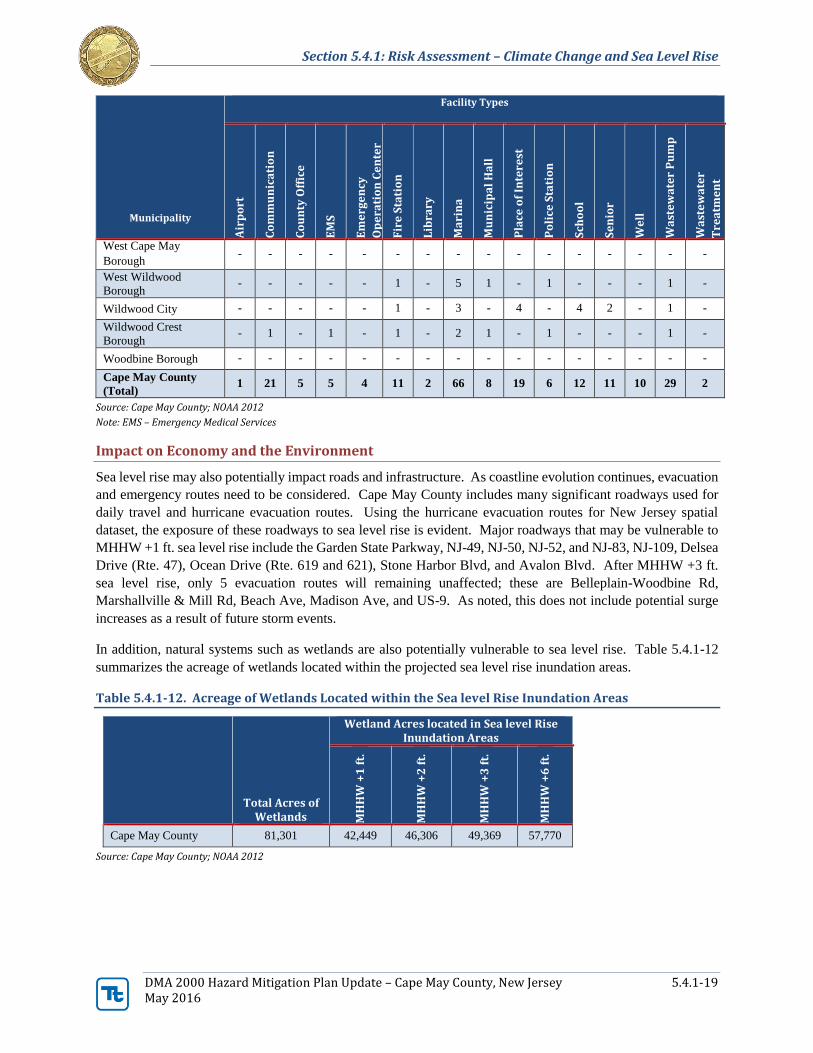
Cape May County
(Total) 1 21 5 5 4 11 2 66 8 19 6 12 11 10 29 2
Source: Cape May County; NOAA 2012
Note: EMS – Emergency Medical Services
Impact on Economy and the Environment
Sea level rise may also potentially impact roads and infrastructure. As coastline evolution continues, evacuation
and emergency routes need to be considered. Cape May County includes many significant roadways used for
daily travel and hurricane evacuation routes. Using the hurricane evacuation routes for New Jersey spatial
dataset, the exposure of these roadways to sea level rise is evident. Major roadways that may be vulnerable to
MHHW +1 ft. sea level rise include the Garden State Parkway, NJ-49, NJ-50, NJ-52, and NJ-83, NJ-109, Delsea
Drive (Rte. 47), Ocean Drive (Rte. 619 and 621), Stone Harbor Blvd, and Avalon Blvd. After MHHW +3 ft.
sea level rise, only 5 evacuation routes will remaining unaffected; these are Belleplain-Woodbine Rd,
Marshallville & Mill Rd, Beach Ave, Madison Ave, and US-9. As noted, this does not include potential surge
increases as a result of future storm events.
In addition, natural systems such as wetlands are also potentially vulnerable to sea level rise. Table 5.4.1-12
summarizes the acreage of wetlands located within the projected sea level rise inundation areas.
Table 5.4.1-12. Acreage of Wetlands Located within the Sea level Rise Inundation Areas
Total Acres of Wetlands
Wetland Acres located in Sea level Rise Inundation Areas
MH
HW
+1
ft.
MH
HW
+2
ft.
MH
HW
+3
ft.
MH
HW
+6
ft.
Cape May County 81,301 42,449 46,306 49,369 57,770
Source: Cape May County; NOAA 2012
Page 20
Section 5.4.1: Risk Assessment – Climate Change and Sea Level Rise
DMA 2000 Hazard Mitigation Plan Update – Cape May County, New Jersey 5.4.1-20 May 2016
Figure 5.4.1-5. Hurricane Evacuation Routes and Sea level Rise Scenarios
Source: Cape May County; NOAA 2012
Page 21
Section 5.4.1: Risk Assessment – Climate Change and Sea Level Rise
DMA 2000 Hazard Mitigation Plan Update – Cape May County, New Jersey 5.4.1-21 May 2016
Effect of Climate Change on Vulnerability
Impacts of climate change can lead to shoreline erosion, coastal flooding, and water pollution, affecting man-
made coastal infrastructure and coastal ecosystems. Coastal areas may be impacted by climate change in
different ways. Coastal areas are sensitive to sea level rise, changes in the frequency and intensity of storms,
increase in precipitation, and warmer ocean temperatures. Additionally, oceans are absorbing more carbon
dioxide from the rising atmospheric concentrations of the gas, resulting in oceans becoming more acidic. This
could have significant impacts on coastal and marine ecosystems (EPA 2013). As the coastline recedes inland
as a result of climate change and sea level rise, the County’s vulnerability to other hazards, including hurricanes
and coastal erosion, may increase.
As discussed above, climate change can cause more frequent and extreme precipitation events to occur, which
will lead to more frequent flood events. Refer to Section 5.4.3 (Flood) for a description on the effects of climate
change on precipitation events, as well as the impacts of flooding events on the County.
Change of Vulnerability
An exposure analysis for sea level rise was not conducted as part of the vulnerability assessment for the 2010
HMP. Overall, this vulnerability assessment provides the County an estimated exposure assessment for the sea
level rise hazard.
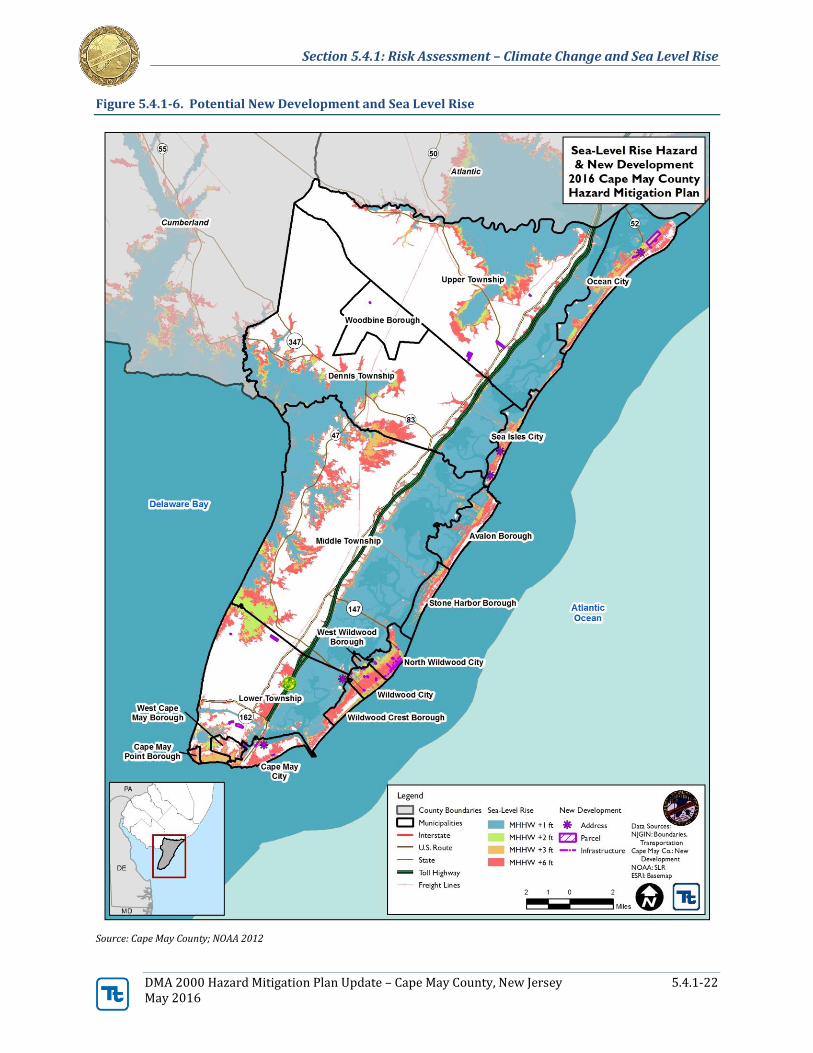
Future Growth and Development
As discussed in Section 4, areas targeted for future growth and development have been identified across the
County. Any areas of growth located in the defined coastal risk areas could be potentially impacted by coastal
erosion similar to those that currently exist within the County. Please refer to Figure 5.4.1-6 for the potential
new development in the County and the sea level rise areas.
Additional Data and Next Steps
As revised sea level rise projections are determined, this section of the plan will be updated.
Page 22
Section 5.4.1: Risk Assessment – Climate Change and Sea Level Rise
DMA 2000 Hazard Mitigation Plan Update – Cape May County, New Jersey 5.4.1-22 May 2016
Figure 5.4.1-6. Potential New Development and Sea Level Rise
Source: Cape May County; NOAA 2012