5.6 A METEOROLOGICAL RADAR EMULATOR FOR EDUCATION AND RESEARCH Michael I. Biggerstaff and Ryan M. May University of Oklahoma, Norman, Oklahoma 1. INTRODUCTION Teaching radar meteorology involves both theoretical treatment of the interaction of electromagnetic (em) energy with hydrometeors and practice interpreting and applying radar information to the study of atmospheric processes. With the availability of data from the National Weather Service’s (NWS) operational radar network and tools developed by Unidata to display that information, there are numerous opportunities to illustrate theoretical concepts for the em frequency (~3 GHz) represented by the operational network. Beyond the operational frequency, however, opportunities are scarcer. Operational radar networks are also intended to provide high-quality data using a somewhat fixed sampling strategy. For greater flexibility and to extend the students’ experience to include more troublesome data over a greater range of the em spectrum, educators typically rely on unedited research data that are difficult to access and less than optimal for classroom instruction. Moreover, educational use of research data is often limited to those with personal knowledge of the data and familiarity with the tools used to display and analyze them. To facilitate student exploration and to provide a tool to quantify the impact of weather radar design on the ability to detect atmospheric circulations, we have developed a weather radar emulator. The emulator takes high-resolution output from a numerical simulation and scans the simulated atmosphere using radar characteristics and scanning strategies specified by the user. Input into the emulator can be held constant while the radar characteristics are changed, permitting a direct assessment of the impacts of radar design and scanning strategy on the diagnosis of atmospheric phenomena. Using the emulator, a vast number of artificial data sets over a wide range of radar characteristics can generated, limited only by the number and type of numerical simulations available. The artificial data can aid in algorithm development as well as the investigation of radar performance necessary for the detection of meteorological phenomena. For example, the emulator documented here has been used to determine a baseline for detection of tornadic circulations by a fixed- site broad-beam low-power Doppler radar. This application is one element of the design process for a network of inexpensive radars that will be fielded in Oklahoma as part of the Center for Adaptive Sensing of the Atmosphere (CASA), an engineering research center supported by the National Science Foundation (NSF). This application underscores the potential for ___________________________ Corresponding address: Michael I. Biggerstaff, School of Meteorology, 100 E. Boyd Street, Room 1310, University of Oklahoma, Norman, OK 73019-1013; e- mail: [email protected]. using the emulator to address research in both engineering and the atmospheric sciences. 2. EMULATOR DESIGN One of the major differences between this emulator and those based on analytic airflow (e.g. Wood and Brown 1997) or homogeneous rainfall characteristics (e.g. Capsoni and D'Amico 1998) is that input to this radar emulator is from a high-resolution numerical simulation of the atmosphere. The basic variables required are the three-dimensional winds and hydrometeor content. Temperature, pressure, and humidity are also required if computing the beam’s path from the simulated index of refraction. This allows for investigation of anomalous propagation. Otherwise, a standard index of refraction is assumed. The emulator also requires a radar configuration file, in which the user lists the fundamental characteristics of the virtual radar (Table 1), and a scanning strategy request to apply in sampling the input airflow and hydrometeor fields. The scanning strategy states the pulse repetition time, the number of pulses to average to compute a radial of data, and the position of the antenna as a function of time. Expressed in these general terms, the scanning strategy can accomplish Plan Position Indicator (PPI) sweeps, sector scans, Range Height Indicator (RHI) cross-sections, pointing mode, or adaptive scanning similar to phased array antenna systems. Table 1. User specified radar characteristics Frequency of emitted radiation Peak power transmitted Nominal half-power beamwidth Antenna gain function Pulse duration Sample gate spacing Minimum detectable signal of receiver To allow for differential attenuation across the radar pulse and to apply the antenna gain function, the emulator breaks each transmitted pulse volume into hundreds of individual elements at each sample gate in range. The back-scattered power of an element and the signal loss due to attenuation depends on the transmitted power in the beam element at that range and the hydrometeor content of the closest numerical model grid cell to the location of that radar beam element. The nearest neighbor grid cell estimate is sufficient since the radar elements are purposely much smaller than the grid spacing of the input hydrometeor field. The return from each beam element is weighted by the antenna gain and accumulated attenuation for that beam element and then summed to yield the total returned power for that pulse.
Transcript
5.6 A METEOROLOGICAL RADAR EMULATOR FOR EDUCATION AND RESEARCH
Michael I. Biggerstaff and Ryan M. MayUniversity of Oklahoma, Norman, Oklahoma
1. INTRODUCTION
Teaching radar meteorology involves both theoreticaltreatment of the interaction of electromagnetic (em)energy with hydrometeors and practice interpreting andapplying radar information to the study of atmosphericprocesses. With the availability of data from theNational Weather Service’s (NWS) operational radarnetwork and tools developed by Unidata to display thatinformation, there are numerous opportunities toillustrate theoretical concepts for the em frequency (~3GHz) represented by the operational network. Beyondthe operational frequency, however, opportunities arescarcer. Operational radar networks are also intended toprovide high-quality data using a somewhat fixedsampling strategy. For greater flexibility and to extendthe students’ experience to include more troublesomedata over a greater range of the em spectrum,educators typically rely on unedited research data thatare difficult to access and less than optimal forclassroom instruction. Moreover, educational use ofresearch data is often limited to those with personalknowledge of the data and familiarity with the tools usedto display and analyze them. To facilitate student exploration and to provide a toolto quantify the impact of weather radar design on theability to detect atmospheric circulations, we havedeveloped a weather radar emulator. The emulatortakes high-resolution output from a numerical simulationand scans the simulated atmosphere using radarcharacteristics and scanning strategies specified by theuser. Input into the emulator can be held constant whilethe radar characteristics are changed, permitting adirect assessment of the impacts of radar design andscanning strategy on the diagnosis of atmosphericphenomena. Using the emulator, a vast number of artificial datasets over a wide range of radar characteristics cangenerated, limited only by the number and type ofnumerical simulations available. The artificial data canaid in algorithm development as well as the investigationof radar performance necessary for the detection ofmeteorological phenomena. For example, the emulatordocumented here has been used to determine abaseline for detection of tornadic circulations by a fixed-site broad-beam low-power Doppler radar. Thisapplication is one element of the design process for anetwork of inexpensive radars that will be fielded inOklahoma as part of the Center for Adaptive Sensing ofthe Atmosphere (CASA), an engineering researchcenter supported by the National Science Foundation(NSF). This application underscores the potential for___________________________Corresponding address: Michael I. Biggerstaff, Schoolof Meteorology, 100 E. Boyd Street, Room 1310,University of Oklahoma, Norman, OK 73019-1013; e-mail: [email protected].
using the emulator to address research in bothengineering and the atmospheric sciences.
2. EMULATOR DESIGN
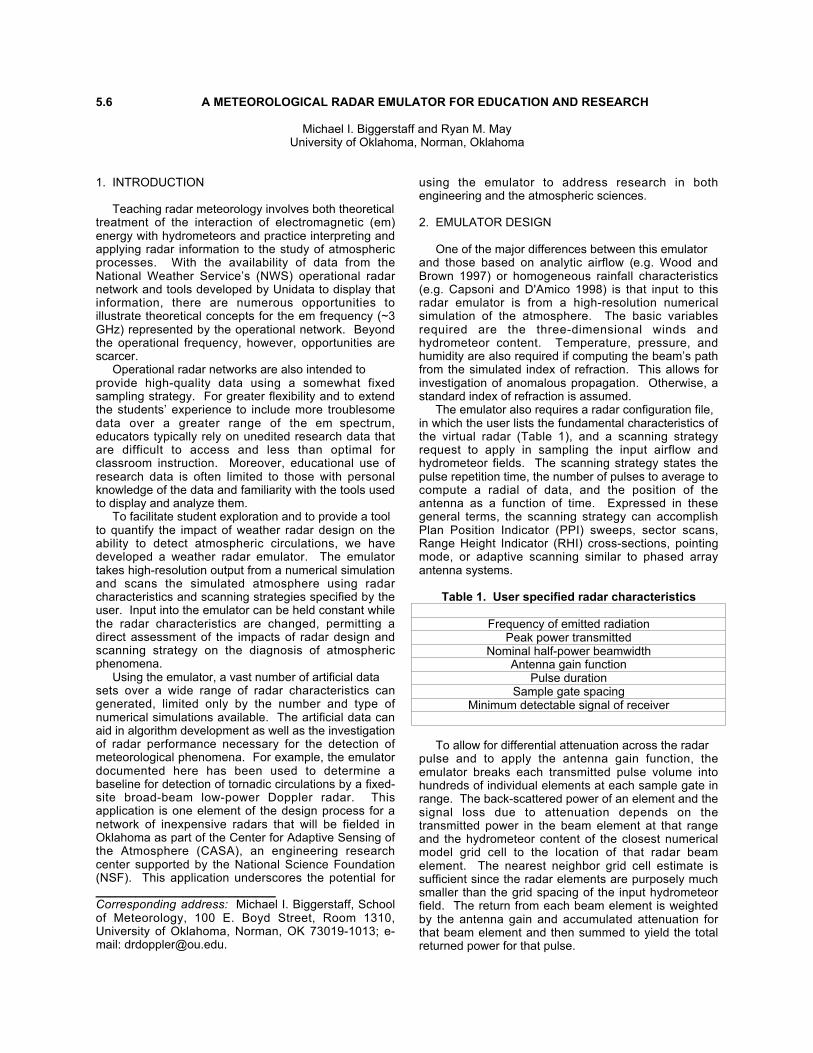
One of the major differences between this emulatorand those based on analytic airflow (e.g. Wood andBrown 1997) or homogeneous rainfall characteristics(e.g. Capsoni and D'Amico 1998) is that input to thisradar emulator is from a high-resolution numericalsimulation of the atmosphere. The basic variablesrequired are the three-dimensional winds andhydrometeor content. Temperature, pressure, andhumidity are also required if computing the beam’s pathfrom the simulated index of refraction. This allows forinvestigation of anomalous propagation. Otherwise, astandard index of refraction is assumed. The emulator also requires a radar configuration file,in which the user lists the fundamental characteristics ofthe virtual radar (Table 1), and a scanning strategyrequest to apply in sampling the input airflow andhydrometeor fields. The scanning strategy states thepulse repetition time, the number of pulses to average tocompute a radial of data, and the position of theantenna as a function of time. Expressed in thesegeneral terms, the scanning strategy can accomplishPlan Position Indicator (PPI) sweeps, sector scans,Range Height Indicator (RHI) cross-sections, pointingmode, or adaptive scanning similar to phased arrayantenna systems.
Table 1. User specified radar characteristics
Frequency of emitted radiationPeak power transmitted
Nominal half-power beamwidthAntenna gain function
Pulse durationSample gate spacing
Minimum detectable signal of receiver
To allow for differential attenuation across the radarpulse and to apply the antenna gain function, theemulator breaks each transmitted pulse volume intohundreds of individual elements at each sample gate inrange. The back-scattered power of an element and thesignal loss due to attenuation depends on thetransmitted power in the beam element at that rangeand the hydrometeor content of the closest numericalmodel grid cell to the location of that radar beamelement. The nearest neighbor grid cell estimate issufficient since the radar elements are purposely muchsmaller than the grid spacing of the input hydrometeorfield. The return from each beam element is weightedby the antenna gain and accumulated attenuation forthat beam element and then summed to yield the totalreturned power for that pulse.
Radial velocities are used as a proxy for differencesin phase shift between successive pulses. For eachrange gate, the radial velocity of each radar beamelement is computed as a projection of the three-dimensional wind and hydrometeor fall-speeds from thenearest neighbor grid cell. Each radial velocity isweighted by the returned power for its beam element.The recorded Doppler velocity for each transmittedpulse at a range gate is the sum of the power-weightedradial velocities of all the beam elements across thepulse volume at that range. The average of the returned power and Dopplervelocity from a sequence of pulses equal to the numberspecified in the scanning strategy is used to calculatethe recorded beam of data. Application of the Nyquistvelocity (Doviak and Zrnic 1993) to imitate velocityaliasing is performed after the summation of all thebeam elements and the summation of the individualpulses. In other words, velocity aliasing is applied at thescale of a range gate for each computed beam. Output from the emulator is stored in a netCDFformat (Rew et al. 1997) and can be viewed usingUnidata’s Integrated Data Viewer (Unidata).
3. EXAMPLE— DETECTION OF TORNADOES
Output from a non-hydrostatic three-dimensionalAdvanced Regional Prediction System (ARPS; Xue etal. 2003) simulation of a tornadic supercell storm wasused to evaluate the range dependency of detectingtornadic circulations for a low-power, two-degree half-power beamwidth radar. The simulation employed onlybulk warm rain microphysical parameterizations(Kessler 1969) with a Marshall-Palmer (1948) drop-sizedistribution. The horizontal spacing in the simulationwas 50 m. Vertical spacing was stretched with 20 mbetween the first two levels. For the purposes of thisstudy, only one time step of the model was used. Radar signatures associated with tornadoes includethe maximum velocity differential (DV) between theinbound and outbound radial velocities and a vorticityparameter, S, defined as 2(DV)/L where L is thedistance between the centers of the gates having themaximum inbound and outbound velocities (Wurman2002). Using these metrics, the simulated storm (notshown) had a velocity differential of 160 m s-1 and avorticity parameter of 1.6 s-1. The peak wind speed wasabout 80 m s-1, which placed this circulation in the rangeof a F3 tornado (Fujita 1971). Assuming no ground clutter, at ten kilometers fromthe tornado, a two-degree beamwidth radar withmatched spacing (i.e. two degrees) between adjacentradar beams and 100 m range gate spacing would beable to diagnose a velocity differential of 57 m s-1 and avorticity parameter of 0.31 s-1 with a 0.5° elevation anglePPI (Fig. 1). Even at this relatively close range,averaging across the radar beam significantly reducesthe diagnosed circulation of the tornado. Over-samplingby 50 percent in azimuth (i.e. one degree betweenadjacent radar beams) increased the diagnosed velocitydifferential to 62 m s-1 and the vorticity parameter to0.35 s-1 (Fig. 2). At 30 km from the tornado (Fig. 3), the vorticityparameter is only 0.09 s-1. A value of 0.1 s-1 is thought
to be a lower-limit on being able to distinguish betweentornadic and non-tornadic circulations (Alexander 2004).
Fig. 1. Radar reflectivity assuming Rayleigh scattering and noattenuation (left panel) and Doppler velocity (right panel) for thehook echo region of the tornadic storm as determined by theradar emulator for a radar located 10 km from the tornado. Theazimuthal beam spacing is matched with the 2° beamwidth ofthe radar. The PPI is taken at 0.5° elevation.
Fig. 2. Same as Fig. 1 except for 50% over-sampling, i.e. onedegree azimuthal spacing between adjacent radar beams.
Fig. 3. Same as Fig. 1, except the radar is at a range of 30 kmfrom the tornado.
4. FUTURE PLANS
Development of the emulator continues. Besidesadding Mie (1908) scattering and attenuation, we willenable a simple form of clutter contamination for thepart of the radar beam that intersects the ground. Wealso plan to expand the antenna gain function to includeuser-specified sidelobes and to fully implement the
beam propagation by ray tracing from the numericalmodel profile of the refractive index. Moreover, we wantto evaluate the impact of storm evolution on diagnosedstructure by processing individual time steps of themodel fields. Since each time step generates about 2GB of model output, this will require significantcomputational resources. Finally, we plan to addreceiver noise characteristics and to make use of thedrop-size distribution and a probability distributionfunction of velocity to generate time series data and fullpower spectra.
5. SUMMARY AND CONCLUSIONS
A radar emulator has been developed for use ineducation and research related to radar meteorologyand engineering. The emulator requires input from ahigh-resolution numerical simulation of the atmosphereand is able to provide moment data (radar reflectivity,Doppler radial velocity, and spectrum width) for a user-specified set of radar characteristics and a specifiedscanning strategy. This tool has been used to evaluate the rangedependency of detecting features associated with astrong tornado to aid in the design of a network ofinexpensive low-power broad-beam Doppler radars thatwill be deployed in Oklahoma as part of the Center forAdaptive Sensing of the Atmosphere. We believe thatthe emulator can also be used to aid in the design ofoperating strategies for mobile radar deployments in thestudy of precipitating cloud systems. Currently the emulator is housed on a dual-processorOpteron Linux-based computer with 4 GB of RAM. Ittakes approximately 12 hours of CPU time to generate afive-minute volume scan. Eventually we hope to installthe code on a multi-processor machine. Since eachradar beam can be computed independently, vectorizingthe processing load would significantly improveperformance. Once the emulator has been fully developed andtested, we plan to establish an on-line digital resourcecomplete with sample numerical simulations of severestorms for general educational use. This will allowstudents across the globe to investigate the impact ofradar design and sampling strategies on the ability todiagnose atmospheric phenomena using weatherradars.
6. ACKNOWLEDGEMENTS
The numerical simulation was conducted and madeavailable by M. Xue from the University of Oklahoma.This project was partially supported by the NationalScience Foundation under grant EEC-0313747 and by aUS Army Research Office fellowship through theNational Defense Science and Engineering Fellowshipprogram. The opinions stated herein represent theviews of the authors and not necessarily the NationalScience Foundation.
7. REFERENCES
Alexander, C. R., and J. Wurman, 2004: Comparisonbetween DOW observed tornadoes and parent
mesocyclones observed by WSR-88Ds, Preprints22d Severe Local Storms Conf., Hyannis, MA,Amer. Meteor. Soc.
Capsoni, C., and M. D'Amico, 1998: A physically basedradar simulator. J. Atmos. Oceanic Technol., 15,593-598.
Doviak, R. J., and D. S. Zrnic, 1993: Doppler Radar andWeather Observations. 2nd ed. Academic Press,Inc., 562 pp.
Fujita, T. T., 1971: Proposed characterization oftornadoes and hurricanes by area and intensity.SMRP Research Rep. 91, University of Chicago, 15pp.
Kessler, E., 1969: On the distribution and continuity ofwater substance in atmospheric circulations.Meteorological Monograph 10 no. 32, AmericanMeteorological Society, 82 pp.
Marshall, J. S., and W. M. Palmer, 1948: Thedistribution of raindrops with size. J. Meteor., 5 ,165-166.
Mie, G., 1908: Beitrage zur Optik truber Medien speziellkolloidaler Metallosungen. Ann. Phys., 25, 377-445.
Rew, R., G. Davis, S. Emmerson, and H. Davies, 1997:NetCDF user's guide for C: An access interface forself-describing, portable data, version 3. UnidataProgram Center, Boulder, CO, 132 pp.
Unidata: Integrated Data Viewer (IDV) user guide.Unidata Program Center, Boulder, CO, 232 pp.
Wood, V. T., and R. A. Brown, 1997: Effects of radarsampling on single-Doppler velocity signatures ofmesocyclones and tornadoes. Wea. Forecasting,12, 928-938.
Wurman, J., 2002: The multiple-vortex structure of atornado. Wea. Forecasting, 17, 473-505.
Xue, M., D.-H. Wang, J.-D. Gao, K. Brewster, and K. K.Droegemeier, 2003. The Advanced RegionalPrediction System (ARPS), storm-scale numericalweather prediction and data assimilation. Meteor.Atmos. Physics, 82, 139-170.