46
The International Authority on Air System Components AIR MOVEMENT AND CONTROL ASSOCIATION INTERNATIONAL, INC. AMCA Standard 300-05 Reverberant Room Method for Sound Testing of Fans

The International Authority on Air System Components
AIR MOVEMENT AND CONTROLASSOCIATION INTERNATIONAL, INC.
AMCAStandard 300-05
Reverberant Room Method forSound Testing of Fans

AMCA Standard 300 - 05
Reverberant Room Method for
Sound Testing of Fans
AIR MOVEMENT AND CONTROL ASSOCIATION INTERNATIONAL
30 WEST UNIVERSITY DRIVE
ARLINGTON HEIGHTS, IL 60004-1893 U.S.A.
PHONE: (847) 394-0150
fax: (847) 253-0088
web: WWW.AMCA.ORG

ii
© 2005 by Air Movement and Control Association International, Inc.
All rights reserved. Reproduction or translation of any part of this work beyond that permitted by Sections
107 and 108 of the 1976 United States Copyright Act without the permission of the copyright owner is
unlawful. Requests for permission or further information should be addressed to the Executive Director,
Air Movement and Control Association International, Inc.
Forward/Authority
AMCA Standard 300-05 was adopted by the membership of the Air Movement
and Control Association International, Inc. on 30 July 2005. The effective date of
this standard is 01 November 2005.
Tung Nguyen (Chair) Emerson Ventilation Products
Dr. John Cermak Acme Engineering & Manufacturing Corporation
Joseph Langford American Coolair Corp.
David Wolbrink Broan-Nutone LLC
Jeff Hill Cleanpak International
Dr. W.T.W. Cory Flakt Woods Ltd.
Iain Kinghorn (Alt.) Flakt Woods, Ltd.
Pete Neitzel Greenheck Fan Corporation
Max Clarke (Alt.) Greenheck Fan Corporation
Thomas Gustafson Hartzell Fan, Inc.
Ralph Sussey Howden Buffalo, Inc.
Dr. John Murphy JOGRAM, Inc.
Tan Tin Tin Kruger Ventilation Industries Pte. Ltd.
Ralph Sexton Matthews & Yates
Boyd Kunze The New York Blower Company
Scott Hausmann The Trane Co.
Scott Williamson Twin City Fan Companies, Ltd.
Disclaimer
AMCA International uses its best efforts to produce standards for the benefit of the
industry and the public in light of available information and accepted industry prac-
tices. However, AMCA does not guarantee, certify or assure the safety or perform-
ance of any products, components or systems tested, designed, installed or oper-
ated in accordance with AMCA standards or that any tests conducted under its
standards will be non-hazardous or free from risk.
Objections
Air Movement and Control Association International, Inc. will consider and decide
all written complaints regarding its standards, certification programs, or interpreta-
tions thereof. For information on procedures for submitting and handling com-
plaints, write to:
AIR MOVEMENT AND CONTROL ASSOCIATION INTERNATIONAL
30 WEST UNIVERSITY DRIVE
ARLINGTON HEIGHTS, IL 60004-1893 USA
iii
iv
Foreward
This standard was originally developed in response to the need for a reliable andaccurate method of determining the sound power levels of fan equipment. Theoriginal document was written by the AMCA P158NB Sound Test CodeCommittee. Where possible, it was based on ASHRAE Standard 36-62, and com-bined state-of-the-art with practical considerations. It was first published as aRecommended Practice in February 1962, and adopted as a Standard Test Codein October 1963. The sound power reference level now used in this standard waschanged in January 1965, from 10-13 watts to 10-12 watts. The third edition(January 1967) AMCA 300-67 Test Code for Sound Rating included minor revi-sions. In 1974, minor editorial changes were made, and size-speed conversionswere transferred to AMCA 301 Methods for Calculating Fan Sound Ratings FromLaboratory Test Data. The 1985 edition continued the original philosophy of com-bining the theoretical and the practical. The 1996 edition was improved byincreasing the accuracy of Reference Sound Source values through improve-ments in calibration requirements and procedure, and where appropriate, callingfor units of measure in SI (I-P) sequence. Where there have been successfulimprovements in state-of-the-art, full advantage has been taken. This latest edi-tion refines the duct end correction factors to values whose source can be tracedto its origin.
Introduction
This standard establishes a method of determining the sound power levels of afan. The method is reproducible in all laboratories that are qualified to the require-ments of this standard.
The method employs standard sound measurement instrumentation, applied torooms that are restricted to certain acoustic properties. The test setups aredesigned generally to represent the physical orientation of a fan as installed, fol-lowing ANSI/AMCA 210 Laboratory Methods of Testing Fans for AerodynamicPerformance Rating. Sound is defined as radiant mechanical energy that is trans-mitted by pressure waves in air; it is the objective cause of hearing. Sound pres-sure level is described mathematically as a logarithmic quantity derived fromsound pressure. The unit of sound pressure level is the decibel, referenced to abase of 20 micropascals, or 20 microbar. The sound pressure level at any givenpoint in space depends on the distance between the source and the receiver,reflection if in an enclosed room, proximity of the source to other sound sources,etc.
Sound in a room is the result of one or more active sound power sources withinthat room. Sound power is the total sound energy radiated per unit time. Soundpower level is described mathematically as a logarithmic quantity derived from thesound power. The unit of sound power level is the decibel referenced to 1 picow-att (1.0E-12 watt). Sound power levels determined through use of this standardare useful for comparison between fans and in acoustical design.
Since sound power is independent of acoustic environment, two or more fans pro-posed for a specific aerodynamic performance condition may be evaluated bycomparison to determine whether one is more suitable for an application thananother. Moreover, fan sound power levels establish an accurate base for esti-mating the acoustical outcome of the fan installation in terms of sound pressurelevels. A successful estimate of sound pressure levels requires extensive informa-tion on the fan and the environment in which it is to be located.
It is often advantageous for the fan equipment user to employ acoustical consul-tation to ensure that all factors that affect the final sound pressure levels are con-sidered. Additional information on the complexity of this situation may be found inother documents available elsewhere.

Contents Page
1. Scope . . . . . . . . . . . . . . . . . . . . . . . . . . . . . . . . . . . . . . . . . . . . . . . . . . . . . . . .1
2. Normative references . . . . . . . . . . . . . . . . . . . . . . . . . . . . . . . . . . . . . . . . . . . .1
3. Definitions / units of measure / symbols . . . . . . . . . . . . . . . . . . . . . . . . . . . . .1
3.1 Definitions . . . . . . . . . . . . . . . . . . . . . . . . . . . . . . . . . . . . . . . . . . . . . . . . .1
3.2 Symbols . . . . . . . . . . . . . . . . . . . . . . . . . . . . . . . . . . . . . . . . . . . . . . . . . .3
4. Instruments / methods of measurement . . . . . . . . . . . . . . . . . . . . . . . . . . . . .3
4.1 Sound level meter . . . . . . . . . . . . . . . . . . . . . . . . . . . . . . . . . . . . . . . . . .3
4.2 Microphone system . . . . . . . . . . . . . . . . . . . . . . . . . . . . . . . . . . . . . . . . .3
4.3 Frequency analyzer and weighting system . . . . . . . . . . . . . . . . . . . . . . .3
4.4 Data recording equipment . . . . . . . . . . . . . . . . . . . . . . . . . . . . . . . . . . . .3
4.5 Reference sound source (RSS) . . . . . . . . . . . . . . . . . . . . . . . . . . . . . . . .3
4.6 Test method . . . . . . . . . . . . . . . . . . . . . . . . . . . . . . . . . . . . . . . . . . . . . . .5
4.7 Accuracy of results . . . . . . . . . . . . . . . . . . . . . . . . . . . . . . . . . . . . . . . . . .5
5. Equipment / setups . . . . . . . . . . . . . . . . . . . . . . . . . . . . . . . . . . . . . . . . . . . . .5
5.1 Reverberant room . . . . . . . . . . . . . . . . . . . . . . . . . . . . . . . . . . . . . . . . . .5
5.2 Setup categories . . . . . . . . . . . . . . . . . . . . . . . . . . . . . . . . . . . . . . . . . . .5
5.3 Aerodynamic performance . . . . . . . . . . . . . . . . . . . . . . . . . . . . . . . . . . . .5
5.4 Mounting methods . . . . . . . . . . . . . . . . . . . . . . . . . . . . . . . . . . . . . . . . . .6
5.5 Duct length . . . . . . . . . . . . . . . . . . . . . . . . . . . . . . . . . . . . . . . . . . . . . . . .6
5.6 Microphone travel . . . . . . . . . . . . . . . . . . . . . . . . . . . . . . . . . . . . . . . . . . .6
5.7 Calibration of system . . . . . . . . . . . . . . . . . . . . . . . . . . . . . . . . . . . . . . . .6
5.8 Equations . . . . . . . . . . . . . . . . . . . . . . . . . . . . . . . . . . . . . . . . . . . . . . . .10
6. Observations and conduct of test . . . . . . . . . . . . . . . . . . . . . . . . . . . . . . . . .10
6.1 Observations . . . . . . . . . . . . . . . . . . . . . . . . . . . . . . . . . . . . . . . . . . . . .10
6.2 Information to be recorded . . . . . . . . . . . . . . . . . . . . . . . . . . . . . . . . . . .11
7. Calculations . . . . . . . . . . . . . . . . . . . . . . . . . . . . . . . . . . . . . . . . . . . . . . . . . .11
7.1 Background correction . . . . . . . . . . . . . . . . . . . . . . . . . . . . . . . . . . . . . .12
7.2 Sound power level (Lw) . . . . . . . . . . . . . . . . . . . . . . . . . . . . . . . . . . . . .12
8. Results and report . . . . . . . . . . . . . . . . . . . . . . . . . . . . . . . . . . . . . . . . . . . .12
8.1 Test subject . . . . . . . . . . . . . . . . . . . . . . . . . . . . . . . . . . . . . . . . . . . . . .12
8.2 Laboratory and instruments . . . . . . . . . . . . . . . . . . . . . . . . . . . . . . . . . .13
8.3 Acoustical data . . . . . . . . . . . . . . . . . . . . . . . . . . . . . . . . . . . . . . . . . . . .13
Annex A (normative) Room qualification: full and one-third octave . . . . . . . . . .15
A.1 General . . . . . . . . . . . . . . . . . . . . . . . . . . . . . . . . . . . . . . . . . . . . . . . . .15
A.2 Instruments and quipment . . . . . . . . . . . . . . . . . . . . . . . . . . . . . . . . . . .15
A.3 Test procedure . . . . . . . . . . . . . . . . . . . . . . . . . . . . . . . . . . . . . . . . . . . .15
v

A.4 Computation procedure . . . . . . . . . . . . . . . . . . . . . . . . . . . . . . . . . . . . .15
A.5 Qualification . . . . . . . . . . . . . . . . . . . . . . . . . . . . . . . . . . . . . . . . . . . . . .16
Annex B (informative) Room qualification: pure tones / narrow-band . . . . . . .17
B.1 General . . . . . . . . . . . . . . . . . . . . . . . . . . . . . . . . . . . . . . . . . . . . . . . . .17
B.2 Instruments and equipment . . . . . . . . . . . . . . . . . . . . . . . . . . . . . . . . . .17
B.3 Test procedure . . . . . . . . . . . . . . . . . . . . . . . . . . . . . . . . . . . . . . . . . . . .17
B.4 Computation . . . . . . . . . . . . . . . . . . . . . . . . . . . . . . . . . . . . . . . . . . . . . .18
B.5 Qualification . . . . . . . . . . . . . . . . . . . . . . . . . . . . . . . . . . . . . . . . . . . . . .18
Annex C (informative) Uncertainties analysis . . . . . . . . . . . . . . . . . . . . . . . . . . .21
C.1 Definitions . . . . . . . . . . . . . . . . . . . . . . . . . . . . . . . . . . . . . . . . . . . . . . .21
C.2 Uncertainties . . . . . . . . . . . . . . . . . . . . . . . . . . . . . . . . . . . . . . . . . . . . .21
C.3 Room response . . . . . . . . . . . . . . . . . . . . . . . . . . . . . . . . . . . . . . . . . . .21
C.4 Fan operating points . . . . . . . . . . . . . . . . . . . . . . . . . . . . . . . . . . . . . . .23
C.5 Instrument error . . . . . . . . . . . . . . . . . . . . . . . . . . . . . . . . . . . . . . . . . . .23
C.6 Reference sound source (RSS) . . . . . . . . . . . . . . . . . . . . . . . . . . . . . . .24
C.7 Estimated standard deviation for determination of sound power levels 24
C.8 Duct end reflection corrections . . . . . . . . . . . . . . . . . . . . . . . . . . . . . . .24
C.9 Octave band vs. One-third octave band . . . . . . . . . . . . . . . . . . . . . . . .25
C.10 Accuracy of the 63 hz octave band . . . . . . . . . . . . . . . . . . . . . . . . . . . .26
Annex D (informative) Alternative procedure for reference sound source calibra-
tion . . . . . . . . . . . . . . . . . . . . . . . . . . . . . . . . . . . . . . . . . . . . . . . . . . . . . . . . .27
D.1 General . . . . . . . . . . . . . . . . . . . . . . . . . . . . . . . . . . . . . . . . . . . . . . . . .27
D.2 Equipment and facilities . . . . . . . . . . . . . . . . . . . . . . . . . . . . . . . . . . . . .27
D.3 Qualification . . . . . . . . . . . . . . . . . . . . . . . . . . . . . . . . . . . . . . . . . . . . . .27
D.4 Procedure . . . . . . . . . . . . . . . . . . . . . . . . . . . . . . . . . . . . . . . . . . . . . . .27
D.5 RSS sound power levels . . . . . . . . . . . . . . . . . . . . . . . . . . . . . . . . . . . .28
Annex E (normative) Duct end reflection correction . . . . . . . . . . . . . . . . . . . . . .29
E.1 General . . . . . . . . . . . . . . . . . . . . . . . . . . . . . . . . . . . . . . . . . . . . . . . . .29
E.2 End reflection curves . . . . . . . . . . . . . . . . . . . . . . . . . . . . . . . . . . . . . . .29
Annex F (informative) Filter-weighted measurements . . . . . . . . . . . . . . . . . . . .34
Annex G (informative) Radiation of sound by fan casing . . . . . . . . . . . . . . . . . .35
G.1 General . . . . . . . . . . . . . . . . . . . . . . . . . . . . . . . . . . . . . . . . . . . . . . . . .35
G.2 Instruments and equipment . . . . . . . . . . . . . . . . . . . . . . . . . . . . . . . . . .35
G.3 Setup and test . . . . . . . . . . . . . . . . . . . . . . . . . . . . . . . . . . . . . . . . . . . .35
G.4 Observations and calculations . . . . . . . . . . . . . . . . . . . . . . . . . . . . . . . .35
Annex H (informative) Total fan sound testing with attached ducts . . . . . . . . . .36
Annex J (informative) References . . . . . . . . . . . . . . . . . . . . . . . . . . . . . . . . . . .38
vi

AMCA INTERNATIONAL INC. AMCA 300-05
REVERBERANT ROOM METHODFOR SOUND TESTING OF FANS1. Scope
This standard applies to fans of all types and sizes. This standard is limited to the determination of airborne sound emission for the specified setups. Vibration is not measured, nor is the sensitivity of airborne sound emission to vibration effects determined.
The size of a fan that can be tested in accordance with this standard is limited only by the practical aspects of the test setups. Dimensional limitations, test subject dimensions, and air performance will control the test room size and power and mounting requirements for the test subject.
The test setup requirements in this standard establish the laboratory conditions necessary for a successful test. Rarely will it be possible to meet these requirements in a field situation. This standard is not intended for field measurements.
2. Normative references
The following standards contain provisions that, through specific reference in this text, constitute provisions of this American National Standard. At the time of publication the editions indicated were valid. All standards are subject to revision, and parties to agreements based on this American National Standard are encouraged to investigate the possibility of applying the most recent editions of the standards listed below.
ANSI/AMCA 210-99 / ANSI/ASHRAE 51-1999 Laboratory Methods of Testing Fans for Aerodynamic Performance Rating, Air Movement and Control Association International, Inc., 30 W. University Drive, Arlington Heights, IL 60004-1893 U.S.A, 1999
ANSI S1.4-1983; S1.4A-1985 Specification for Sound Level Meters, Acoustical Society of
America, 120 Wall St., 32nd Floor, New York, NY 10005-3993 U.S.A., 1985 (AMCA #2315-83-AO)
ANSI S1.11-2004 Specification for Octave Band and Fractional Octave Band Analog and Digital Filters, Acoustical Society of America, 120 Wall St., 32nd Floor, New York, NY 10005-3993 U.S.A., 1986 (AMCA #1727-86-AO)
ANSI S1.40-1984 Standard Specification for Acoustical Calibrators, Acoustical Society of America, 120 Wall St., 32nd Floor, New York, NY 10005-3993 U.S.A., 1984 (AMCA #1895-84-AO)
ANSI S12.5-1990 Requirements for the Performance and Calibration of Reference Sound Sources, Acoustical Society of America, 120 Wall St., 32nd Floor, New York, NY 10005-3993 U.S.A., 1990 (AMCA #1863-90-AO)
ANSI S12.12-1992 Engineering Method for the Determination of Sound Power Levels of Noise Sources Using Sound Intensity, Acoustical Society of America, 120 Wall St., 32nd Floor, New York, NY 10005-3993 U.S.A., 1992 (AMCA #1850-92-AO)
ANSI/IEEE/ASTM SI 10-1997 Standard for Use of the International System of Units (SI): The Modern Metric System, Institute of Electrical and Electronic Engineers, 345 east 47th Street, New York, NY 10017 U.S.A., 1997 (AMCA #2924-97-AO)
3. Definitions / units of measure / symbols
3.1 Definitions
3.1.1 Blade Passage Frequency (BPF): The frequency of fan impeller blades passing a single fixed object, per the following formula:
BPF = (number of blades)(fan rotational speed, rev/min) / 60, in Hz.
3.1.2 Chamber: An enclosure used to regulate airflow and absorb sound; it may also conform to air test chamber conditions given in ANSI/AMCA 210.
3.1.3 Decibel (dB): A dimensionless unit of

AMCA 300-05
2
level in logarithmic terms for expressing the ratio of a power, or power-like, quantity to a similar reference quantity. (See 3.1.13 and 3.1.14)
3.1.4 Ducted Fan: A fan having a duct connected to either its inlet, its outlet, or to both.
3.1.5 End Reflection: A phenomenon that occurs whenever sound is transmitted across an abrupt change in area, such as at the end of a duct in a room. When end reflection occurs some of the sound entering the room is reflected back into the duct and does not escape into the room.
3.1.6 Frequency: The number of times in one second that a periodic function repeats itself.
3.1.7 Informative: A term that indicates thatthe referenced material is provided as advice to the reader but does not constitute a mandatory requirement.
3.1.8 Non-ducted Fan: A fan without a duct connected to either its inlet or outlet.
3.1.9 Normative: A term that indicates that the referenced material, if applied, constitutes a mandatory requirement.
3.1.10 Octave Band: The interval between any two frequencies having a ratio of two. Fan sound power levels are reported in eight standardized octave bands shown in Table 1. Fan sound power levels may also be reported in one-third octave bands, also shown in Table 1.
3.1.11 Reverberant Room: An enclosure meeting the requirements of Annex A, or Annex A and Annex B.
3.1.12 Shall and Should: The word shall is to be understood as mandatory; the word shouldas advisory.
3.1.13 Sound Power Level: The value, expressed in decibels (dB), of ten times the logarithm (base 10) of the ratio of the sound power W to the reference sound power Wref,according to:
LW, in dB = 10 log10 ( W / Wref ) (3-1)
3.1.14 Sound Pressure Level: The value, expressed in decibels (dB), of twenty times the logarithm (base 10) of the ratio of the sound pressure p to the reference sound pressure pref,according to:
Table 1 - Standardized octave and one-third octave bands [5]
Octave Bands
Band no. 1 2 3 4 5 6 7 8
ANSI Band no. 18 21 24 27 30 33 36 39
Center frequency f, Hz 63 125 250 500 1000 2000 4000 8000
One-Third Octave Bands
Band 1 Band 2 Band 3 Band 4
ANSI Band no. 17 18 19 20 21 22 23 24 25 26 27 28
Center freq. f, Hz 50 63 80 100 125 160 200 250 315 400 500 630
Band 5 Band 6 Band 7 Band 8
ANSI Band no. 29 30 31 32 33 34 35 36 37 38 39 40
Center freq. f, Hz 800 1000 1250 1600 2000 2500 3150 4000 5000 6300 8000 10000

AMCA 300-05
3
Lp, in dB = 20 log10 ( p / pref ) (3-2)
3.1.15 Wavelength: The distance between two points having the same phase in two consecutive cycles of a periodic wave, along a line in the direction of propagation [5]. Wavelength ( ) is determined by frequency and the speed of sound in the air through which the wave propagates:
= c / f (3-3)
where:
f = frequency, Hz c = 343 m/s @ 20°C (1125 ft/s @ 68°F)
The value for c is acceptable for use in this standard within the limits of ± 5°C (9°F) for standard air.
3.1.16 Standard Air: Air having a density of 1.2 kg/m3 (0.075 lbm/ft3). Standard air has a ratio of specific heats of 1.4 and a viscosity of 1.8185E-03 Pa•s (1.222E-05 lbm/ft-s). Air at 20°C (68°F), 50% relative humidity, and 101.325 kPa (14.696 lbm/in.2, 29.92 in. Hg) barometric pressure has these properties, approximately).
3.2 Symbols
(See Table 2.)
4. Instruments / methods of measurement
4.1 Sound level meter
The sound level meter shall meet the requirements of ANSI S1.4 and S1.4A. The sound level meter should be capable of accepting a microphone extension cable.
4.2 Microphone system
The microphone system (transducer and any associated components and cable) shall meet the requirements for use in a Type 1 precision sound level meter according to ANSI S1.4 and S1.4A. A microphone with a nominal diameter of 13 mm (0.5 in.) is recommended.
4.3 Frequency analyzer and weighting system
An octave band or one-third octave band filter set is required and shall meet the Order 3 Type 3-D requirements of ANSI S1.11. An A-weighting network shall meet the requirements of ANSI S1.4 and S1.4A. Other weighting networks may be used to improve the accuracy, as outlined in Annex F.
4.4 Data recording equipment
This standard does not attempt to set limitations on data recording equipment. Considerations include long-term stability, ease of use, and the method of averaging the sound pressure signal. Modern integrating-type analyzers that comply with IEC 804 are recommended because they produce Lp values eliminating any need for visual averaging. Graphic level recorders can be used to make permanent records and ease the problem of making visual averages from sound level meter indications.
4.5 Reference sound source (RSS)
The reference sound source should comply with the requirements of ANSI S12.5.
4.5.1 The RSS shall be a small, modified, direct-driven centrifugal fan having maximum overall dimensions of 610 mm (2 ft) or less.
4.5.2 The RSS shall produce steady broad-band sound over at least the frequency range from 50 Hz to 10,000 Hz. It shall comply in all respects with the performance requirements of ANSI S12.5.
4.5.3 The RSS shall be equipped with vibration isolators that minimize transmitted vibration. The degree of isolation should be 20 dB or more. If metal springs are used as vibration isolators, rubber pads shall be used between the isolator and the structure of the reverberant room.
4.5.4 To ensure compliance with the stability requirements of ANSI S12.5, all operating parts of the RSS shall be rigidly and permanently

AMCA 300-05
4
Table 2 - Symbols
UNIT OF MEASURE SYMBOL DESCRIPTION SI I-P
Amin Minimum distance to reverberant field m ft c Speed of sound m/s ft/s D Duct diameter m ft Eo End reflection factor, at duct outlet dB dB Ei End reflection factor, at duct inlet dB dB EW End reflection factor, adjustment to sound power level dB dB f Frequency Hz Hz J1 Bessel function of the first kind, first order k Wave number K1 Modified Bessel function of the second kind, first order Lp Sound pressure level, re 20 Pa (20 bar) dB dB Lpc Corrected fan sound pressure level dB dB Lpb Sound pressure level of room background, measured over the
normal microphone path dB dB
Lpm Sound pressure level of fan + room background, measured over the normal microphone path
dB dB
Lpq Sound pressure level of the RSS, corrected dB dB Lpqm Sound pressure level of RSS + room background, measured
over the normal microphone path dB dB
LW Sound power level re 1 picowatt (1.0E-12 W) dB dB LWi Sound power level; transmitted to inlet duct from fan dB dB LWm Sound power level measured at the open inlet and outlet of the
fandB dB
LWmi Sound power level measured at the open inlet of the fan dB dB LWmo Sound power level measured at the open outlet of the fan dB dB LWo Sound power level transmitted to the outlet duct from fan dB dB LWr Sound power level of RSS dB dB p Sound pressure Pa bar pref Sound pressure reference level, 20 Pa Pa bar Ps Fan static pressure Pa in. wg Pt Fan total pressure Pa in. wg r Ratio (of Duct area / Orifice area) dimensionless R Reflection coefficient dimensionless s Standard deviation dB dB W Sound power (in watts) W W Wref Reference sound power (1 picowatt) W W ZM Mechanical impedence N s/m
Ratio of transmitted to reflected sound dimensionless Ratio of specific heats dimensionless Wavelength m ft Angular frequency rad/s rad/s

AMCA 300-05
5
attached. No rubber or wearing parts shall be permitted (except lubricated bearings) and protection against corrosion shall be provided.
4.5.5 The RSS calibration shall consist of a determination of the sound power level radiated by the RSS (including vibration isolators) when it is in operation on a reflecting plane with radiation into a free field above that plane. The calibration shall be in accordance with ANSI S12.5 or as provided in Annex D. The maximum time interval since calibration shall not exceed that specified by the manufacturer or three years, whichever is shorter.
4.6 Test method
The test method is based on a Reference Sound Source (RSS) substitution for the determination of sound power. The reference document for this method is ANSI S12.51.
Application of the test method requires that the test subject fan be set in position in a test room that is qualified according to the requirements of Section 5.1.
Once the test room has been qualified, sound pressure levels are recorded with the RSS operating. The fan is then operated, without the RSS in operation, at various performance points of interest for the given test speed and the sound pressure levels are recorded. Since the sound power levels of the RSS are known, the substitution method is used to determine the sound power levels of the fan for each operating point.
Current ANSI and ASA documents on sound testing, facilities and equipment are useful references. See Annex J.
4.7 Accuracy of results
Accuracy of test results is addressed in Annex C and depends upon several variables, including the room qualification and the type of test setup utilized.
5. Equipment/setups
5.1 Reverberant room
An enclosure meeting the requirements of Annex A is mandatory for the purposes of this standard. An enclosure meeting the requirements of Annex B is recommended for broad-band sound testing and is mandatory for the purpose of investigating pure tones and narrow bands.
5.2 Setup categories
A number of specific fan test setups are allowed. They are determined by the airflow direction and the particular mounting arrangement of the test subject. The test setups fall into two general categories.
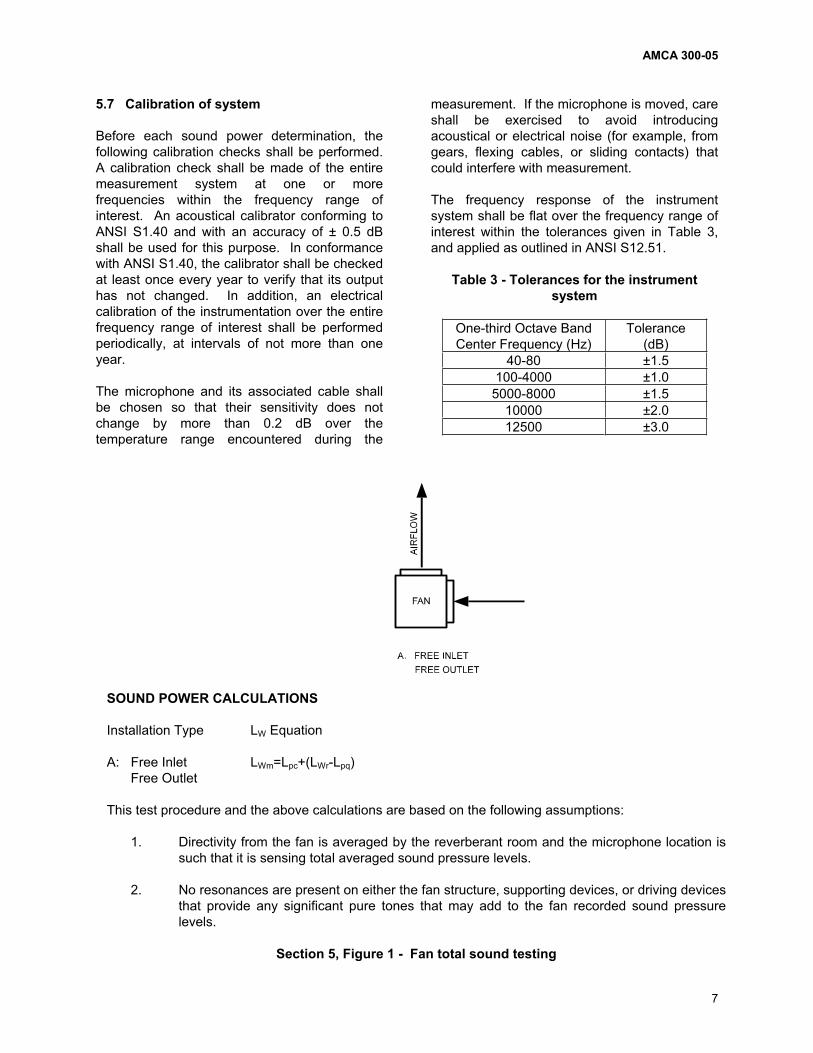
The first category is for a free-standing unit that would be placed entirely in the test room (see Figure 1). Results of this arrangement yield total sound power LW of the test subject, non-ducted. For the total sound power of a ducted test subject located entirely in the test room, see Annex H.
The second category includes those fans that would be tested on a chamber or two-room system where only the inlet or outlet terminate in the test room (see Figures 2 and 3). These arrangements result in the determination of inlet (LWi) or outlet (LWo) sound power. Section 5.6 discuses the limitations that must be imposed on the test room for determining the position of the test subject and the location of the microphone. The choice of test setup for a specific test will depend on the way the fan is expected to be applied in the field.
5.3 Aerodynamic performance
Where an aerodynamic performance test is necessary to determine the point of operation of a test subject, the test shall be performed in accordance with ANSI/AMCA 210 or other fan aerodynamic performance test standard having a demonstrated accuracy equivalent to ANSI/AMCA 210.
AMCA 300-05
6
5.4 Mounting methods
The method of mounting a test subject, or connecting it to a non-integral driver, or connecting it to an airflow test facility is not specified. Any conventional method may be used including vibration isolation devices and short flexible connectors. Other than these, sound and vibration absorptive material may not be incorporated in the test subject unless it is a standard part of the fan. Ducts shall be of metal or other rigid, dense non-absorptive material and have no exposed sound absorption material on the interior or exterior surfaces.
The driving motor and drive, when not an integral part of the test subject, may be damped or enclosed in any manner that does not expose sound absorption material to the test room. When a driving motor and drive are an integral part of the test subject, they may not be treated in any manner, and normal belt tensions, bearings, and lubricants shall be used. When a fan and its drive are both in the reverberant room, the test results may contain sound contributions from flanking paths as well as mechanical and/or electrical sound from the drive system.
5.5 Duct length
On a chamber or two-room setup, the length of duct shall be consistent with acceptable practice per ANSI/AMCA 210 necessary to accurately establish the point of rating.
The length of duct shown in Figures 2 and 3 is consistent with the procedures of ANSI/AMCA 210. Care must be exercised to ensure that no duct resonances exist in close proximity to specific frequencies of interest such as the Blade Pass Frequency.
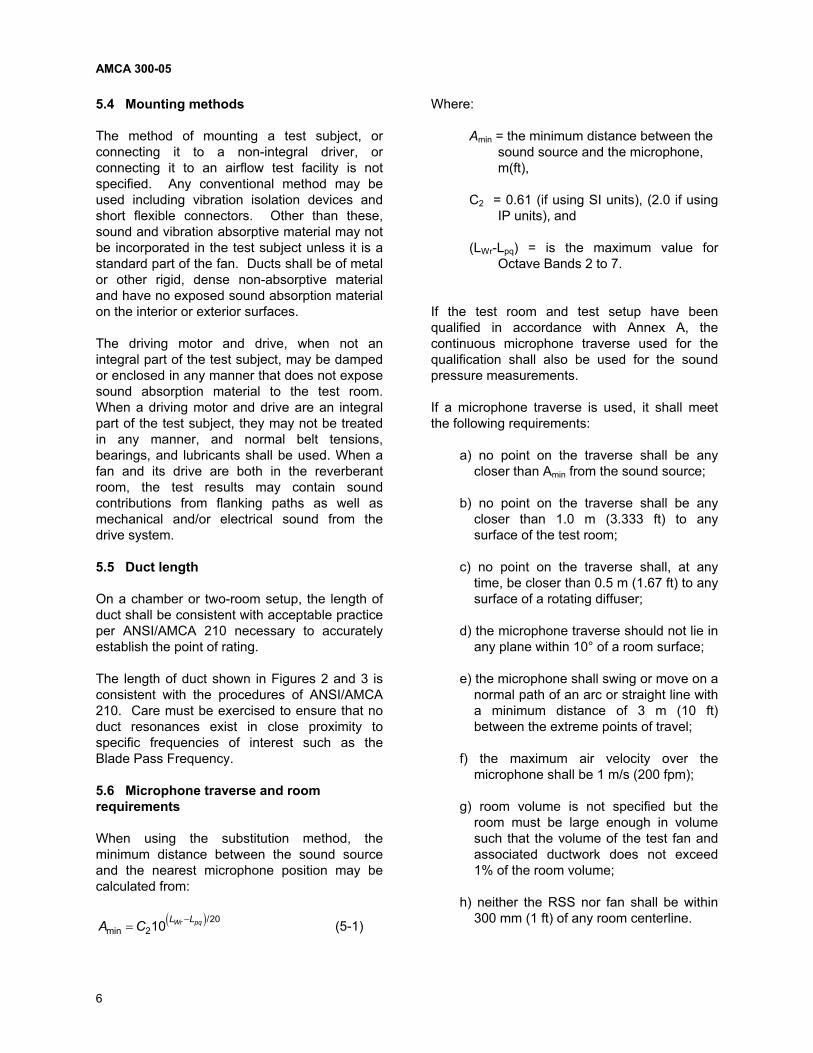
5.6 Microphone traverse and room requirements
When using the substitution method, the minimum distance between the sound source and the nearest microphone position may be calculated from:
A C L LWr pqmin
/2
2010 (5-1)
Where:
Amin = the minimum distance between the sound source and the microphone, m(ft),
C2 = 0.61 (if using SI units), (2.0 if using IP units), and
(LWr-Lpq) = is the maximum value for Octave Bands 2 to 7.
If the test room and test setup have been qualified in accordance with Annex A, the continuous microphone traverse used for the qualification shall also be used for the sound pressure measurements.
If a microphone traverse is used, it shall meet the following requirements:
a) no point on the traverse shall be any closer than Amin from the sound source;
b) no point on the traverse shall be any closer than 1.0 m (3.333 ft) to any surface of the test room;
c) no point on the traverse shall, at any time, be closer than 0.5 m (1.67 ft) to any surface of a rotating diffuser;
d) the microphone traverse should not lie in any plane within 10° of a room surface;
e) the microphone shall swing or move on a normal path of an arc or straight line with a minimum distance of 3 m (10 ft) between the extreme points of travel;
f) the maximum air velocity over the microphone shall be 1 m/s (200 fpm);
g) room volume is not specified but the room must be large enough in volume such that the volume of the test fan and associated ductwork does not exceed 1% of the room volume;
h) neither the RSS nor fan shall be within 300 mm (1 ft) of any room centerline.
AMCA 300-05
7
5.7 Calibration of system
Before each sound power determination, the following calibration checks shall be performed. A calibration check shall be made of the entire measurement system at one or more frequencies within the frequency range of interest. An acoustical calibrator conforming to ANSI S1.40 and with an accuracy of ± 0.5 dB shall be used for this purpose. In conformance with ANSI S1.40, the calibrator shall be checked at least once every year to verify that its output has not changed. In addition, an electrical calibration of the instrumentation over the entire frequency range of interest shall be performed periodically, at intervals of not more than one year.
The microphone and its associated cable shall be chosen so that their sensitivity does not change by more than 0.2 dB over the temperature range encountered during the
measurement. If the microphone is moved, care shall be exercised to avoid introducing acoustical or electrical noise (for example, from gears, flexing cables, or sliding contacts) that could interfere with measurement.
The frequency response of the instrument system shall be flat over the frequency range of interest within the tolerances given in Table 3, and applied as outlined in ANSI S12.51.
Table 3 - Tolerances for the instrument system
One-third Octave Band Center Frequency (Hz)
Tolerance(dB)
40-80 ±1.5 100-4000 ±1.0 5000-8000 ±1.5
10000 ±2.0 12500 ±3.0
SOUND POWER CALCULATIONS
Installation Type LW Equation
A: Free Inlet LWm=Lpc+(LWr-Lpq) Free Outlet
This test procedure and the above calculations are based on the following assumptions:
1. Directivity from the fan is averaged by the reverberant room and the microphone location is such that it is sensing total averaged sound pressure levels.
2. No resonances are present on either the fan structure, supporting devices, or driving devices that provide any significant pure tones that may add to the fan recorded sound pressure levels.
Section 5, Figure 1 - Fan total sound testing
AMCA 300-05
8
1 to 3D
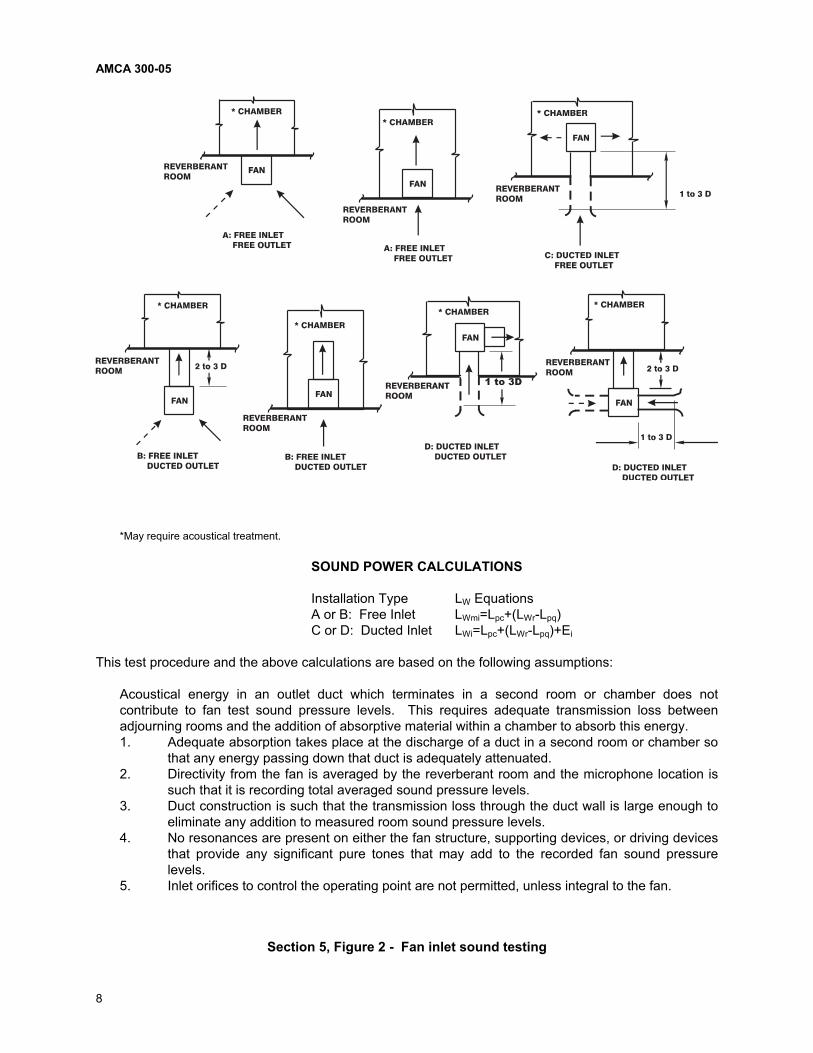
*May require acoustical treatment.
SOUND POWER CALCULATIONS
Installation Type LW Equations A or B: Free Inlet LWmi=Lpc+(LWr-Lpq) C or D: Ducted Inlet LWi=Lpc+(LWr-Lpq)+Ei
This test procedure and the above calculations are based on the following assumptions:
Acoustical energy in an outlet duct which terminates in a second room or chamber does not contribute to fan test sound pressure levels. This requires adequate transmission loss between adjourning rooms and the addition of absorptive material within a chamber to absorb this energy. 1. Adequate absorption takes place at the discharge of a duct in a second room or chamber so
that any energy passing down that duct is adequately attenuated. 2. Directivity from the fan is averaged by the reverberant room and the microphone location is
such that it is recording total averaged sound pressure levels. 3. Duct construction is such that the transmission loss through the duct wall is large enough to
eliminate any addition to measured room sound pressure levels. 4. No resonances are present on either the fan structure, supporting devices, or driving devices
that provide any significant pure tones that may add to the recorded fan sound pressure levels.
5. Inlet orifices to control the operating point are not permitted, unless integral to the fan.
Section 5, Figure 2 - Fan inlet sound testing

AMCA 300-05
9
2 to 3D
*May require acoustical treatment. SOUND POWER CALCULATIONS
Installation Type LW Equations A or C: Free Outlet LWmo=Lpc+(LWr-Lpq) B or D: Ducted Outlet LWo=Lpc+(LWr-Lpq)+Eo
This test procedure and the above calculations are based on the following assumptions:
1. Acoustical energy in an inlet duct that terminated in a second room or chamber does not contribute to fan test sound pressure levels. This requires adequate transmission loss between adjoining rooms and the addition of absorptive material within a chamber to absorb this energy.
2. Adequate absorption takes place at the inlet of a duct in a second room or chamber so that any energy passing down that duct is adequately attenuated.
3. Directivity from the fan is averaged by the reverberant room and the microphone location is such that it is recording total averaged sound pressure levels.
4. Duct construction is such that the transmission loss through the duct wall is large enough to eliminate any addition to measured room sound pressure levels.
5. No resonances are present on either the fan structure, supporting devices, or driving devices that provide any significant pure tones that may add to the recorded fan sound pressure levels.
6. Outlet orifices to control the operating point are not permitted, unless integral to the fan.
Section 5, Figure 3 - Fan outlet sound testing
AMCA 300-05
10
5.8 Equations
The type of fan and its test setup determine the calculations required to determine the sound power levels (LW, LWm, LWi, LWmi, LWo, LWmo) of the test subject. Equations for each test setup are included under the specific arrangement along with any qualifying statements or limitations. Also included are any assumptions that were made regarding these specific setups. End reflection factors (Ei) and (Eo), when required, shall be calculated from Annex E DuctEnd Reflection Correction, using the appropriate duct and orifice size.
It cannot be assumed that the inlet and outlet sound powers are always equal. Therefore, total sound power levels shall not be used to derive inlet or outlet sound power levels.
6. Observations and conduct of test
6.1 Observations
6.1.1 Point of operation
Although the acoustical observations necessary to determine sound power output are the same for all types of fans, the non-acoustical observations necessary to determine the aerodynamic point of operation differ. This standard provides different test setups for the testing of various fan types. Regardless of the test setup, the point of operation shall be determined. If the sound test setup also conforms to one of the test setups in ANSI/AMCA 210, then the point of rating can be established with sufficient accuracy. If the sound test setup does not conform to one of the test setups in ANSI/AMCA 210, steps must be taken to ensure that the fan rotational speed is known within ± 1% and the point of operation can be established within ± 5% along a system curve.
6.1.2 Sound pressure levels
6.1.2.1 Sound pressure levels, background (Lpb)
Background sound pressure levels are those
measured in the test room with the test subject and the RSS off. The background noise includes all noise sources not directly associated with fan sound. Examples of background noise sources are: noise due to the motion of the microphone and noise due to any other external source. Efforts should be made to keep the background noise level at a minimum. For a test, or set of determinations, at various points of test subject operation, background sound pressure levels need to be observed once.
6.1.2.2 Sound pressure levels, RSS (Lpqm)
RSS sound pressure levels are those measured in the test room with the RSS operating and the test subject off. RSS sound pressure levels include background sound pressure levels. For a test, or set of determinations, at various points of test subject operation, RSS sound pressure levels need to be observed once.
6.1.2.3 Sound pressure levels, fan (Lpm)
Fan sound pressure levels are those measured in the test room with the test subject operating and the RSS off. Fan sound pressure levels include background sound pressure levels. Fansound pressure levels must be observed for each operating point.
Note: The observations above are valid only when taken in a room that is qualified per the procedures defined in Annex A or B.
6.1.3 Test conditions
The test conditions shall, as nearly as possible, be the same for all sound pressure level measurements. Operation of the microphone traverse and any rotating vanes shall be the same for all measurements. Observers and operators should not be in the test room during measurements, but if it is absolutely necessary for them to be present, they shall be away from the test subject and remain in the same position during the test. Readings should be a time weighted average over an integral number of microphone swings. The time span used shall be sufficient to provide a stable value and shall be a minimum of 30 seconds for frequency
AMCA 300-05
11
bands 160 Hz, and 15 seconds for frequency bands 200 Hz.
6.2 Information to be recorded
As applicable, the following information shall be compiled and recorded for all observations made in accordance with this standard.
6.2.1 Test subject
A) Description of the test subject
1) Manufacturer 2) Model 3) Nominal size 4) Impeller diameter, mm (in.) 5) Number of impeller blades 6) Blade angle setting (adjustable or
variable pitch fans only) 7) Number of stator vanes 8) Inlet area, m2 (ft2) 9) Outlet area, m2 (ft2)
B) Operating conditions
1) Fan rotational speed, rev/min 2) Fan airflow rate, m3/s (ft3/min) 3) Fan static pressure or total pressure
at actual test conditions, Pa (in. wg) 4) Fan air density, kg/m3 (lbm/ft3)
C) Mounting conditions
1) Test figure per this standard 2) Test Installation Type 3) Sketch showing the test room setup,
including the dimensional locations of the test subject and points or path of acoustical measurements
6.2.2 Test environment
A) Barometric pressure, kPa (in. Hg)
B) Ambient dry-bulb temperature, °C (°F)
C) Ambient wet-bulb temperature, °C (°F)
D) Fan inlet dry-bulb temperature, °C (°F)
E) Static pressure at the fan inlet, Pa (in. wg)
6.2.3 Laboratory and instruments
A) Laboratory name
B) Laboratory location
C) Technician(s) conducting test
D) List of test equipment used, with calibration information
E) Scope of room qualification. Data shall indicate whether the room is qualified for full octaves or one-third octaves, and in the case of pure tone testing, the one-third octaves for which the qualification applies.
6.2.4 Acoustical data
A) Background sound pressure levels Lpb
B) RSS sound pressure levels Lpqm
C) Background corrections for the RSS
D) Fan sound pressure levels Lpm
E) Background corrections for the fan
F) Un-weighted fan sound power levels LWmi or LWmo
G) End reflection correction data
1) End reflection correction values Eior Eo
2) Duct length 3) Flush or non-flush mounting of the
duct into the test room 4) Orifice plate inside diameter, m (ft)
H) Test date
7. Calculations
Calculations are affected by the Installation Type and setup. See Section 5.8 in addition to the following.

AMCA 300-05
12
7.1 Background correction
The observed RSS or test subject sound pressure levels include both the sound source and background noise. The effect of background noise level is termed background correction and must be subtracted from the observed sound pressure level. Background correction values depend on the difference between the observed sound pressure levels and the background noise levels.
When the difference between the observed sound pressure levels (RSS – background) in a frequency band is less than 6 dB, the corresponding sound pressure level from the source cannot be determined accurately by this standard. For any band for which the difference between the background and the (background + source) sound pressure level is less than 6 dB, Lpc shall be reported as 1.3 dB less than Lpm.The data for each such band shall be clearly marked as upper boundary levels.
A sound pressure level reading shall be corrected for background noise level by logarithmic subtraction using the following formulae:
Test subject (fan) sound pressure level:
Lpc
L Lpm pb
10 10 101010 10log (7-1)
RSS sound pressure level:
Lpq
L Lpqm pb
10 10 101010 10log (7-2)
Example: The sound pressure level of a fan in a given frequency band is observed to be 58 dB. The background sound pressure level in the same band is observed to be 51 dB. The background value is subtracted logarithmically from the fan sound pressure level using Equation 7-1, which results in 57 dB (rounded).
7.2 Sound power level (LW)
A sound power level is calculated using equations given in Section 5. The equations vary with product type and test setup. The sound power level of a full octave band may be calculated from one-third octave band values by using the formula:
LW
L L LW W W
10 10 10 101010 10 10
1 2 3
log (7-3)
Where:
LW1, LW2, and LW3 are one-third octave sound power level values.
8. Results and report
Test results are presented as the sound power level, in dB, in each of the eight full octave bands for each fan test speed and point of operation. Full octave bands are given in Table 1. The report shall also include data defined in Sections 8.1 through 8.3. This standard does not require that pure tone effects be isolated from broad-band sound. However, a laboratory equipped with suitable instrumentation is encouraged to investigate and report pure tones separately.
8.1 Test subject
A) Description of the test subject
1) Manufacturer 2) Model 3) Nominal size 4) Impeller diameter, mm (in.) 5) Number of impeller blades 6) Blade angle setting (adjustable or
variable pitch fans only)
B) Operating conditions
1) Aerodynamic performance test standard
2) Fan rotational speed, rpm 3) Fan airflow rate, m3/s (ft3/min)
AMCA 300-05
13
4) Fan static pressure or total pressure at actual test conditions, Pa (in. wg)
5) Fan air density, kg/m3 (lbm/ft3)
C) Mounting conditions
1) Test Figure per this standard 2) Installation Type
8.2 Laboratory and instruments
A) Laboratory name
B) Laboratory location
8.3 Acoustical data
A) Un-weighted fan sound power level, in each reported band, reported to the
nearest whole decibel
B) Test date
C) Background sound pressure level in each reported band
D) Background correction for the RSS for each reported band
E) RSS sound pressure level in each reported band
F) Background correction for test subject, in each reported band
G) Test subject sound pressure level, in each reported band

AMCA 300-05
14
This page intentionally left blank.

AMCA 300-05
15
Annex A (normative)
Room qualification: full and one-third octave
A.1 General
This annex covers the procedures for a broad-band qualification of a test room for full and one-third octave bands. If pure tone qualification is required, refer to Annex B Room Qualification: Pure Tones / Narrow Band.
A.2 Instruments and equipment
The instruments and microphone traverse shall be the same as those used during the actual testing of a fan. The instruments shall conform to the requirements given in Sections 4.1. through 4.4, inclusive. The microphone traverse shall conform to the requirements of Section 5.6. The test procedure given in this annex requires the use of a Reference Sound Source (RSS) having the characteristics specified in Section 4.5.
A.3 Test procedure
Eight or more measurements shall be made of the reverberant field sound pressure levels in the room, each with the RSS placed at a different location within the room, under the following conditions:
A.3.1 Each location for the RSS shall be selected on the floor and shall not be closer than 1 m (3 ft) from a wall and not closer to any microphone than permitted by equation Amin (Section 5, Figure 4). The distance between any two RSS locations shall be greater than 0.9 m (3 ft). No source location shall lie within ± 300 mm (1 ft) of a room centerline. The RSS locations shall be in the general vicinity of the locations intended for the test subject as seen in a plan view of the test room.
A.3.2 With the RSS at each of the eight (or more) above locations, determine the average sound pressure levels in accordance with the procedures of Section 6.
A.3.3 The microphone traverse, sound diffuser (if any), instruments and observation times shall be identical to those to be used for a test subject.
A.4 Computation procedure
For each frequency band for which the test room is to be qualified, the standard deviation s, in dB, shall be computed using the formula:
sn
L LRSS
RSS
pq j pqj
n1
1
2
1
1 2/
(A.4-1)
Where:
(Lpq)j = the sound pressure level, in dB, averaged over all microphone positions, when the RSS is in the jth location ___
Lpq = arithmetic mean of (Lpq)j values, in dB, averaged over all RSS locations
AMCA 300-05
16
nRSS = number of RSS locations, a minimum of eight
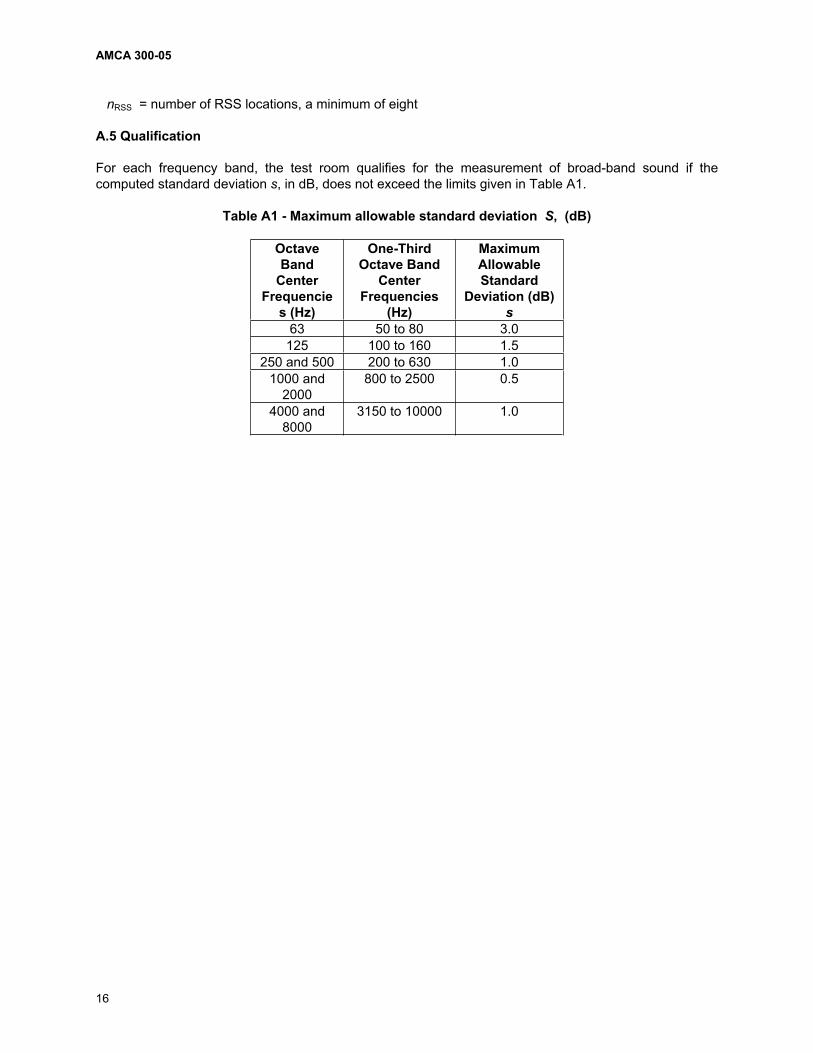
A.5 Qualification
For each frequency band, the test room qualifies for the measurement of broad-band sound if the computed standard deviation s, in dB, does not exceed the limits given in Table A1.
Table A1 - Maximum allowable standard deviation S, (dB)
Octave Band
CenterFrequencie
s (Hz)
One-ThirdOctave Band
CenterFrequencies
(Hz)
MaximumAllowable Standard
Deviation (dB) s
63 50 to 80 3.0 125 100 to 160 1.5
250 and 500 200 to 630 1.0 1000 and
2000800 to 2500 0.5
4000 and 8000
3150 to 10000 1.0
AMCA 300-05
17
Annex B (informative)
Room qualification: pure tones / narrow-band
B.1 General
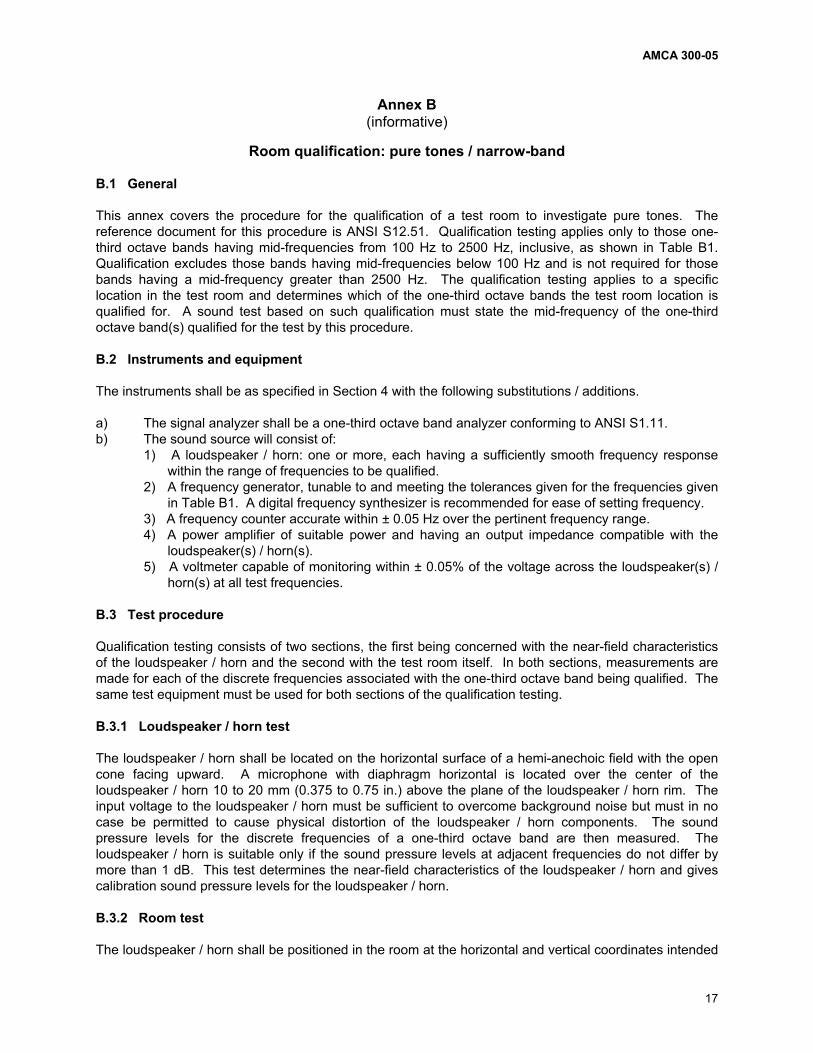
This annex covers the procedure for the qualification of a test room to investigate pure tones. The reference document for this procedure is ANSI S12.51. Qualification testing applies only to those one-third octave bands having mid-frequencies from 100 Hz to 2500 Hz, inclusive, as shown in Table B1. Qualification excludes those bands having mid-frequencies below 100 Hz and is not required for those bands having a mid-frequency greater than 2500 Hz. The qualification testing applies to a specific location in the test room and determines which of the one-third octave bands the test room location is qualified for. A sound test based on such qualification must state the mid-frequency of the one-third octave band(s) qualified for the test by this procedure.
B.2 Instruments and equipment
The instruments shall be as specified in Section 4 with the following substitutions / additions.
a) The signal analyzer shall be a one-third octave band analyzer conforming to ANSI S1.11. b) The sound source will consist of:
1) A loudspeaker / horn: one or more, each having a sufficiently smooth frequency response within the range of frequencies to be qualified.
2) A frequency generator, tunable to and meeting the tolerances given for the frequencies given in Table B1. A digital frequency synthesizer is recommended for ease of setting frequency.
3) A frequency counter accurate within ± 0.05 Hz over the pertinent frequency range. 4) A power amplifier of suitable power and having an output impedance compatible with the
loudspeaker(s) / horn(s). 5) A voltmeter capable of monitoring within ± 0.05% of the voltage across the loudspeaker(s) /
horn(s) at all test frequencies.
B.3 Test procedure
Qualification testing consists of two sections, the first being concerned with the near-field characteristics of the loudspeaker / horn and the second with the test room itself. In both sections, measurements are made for each of the discrete frequencies associated with the one-third octave band being qualified. The same test equipment must be used for both sections of the qualification testing.
B.3.1 Loudspeaker / horn test
The loudspeaker / horn shall be located on the horizontal surface of a hemi-anechoic field with the open cone facing upward. A microphone with diaphragm horizontal is located over the center of the loudspeaker / horn 10 to 20 mm (0.375 to 0.75 in.) above the plane of the loudspeaker / horn rim. The input voltage to the loudspeaker / horn must be sufficient to overcome background noise but must in no case be permitted to cause physical distortion of the loudspeaker / horn components. The sound pressure levels for the discrete frequencies of a one-third octave band are then measured. The loudspeaker / horn is suitable only if the sound pressure levels at adjacent frequencies do not differ by more than 1 dB. This test determines the near-field characteristics of the loudspeaker / horn and gives calibration sound pressure levels for the loudspeaker / horn.
B.3.2 Room test
The loudspeaker / horn shall be positioned in the room at the horizontal and vertical coordinates intended
AMCA 300-05
18
for the test subject and placed so that the open cone faces away from the nearest room surface. Using the same input voltage to the loudspeaker(s) / horn(s) as for the loudspeaker / horn test, space and time averaged sound pressure levels Lps are measured for the discrete frequencies of the one-third octave band.
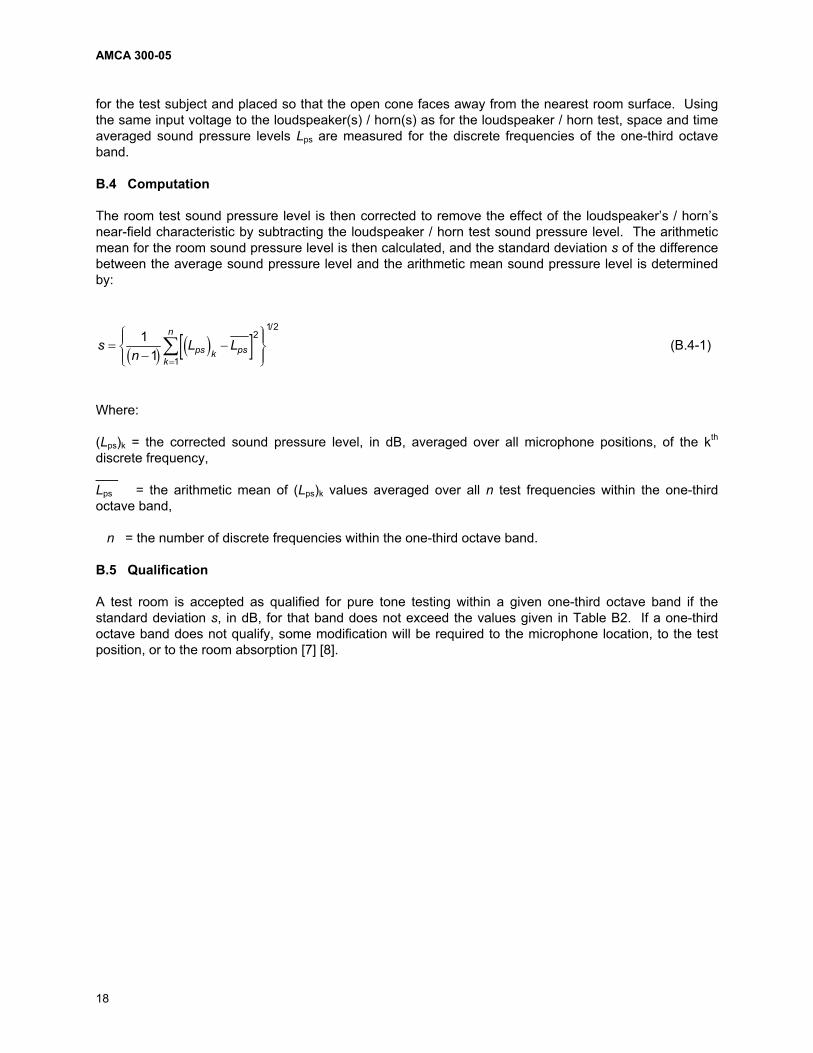
B.4 Computation
The room test sound pressure level is then corrected to remove the effect of the loudspeaker’s / horn’s near-field characteristic by subtracting the loudspeaker / horn test sound pressure level. The arithmetic mean for the room sound pressure level is then calculated, and the standard deviation s of the difference between the average sound pressure level and the arithmetic mean sound pressure level is determined by:
sn
L Lps k psk
n11
2
1
1 2/
(B.4-1)
Where:
(Lps)k = the corrected sound pressure level, in dB, averaged over all microphone positions, of the kth
discrete frequency, ___Lps = the arithmetic mean of (Lps)k values averaged over all n test frequencies within the one-third octave band,
n = the number of discrete frequencies within the one-third octave band.
B.5 Qualification
A test room is accepted as qualified for pure tone testing within a given one-third octave band if the standard deviation s, in dB, for that band does not exceed the values given in Table B2. If a one-third octave band does not qualify, some modification will be required to the microphone location, to the test position, or to the room absorption [7] [8].
AMCA 300-05
19
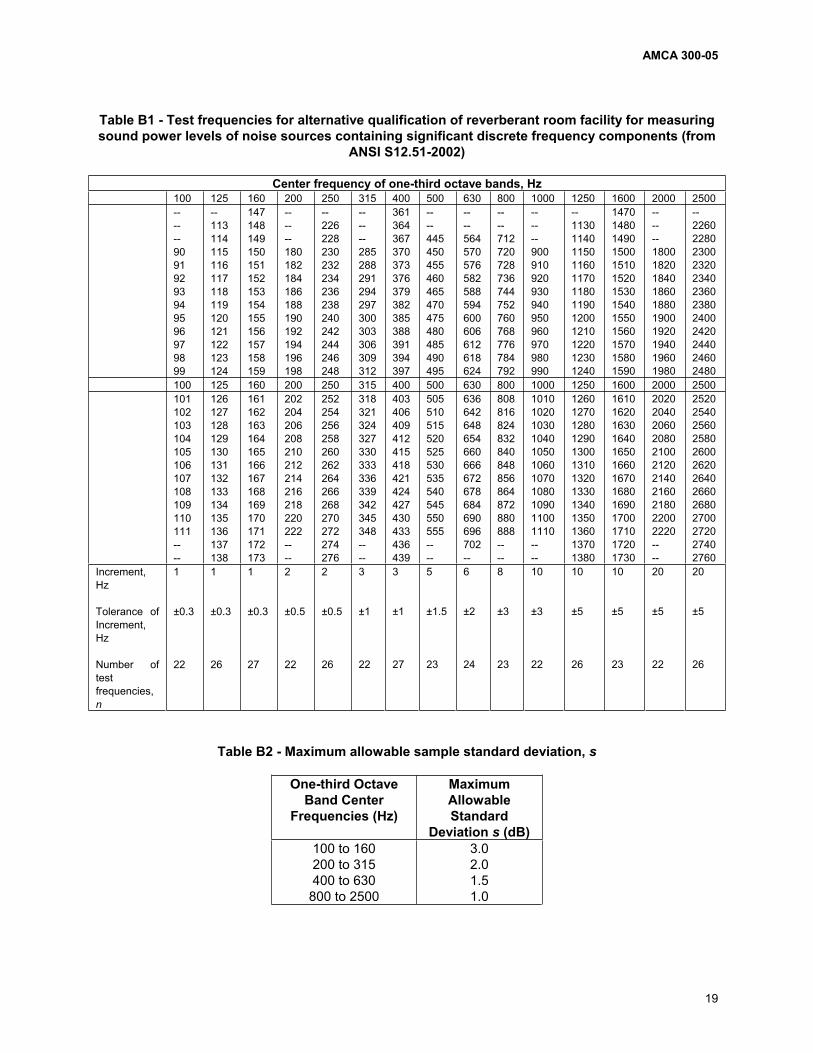
Table B1 - Test frequencies for alternative qualification of reverberant room facility for measuring sound power levels of noise sources containing significant discrete frequency components (from
ANSI S12.51-2002)
Center frequency of one-third octave bands, Hz 100 125 160 200 250 315 400 500 630 800 1000 1250 1600 2000 2500 --
----90919293949596979899
--113114115116117118119120121122123124
147148149150151152153154155156157158159
------180182184186188190192194196198
--226228230232234236238240242244246248
------285288291294297300303306309312
361364367370373376379382385388391394397
----445450455460465470475480485490495
----564570576582588594600606612618624
----712720728736744752760768776784792
------900910920930940950960970980990
--113011401150116011701180119012001210122012301240
1470148014901500151015201530154015501560157015801590
------1800182018401860188019001920194019601980
--226022802300232023402360238024002420244024602480
100 125 160 200 250 315 400 500 630 800 1000 1250 1600 2000 2500 101
102103104105106107108109110111----
126127128129130131132133134135136137138
161162163164165166167168169170171172173
202204206208210212214216218220222----
252254256258260262264266268270272274276
318321324327330333336339342345348----
403406409412415418421424427430433436439
505510515520525530535540545550555----
636642648654660666672678684690696702--
808816824832840848856864872880888----
10101020103010401050106010701080109011001110----
1260127012801290130013101320133013401350136013701380
1610162016301640165016601670168016901700171017201730
20202040206020802100212021402160218022002220----
2520254025602580260026202640266026802700272027402760
Increment,Hz
Tolerance of Increment,Hz
Number of testfrequencies,n
1
±0.3
22
1
±0.3
26
1
±0.3
27
2
±0.5
22
2
±0.5
26
3
±1
22
3
±1
27
5
±1.5
23
6
±2
24
8
±3
23
10
±3
22
10
±5
26
10
±5
23
20
±5
22
20
±5
26
Table B2 - Maximum allowable sample standard deviation, s
One-third Octave Band Center
Frequencies (Hz)
MaximumAllowable Standard
Deviation s (dB) 100 to 160 200 to 315 400 to 630
800 to 2500
3.02.01.51.0

AMCA 300-05
20
This page intentionally left blank.
AMCA 300-05
21
Annex C (informative)
Uncertainties analysis
C.0 General
The analysis of the uncertainty associated with measurements made in accordance with this standard provides identification of certain critical points so as to recognize the limitations of the results. Furthermore, it provides an approximation, in real values, of the imprecision in the recorded results.
C.1 Definitions
Precision error is an error that causes readings to take random values on either side of some mean value.
Systematic error is an error that persists and cannot be considered as due entirely to chance.
Uncertainty is an estimated value for error, i.e., what we think an error would be if we could and did measure it by calibration. Although uncertainty may be the result of both precision and systematic errors, only precision errors can be treated by statistical methods.
The uncertainty in a researched value is described by specifying the measured value followed by the uncertainty interval at the desired confidence level:
LW = m ± w at P confidence level (C.1-1)
Where:m = measured value w = uncertainty P = percent
C.2 Uncertainties
The uncertainties associated with the determination of sound power levels through measurements performed in accordance with this standard are room response (C.3), fan operating points (C.4), instrument error (C.5), and RSS (C.6). Uncertainties associated with duct end reflection corrections involve the accuracy of estimating the losses from orifice plates (C.8). Other areas of interest involve the use of octave or one-third octave bands (C.9) and the problems associated with testing in the 63 Hz band (C.10).
C.3 Room response
A reverberant room is an appropriate place for determining the acoustical power of a source, such as a fan, that emits a steady sound power. The reverberant room must be diffuse enough to produce a reverberant field.
When a sound source is operated inside a reverberant room, the sound waves are reflected by the walls and are propagated in all directions. If the paths of all the waves could be seen, we would notice a number of repetitions, (e.g., the path followed by a wave between two parallel walls). These paths are called normal modes. The greater the number of normal modes, the better the sound dispersion in the room. The modes must be sufficiently numerous in any measurement band so that the microphone traverse will serve to average the sound pressure. The number of normal modes in a given space

AMCA 300-05
22
increases with frequency. Hence, it is usually more precise to measure higher frequencies. When the number of modes are few, it helps to measure the sound in many locations and average the results. Two important sources of error may affect the measurements made in a reverberant room: 1) the error introduced by measuring the sound field at a limited number of points, and 2) variations in sound power due to the location of the sound source. Many sources radiate sound that is not entirely broad-band, but contains significant discrete-frequency components, or pure tones. Some fans generate a pure tone at the blade passage frequency and sometimes at harmonic frequencies.
In a reverberant room, a pure tone tends to excite certain modes that will dominate all others. This noticeably increases the variability of the pressure field due to an insufficient dispersion of the sound field. Due to the consequent inaccuracy of sound pressure averaging, the precision of the results is reduced.
C.3.1 Broad-band measurement in a reverberation room
Broad-band sound is uniformly distributed in frequency with relatively steady levels and with no prominent discrete-frequency or narrow-band components. Measurement of broad-band sound may be made in a test room qualified per Annex A.
C.3.2 Pure-tone measurement in a reverberation room
When a discrete-frequency component is present in the sound spectrum of a source, the spatial variations in sound pressure level usually exhibit maxima separated by minima having an average spacing of approximately 0.8 , where is the wavelength corresponding to the discrete frequency of interest.
The presence of a significant discrete-frequency component in the sound produced by a source can often be detected by a simple listening test. If such a component is audible, or detectable by narrow-band analysis, the qualification procedure described in Annex B is recommended.
If the test room is not qualified for pure-tone measurement, the measurement uncertainty will most probably be higher in the bands containing the blade passage frequency and its harmonics than if measured in a qualified test room.
Discrete-frequency components may be present in the sound spectrum even when these components are not audible. A conclusion that no discrete-frequency components are present can only be reached by performing the test described in C.3.3.
C.3.3 Test for discrete-frequency components
The following procedure can be used to estimate the spatial standard deviation of the sound pressure levels produced by the test subject in the test room.
Select an array of six fixed microphones (or a single microphone at six positions) spaced at least /2apart, where is the wavelength of the sound corresponding to the lowest band mid-frequency of interest and meeting all the requirements for microphone positions in Annex A. Locate the sound source at a single position in the test room in accordance with Annex A.
Obtain the time-averaged sound pressure level Lpj at each microphone position according to the techniques described in Annex A.
For each one-third octave band within the frequency range of interest, calculate the standard deviation s,in dB, from the following equation:

AMCA 300-05
23
sn
L Lm
pcj p jj
nm11
2
1
1 2/
(C.3-1)
Where:
Lpcj = sound pressure level, corrected for the background sound level in accordance with the procedures of Section 6.2.1 for the jth microphone position, dB __Lpj = arithmetic mean of (Lpc)j values, averaged over all microphone positions, dB
nm = number of microphone positions = 6
The magnitude of s depends upon the properties of the sound field in the test room. These properties are influenced by the characteristics of the room as well as the characteristics of the sound source (i.e., directivity and spectrum of the emitted sound). In theory, a standard deviation of 5.57 dB corresponds to a spectral component of zero bandwidth, i.e., a discrete tone.
Table C1 - Characterization of the presence of discrete-frequency or narrow-band components, based upon the spatial variation of the sound field
StandardDeviation, s
(dB)
Characterization
s<1.5 Assume broad-band source (use procedures of Annex A).
1.5<s<3 Assume that a narrow-band of noise is present. Recommend use of the qualification procedure in Annex B.
s>3 Assume that a discreet tone is present. Test room must qualify per Annex B.
C.4 Fan operating points
When the sound power levels of a fan are determined, each measurement must relate to one point of operation of the fan. Uncertainty in identifying this point thus affects the global uncertainty of the results. Therefore it is recommended that the procedures of ANSI/AMCA 210 or other recognized fan aerodynamic performance test standard be used as a guideline in identifying the test subject’s operating points. The sensitivity of the sound levels to a change in point of operation is a function of the test subject’s performance characteristics, and this will dictate how accurately the point of operation must be determined. A fan that exhibits a large change in sound power level as airflow is changed (at a given fan rotational speed) is of more concern than one that shows a small change in sound power level for the same airflow change.
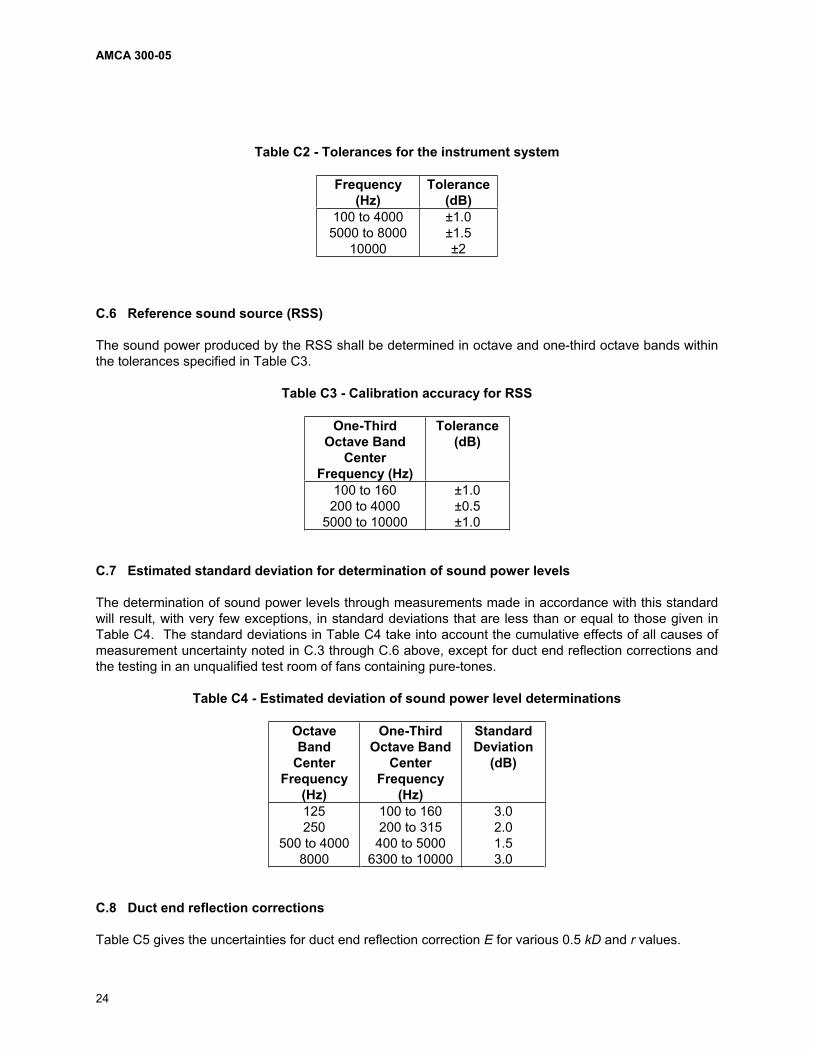
C.5 Instrument error
The frequency response of the instrument system shall be flat over the frequency range of interest to within the tolerances given in Table C2.
AMCA 300-05
24
Table C2 - Tolerances for the instrument system
Frequency (Hz)
Tolerance(dB)
100 to 4000 5000 to 8000
10000
±1.0±1.5±2
C.6 Reference sound source (RSS)
The sound power produced by the RSS shall be determined in octave and one-third octave bands within the tolerances specified in Table C3.
Table C3 - Calibration accuracy for RSS
One-ThirdOctave Band
CenterFrequency (Hz)
Tolerance(dB)
100 to 160 200 to 4000
5000 to 10000
±1.0±0.5±1.0
C.7 Estimated standard deviation for determination of sound power levels
The determination of sound power levels through measurements made in accordance with this standard will result, with very few exceptions, in standard deviations that are less than or equal to those given in Table C4. The standard deviations in Table C4 take into account the cumulative effects of all causes of measurement uncertainty noted in C.3 through C.6 above, except for duct end reflection corrections and the testing in an unqualified test room of fans containing pure-tones.
Table C4 - Estimated deviation of sound power level determinations
Octave Band
CenterFrequency
(Hz)
One-ThirdOctave Band
CenterFrequency
(Hz)
StandardDeviation
(dB)
125250
500 to 4000 8000
100 to 160 200 to 315
400 to 5000 6300 to 10000
3.02.01.53.0
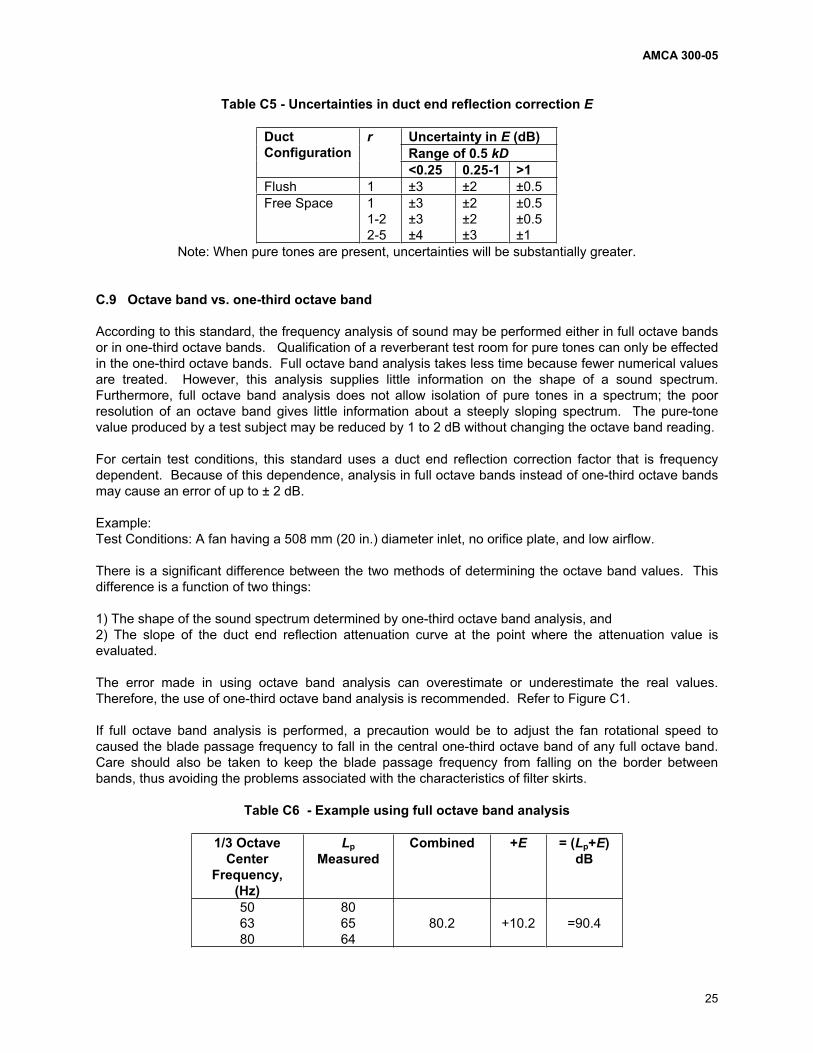
C.8 Duct end reflection corrections
Table C5 gives the uncertainties for duct end reflection correction E for various 0.5 kD and r values.
AMCA 300-05
25
Table C5 - Uncertainties in duct end reflection correction E
Uncertainty in E (dB) Range of 0.5 kD
DuctConfiguration
r
<0.25 0.25-1 >1 Flush 1 ±3 ±2 ±0.5Free Space 1
1-22-5
±3±3±4
±2±2±3
±0.5±0.5±1
Note: When pure tones are present, uncertainties will be substantially greater.
C.9 Octave band vs. one-third octave band
According to this standard, the frequency analysis of sound may be performed either in full octave bands or in one-third octave bands. Qualification of a reverberant test room for pure tones can only be effected in the one-third octave bands. Full octave band analysis takes less time because fewer numerical values are treated. However, this analysis supplies little information on the shape of a sound spectrum. Furthermore, full octave band analysis does not allow isolation of pure tones in a spectrum; the poor resolution of an octave band gives little information about a steeply sloping spectrum. The pure-tone value produced by a test subject may be reduced by 1 to 2 dB without changing the octave band reading.
For certain test conditions, this standard uses a duct end reflection correction factor that is frequency dependent. Because of this dependence, analysis in full octave bands instead of one-third octave bands may cause an error of up to ± 2 dB.
Example:Test Conditions: A fan having a 508 mm (20 in.) diameter inlet, no orifice plate, and low airflow.
There is a significant difference between the two methods of determining the octave band values. This difference is a function of two things:
1) The shape of the sound spectrum determined by one-third octave band analysis, and 2) The slope of the duct end reflection attenuation curve at the point where the attenuation value is evaluated.
The error made in using octave band analysis can overestimate or underestimate the real values. Therefore, the use of one-third octave band analysis is recommended. Refer to Figure C1.
If full octave band analysis is performed, a precaution would be to adjust the fan rotational speed to caused the blade passage frequency to fall in the central one-third octave band of any full octave band. Care should also be taken to keep the blade passage frequency from falling on the border between bands, thus avoiding the problems associated with the characteristics of filter skirts.
Table C6 - Example using full octave band analysis
1/3 Octave Center
Frequency, (Hz)
LpMeasured
Combined +E = (Lp+E)dB
506380
806564
80.2 +10.2 =90.4

AMCA 300-05
26
Table C7 - Example using one-third octave band analysis
1/3 Octave Center
Frequency, (Hz)
LpMeasured
Combined +E =(Lp+E)dB
506380
806564
+12.1+10.2+8.3
=92.1=75.2=72.3
=92.2
C.10 Accuracy of the 63 Hz octave band
At low frequencies, the sound power output of a source depends upon its position in the test room. At low frequencies, very few modes are excited, and because of reflections from test room surfaces, the reflected pressure at the source combines with the direct sound pressure field produced by the source. This affects the radiation impedance seen by the source, and therefore its sound power output. This is particularly true of the 63 Hz octave band. Most standards do not discuss this band, although it is important to fan manufacturers and users alike. Measurements in this band must be reported. However, the measured sound pressure values, and therefore the determined sound power level values, have an uncertainty of ± 6 dB at best.
NO ERROR
OCTAVEBAND
OCTAVEBAND
OCTAVEBAND
OVER ESTIMATION UNDER ESTIMATION
Figure C1 - Effect of summing one-third octave bands
AMCA 300-05
27
Annex D (informative)
Alternative procedure for reference sound source calibration
D.1 General
Calibration of a Reference Sound Source (RSS) in conformance with the requirements of ANSI S12.5 requires a hemi-anechoic room qualified for measurements over the entire frequency range of interest. Laboratories that otherwise would be able to perform the required calibration but which are not qualified for measurements in the first octave band may use the alternative procedure of this Annex. This alternative procedure is based on sound intensity measurements per ANSI S12.12.
D.2 Equipment and facilities
Equipment and facilities shall be as required for RSS calibration in conformance with ANSI S 12.5, with the exception that the hemi-anechoic chamber need not be qualified below the 125Hz full octave band (100 Hz one-third octave band). Sound intensity measuring equipment shall comply with the requirements of ANSI S 12.12.
Additional RSS units may be sound power level calibrated by comparing the sound power levels of the source to another unit that was calibrated in accordance with Sections D.1 through D.5. It is not necessary that each and every reference sound source be calibrated directly in accordance with the procedures described below. It may be possible to transfer a calibration from one unit to another by using a simpler type of test. For example, the Substitution Method of the present standard might be used to calibrate (secondary calibration) one reference sound source relative to another, similar, reference sound source that has been calibrated as described below (primary calibration). In order that such a secondary calibration does not result in an unacceptable degradation of accuracy, it normally will be necessary to use more source locations and microphone positions than the minimum requirements of the present standard and to exercise additional caution in carrying out the measurements.
D.3 Qualification
The RSS calibration procedure of ANSI S12.5 shall be carried out over the 50 Hz through 10,000 Hz one-third octave band frequency range and 63 Hz through 8000 Hz full octave band frequency range. If the calibration is in conformance with ANSI S12.5 in all respects except for the qualification of the test facility below the 100 Hz one-third octave band, the alternative calibration procedure below may be used. If the calibration is not in complete conformance with ANSI S12.5 for any other reason, the alternative calibration procedure is not applicable.
D.4 Procedure
The requirements of ANSI S12.5 are duplicated in the lowest three full octave (nine one-third octave) bands, with the substitution of sound intensity level measurements, made in compliance with ANSI S12.12, for the sound pressure level measurements required by ANSI S12.5. For all measurements, sound intensity shall be measured in the outward radial direction. The sound power levels determined from these measurements shall be compared with those determined from the corresponding sound pressure level measurements. If in all frequency bands the determined sound power levels differ by no more than the tolerances given in Table D1, the calibrated sound power levels for the RSS are reported as specified in Section D.5. The directivity index is not calculated from the intensity measurements.

AMCA 300-05
28
Table D1 - Tolerance for measured sound power level difference
Octave Band (Hz)
One-thirdOctave
Band (Hz)
Tolerance(dB)
63125-250
50-80100-315
±4.0±1.0
D.5 RSS sound power levels
The reported RSS sound power levels and directivity index shall be as determined by the ANSI S12.5 procedure for the 100 Hz through 10,000 Hz one-third octave bands and the 125 Hz through 8,000 Hz full octave bands. For the 50 Hz through 80 Hz one-third octave bands and the 63 Hz full octave band, the reported RSS sound power level(s) shall be as determined from the sound intensity measurements, and the directivity index is not to be reported. The calibration report shall be marked to indicate the levels determined from sound intensity measurements, and shall indicate whether the calibration was performed in full compliance with this Annex.

AMCA 300-05
29
Annex E (normative)
Duct end reflection correction
E.1 General
Conditions at the end of a test duct will prevent some of the sound energy from being transmitted into the test room. Therefore, the sound power measured in the room will be less than the true sound power in a duct. Unless an anechoic termination is used, correction factors must be added to the fan sound pressure measured in the test room in order to account for the reduction caused by end reflection.
The prediction of the duct end reflection is difficult. Theoretical solutions exist only for round ducts with highly idealized end conditions and are based on the assumption that the frequency is low enough that only plane waves exist (which implies that ka< ). Actual fan test setups rarely, if ever, conform to the conditions under which the theoretical solutions are valid. Using the methods suggested in this Annex will result in predicted values that are reasonably close to the actual values. Nonetheless, the test setup should be selected to minimize the potential error by using components that most closely reproduce the theoretical conditions.
For open ducts (i.e., no orifice) theoretical solutions exist for two cases: a thin-walled round duct terminating in an infinite space [On the Radiation of Sound from an Unflanged Circular Pipe, Levine, H., and Schwinger, J. – Physical Review, Vol. 72, No. 4, February 15, 1948] and a round duct terminating in an infinite wall [Fundamentals of Acoustics, 3RD Edition, Kinsler, Frey, Coppens and Sanders, Wiley, New York, 1982 , equations 9.13 and 9.14]. Most test setups incorporate terminations that use a flanged duct terminating in a large space, which would make the solution provided by Levine & Schwinger more appropriate, assuming no orifice is used.
For ducts with orifices, no theoretical solution exists for the case of a duct terminated in infinite space. For the flush-mounted duct (duct terminated in an infinite wall) the effect of an orifice plate with a round, centrally located hole can be calculated [Acoustics, Beranek, L., McGraw-Hill, New York, 1950, Section 5.2].
For most test setups, when the test is conducted using an orifice on the tested end, there is no theory to predict the end correction values.
E.2 End reflection curves
It is strongly recommended that, whenever possible, sound test setups be chosen so that there is no requirement to apply duct end correction. In the event that circumstances require a setup indicating the presence of a duct end correction there are four cases to be considered. The four cases are considered separately below.
E.2.1 Open ducts in a large space
To determine the end reflection values, it is necessary to first calculate the reflection coefficient R, which gives the fraction of the energy reflected back into the duct. Levine and Schwinger reduced the exact solutions to manageable forms, one for ka<1 and one for ka>1. Note: k = /c = 2 / , a = D/2, and
= 2 f.
The two equations are:

AMCA 300-05
30
Rka ka
kakaexp log
2 4
1021
61 19
12 for < 1 Eq. E-1
R ka kaka
kaexp( ) 1 332
12 for > 1 Eq. E-2
The ratio between the transmitted sound and the reflected sound is = 1 - R 2 and thus the end correction (in dB) is E 10 log10 . These equations shall be used to calculate E as a function of ka(0.5kD). The resulting curve is shown for illustrative purposes in Figure E1 (r=1). Values are presented up to ka = 4, even though the equations are strictly limited to ka < 3.832.
r=5
r=2
r=1
Figure E1 - End correction for open ducts in large space

AMCA 300-05
31
E.2.2 Open ducts terminated in a wall
For the case of a round duct terminated at a large wall, the end correction can be determined using equations 9.13 and 9.14 from Kinsler, Frey, Coppens and Sanders with the impedence calculated using equations 5.1, 5.2 and 5.3 from Beranek. It should be noted that there is no transition at the wall-duct interface. The equations to be used to calculate E as a function of ka are given below.
ZM a cJ ka
kaj c
kK ka2 1 1 2
2 2 1 2( )
Eq. E-3
J W W W W W1
3
2
5
2 2
7
2 2 22 2 4 2 4 6 2 4 6 8 Eq. E-4
K W W W W1
3 5
2
7
2 22
3 3 5 3 5 7 Eq. E-5
R BA
Z a c
Z a c
M
M
2
2
1
1 Eq. E-6
1 2R Eq. E-7
E 10 10log Eq. E-8
The series for the Bessel functions J1 and K1 converge rapidly (at least for values of ka < 3.6), so the computation of E vs. ka is straightforward. The resulting curve for illustrative purposes is shown in Figure E2 (r=1). As before, values are shown up to ka = 4, but for ka >3.6, the value of is defined to be 1.
E.2.3 Orificed ducts terminated in a large wall
If a round duct terminating into a large wall is fitted with an orifice plate with a centrally located round hole, the equations in Section E.2.2 may be easily modified to predict the end reflection. Continuing with the assumption of plane wave propagation, the end reflection may be calculated by calculating R using kabased on the orifice radius, and calculating the transmission coefficient by assuming that the orifice reduces the transmission coefficient by a factor of 1/r, where r is the ratio of duct area to orifice area. End reflection values for r = 2 and r = 5 are shown for illustrative purposes in Figure E2.
The curves in Figure E2 are drawn to ka = 4, even though their range of applicability may be limited to much lower values. For the open duct (r = 1) the end reflection is clearly seen to be zero for all values of ka > 3 since the failure to meet the plane wave criteria is not critical. For the orificed cases, the end correction values for ka>1 are questionable due to the failure to meet the plane wave criteria, and are very suspect for ka > ( r)0.5 since for these values of ka the wave length is smaller than the orifice diameter.
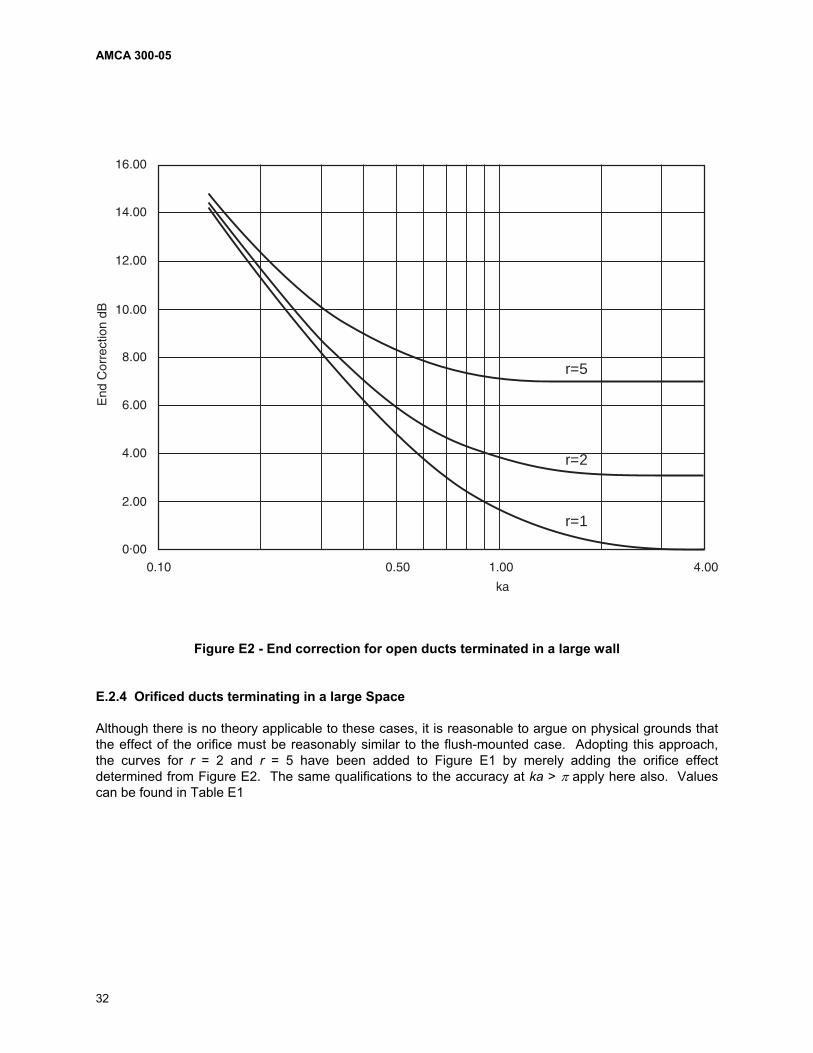
AMCA 300-05
32
r=5
r=2
r=1
Figure E2 - End correction for open ducts terminated in a large wall
E.2.4 Orificed ducts terminating in a large Space
Although there is no theory applicable to these cases, it is reasonable to argue on physical grounds that the effect of the orifice must be reasonably similar to the flush-mounted case. Adopting this approach, the curves for r = 2 and r = 5 have been added to Figure E1 by merely adding the orifice effect determined from Figure E2. The same qualifications to the accuracy at ka > apply here also. Values can be found in Table E1
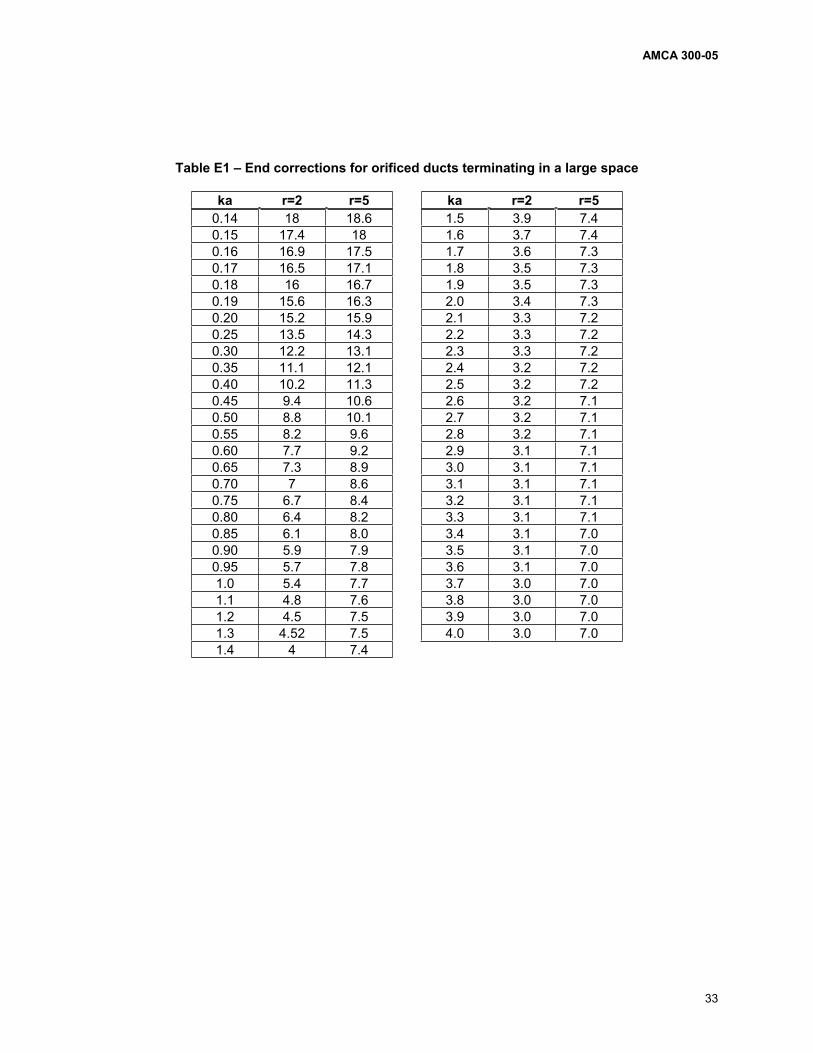
AMCA 300-05
33
Table E1 – End corrections for orificed ducts terminating in a large space
ka r=2 r=5 ka r=2 r=5 0.14 18 18.6 1.5 3.9 7.4 0.15 17.4 18 1.6 3.7 7.4 0.16 16.9 17.5 1.7 3.6 7.3 0.17 16.5 17.1 1.8 3.5 7.3 0.18 16 16.7 1.9 3.5 7.3 0.19 15.6 16.3 2.0 3.4 7.3 0.20 15.2 15.9 2.1 3.3 7.2 0.25 13.5 14.3 2.2 3.3 7.2 0.30 12.2 13.1 2.3 3.3 7.2 0.35 11.1 12.1 2.4 3.2 7.2 0.40 10.2 11.3 2.5 3.2 7.2 0.45 9.4 10.6 2.6 3.2 7.1 0.50 8.8 10.1 2.7 3.2 7.1 0.55 8.2 9.6 2.8 3.2 7.1 0.60 7.7 9.2 2.9 3.1 7.1 0.65 7.3 8.9 3.0 3.1 7.1 0.70 7 8.6 3.1 3.1 7.1 0.75 6.7 8.4 3.2 3.1 7.1 0.80 6.4 8.2 3.3 3.1 7.1 0.85 6.1 8.0 3.4 3.1 7.0 0.90 5.9 7.9 3.5 3.1 7.0 0.95 5.7 7.8 3.6 3.1 7.0 1.0 5.4 7.7 3.7 3.0 7.0 1.1 4.8 7.6 3.8 3.0 7.0 1.2 4.5 7.5 3.9 3.0 7.0 1.3 4.52 7.5 4.0 3.0 7.0 1.4 4 7.4

AMCA 300-05
34
Annex F (informative)
Filter-weighted measurements
In certain sound measurement situations, the presence of high amplitude sound at frequencies 45 Hz can reduce the effective dynamic range of the analyzer in the measurement frequency range of interest for this standard (45 Hz to 11,200 Hz). While use of an analyzer with a large dynamic measurement range can solve this problem, it may sometimes be necessary to use another approach.
Sound pressure level readings may be made with the sound level meter or signal amplifier set for a well-defined filter weighting effect in order to improve the dynamic range and measurement quality, provided that any effect in the frequency range 45 Hz to 11,200 Hz is compensated and the equipment satisfies all the requirements of Section 4 of this standard. The weighting filter shall be the same for all measurements (background, RSS, and fan).

AMCA 300-05
35
Annex G (informative)
Radiation of sound by fan casing
G.1 General
The sound radiated by a fan casing may be determined by the following method. Except as provided for below, all the requirements of this standard apply.
G.2 Instruments and equipment
Shall be as required in Section 4.
G.3 Setup and test
The fan inlet and fan outlet shall be ducted to termination points outside the test room. Ducts and connections should be constructed and secured such that the acoustic energy radiated through this equipment is no more than 10% of the total energy radiated by the fan casing into the test room. The test room sound pressure levels may be affected by sound radiating from the inlet and discharge ductwork connected to the test subject, causing measured sound pressure levels to be somewhat higher than the true casing radiated sound pressure levels. This effect can be minimized by using internally lined round ductwork. No correction for duct-radiated sound power is allowed. NOTE: If there is any doubt concerning the contribution of extraneous sound transmitted by ductwork, the importance of same can be checked by increasing the transmission loss of the ductwork.
G.4 Observations and calculations
Sound pressure levels Lpq and Lpk shall be observed as provided for in Section 6. The sound pressure levels Lpq and Lpk are observed and subject to the provisions for Lp in Section 6. For possible pure tones and additional testing, the results of the test of a fan casing are subject to the same requirements as the test of a fan.
LWk = Lpk + (LWr - Lpq ) in each frequency band (G.4-1)
Where:
LWk = sound power radiated through the fan casing, Lpk = fan casing sound pressure level.
AMCA 300-05
36
Annex H (informative)
Total fan sound testing with attached ducts
It is intended that the fan sound power levels determined by this standard reflect the sound produced at a known fan operating point. The length of test ducts used to determine sound power would, therefore, be identical to the duct length defined an ANSI/AMCA 210. It has been determined that shorter duct lengths are also acceptable and may be used. Care must be taken to ensure that for the actual duct lengths used, no duct resonances exist in close proximity to specific frequencies of interest, e.g., the blade passage frequency.
Although it is recognized that the inlet and outlet sound power levels of a fan are generally not equal, it is necessary to make some assumptions about the relationship between these levels to apply duct end reflection correction. The equations in Figure H1 are based upon the assumption that the inlet and outlet sound power levels of a fan are equal.

AMCA 300-05
37
FAN
FAN
FANOPTIONALORIFICE
B: FREE INLET DUCTED OUTLET
C: DUCTED INLET FREE OUTLET
D: DUCTED INLET DUCTED OUTLET
Installation Type LW Equations
B: Free Inlet, LW = Lp + (LWr – Lpq) + [3 – 10 log10 (1 + 10(Eo/10))] + Eo Ducted Outlet
C: Ducted Inlet, LW = Lp + (LWr – Lpq) + [3 – 10 log10 (1 + 10(Ei/10))] + Ei Free Outlet
D: Ducted Inlet, LW = Lp + (LWr – Lpq) + Ei + Eo + [3 – [10 log10 (10(Eo/10) + 10(Ei/10))]] Ducted Outlet
This test procedure and the above calculations are based on the following:
1. Directivity from the fan is averaged by the reverberant test room and the microphone location is such that it is sensing total averaged sound pressure levels.
2. Duct construction is such that the transmission loss through the duct wall is large enough to eliminate any addition to the measured sound pressure levels.
3. No resonances are present on either the fan structure, supporting devices or driving devices that provide any significant pure tones that may add to the measured sound pressure levels.
4. The factor of 3 in the above equations is based on the assumption that fan sound power is equally distributed between inlet and outlet.
Figure H1 - Fan total sound testing with ducts attached

AMCA 300-05
38
Annex J (informative)
References
[1] AMCA Standard 300-67 Test Code for Sound Rating, Air Movement and Control Association International, Inc., Arlington Heights, IL, 1967.
[2] AMCA Standard 301-90 Methods for Calculating Fan Sound Power Levels from Laboratory Test Data, Air Movement and Control Association International, Inc., Arlington Heights, IL, 1990.
[3] Harris, C.M., Editor, Handbook of Noise Control, 2nd Edition, McGraw-Hill, New York, NY, 1979
[4] Parker, S.P., Dictionary of Scientific and Engineering Terms, 4th Edition, McGraw-Hill, New York, NY, 1989
[5] ANSI S1.6-1984 (R1990) Preferred Frequencies, Frequency Levels and Band Numbers for Acoustical Measurements, Acoustical Society of America, New York, NY, 1990 (AMCA #1108-84-AO)
[6] Sepmeyer, L.W., Computed Frequency and Angular Distribution of the Normal Modes of Vibration in Rectangular Rooms, Journal of the Acoustical Society of America, New York, NY, Vol. 37 – No. 3, March, 1985 (AMCA #1891-65-AO)
[7] AMCA #1901-85-A1 List of References on Room Calibration, Air Movement and Control Association International, Inc., Arlington Heights, IL, 1985.
[8] Crocker, M. J., w/ Pande, L. and Sandbakken, R., Investigation of End Reflection Coefficient Accuracy Problems with AMCA 300-67, Herrick Laboratories Report HL 81-16, Purdue University, West Lafayette, IN, 1981. (AMCA #1184-81-A6)
[9] Noise Control Engineering, Vol. 7, No. 2, Noise Measurement Facilities, and ANSI S1.21-1972, Methods for the Determination of Sound Power Levels of Small Sources in Reverberant Rooms.
[10] ANSI S12.11-1987 (R1993) Methods for the Measurement of Noise Emitted by Small Air Moving Devices, Acoustical Society of America, New York, NY, 1993.
[11] Baade, P.K., 1977, Effects of acoustic loading on axial flow fan noise generation, Noise Control Engineering, 8(1):5-15
[12] ANSI S12.51-2002 Nationally Adopted International Standard (NAIS Standard), Acoustics – Determination of sound power levels of noise sources using sound pressure – Precision method for reverberation rooms, Acoustical Society of America, New York, NY, 1993.

AIR MOVEMENT AND CONTROLASSOCIATION INTERNATIONAL, INC.
30 West University DriveArlington Heights, IL 60004-1893 U.S.A.
E-Mail : [email protected] Web: www.amca.orgTel: (847) 394-0150 Fax: (847) 253-0088
The Air Movement and control Association International, Inc. is a not-for-profit international association of the world’s manufacturers of related air system equipment primarily, but limited to: fans, louvers, dampers, air curtains, airflow measurement stations, acoustic attenuators, and other air system components for the industrial, commercial and residential markets.


